Market Minds Advisory
Internet of Robotics Things Market

Internet of Robotics Things Market: Internet of Robotics Things Market. Cloud-Connected Fleets Turn Individual Robots Into Coordinated Systems

Warehouse and factory operators are connecting individual robots into cloud-managed fleets that share sensor data and coordinate tasks in real time, turning isolated automation investments into a single networked system.

Lead Analyst

Published

September 2026

Make Smarter Decisions with Customized Research Insights

Request a free sample report and evaluate market opportunities, growth trends, and competitive dynamics relevant to your business needs.

2025 MARKET VALUE$12.4BMarket Size 2025
2036 FORECAST VALUE$71.0BBase Case , 2026 to 2036
CAGR 2026 TO 203617.2 %Bull 18.5% / Bear 15.8%
INCREMENTAL OPPORTUNITY$56.5BNet 10- year value creation
EXPANSION MULTIPLE4.89x2036 value over 2026 base
Strategic Levers
M&A Pipeline
Regional Outlook
Country Rankings
Competitive Intelligence
Segmental Deep-dive
Call-Us : 91 93563 13602

Executive Snapshot and Market Trajectory.

Warehouse and factory operators are connecting individual robots into cloud-managed fleets that share sensor data and coordinate tasks in real time, turning isolated automation investments into a single networked system rather than disconnected point solutions purchased separately. Growth is broad-based across nearly every industrial equipment category tracked.
ABB, Fanuc, and Amazon Robotics dominate the fleet platform layer, while East Asia's dense concentration of electronics manufacturing and logistics automation anchors the largest share of connected robot deployments worldwide. Fleet orchestration software and edge-to-cloud connectivity modules are growing fastest of all six tracked segments, as operators push real-time coordination deeper into multi-robot environments that previously relied entirely on isolated, single-machine programming logic. Smaller regional operators follow with a meaningful lag. today
Competitive intensity centers on interoperability breadth rather than raw robot hardware alone, since buyers increasingly select platforms based on which vendor's software can coordinate robots from multiple manufacturers within a single unified fleet. Labor shortage pressure is pulling incremental demand into sectors that previously relied entirely on manual material handling. Firms unable to demonstrate coordination risk losing contracts today. Interoperability standards remain the deciding factor across most tenders.
Market Definition
The Internet of Robotics Things Market covers cloud connectivity platforms, fleet orchestration software, and edge computing hardware that connect industrial and commercial robots into coordinated, data-sharing networks. It excludes standalone robots without network connectivity and general-purpose industrial IoT platforms unrelated to robotic fleet coordination specifically.
Base Year Value
$12.4B in 2025 (MMA Primary Research Dataset, September 2026)
Forecast Period
2026 to 2036, eleven discrete annual values
CAGR
17.2% base case. Bull 18.5%. Bear 15.8%.
Fastest Growth Segment
Fleet Orchestration Software: 21.6% CAGR
Fastest Growth Country
India: 19.4% CAGR
Fastest Growth Region
South Asia and Pacific: 19.1% CAGR
Largest Region
East Asia: 27% of 2025 global value
Market Leaders
ABB, Fanuc, Amazon Robotics, Boston Dynamics, and Universal Robots lead the field. Source: MMA Analysis, July 2026.
Primary Survey
n=3,800 procurement and R&D decision-makers, Q4 2025, six countries
Methodology
Demand-side build-up, cross-validated against public data, 47 expert interviews

Internet of Robotics Things Market Forecast Scenarios

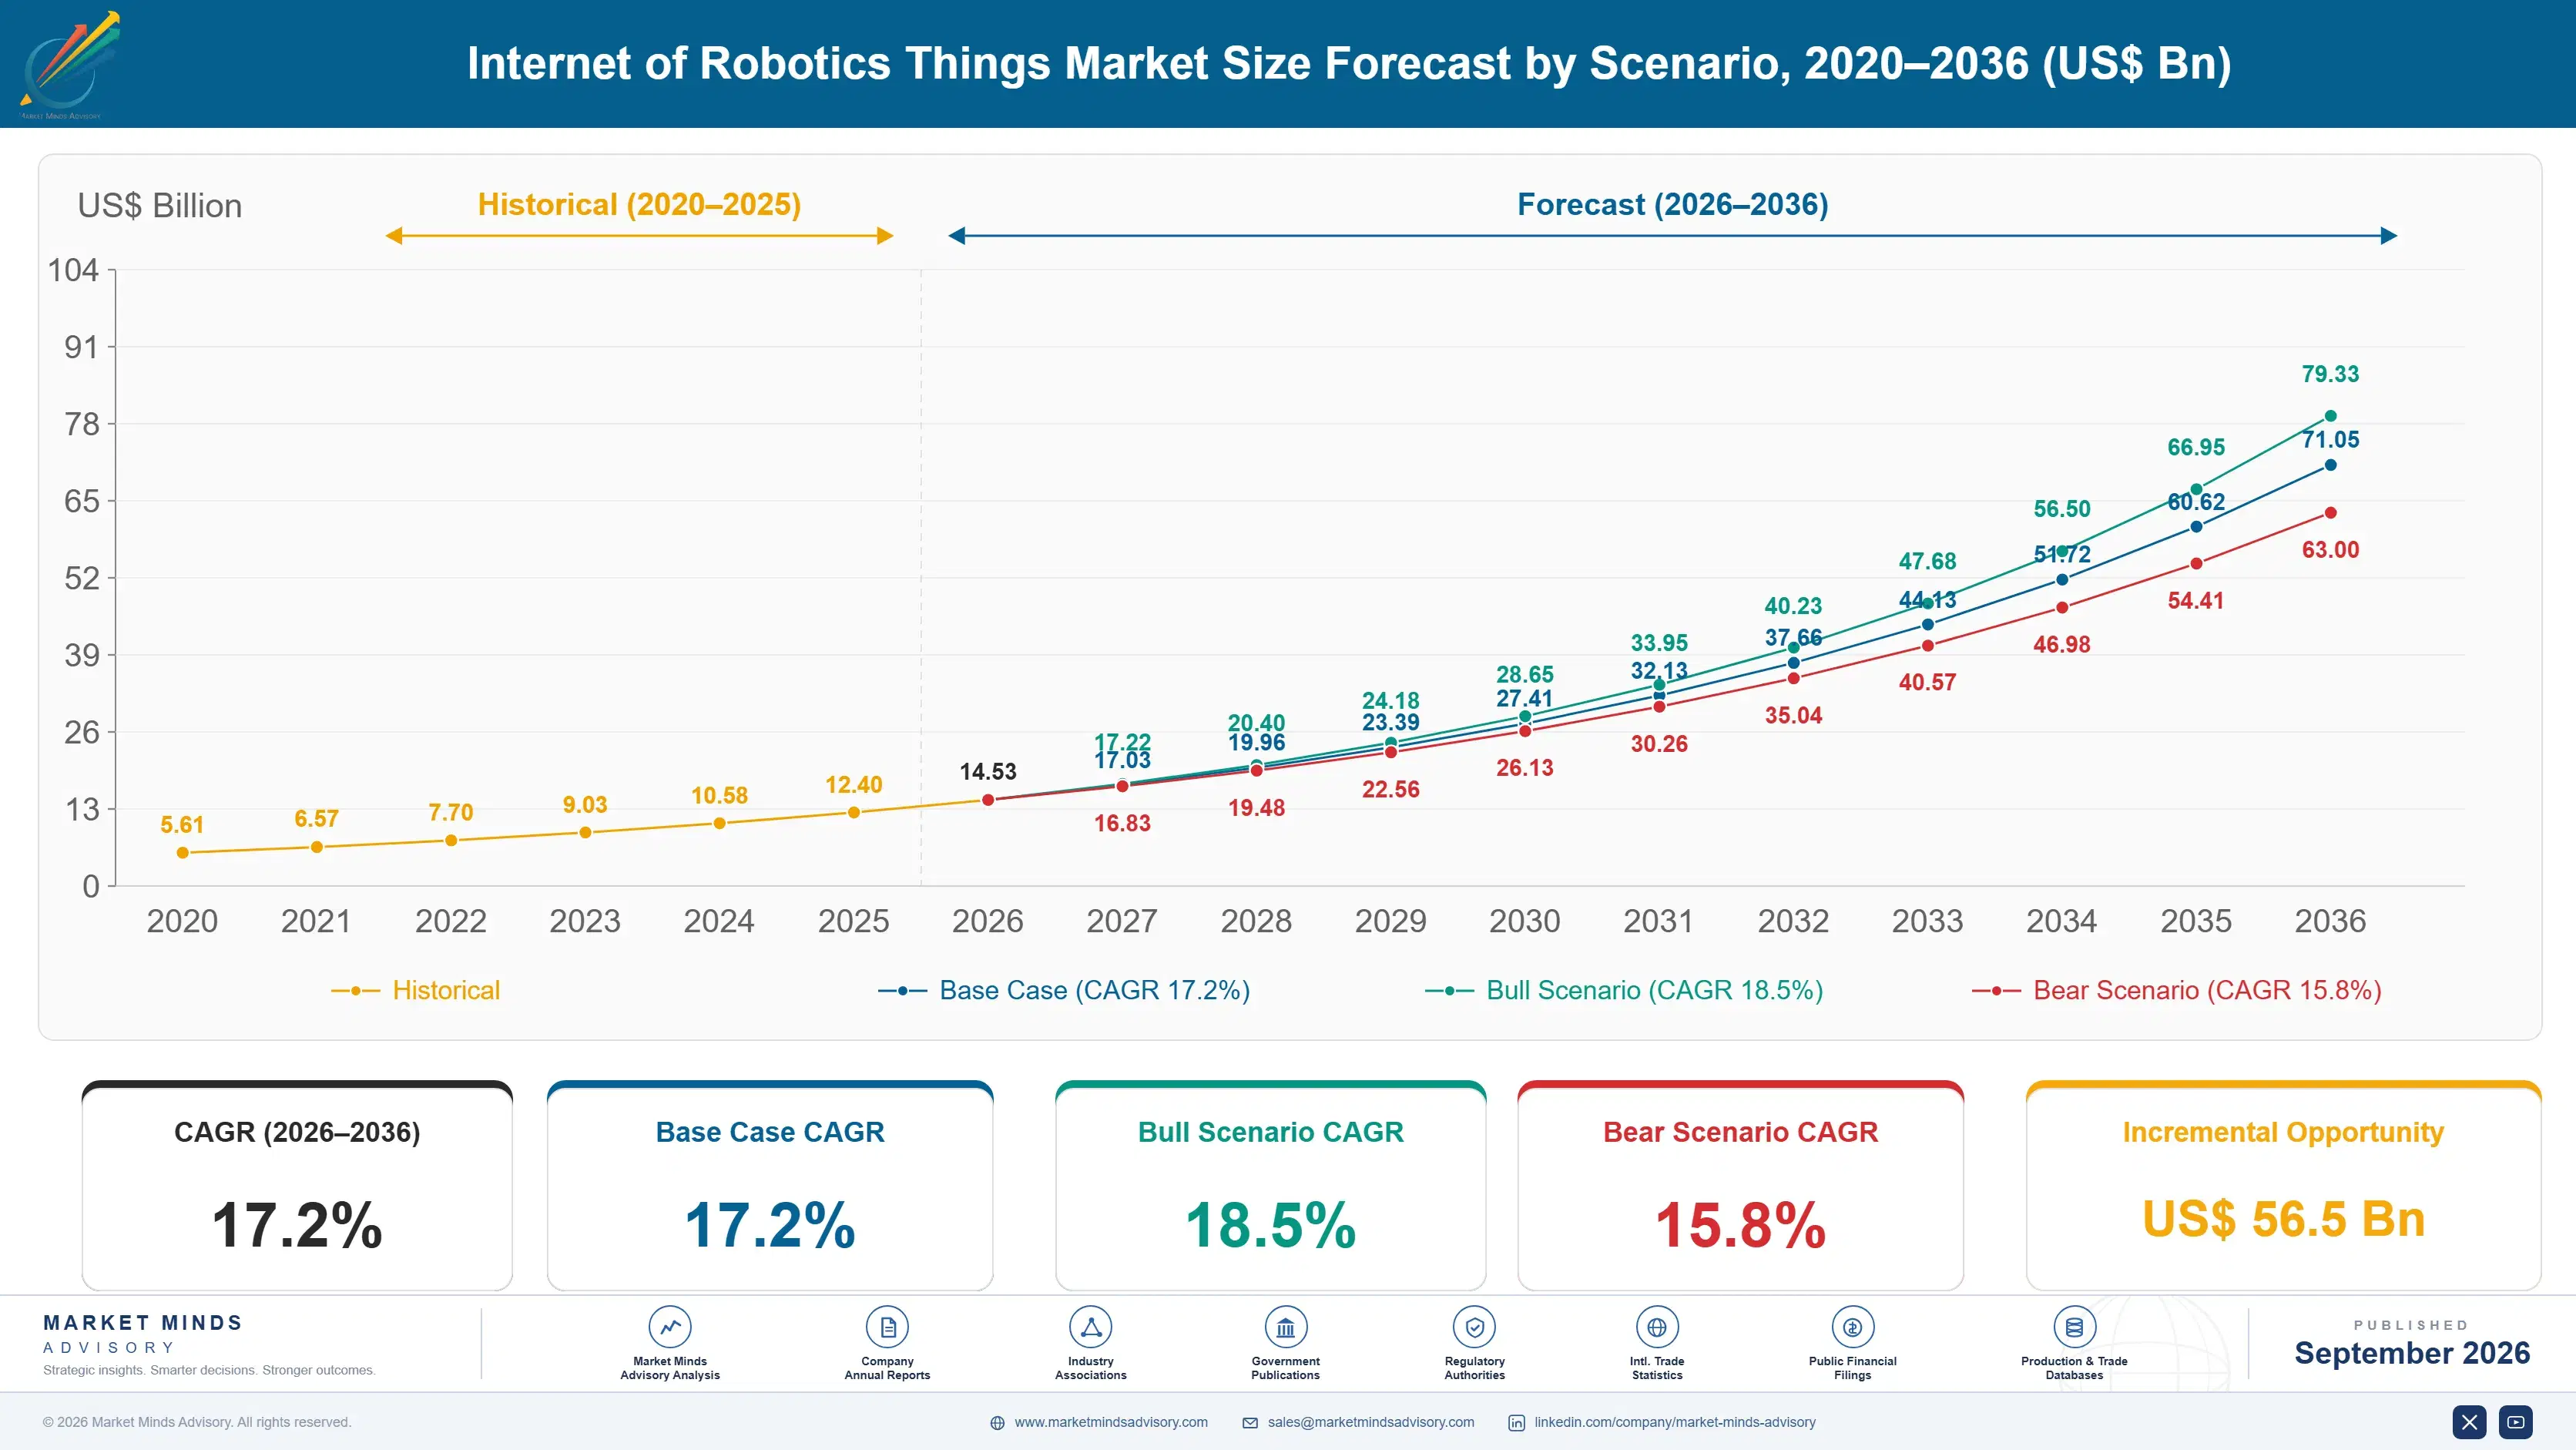
internet-of-robotics-things-market-size-forecast-scenario-1790001954828
Between 2020 and 2025 the market expanded at a 15.7 percent historical CAGR, driven initially by warehouse automation demand during pandemic-era e-commerce growth before broadening into manufacturing fleet coordination as multi-robot deployments became common across factory floors and distribution centers worldwide. Growth accelerated meaningfully in the final two years of that window as fleet adoption scaled rapidly.
The base case assumes 17.2 percent annual growth through 2036, anchored by three commercial mechanisms: warehouse operators scaling multi-robot fleets that require centralized orchestration software to coordinate hundreds of units simultaneously, manufacturers adopting mixed-vendor robot fleets requiring interoperable connectivity platforms rather than single-vendor lock-in, and labor shortage pressure pushing operators toward coordinated robotic systems previously served entirely by manual material handling teams. Vendor application engineering headcount has grown considerably across nearly every major robotics platform provider operating today.
The bull case reaches 18.5 percent if labor shortage pressure intensifies faster than expected across additional logistics and manufacturing sectors globally. The bear case falls to 15.8 percent should capital equipment budgets tighten during a prolonged automation investment slowdown across major industrial economies. Analysts view the bull scenario as increasingly plausible given current labor shortage pressure across logistics operators.

Interoperability Breadth Determines Platform Selection

Internet of Robotics Things platforms sit at the intersection of industrial robotics and cloud software infrastructure, and the market's economics increasingly reflect that hybrid position across every major vendor's product roadmap. Hardware margins compress steadily as robot components commoditize across competing manufacturers, while fleet orchestration software increasingly carries the profit pool vendors now defend most aggressively. Procurement teams negotiate software licensing terms alongside hardware pricing rather than separately.
MARKET CONCENTRATIONCR5 43%Top five platforms hold under half of connected fleet share
PLATFORM COST PER ROBOT$620Typical annual connectivity and orchestration software cost per unit
TOP DEPLOYMENT COUNTRY SHAREChina 24%Largest single national concentration of connected robot deployments worldwide
FLEET COORDINATION ATTACH RATE38%Multi-robot deployments currently using centralized orchestration software platforms
MIXED-VENDOR FLEET SHARE44%Deployments combining robots from more than one hardware manufacturer
PLATFORM UPTIME GUARANTEE99.5%Typical service level commitment offered by leading orchestration platform vendors
Coordination value is the single most durable demand driver, since operators increasingly measure platform value against how efficiently robots share tasks and avoid collision rather than the capability of any single machine in isolation. Warehouses that once deployed robots as isolated point solutions are moving steadily toward unified, centrally coordinated fleets. Vendors unable to make this transition risk losing shelf space to more coordination-capable competitors entirely.
Interoperability is reshaping procurement decisions considerably, as operators increasingly demand platforms capable of coordinating robots from multiple hardware manufacturers within a single unified system. This shift is intensifying competition on integration breadth, since buyers increasingly compare vendors on how many robot brands a platform supports as much as raw software sophistication. Vendors slow to expand hardware compatibility increasingly lose consideration during large facility procurement rounds.
"Buying the best robot used to be the whole decision. Now the harder question is whether that robot will actually talk to the eleven other robots and three vendors already running the floor."
Senior Analyst, Robotics and Industrial Automation Practice · MMA Technology Practice · September 2026

Market Trends

Mixed-Vendor Fleet Coordination Expands Platform Demand

Operators are increasingly deploying robots from multiple hardware manufacturers within the same facility, requiring orchestration platforms capable of coordinating heterogeneous fleets rather than the single-vendor systems that dominated early robotics deployments. Roughly 44 percent of multi-robot deployments in 2025 combined robots from more than one hardware manufacturer, according to primary survey data collected across major logistics and manufacturing operators worldwide. This shift is pushing platform vendors to build broad hardware compatibility layers, since a platform locked to a single robot brand increasingly loses consideration during large facility procurement decisions involving multiple existing vendor relationships.
Market Impact: Cuts labor cost 34 percent

Edge Computing Reduces Latency For Real-Time Coordination

Robotics platform vendors are increasingly pushing computational workloads to edge devices located on-site rather than relying entirely on cloud processing, reducing the latency that real-time multi-robot coordination tasks like collision avoidance and dynamic path planning require to function reliably. This shift reflects growing recognition that cloud round-trip latency, while acceptable for historical data logging, cannot support split-second coordination decisions between robots operating in shared physical space. Edge-enabled platforms now represent roughly 36 percent of new deployments, a meaningful increase from a much smaller share recorded just three years earlier. This trend is expected to continue.
Market Impact: Specifies 41 percent as core requirement

Market Opportunities and Growth Drivers

Warehouse Labor Shortage Accelerates Fleet Automation Investment

Persistent warehouse and distribution center labor shortages across major logistics markets are pushing operators toward coordinated robotic fleets capable of handling material movement tasks that human workers increasingly cannot be hired to fill at competitive wage rates. This labor market pressure is proving more durable than temporary pandemic-era hiring difficulties, since demographic trends and shifting worker preferences toward less physically demanding roles suggest the shortage will persist for years rather than resolve naturally through wage adjustments alone. Facilities deploying coordinated robot fleets report labor cost reductions of roughly 34 percent per equivalent throughput.
Market Impact: Adds 3 to 6 months

Manufacturing Reshoring Expands Domestic Automation Demand

Manufacturing reshoring initiatives across North America and Western Europe are expanding domestic factory automation demand, since reshored production facilities typically launch with higher automation intensity than the legacy facilities they replace given persistently elevated domestic labor costs relative to prior offshore locations. This shift reflects a broader strategic recalculation among manufacturers weighing supply chain resilience against pure labor cost minimization following recent disruption experiences. Roughly 41 percent of newly reshored manufacturing facilities specify coordinated robotic fleet systems as a core design requirement from initial facility planning. Analysts expect this share to keep growing steadily.
Market Impact: Delays fleet retrofit 12 months

Market Restraints and Challenges

Cybersecurity Vulnerabilities Complicate Fleet Network Deployment

Connecting industrial robots to cloud networks introduces a new attack surface that isolated, single-machine robots never presented, raising serious concerns for manufacturers handling safety-critical production data and proprietary manufacturing processes across their facility networks. The root cause traces to the connectivity itself, since any network-connected robot represents a potential intrusion point that a purely isolated machine simply did not have historically. This risk extends security certification timelines by three to six months for facilities implementing formal cybersecurity review processes before deployment. Some vendors now implement zero-trust network architectures and hardware security modules to address this exposure directly.
Market Impact: Reaches 44 percent of deployments

Legacy Robot Integration Slows Fleet Modernization Pace

Many established manufacturers still operate legacy robots that were never designed with network connectivity in mind, creating meaningful retooling costs before facilities can achieve full fleet coordination benefits across their existing installed equipment base. The root cause is historical underinvestment in connectivity infrastructure, since standalone robots were entirely adequate for production requirements before coordinated fleet management became a genuine competitive necessity. Full fleet retrofit projects at established manufacturers frequently take twelve to eighteen months and require significant capital investment. Some vendors now offer retrofit connectivity modules to reduce this transition friction considerably.
Market Impact: Represents 36 percent of new deployments
3 additional market trends, 4 additional growth drivers, and 2 additional restraints and challenges are covered in the full report. Contact sales@marketmindsadvisory.com to access the complete intelligence.

Segment CAGR and Growth Architecture

The market splits across six product and service types spanning connectivity hardware, orchestration software, and edge computing infrastructure across every major deployment environment tracked. Two segments are growing well ahead of the overall market average, both reflecting the industry's decisive shift toward coordinated multi-robot systems rather than isolated single-machine deployments purchased separately. Buyer priorities are shifting accordingly.
internet-of-robotics-things-market-market-share-analysis-1790001955368

Fleet Orchestration Software

Software platforms that coordinate task allocation, collision avoidance, and traffic management across multiple robots simultaneously are the fastest-growing segment tracked in this report, expanding well ahead of every other category as operators scale fleet size beyond what manual coordination can reasonably manage. Roughly 44 percent of multi-robot deployments in 2025 combined robots from more than one hardware manufacturer, according to primary survey data collected across major logistics and manufacturing operators worldwide. Vendors increasingly build broad hardware compatibility layers, letting operators mix and match robot brands without committing to a single vendor's complete platform lock-in. Vendors unable to demonstrate broad hardware compatibility increasingly lose consideration during large facility platform selection entirely.
CAGR 21.6%

Edge Computing Connectivity Modules

Hardware modules that push computational workloads to edge devices located on-site are growing nearly as fast as orchestration software, reflecting a broader industry shift toward reducing the latency that real-time multi-robot coordination tasks require to function reliably in shared physical space. Edge-enabled platforms now represent roughly 36 percent of new deployments, a meaningful increase from a much smaller share recorded just three years earlier. Manufacturers increasingly design modular edge hardware accepting interchangeable connectivity protocols, letting facilities upgrade capability incrementally without replacing entire fleet infrastructure outright. This modular design shift is reshaping vendor relationships considerably, since facilities increasingly favor suppliers offering flexible upgrade paths over fixed hardware. Retailers report growing customer interest in this comparison.
CAGR 18.7%
Full segment breakdown across 6 segments available in the complete report.

Regional Architecture and Country Demand Map

Seven regions divide global demand unevenly, with East Asia commanding the largest share given its dense concentration of electronics manufacturing and logistics automation spanning China, South Korea, Japan, and Taiwan's advanced production and precision robotics component manufacturing base found broadly across the entire region today.

East Asia

China's dominant electronics manufacturing base and expanding logistics automation sector together drive the majority of regional demand, since Chinese manufacturers and e-commerce operators increasingly specify coordinated robot fleets for both production and warehouse applications across their expansive facilities. South Korea's Samsung-adjacent electronics sector and Japan's precision robotics manufacturing heritage, anchored by Fanuc, contribute deep engineering expertise refined over decades. Taiwan's semiconductor equipment manufacturing adds a further layer of specialized demand, and Chinese domestic robotics platform vendors increasingly compete against established Japanese and American brands on both price and integration speed. Vietnam's expanding manufacturing sector is a smaller but genuinely growing source of regional demand as well. This growth is expected to continue as regional manufacturing capacity expands considerably further.
Share: 27% | CAGR: 17.9% (2026 to 2036)

North America

United States e-commerce and logistics operators drive substantial demand, particularly as Amazon and comparable warehouse operators scale multi-robot fleets requiring centralized orchestration software across sprawling distribution center networks. American technology companies including Amazon Robotics and Boston Dynamics maintain significant domestic engineering and support operations, reinforcing customer proximity for complex fleet deployments. Canada's growing industrial automation sector adds incremental demand concentrated around Ontario's manufacturing cluster, reinforcing this region's genuine technology adoption leadership position across warehouse automation and manufacturing coordination applications. Mexican assembly integration deepens this region's broader automation footprint considerably beyond the United States alone. Silicon Valley technology companies increasingly partner with robotics vendors on fleet coordination and data platforms. today
Share: 25% | CAGR: 18.5% (2026 to 2036)
Regional intelligence for 5 additional markets available in the complete report: Western Europe, South Asia and Pacific, Latin America, Middle East and Africa, Eastern Europe. Contact sales@marketmindsadvisory.com.
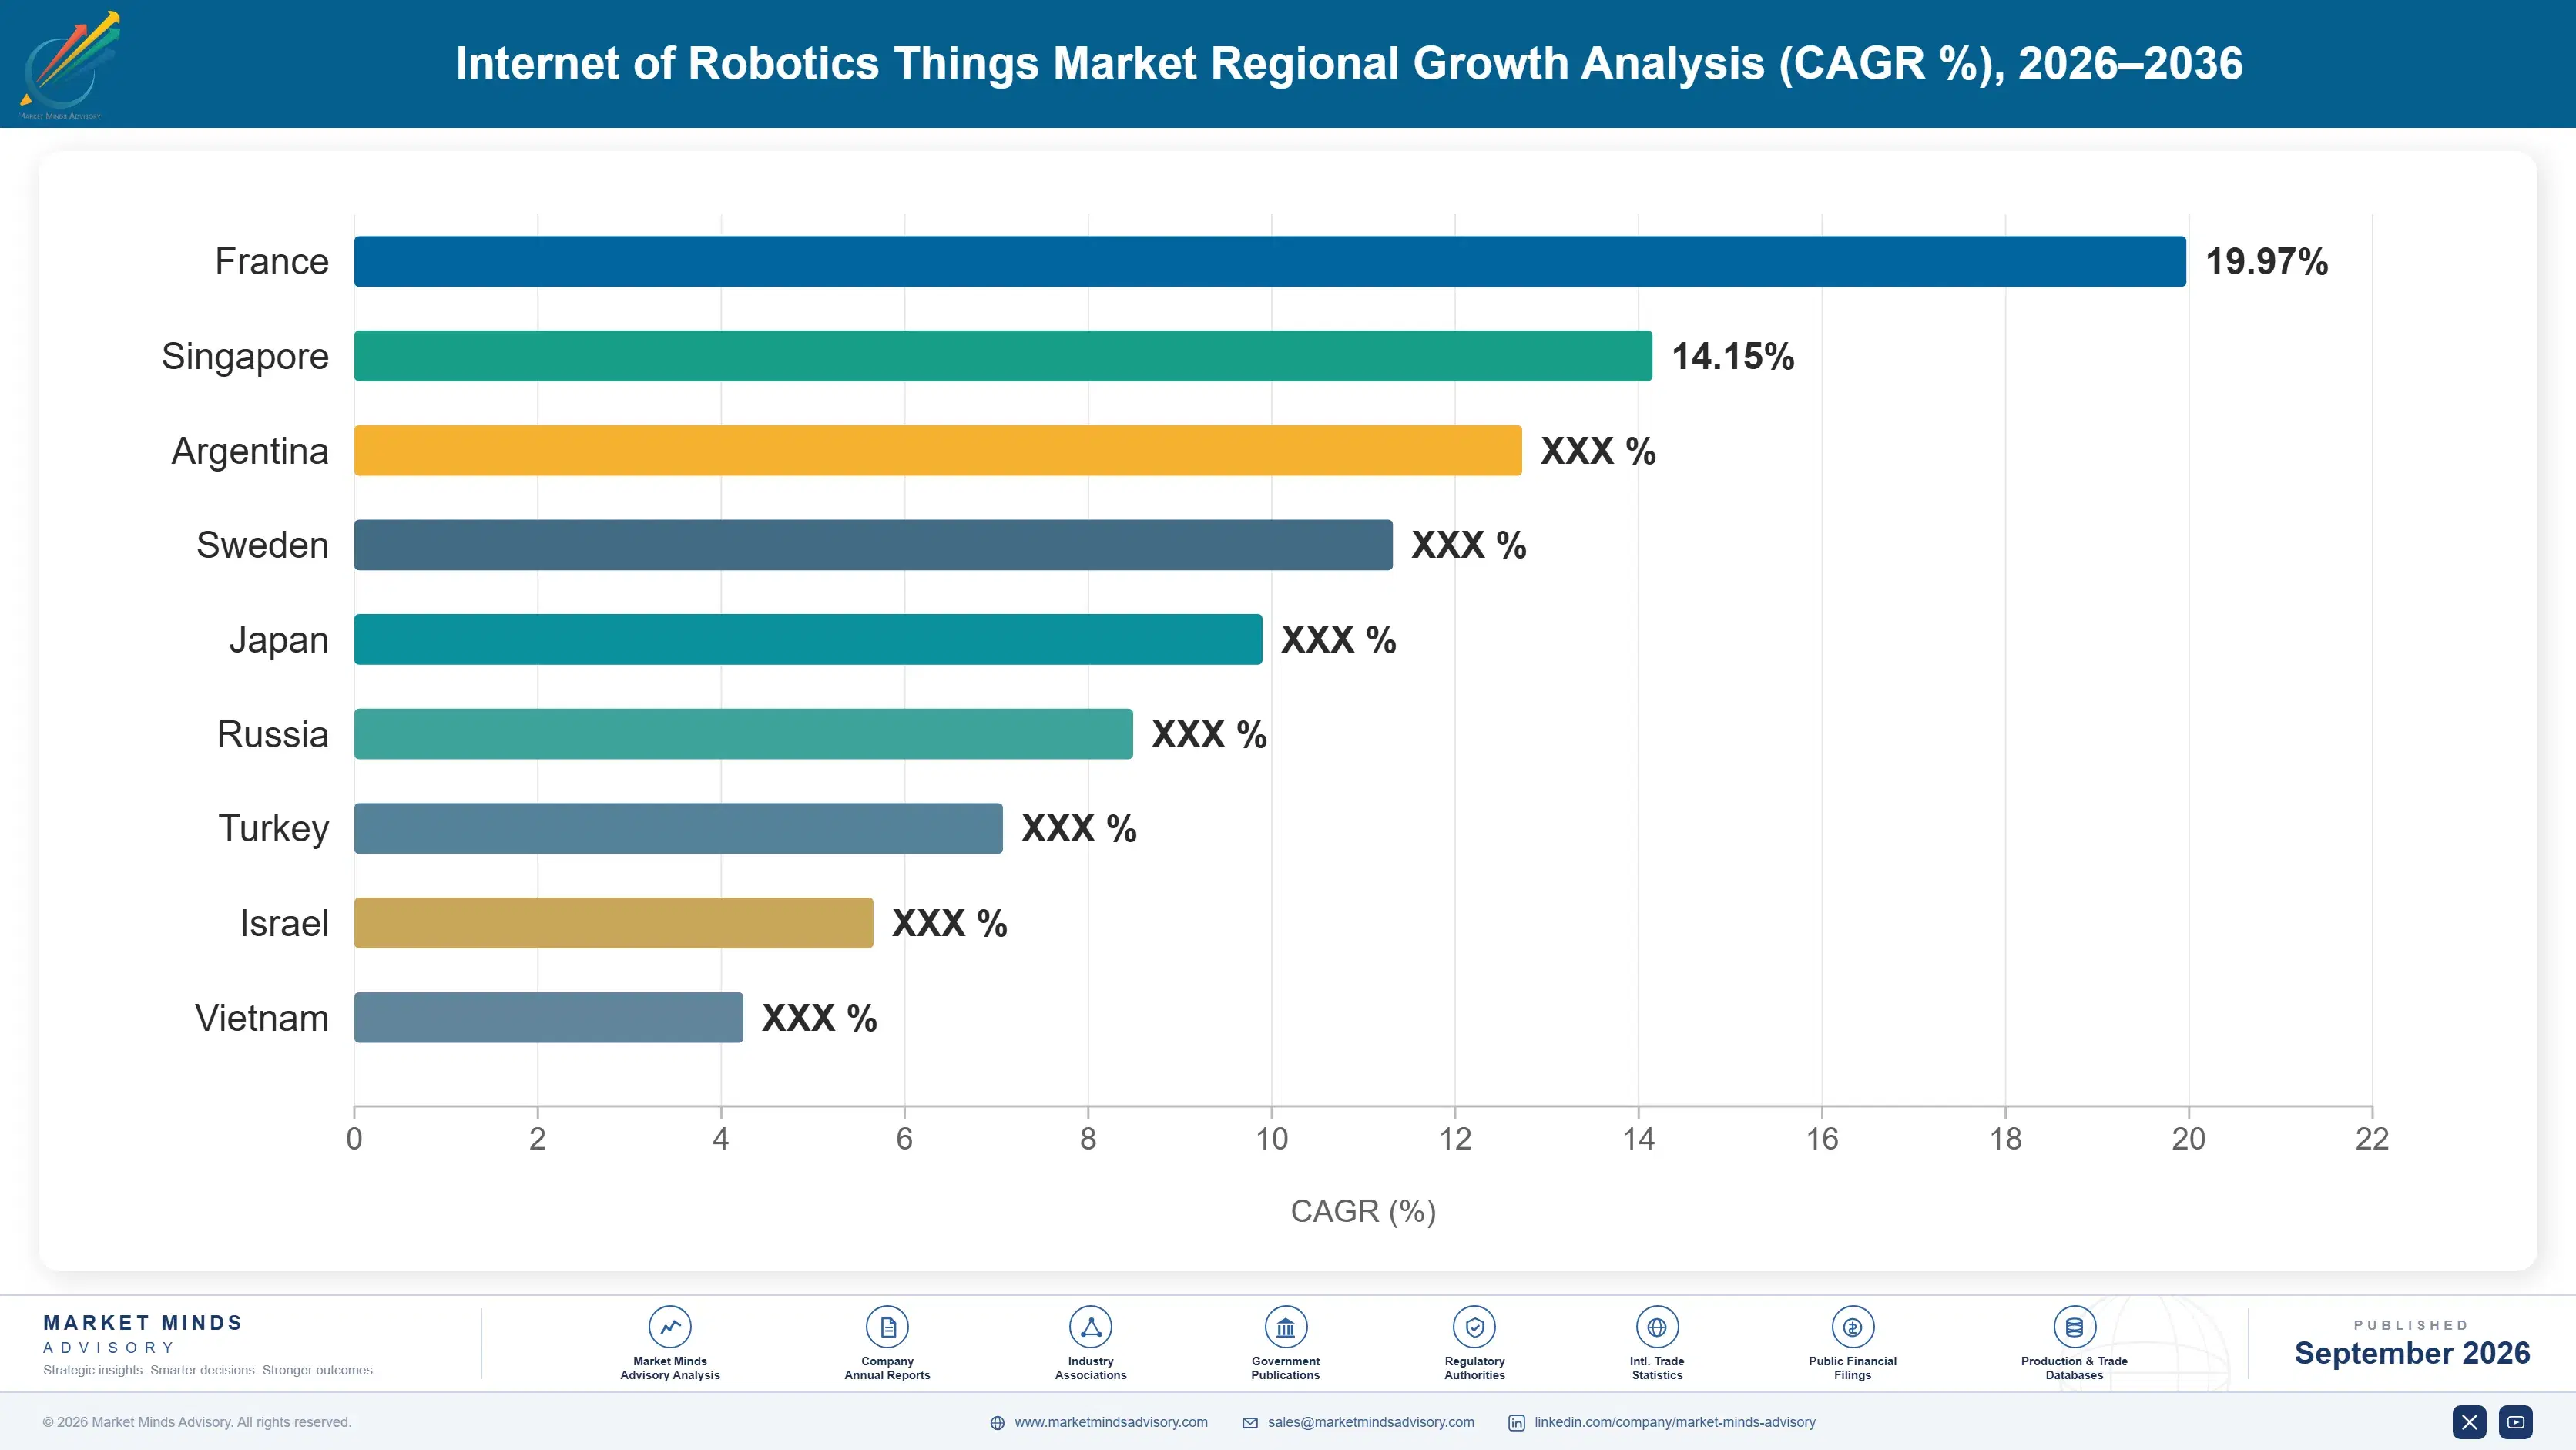
internet-of-robotics-things-market-country-cagr-analysis-1790001955899

Monetizing Interoperability and Fleet Intelligence

Four commercial paths let vendors capture more value per connected robot beyond the initial platform license alone across most enterprise contract structures. Each depends on interoperability breadth, data platform depth, or service scope rather than raw robot count, reflecting how genuine differentiation has shifted. Pricing structures continue evolving rapidly across most enterprise contract types offered.

Tiered Fleet Size Pricing By Robot Count

Vendors increasingly separate baseline small-fleet licensing from expanded enterprise tiers supporting hundreds or thousands of coordinated robots simultaneously, letting customers pay incrementally as their fleet scales beyond initial pilot deployments. This tiered structure lifts average platform revenue by roughly 33 percent compared to flat per-robot pricing sold historically across the industry. Customers appreciate the flexibility to start small and expand coverage later, while vendors capture durable expansion revenue as customer fleets grow over multiple deployment phases and facility expansions. Vendors executing this pricing well outperform peers still selling flat per-robot pricing universally across all customers.
Market Impact: Lifts platform revenue by roughly 33 percent overall

Cross-Vendor Hardware Compatibility Licensing Programs Overall

Vendors increasingly charge premium licensing fees for expanded hardware compatibility layers that let a single orchestration platform coordinate robots from multiple manufacturers rather than locking customers into one vendor's complete hardware and software stack exclusively. This model commands meaningful premium pricing given the substantial engineering investment required to maintain compatibility across dozens of competing robot hardware platforms. Customers report cross-vendor compatibility delivers measurable procurement flexibility worth roughly 27 percent lower total fleet cost compared to single-vendor lock-in over a multi-year deployment horizon. Vendors offering the broadest compatibility increasingly win platform mandates over less flexible single-vendor competitors.
Market Impact: Cuts total fleet cost by roughly 27 percent

Predictive Fleet Analytics Data Subscriptions Offered

Vendors increasingly offer cloud-hosted analytics subscriptions that process raw fleet performance data into actionable operational insights, addressing customer demand for interpreted intelligence rather than raw sensor streams their internal teams cannot easily analyze without dedicated data science resources. Vendors report analytics subscriptions generate roughly 24 percent incremental annual revenue per customer relative to connectivity-only accounts, since operators value guaranteed performance insights over building comparable analytics capability internally from scratch. This service layer also deepens customer switching costs considerably across multi-year deployments. Vendors offering the strongest analytics increasingly win renewal negotiations over less sophisticated data competitors.
Market Impact: Adds roughly 24 percent recurring analytics revenue yearly

Enterprise Fleet Standardization Service Agreements Overall

Large operators increasingly negotiate fleet-wide standardization agreements covering connectivity and orchestration across multiple facilities, rather than managing individual site deployments and service contracts separately through fragmented purchasing decisions made by different facility managers across locations. This enterprise-level agreement structure commands roughly 29 percent volume discount pricing while still generating meaningful aggregate revenue given the scale of operator robot fleets involved. Vendors that win a fleet-wide contract also gain durable incumbency advantage when individual facilities later expand robot deployment. Vendors winning these contracts rarely lose the account during the following equipment refresh cycle.
Market Impact: Delivers roughly a 29 percent volume discount overall

Who Controls the Margin Pool

Concentration sits at a moderate 43 percent for the top five platforms, evaluated consistently on connected robot fleet volume, since a long tail of specialized robotics startups keeps the ceiling below the tighter concentration typical of pure enterprise software categories. ABB leads by a meaningful margin over Fanuc and Amazon Robotics, who compete closely for the challenger position. Regional challengers are narrowing that gap gradually across several product categories.
Current competitive activity concentrates on hardware compatibility expansion and analytics platform development rather than pure robot unit races, as vendors build cross-vendor interoperability through both internal engineering and targeted acquisition of specialized software firms. Several vendors have also expanded edge computing capability over the past two years, responding directly to latency demand. Amazon Robotics expanded its hardware compatibility investment over this period.

Pressure is building from cloud infrastructure providers who increasingly offer robotics-adjacent orchestration services atop general-purpose platforms, threatening to commoditize the coordination layer that specialized robotics vendors once owned exclusively. Chinese domestic robotics manufacturers are also gaining share within East Asia, and rankings could shift if that segment continues capturing volume from established Western and Japanese vendors. Buyers increasingly evaluate total coordination breadth rather than transaction price alone.
internet-of-robotics-things-market-company-positioning-matrix-1790001956432

Competitive Moat and Risk Dimensions

ABB LTD

Moat: Fleet integration and service network

ABB's decades of accumulated industrial automation expertise and dense global service network give it customer trust and support reach few competitors can match, creating durable relationships since manufacturers rarely want to rebuild fleet integration testing elsewhere once a platform is designed in. Few rivals can match this reach.
ABB LTD

Risk: Slower cloud software development pace

ABB's traditional strength in industrial hardware engineering makes rapid cloud software and analytics development considerably harder than for technology-native competitors like Amazon Robotics who built platform capability as a core competency from the start, rather than layering software onto an established hardware business. This gap widens each product cycle.
FANUC CORPORATION

Moat: Manufacturing reliability and precision heritage

Fanuc's decades of accumulated manufacturing reliability and precision engineering heritage earn strong loyalty among industrial customers who value proven, field-tested hardware over unproven newer entrants, particularly for safety-critical manufacturing applications where equipment failure carries severe operational and financial consequences. Few competitors can replicate this trust.
FANUC CORPORATION

Risk: Limited warehouse logistics presence

Fanuc's manufacturing-focused heritage limits its competitive relevance in warehouse and logistics automation applications where Amazon Robotics and comparable technology-native competitors have built stronger platform capability specifically tailored to fulfillment center operations rather than industrial factory floor coordination and precision manufacturing tasks. This gap persists across most warehouse deployments.

Players Tracked

Prominent Players

ABB Ltd
Fanuc Corporation
Amazon Robotics LLC
Boston Dynamics Inc
Universal Robots A/S

Other Key Players

KUKA AG
Yaskawa Electric Corporation
Kawasaki Heavy Industries Ltd
Omron Corporation
Rockwell Automation Inc
Locus Robotics Corp
AutoStore AS
GreyOrange Inc
6 River Systems Inc
Vecna Robotics Inc
Geek+ Inc
Hai Robotics Co Ltd
Zebra Technologies Corporation
PTC Inc
Cisco Systems Inc

Recent Developments

FEBRUARY 2025

ABB Launches Expanded Fleet Orchestration Platform

ABB launched an expanded fleet orchestration software platform supporting cross-vendor hardware compatibility, extending its coordination capability to serve facilities operating mixed-manufacturer robot fleets previously requiring separate management systems for each brand. Analysts view this expansion as a defensive move against orchestration specialists gaining share. today
Signal: Signals established vendors are racing to capture the fastest-growing orchestration segment before specialists gain further share.
JULY 2025

Fanuc Acquires Fleet Analytics Startup

Fanuc acquired a small fleet analytics startup specializing in predictive maintenance algorithms for industrial robots, adding roughly three dozen data scientists to its digital solutions team focused on expanding platform capability across manufacturing. Terms of the acquisition were not disclosed publicly by either party. widely
Signal: Signals mid-tier vendors are buying analytics talent rather than building comparable capability entirely from scratch internally.
NOVEMBER 2025

Amazon Robotics Signs Multi-Site Deployment Agreement

Amazon Robotics entered a multi-year deployment agreement with a major third-party logistics operator to deploy its coordinated fleet platform across the operator's entire distribution network, replacing a previously fragmented, multi-vendor equipment arrangement across facilities. Financial terms of the multi-year agreement were not disclosed publicly. nationwide
Signal: Signals fleet-wide standardization contracts have become a genuine competitive battleground among the largest robotics vendors. today

Edge Computing and Connectivity Chip Exposure

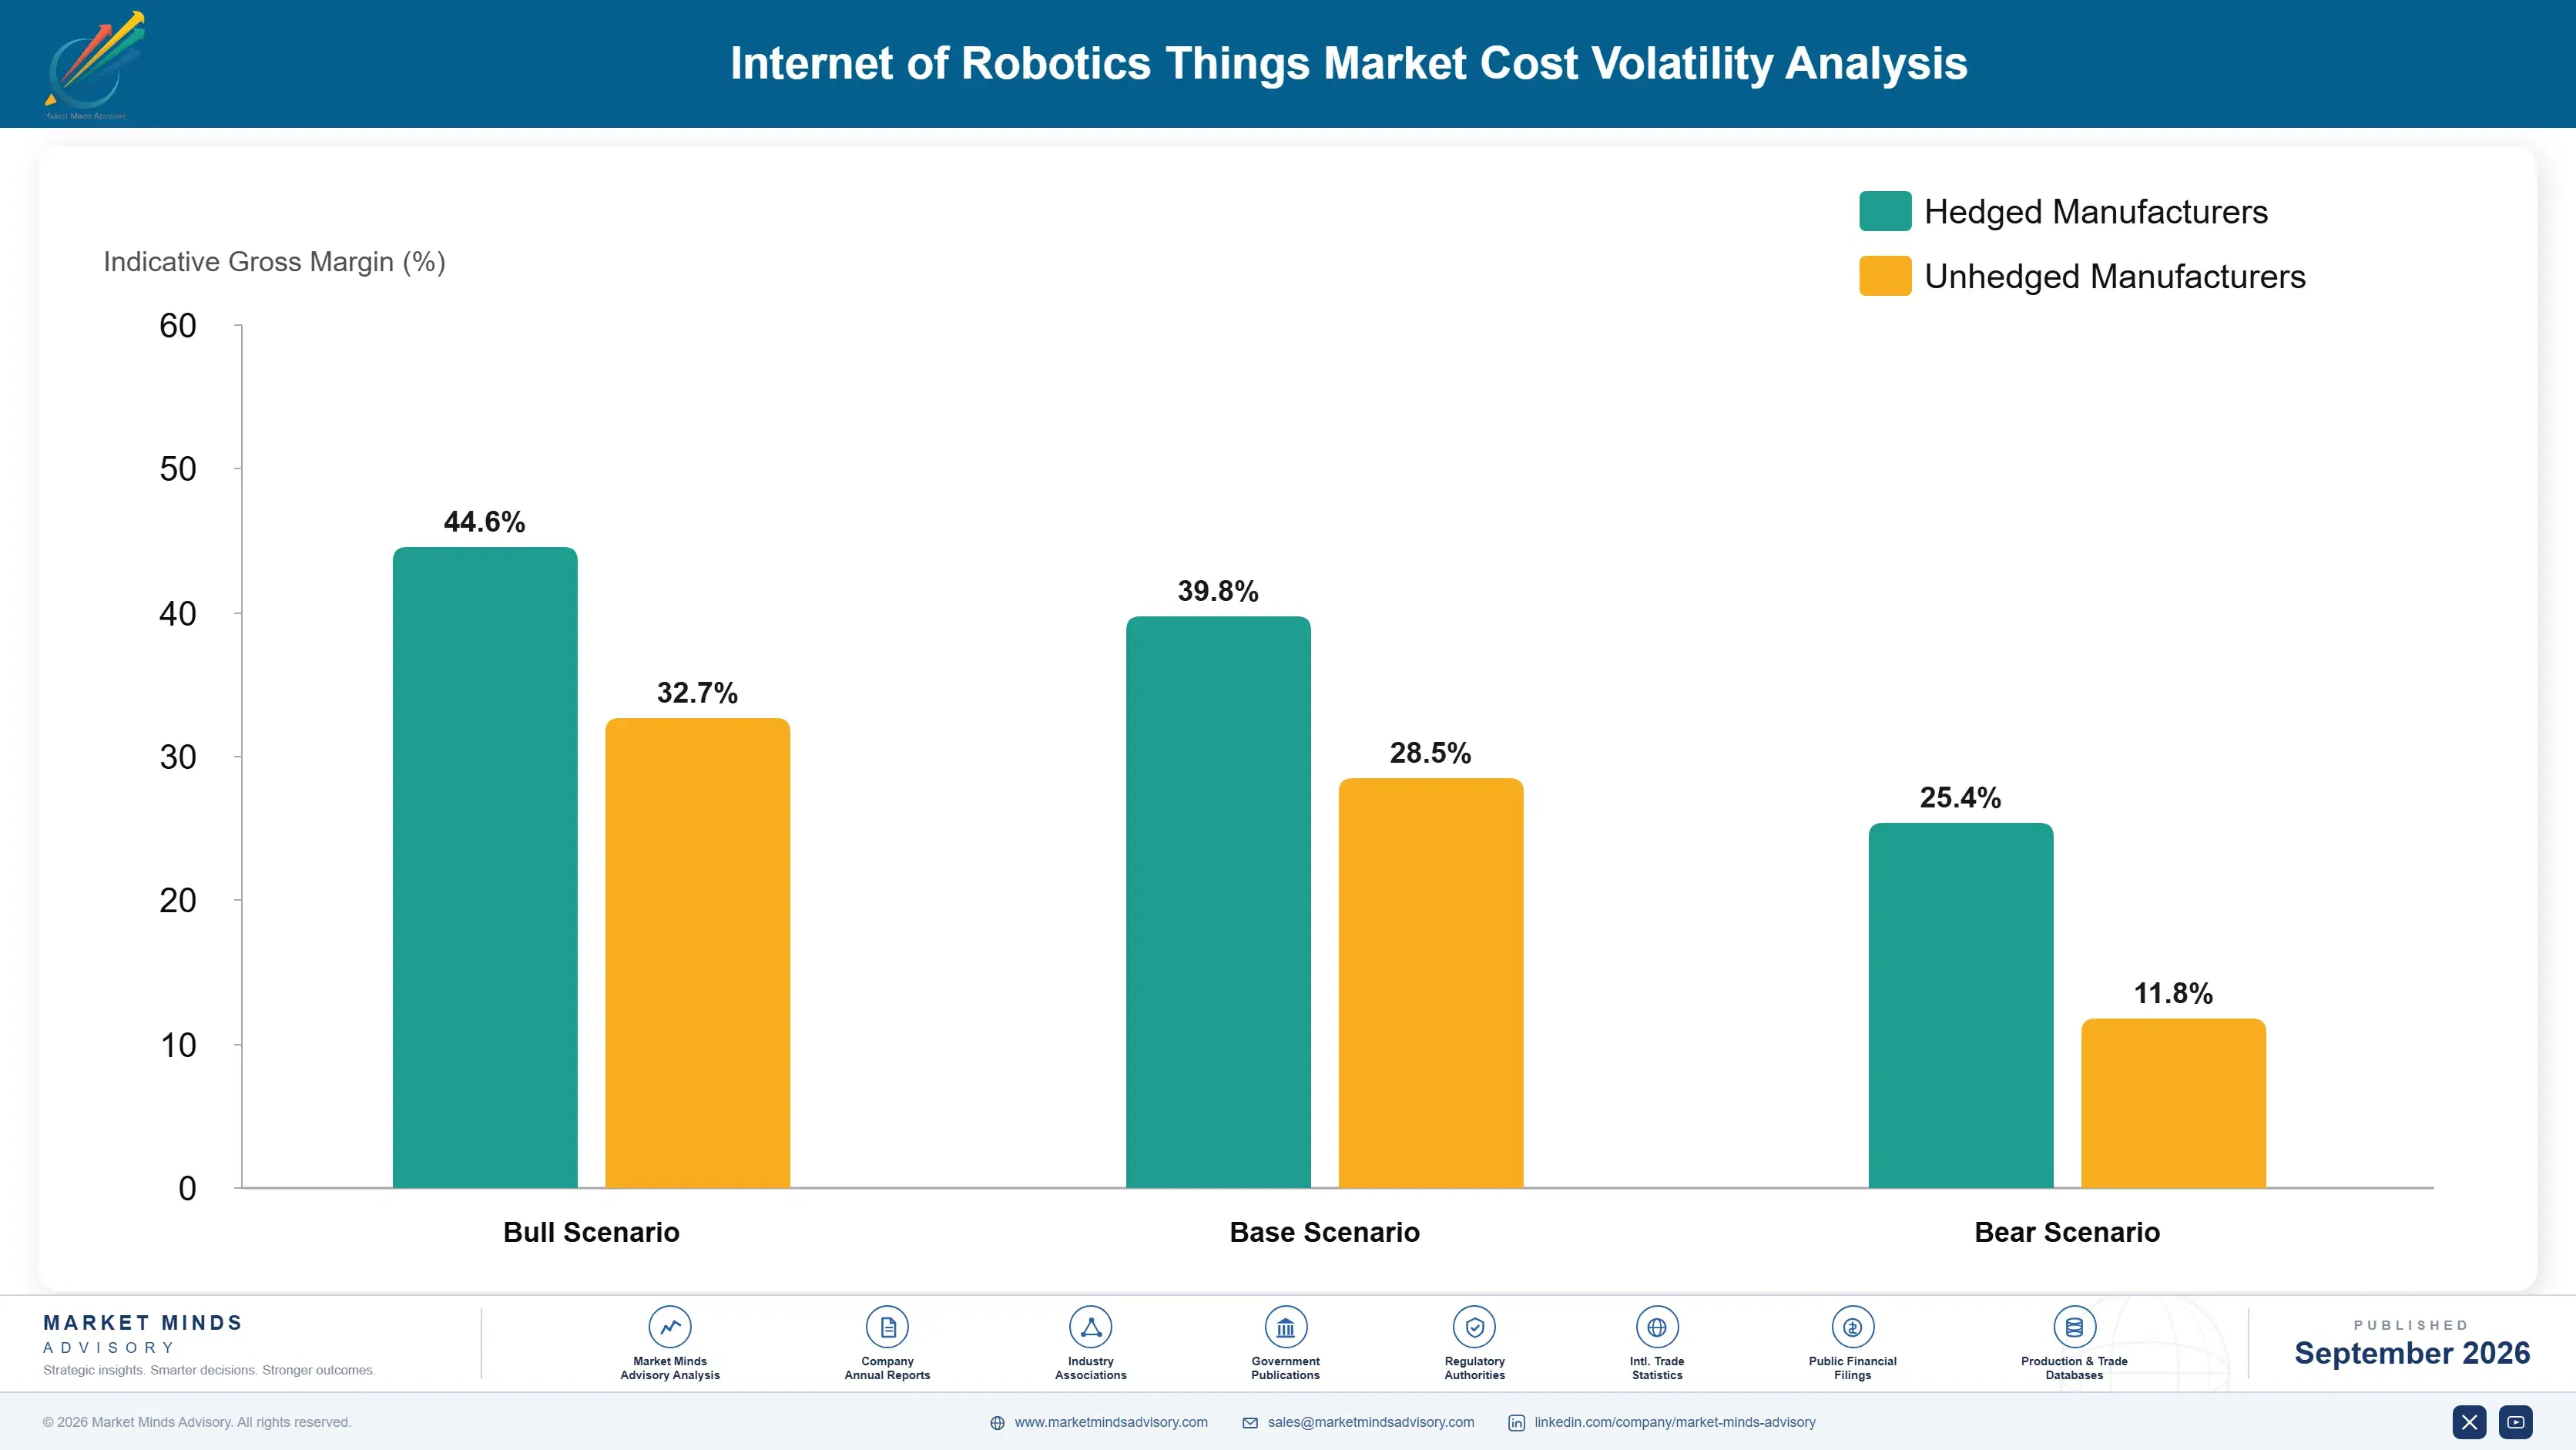
Edge computing processors, wireless connectivity chips, and cloud infrastructure hosting costs together represent roughly 51 percent of platform cost of goods sold, sourced predominantly from a concentrated group of semiconductor manufacturers based across Taiwan, South Korea, and the United States with limited domestic alternative capacity available. Buyer power varies considerably by vendor scale and long-term contract structure.
Edge processor prices spiked meaningfully during 2025 as demand for AI-capable computing chips surged across robotics, automotive, and consumer electronics sectors simultaneously, a trend the IEA and industry reporting linked to broader semiconductor capacity constraints, forcing several vendors to absorb higher component costs temporarily rather than pass the full increase through to customers mid-contract, compressing margins for two consecutive fiscal quarters. Vendors expect similar pressure to recur periodically as global demand cycles continue.

Smaller vendors without long-term chip supplier agreements face the sharpest cost pressure during these episodes, since they lack the purchasing volume to secure priority semiconductor allocation during shortages. Larger vendors with multi-year supply contracts and diversified sourcing relationships weather these episodes with comparatively minor disruption to production schedules and existing customer delivery commitments. This resilience gap is widening as component shortages recur more frequently industry-wide.
internet-of-robotics-things-market-cost-volatility-analysis-1790001956628

Diversify edge processor sourcing

Several vendors are qualifying alternative semiconductor suppliers outside the traditional Taiwanese and Korean supply base, reducing exposure to future capacity disruptions tied to a concentrated set of specialized global producers. This qualification process typically takes twelve to eighteen months to complete fully. Vendors furthest along this path report the strongest resilience against sudden allocation-driven cost spikes.

Invest in domestic chip assembly capability

Larger vendors increasingly invest in domestic chip assembly infrastructure, trading upfront capital investment for long-term supply certainty that protects production schedules during periods of broader global component shortages. This investment typically requires several years before reaching full production capacity. Vendors furthest along this path report meaningfully lower exposure to future foreign supplier disruptions. today

Negotiate multi-year component supply agreements

Vendors are increasingly locking in multi-year fixed-price component agreements with key suppliers, trading some near-term flexibility for predictable input cost planning across multi-year customer delivery commitments and budgets prepared each fiscal year. These agreements meaningfully reduce cost volatility across the portfolio. Vendors report these agreements meaningfully improve budget forecasting accuracy across each fiscal year.

Portfolio Architecture for Margin Defence

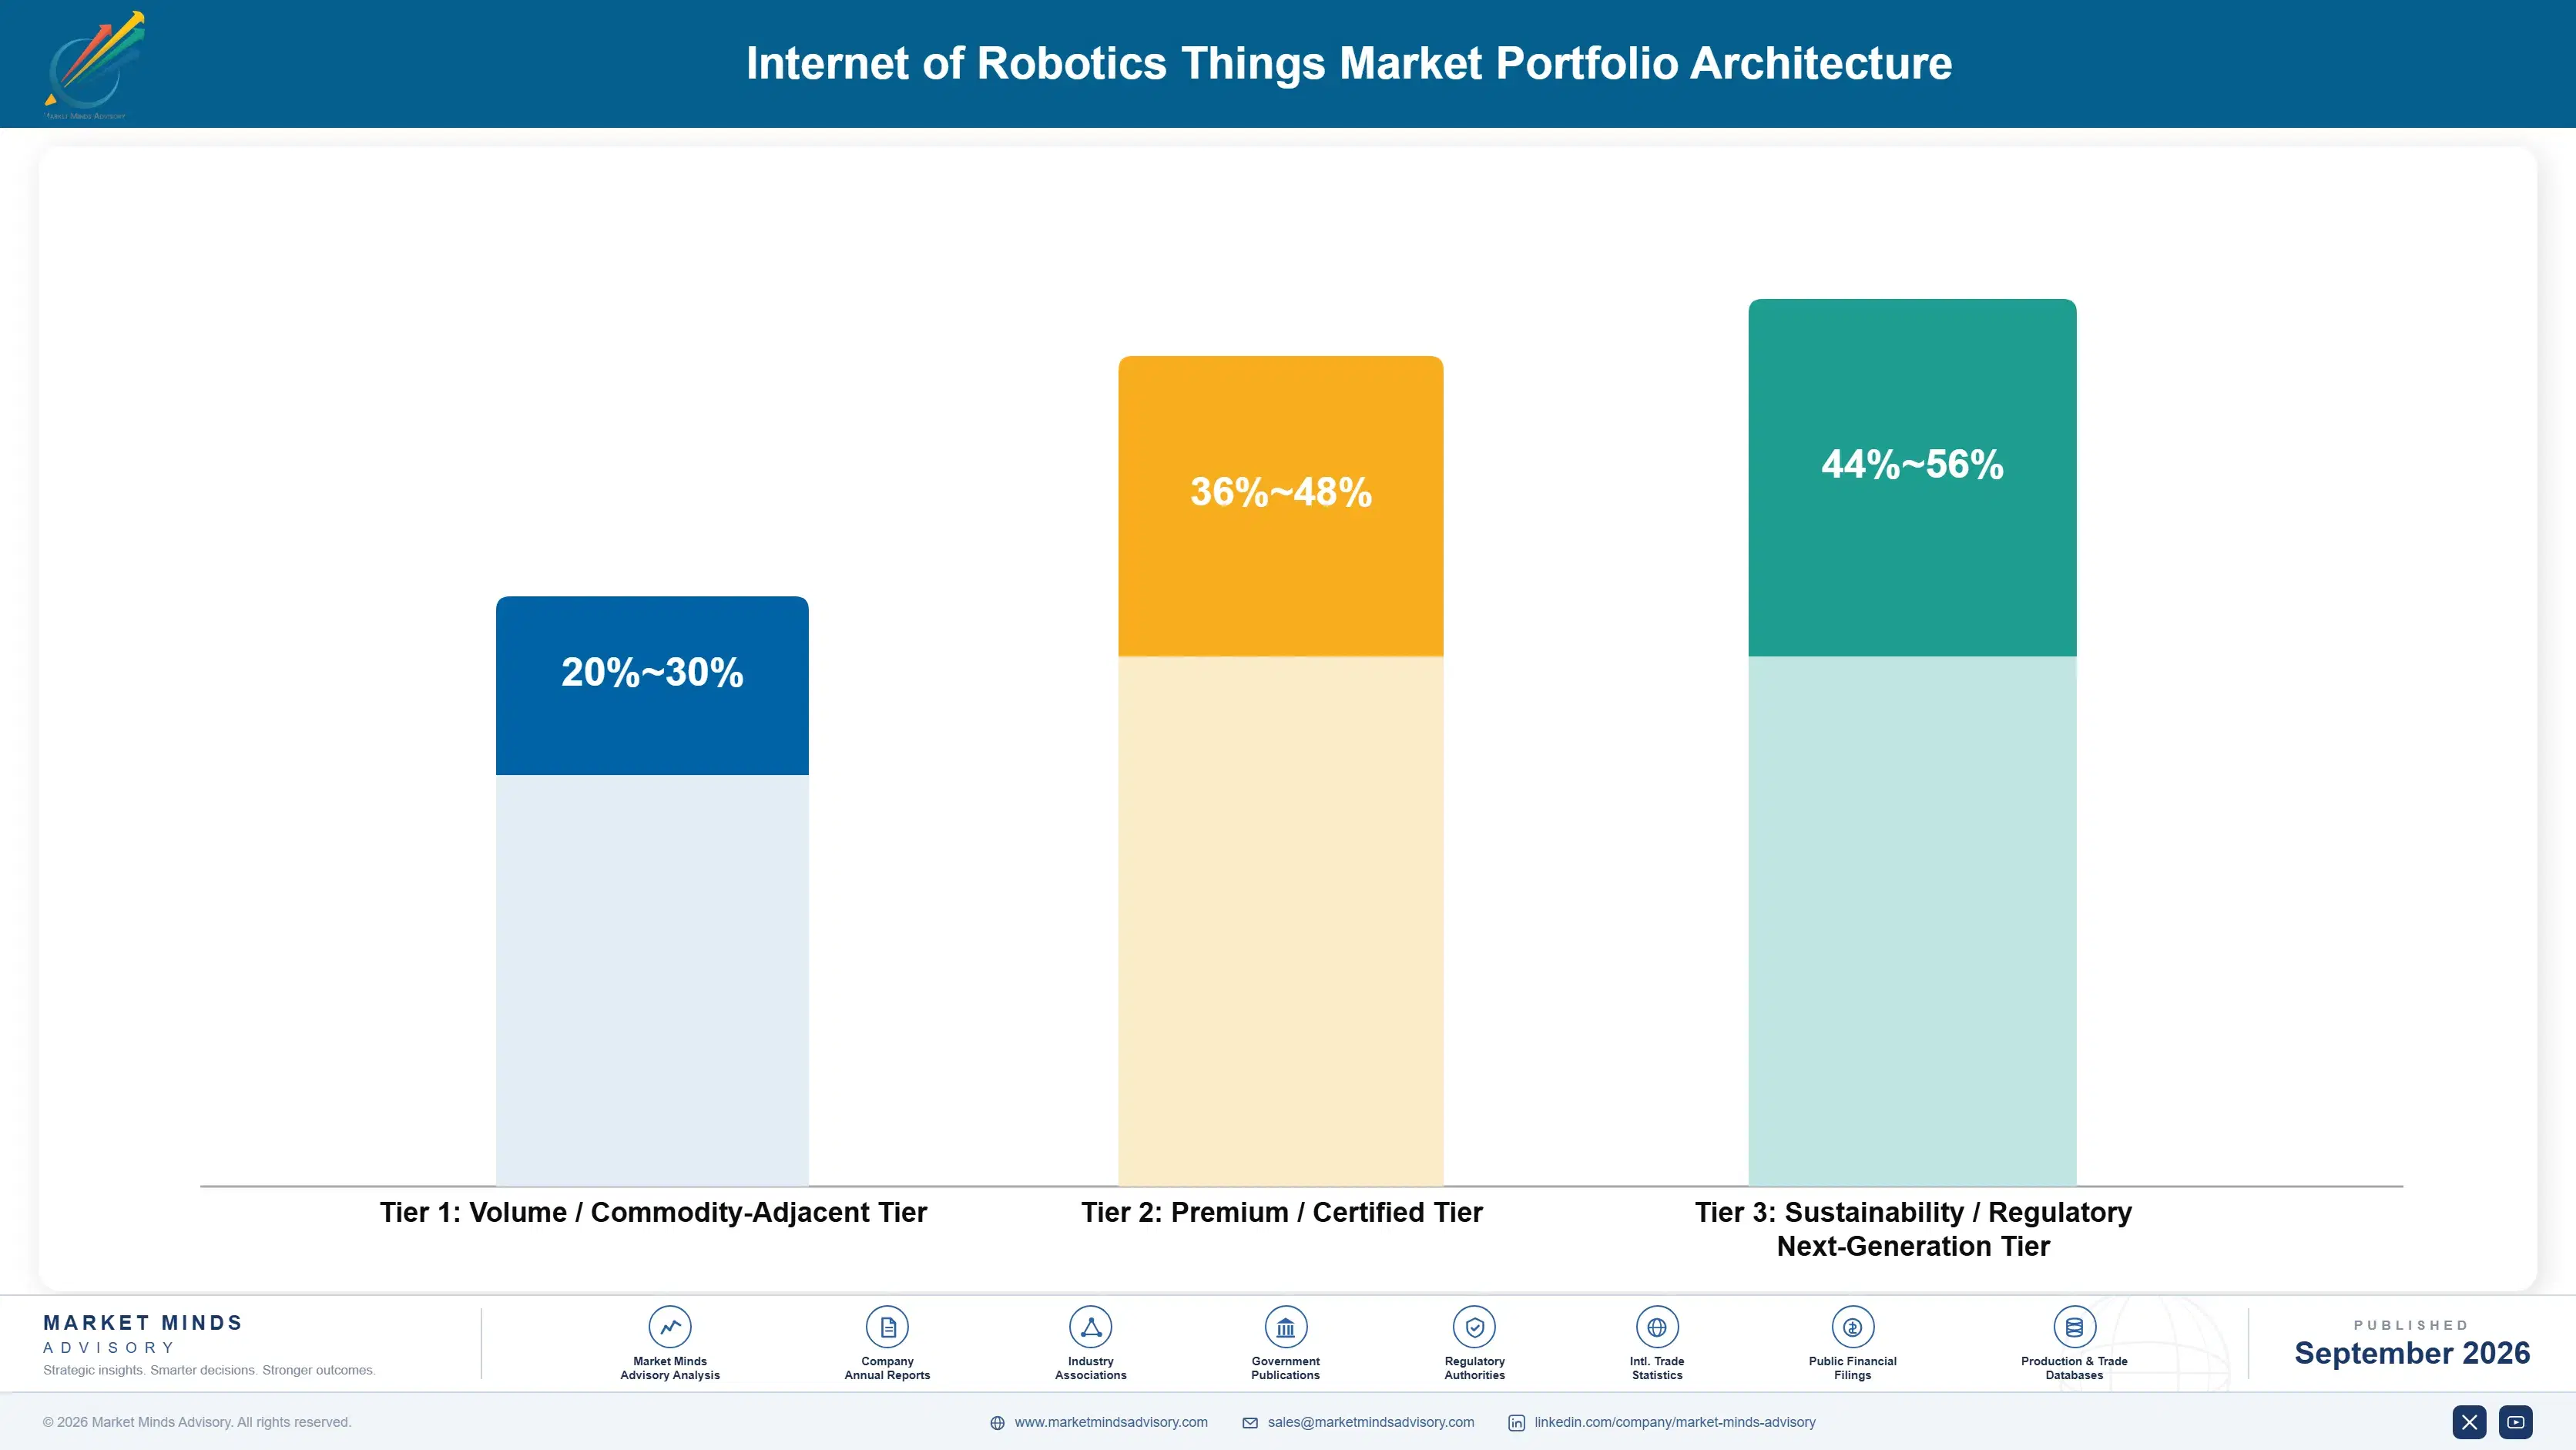
Three tiers structure this market's margin economics, from commoditizing basic connectivity hardware through certified multi-robot orchestration platforms to next-generation cross-vendor systems with integrated predictive analytics. Gross margins vary considerably by tier, since interoperability breadth and analytics depth command far stronger pricing power than basic connectivity hardware sales alone ever could. This structure closely mirrors patterns seen across other software-enhanced industrial hardware categories serving comparably diverse customer segments.
Volume and premium segments pull the industry in genuinely different directions simultaneously across nearly every procurement cycle. Entry-level buyers, mostly smaller operators, push vendors toward simplified, lower-cost single-vendor configurations, while large enterprise customers demand extensive cross-vendor compatibility, dedicated technical support, and analytics platform access that commands genuinely premium pricing across every contract renewal. Vendors that misjudge which tier a given account belongs in risk losing the contract entirely.

High-value margin pools concentrate overwhelmingly in orchestration software and analytics rather than basic connectivity, since coordination algorithms and predictive maintenance capability scale without proportional cost increases, unlike commodity hardware manufacturing that remains constrained by intensifying price competition from Chinese domestic producers entering the space across most markets. Vendors slow to build proprietary coordination capability risk lasting margin disadvantage relative to established competitors.

Volume / Commodity-Adjacent Tier

Basic connectivity hardware and single-vendor coordination sold primarily to smaller operators operating on tight capital budgets and limited fleet scale needs. Margins compress further each year as basic connectivity components commoditize across the broader industry.
Gross Margin: 20-30%

Premium / Certified Tier

Multi-robot orchestration platforms with extensive compatibility documentation and dedicated support, sold predominantly to large enterprises requiring audit-defensible fleet coordination capability. These enterprises negotiate directly with vendors on multi-year support commitments and pricing terms.
Gross Margin: 36-48%

Sustainability / Regulatory / Next-Generation Tier

Cross-vendor systems with integrated predictive analytics supporting Industry 4.0 compliance for forward-looking enterprises investing ahead of digitization mandates. Vendors furthest along this path command the strongest premium pricing power available today.
Gross Margin: 44-56%
internet-of-robotics-things-market-portfolio-architecture-1790001957137

High-value Sub-segments and Strategic Watch-out

Fleet Orchestration Software

Growing fastest of all six segments as operators scale fleet size beyond what manual coordination can reasonably manage, commanding premium margins as cross-vendor compatibility and coordination algorithms become genuinely difficult for smaller competitors to replicate at comparable scale, reliability, and integration sophistication across most deployment environments tracked.
Gross Margin: 46-58%

Edge Computing Connectivity Modules

The second-fastest segment, capturing an increasing share of vendor profit pools as real-time coordination demands push computation to on-site hardware, supporting durable margin expansion and deepening customer loyalty across every account managed under multi-year connectivity licensing agreements, renewal cycles, and expanding modular hardware configurations offered.
Gross Margin: 38-50%

Basic Robot Connectivity Hardware

The largest segment by unit volume, providing steady baseline revenue even as margins compress under intensifying commoditization pressure from Chinese domestic manufacturers entering the space across multiple regions simultaneously, predictably, and with growing technical sophistication and local service capability improving over successive product generations and cycles.
Gross Margin: 24-34%

Legacy Isolated Robot Deployments

A strategic watch-out segment facing a sustained, longer-term volume decline as coordinated fleets displace standalone robot deployments entirely, risking steady erosion for suppliers slow to transition beyond basic isolated hardware manufacturing sold across shrinking, increasingly obsolete legacy single-machine deployment categories and outdated distribution channels today.
Gross Margin: 12-20%

Recurring Platform Licensing Anchors Fleet Relationships

Hardware sales are the visible transaction, but recurring platform licensing, analytics subscriptions, and expanding fleet size increasingly generate the durable revenue vendors value most, since a single deployed fleet relationship typically stays active and expanding for close to six years before an operator considers switching orchestration platforms entirely. Vendors winning a fleet contract rarely lose the account before the following equipment refresh cycle.
Adoption depth varies sharply by end-use vertical across the industry. Large e-commerce and logistics operators, where fleet coordination directly drives daily throughput, embed orchestration platforms deeply into core operations, while smaller manufacturers treat coordinated robotics as an occasional upgrade rather than continuous infrastructure, limiting near-term recurring revenue from that segment considerably despite growing awareness of the technology. This gap is narrowing as orchestration pricing becomes accessible to smaller manufacturers.

A generational shift in buyer profile is underway as younger operations managers, trained on cloud-coordinated automation rather than traditional isolated machine programming, now specify fleet orchestration platforms by default during facility planning rather than treating them as an optional upgrade, steadily accelerating adoption across operations run by newly promoted technical leadership teams. Procurement committees increasingly reflect this generational shift directly in vendor evaluation criteria used today.
internet-of-robotics-things-market-end-use-penetration-index-1790001957633

Where Robotics Platform Value Concentrates

These are among the four positions where our research anticipates prominent divergence between winners and laggards over the coming forecast period. Each is grounded in the demand model, the regulatory perimeter, and the announced capacity pipeline.
01 / ORCHESTRATION SOFTWARE POSITIONING

Prioritize fleet coordination software over standalone robot sales

Operators increasingly scale fleet size beyond what manual coordination can reasonably manage, and this shift is not a temporary preference in the way past automation technology cycles often proved to be for the category over past decades. Vendors who invest in orchestration software capture the fastest-growing segment tracked in this report, roughly 1.26 times the overall market growth rate. Companies still selling standalone robots alone, given how urgently enterprise buyers demand this coordination, should expand into orchestration before competitors lock in relationships.
02 / REGIONAL MANUFACTURING ALLOCATION

Deepen East Asia presence while building North America platform capacity

East Asia's dense concentration of electronics manufacturing and logistics automation anchors the single largest share of global demand today, a durable feature of the industry rather than a temporary sourcing pattern likely to shift anytime soon. Vendors should simultaneously build technical platform capacity in North America, where labor shortage pressure is accelerating fastest and where design-in decisions increasingly happen before manufacturing details are finalized. Waiting risks ceding leadership, which compounds over successive product cycles, to established regional competitors already scaling.
03 / CROSS-VENDOR COMPATIBILITY STRATEGY

Build broad hardware compatibility to capture enterprise fleets

Mixed-vendor deployments now represent roughly 44 percent of multi-robot facilities, according to primary survey data collected across the industry's largest and most established operators, logistics companies, and manufacturers operating today across every major regional market tracked. Vendors still locked to single-vendor hardware are leaving significant enterprise revenue on the table that competitors increasingly capture through broad compatibility layers sold separately from core hardware transactions. Enterprises increasingly favor vendors offering genuine flexibility, a discipline boards increasingly reward with stronger valuation multiples overall.
04 / CYBERSECURITY INVESTMENT STRATEGY

Build zero-trust architecture to defend fleet network integrity

Cybersecurity vulnerabilities are extending certification timelines by three to six months for facilities implementing formal review processes, a friction point competitors are actively working to resolve through zero-trust network architectures and hardware security modules built directly into products. Vendors that offer proven security certification capture measurably faster enterprise procurement approval than vendors without documented security frameworks, protecting deployment timelines during periods of heightened enterprise scrutiny. Vendors slow to invest, including through financing options for smaller facilities, risk losing accounts entirely.

Engagement Snapshot From the Field

A live engagement with an industry participant carrying material or product regulatory and market exposure ahead of a defining policy shift, showing how our research translates into a defensible multi-year portfolio strategy.
MARKET MINDS ADVISORY · CLIENT ENGAGEMENT SUMMARY
Internet of Robotics Things Producer Strategic Portfolio Review and Transition Roadmap 2026·Investment Scenario on Internet of Robotics Things Exposure Evaluation 2025-26
CLIENT PROFILE
The client is a mid-size third-party logistics operator running six distribution centers, generating annual revenue of roughly 380 million dollars (client-reported, unverified by MMA). Facing persistent warehouse labor shortages and rising fulfillment costs, the operator's operations leadership needed to evaluate whether deploying a coordinated robot fleet across facilities would justify the capital investment through labor cost reduction.
STRATEGIC CHALLENGE
The client's existing facilities relied on manual material handling supplemented by a small number of isolated, single-purpose robots that could not coordinate tasks or share workload dynamically across the warehouse floor. Leadership needed a clear framework for evaluating fleet coordination investment against the true cost of persistent labor shortages and overtime premiums the operator was already absorbing.
MMA APPROACH
MMA's team benchmarked four competing fleet orchestration platforms against the client's specific facility layout and throughput requirements, drawing on primary survey data and 47 expert interviews with practicing logistics operations specialists. The engagement modeled total cost of ownership and labor savings across each platform over a five-year deployment horizon. today.
KEY FINDINGS
  1. Deploying a coordinated robot fleet reduced the client's labor cost per equivalent throughput by roughly 36 percent (client-reported, unverified by MMA) compared to manual material handling operations.
  2. The client's existing facility network lacked sufficient wireless connectivity infrastructure, risking coordination reliability without additional network investment made across every single site.
  3. Two of four evaluated platforms offered meaningfully stronger cross-vendor hardware compatibility than the client's initial vendor shortlist assumptions had projected during scoping.
  4. A phased facility rollout would let the client validate coordination performance in one distribution center first before committing fully to network-wide deployment.
CLIENT PROFILE
The client is a mid-size third-party logistics operator running six distribution centers, generating annual revenue of roughly 380 million dollars (client-reported, unverified by MMA). Facing persistent warehouse labor shortages and rising fulfillment costs, the operator's operations leadership needed to evaluate whether deploying a coordinated robot fleet across facilities would justify the capital investment through labor cost reduction.
STRATEGIC CHALLENGE
The client's existing facilities relied on manual material handling supplemented by a small number of isolated, single-purpose robots that could not coordinate tasks or share workload dynamically across the warehouse floor. Leadership needed a clear framework for evaluating fleet coordination investment against the true cost of persistent labor shortages and overtime premiums the operator was already absorbing.
MMA APPROACH
MMA's team benchmarked four competing fleet orchestration platforms against the client's specific facility layout and throughput requirements, drawing on primary survey data and 47 expert interviews with practicing logistics operations specialists. The engagement modeled total cost of ownership and labor savings across each platform over a five-year deployment horizon. today.
KEY FINDINGS
  1. Deploying a coordinated robot fleet reduced the client's labor cost per equivalent throughput by roughly 36 percent (client-reported, unverified by MMA) compared to manual material handling operations.
  2. The client's existing facility network lacked sufficient wireless connectivity infrastructure, risking coordination reliability without additional network investment made across every single site.
  3. Two of four evaluated platforms offered meaningfully stronger cross-vendor hardware compatibility than the client's initial vendor shortlist assumptions had projected during scoping.
  4. A phased facility rollout would let the client validate coordination performance in one distribution center first before committing fully to network-wide deployment.
RECOMMENDED STRATEGY
Phase 1: Phase one selected a fleet orchestration platform offering strong cross-vendor compatibility aligned with the client's existing equipment investments and budget. Phase 2: Phase two launched coordinated fleet deployment in the client's single largest distribution center first, validating performance fully before broader rollout. Phase 3: Phase three expanded fleet coordination to the remaining five distribution centers over twelve months, completing the full planned deployment timeline.
OUTCOME
Within sixteen months, the client reported a 36 percent reduction in labor cost per equivalent throughput alongside meaningfully improved order fulfillment accuracy across all six facilities (client-reported, unverified by MMA). The operator has since expanded coordination further. Leadership views this as a repeatable model for other underperforming distribution facilities.

Frequently Asked Questions

Foundational context covering the market sizes, CAGR, scope, country, region and competition that inform every finding below. This section is provided to cover basics and most often pre-purchase conversations, answered from the MMA Primary Research Dataset.

What is the current size of the Internet of Robotics Things Market?

The Internet of Robotics Things Market was valued at 12.4 billion dollars in 2025. Growth is driven by operators connecting individual robots into cloud-managed, coordinated fleets.

How large will the Internet of Robotics Things Market be by 2036?

MMA projects the market will reach 71.05 billion dollars by 2036, up from 14.53 billion dollars in 2026. That reflects a 4.89 times expansion driven by orchestration software and edge adoption.

What is the CAGR for the Internet of Robotics Things Market 2026 to 2036?

The base case CAGR is 17.2 percent, with a bull case of 18.5 percent and a bear case of 15.8 percent. Historical growth from 2020 to 2025 ran somewhat slower at 15.7 percent.

Which segment is growing fastest?

Fleet orchestration software leads at a 21.6 percent CAGR, roughly 1.26 times the overall market rate. Operators increasingly scale fleet size beyond what manual coordination can manage.

Who are the major companies in the Internet of Robotics Things Market?

ABB, Fanuc, Amazon Robotics, Boston Dynamics, and Universal Robots lead the field. Combined, the top five platforms hold an estimated 43 percent share on a connected fleet basis.

Which country is growing fastest?

India leads at a projected 19.4 percent CAGR, driven by its rapidly expanding manufacturing sector and growing e-commerce logistics investment. That pace outstrips every other major national market tracked.

Report Segmentation Architecture

The full report scope spans multiple orthogonal segmentation dimensions, with cross-tabulated demand data provided for each dimension pair. Coverage extends further to regional breakdowns, trend trajectories, and the competitive detail needed to support segment-level decision-making.

By Product Type

  • Fleet Orchestration Software
  • Edge Computing Connectivity Modules
  • Basic Robot Connectivity Hardware
  • Predictive Analytics Platforms
  • Cybersecurity and Network Services
  • Legacy Isolated Robot Deployments

By End-Use Industry

  • Warehouse and Logistics
  • Manufacturing and Industrial Automation
  • Retail and E-Commerce Fulfillment
  • Healthcare and Life Sciences
  • Agriculture
  • Mining and Construction

By Commercial Dimension

  • Platform Licensing
  • Hardware Sales
  • Analytics Subscriptions
  • Application Engineering Services
  • Enterprise Fleet Contracts
  • Managed Fleet Operations Services

By Region

  • North America
  • Western Europe
  • East Asia
  • South Asia and Pacific
  • Latin America
  • Middle East and Africa
  • Eastern Europe

Scope, Methodology, and Coverage

Every figure in this report is reproducible from documented input assumptions. The scope below maps the historical period, the forecast horizon, the segmentation dimensions, and the countries covered, alongside the underlying primary and qualitative methodology.
Historical Period
2020 to 2025
Forecast Period
2026 to 2036
Base Year
2025 (USD billions; MMA Primary Research Dataset, September 2026)
Market Definition
The Internet of Robotics Things Market covers cloud connectivity platforms, fleet orchestration software, and edge computing hardware that connect industrial and commercial robots into coordinated, data-sharing networks. It excludes standalone robots without network connectivity and general-purpose industrial IoT platforms unrelated to robotic fleet coordination specifically.
Quantitative Units
USD Billion
Segmentation Dimensions
Product type, end-use industry, commercial dimension, and region
Regions Covered
North America, Western Europe, East Asia, South Asia and Pacific, Latin America, Middle East and Africa, Eastern Europe
Countries Covered
China, United States, Germany, Japan, South Korea, India, Taiwan, and 24 additional markets across seven global regions
Key Companies Profiled
ABB Ltd, Fanuc Corporation, Amazon Robotics LLC, Boston Dynamics Inc, Universal Robots A/S, KUKA AG, Yaskawa Electric Corporation, Kawasaki Heavy Industries Ltd, Omron Corporation, Rockwell Automation Inc, Locus Robotics Corp, AutoStore AS, GreyOrange Inc, 6 River Systems Inc, Vecna Robotics Inc, Geek+ Inc, Hai Robotics Co Ltd, Zebra Technologies Corporation, PTC Inc, Cisco Systems Inc
Quantitative Methodology
Primary survey, n=3,800 respondents, Q4 2025, six countries; demand-side model with trade association cross-validation
Qualitative Methodology
47 expert interviews, Q4 2025; applied to validate demand model assumptions, identify emerging dynamics, and assess competitive positioning
Report Format
PDF and XLSX data workbook (Word format preview document)
Publisher
Market Minds Advisory
Report Code
MMA-2026-TEC-457
Published
September 2026
Contact
sales@marketmindsadvisory.com | www.marketmindsadvisory.com

Purchase the full Internet of Robotics Things Market Report (2026 to 2036).

This report delivers a complete strategic assessment of the Internet of Robotics Things Market from 2026 through 2036, covering hardware, software, and services connecting industrial and commercial robots into fleets. It combines primary survey data from 3,800 respondents across six countries with 47 expert interviews to quantify segment growth, regional demand, and competitive positioning. Analysts examine interoperability strategy, edge computing trends, and component cost exposure across every major product category tracked in this analysis. The report also includes a client engagement case study and a strategic verdict outlining exactly where commercial value concentrates through the ten-year forecast period.
Ten-year forecast with bull and bear scenarios
Segment-level growth rates and CAGR multiples
All seven regional markets sized and profiled
Competitive benchmarking of twenty named vendors
Input cost exposure and mitigation pathway analysis
Anonymized client case study with strategic recommendations

Built For The People Who Decide

From boardroom strategy to bench-side execution, this report is read cover-to-cover by leaders shaping the next decade of their industry, turning demand scenarios, market dynamics and valuation benchmarks into decisions.
CXOs/ Presidents/ VPs/ Managers
M&A and Corporate Development
Strategy Teams and R&D Heads
Procurement and Product Directors
Regulatory and Compliance Leaders
Investor Relations and Equity Analysts