Market Minds Advisory
Intermediate Bulk Container Market

Intermediate Bulk Container Market: Reconditioning Economics Now Decide Margin

A commercial reading of bulk liquid and dry goods handling, where reconditioned container economics increasingly compete against new production, flexible bulk bags challenge rigid plastic dominance, and chemical logistics volume sets the underlying demand floor.

Lead Analyst

Bilal Shaikh

Published

September 2026

Make Smarter Decisions with Customized Research Insights

Request a free sample report and evaluate market opportunities, growth trends, and competitive dynamics relevant to your business needs.

2025 MARKET VALUE$6.8BMarket Size 2025
2036 FORECAST VALUE$11.2BBase Case , 2026 to 2036
CAGR 2026 TO 20364.6 %Bull 5.8% / Bear 3.3%
INCREMENTAL OPPORTUNITY$4.0BNet 10- year value creation
EXPANSION MULTIPLE1.57x2036 value over 2026 base
Strategic Levers
M&A Pipeline
Regional Outlook
Country Rankings
Competitive Intelligence
Segmental Deep-dive
Call-Us : 91 93563 13602

Executive Snapshot and Market Trajectory

A container that gets reconditioned and refilled forty times generates almost no revenue for the manufacturer that made it once. That arithmetic is quietly reshaping who actually profits in bulk container supply, and it now rewards reconditioners more consistently than the original equipment producers themselves.
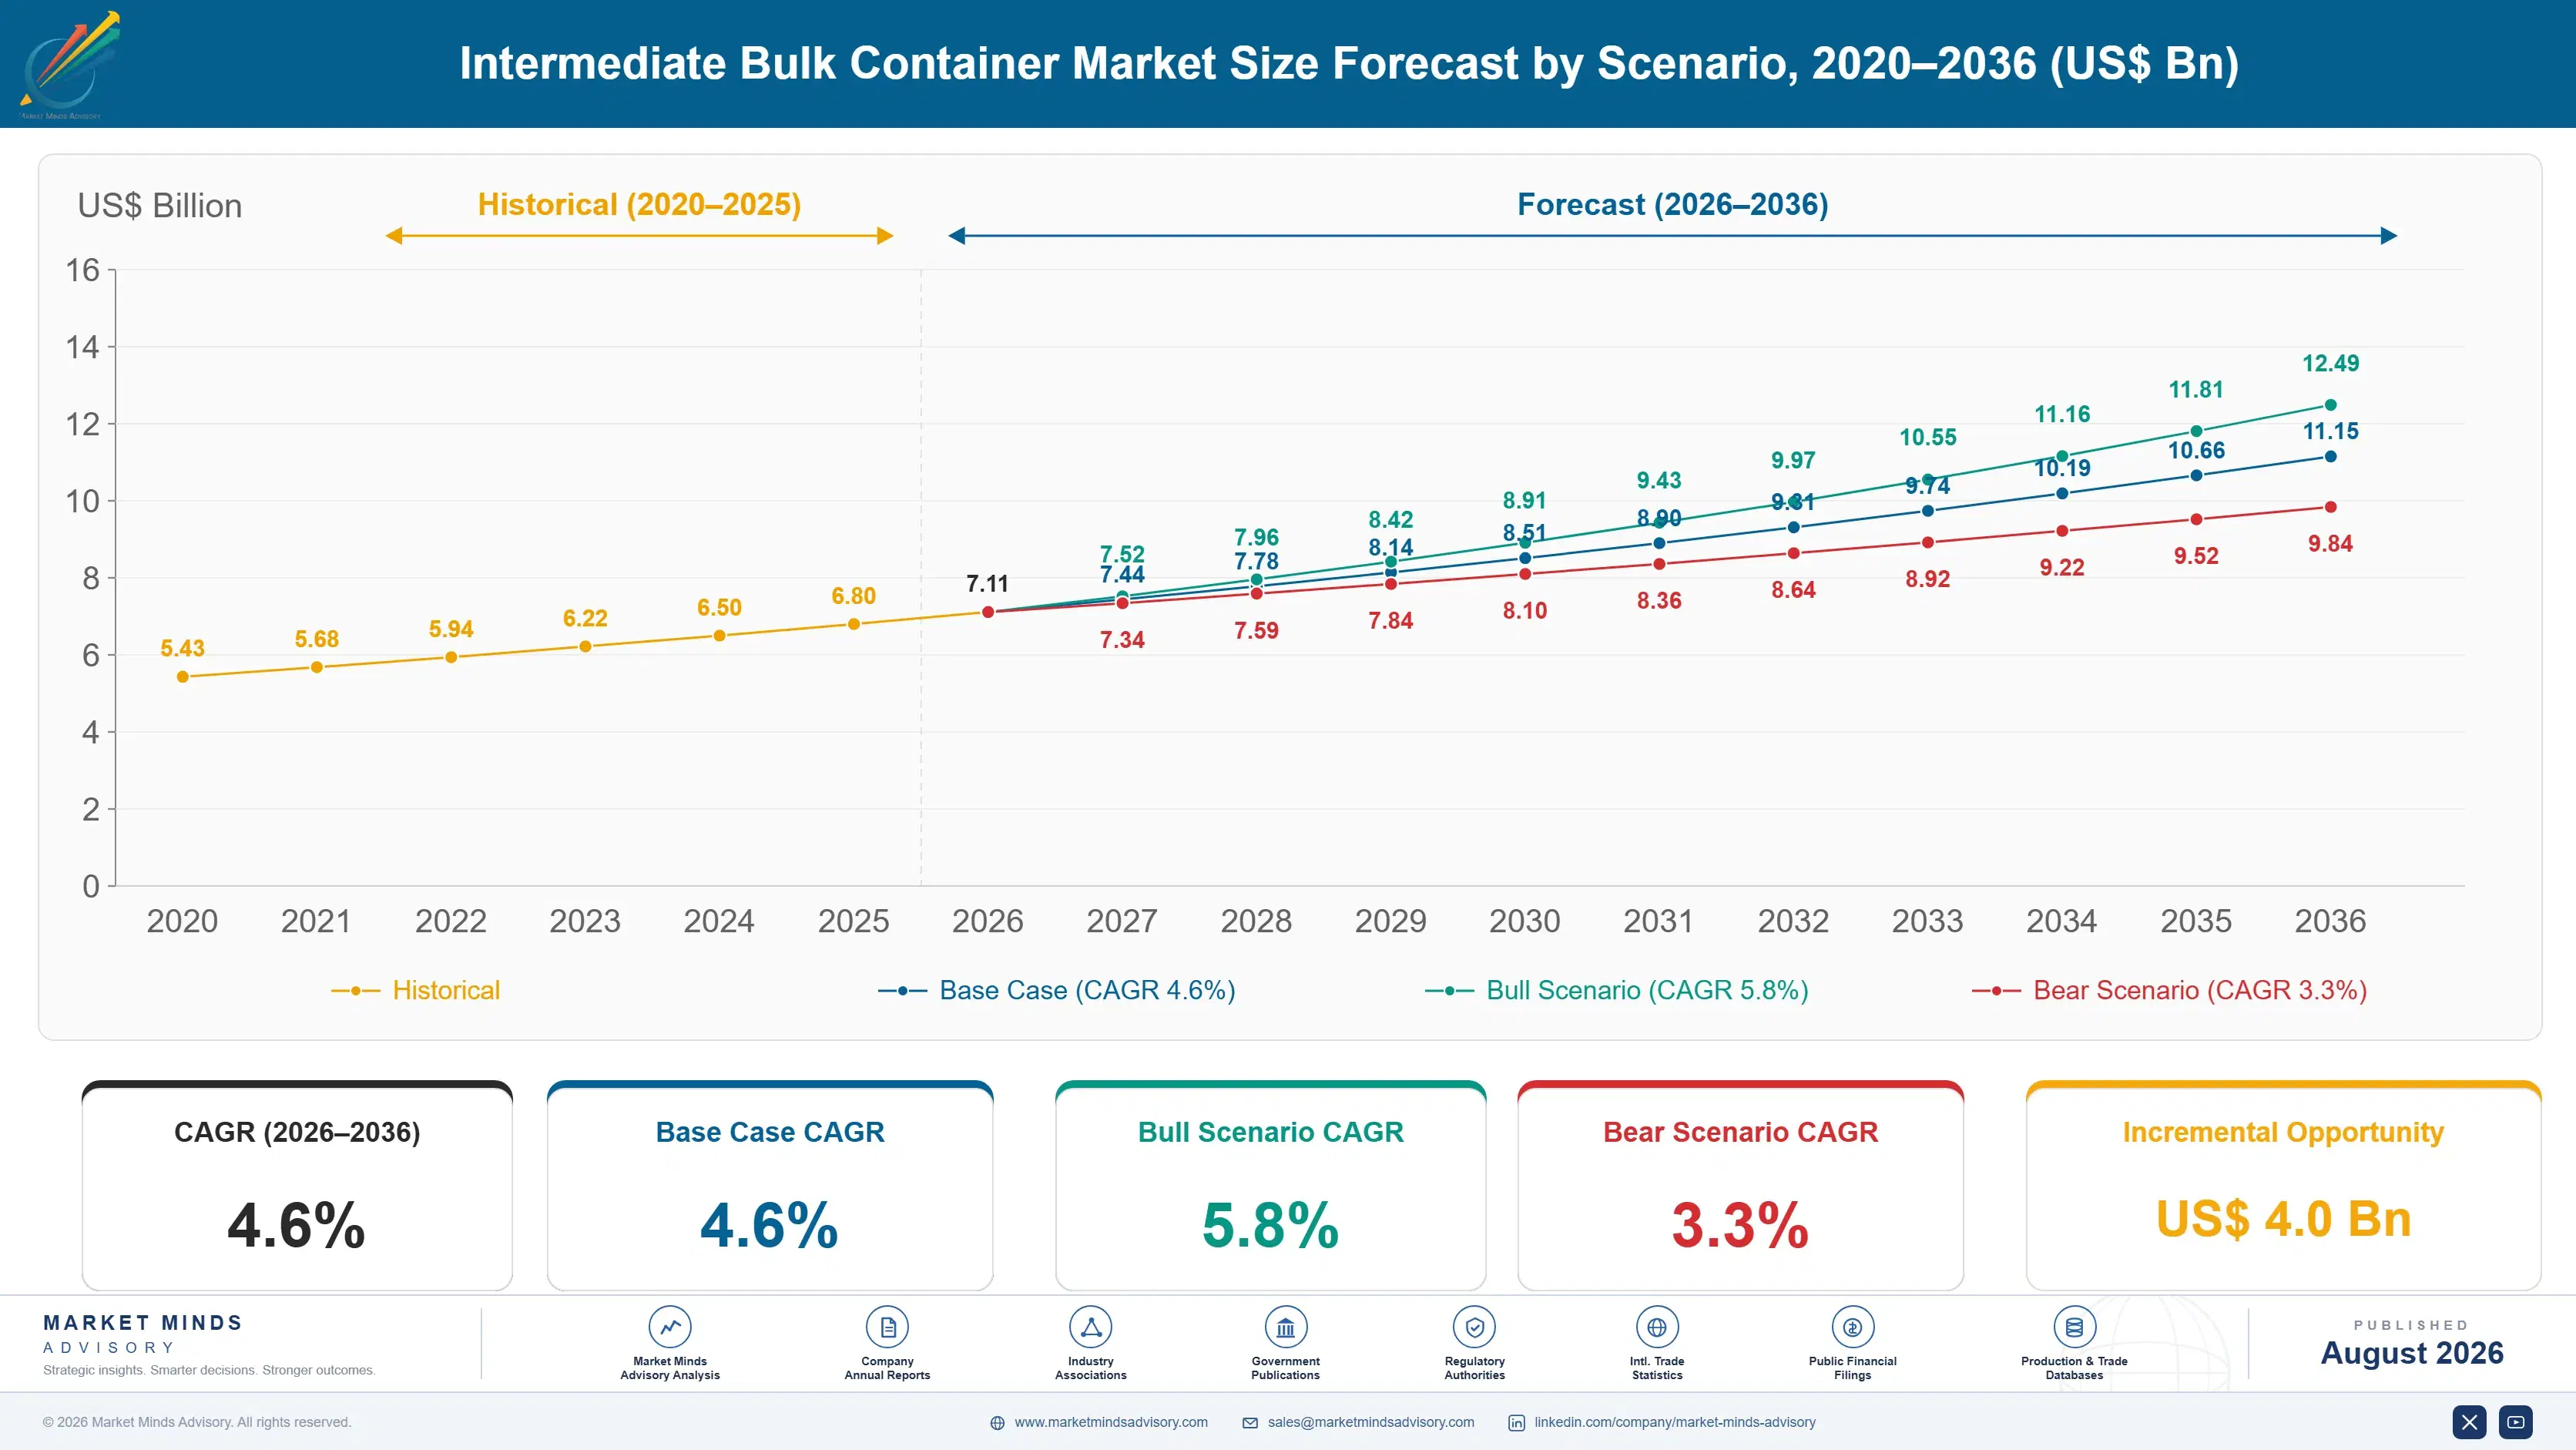
The market stands at USD 6.8 billion in 2025 and reaches USD 11.15 billion by 2036 at a 4.6% CAGR. Flexible intermediate bulk containers grow fastest at 7.8%, about 1.70 times the overall rate, as dry bulk chemical and agricultural shippers favour lighter, foldable packaging over rigid alternatives. East Asia holds 30% of value on dense chemical manufacturing demand, while India posts the quickest national growth at 8.5% on expanding bulk trade volume.
Concentration is moderate, with the top five holding roughly 42% of revenue against a fragmented tail of regional manufacturers and dedicated reconditioning operators competing on quite different economic models entirely across the value chain. Two forces reshape the field now. Reconditioning economics increasingly determine total cost of ownership more than original purchase price, and flexible bulk bags keep taking share from rigid plastic containers in dry goods applications specifically.
Market Definition
The intermediate bulk container market covers reusable industrial containers designed to store and transport liquids, powders, and granular materials in volumes between drums and tank trucks, spanning rigid plastic, composite, steel, and flexible container types sold to chemical, food, and industrial goods shippers. Drums, tank trucks, ISO tank containers, and single-trip retail packaging are excluded.
Base Year Value
$6.8B in 2025 (MMA Primary Research Dataset, August 2026)
Forecast Period
2026 to 2036, eleven discrete annual values
CAGR
4.6% base case. Bull 5.8%. Bear 3.3%.
Fastest Growth Segment
Flexible Intermediate Bulk Containers (FIBC): 7.8% CAGR
Fastest Growth Country
India: 8.5% CAGR
Fastest Growth Region
South Asia and Pacific: 6.7% CAGR
Largest Region
East Asia: 30% of 2025 global value
Market Leaders
Mauser Packaging Solutions, Greif, Schutz Container Systems, Snyder Industries, Time Technoplast. Source: MMA Analysis based on company annual reports.
Primary Survey
n=3,800 procurement and R&D decision-makers, Q4 2025, six countries
Methodology
Demand-side build-up, cross-validated against public data, 47 expert interviews

Intermediate Bulk Container Market Forecast Scenarios

intermediate-bulk-container-market-size-forecast-scenario-1787324771587
Growth from 2020 to 2025 compounded near 4.0%, tracking global chemical and industrial goods trade volume closely with only modest independent acceleration beyond that underlying trade growth across most major shipping corridors. Reconditioning infrastructure expanded meaningfully across the same period, extending average container service life and gradually reshaping unit economics across the whole value chain considerably.
Three mechanisms carry the base case to 4.6%. First, chemical and industrial goods trade volume keeps expanding gradually, and every additional shipment needs bulk container capacity matching cargo characteristics precisely. Second, flexible bulk bag adoption keeps displacing rigid containers in dry goods applications, since lower shipping weight and folding storage both cut logistics cost meaningfully. Third, reconditioning infrastructure keeps expanding, extending service life and shifting revenue toward the reconditioning value chain specifically.
The bull case at 5.8% assumes global trade volume accelerates further and flexible container adoption spreads faster than current manufacturing capacity plans suggest across every major region. The bear case at 3.3% assumes trade volume growth slows amid broader economic uncertainty and reconditioning extends average container service life further than new production demand can ever offset entirely.

Why Reconditioning Now Decides Who Actually Profits

Three converging forces set demand now. Chemical and industrial goods trade volume keeps expanding gradually, and every additional shipment needs bulk container capacity matching cargo characteristics precisely. Flexible bulk bag adoption keeps displacing rigid containers in dry goods applications, since lower shipping weight cuts logistics cost meaningfully across long shipping routes. And reconditioning infrastructure keeps expanding, extending average service life and shifting revenue toward
MARKET CONCENTRATIONCR5: 42%Moderately concentrated among global manufacturers and reconditioning networks
AVERAGE UNIT PRICEUSD 60 to 220 per containerBlended pricing varying considerably by material type and capacity
TOP PRODUCING COUNTRY SHAREChina: 26% of global unit outputChinese manufacturing scale supplying domestic and export chemical logistics
RECONDITIONING RATEAbout 65% of rigid containers reconditionedRigid containers returned for cleaning and reuse rather than scrapped
AVERAGE SERVICE LIFE5 to 10 reuse cyclesTypical trips completed before a rigid container reaches retirement
TRADE INTENSITYAbout 38% of volume cross-borderContainer volume moving across national borders in chemical logistics
The commercial character splits along ownership model almost entirely across every shipper segment. Large chemical shippers increasingly participate in container pooling and reconditioning programmes that reduce total cost of ownership below what one-way purchase alone could deliver. Smaller shippers instead purchase or lease individual containers outright, treating bulk handling equipment as a straightforward capital or operating expense decision without pooling complexity.
The next decade turns on reconditioning economics and material substitution together across the whole industry. Operators who master reconditioning logistics capture value original manufacturers increasingly cannot access once a container leaves the factory. Flexible bulk bag adoption keeps eroding rigid plastic and steel container share in dry goods applications specifically, and that substitution shows no sign of reversing.
"Everyone still models this market like a container sale happens once and that is the end of the transaction. It isn't. The container gets refilled thirty or forty times, and every one of those cycles is a commercial event somebody else is now capturing instead of the original manufacturer."
Director, Industrial Packaging and Bulk Logistics Practice · MMA Packaging / Ind

Market Trends

Reconditioning Economics Increasingly Determine Total Cost

Large chemical shippers increasingly evaluate bulk containers on total cost of ownership across multiple reuse cycles rather than initial purchase price alone, recognising that a well-maintained rigid container can complete five to ten trips before retirement. Mauser Packaging Solutions and Greif have both built substantial dedicated reconditioning networks specifically targeting this demand, recognising that reconditioning revenue increasingly rivals new container sales in commercial importance. The commercial consequence is that container specification decisions now weigh reconditioning compatibility as heavily as initial cost, and manufacturers without reconditioning infrastructure increasingly lose large shipper contracts to those who have built it.
Market Impact: Chemical trade volume grows 3-4%
Flexible Bulk Bags Keep Displacing Rigid Dry Goods Containers

Flexible intermediate bulk containers, essentially large woven polypropylene bags, weigh considerably less than rigid alternatives while folding flat for return shipment, cutting both outbound and backhaul logistics cost meaningfully for dry goods shippers specifically. Jumbo Bag Limited and Emmbi Industries have both scaled flexible container manufacturing substantially, targeting agricultural and construction material shippers previously served almost entirely by rigid containers. The commercial consequence is that rigid container manufacturers increasingly compete for a shrinking dry goods segment while flexible bag manufacturers capture that displaced volume, reshaping competitive positioning across the whole industry considerably.
Market Impact: Service life extends to 5-10 trips

Market Opportunities and Growth Drivers

Chemical And Industrial Trade Volume Keeps Expanding Steadily

Global chemical production and trade volume keeps growing gradually as manufacturing capacity expands across Asia and shipping networks connect production regions to consumption markets more efficiently than in prior decades of comparatively fragmented logistics. Every additional tonne of liquid or granular chemical shipped needs bulk container capacity matching the cargo's specific handling and regulatory requirements, since chemical shippers cannot simply substitute alternative packaging without full recertification. That steady underlying trade growth provides a demand floor container manufacturers can plan capacity investment against with genuine confidence, unlike more cyclical industrial categories facing sharper demand swings.
Market Impact: Reconditioning rate reaches 65%

Reconditioning Infrastructure Expansion Extends Container Service Life

Dedicated reconditioning facilities operated by Mauser Packaging Solutions, Greif, and regional specialists clean, inspect, and recertify rigid containers for reuse, extending average service life to 5 to 10 trips rather than the single use earlier container generations often received. That extended service life reduces new container demand per unit of shipped cargo, but it also creates a substantial recurring service revenue stream original manufacturers increasingly capture through owned reconditioning networks rather than ceding to independent operators. Reconditioning capacity investment has become a genuine competitive battleground alongside original manufacturing capability itself.
Market Impact: Certification testing adds 6-12 mon

Market Restraints and Challenges

Reconditioning Cannibalises New Container Manufacturing Demand

Every container that gets reconditioned and returned to service represents a new container sale that does not happen, and reconditioning rates near 65% for rigid containers mean the majority of existing capacity is reused rather than replaced. The root cause is that reconditioning economics genuinely favour shippers and, increasingly, reconditioning operators over original manufacturers dependent on new unit sales for revenue. Commercially this compresses new manufacturing volume growth well below what trade volume growth alone would suggest. Manufacturers are mitigating the cannibalisation by building their own reconditioning networks and capturing that recurring revenue directly rather than ceding it.
Market Impact: Reconditioned units cost 40-60% les

Regulatory Certification Requirements Constrain Design Flexibility

Bulk containers carrying hazardous or regulated chemicals must meet United Nations packaging certification standards that constrain material choice, wall thickness, and design specifications far more tightly than general industrial packaging categories ever face. The root cause is that certification testing is expensive and time-consuming, so manufacturers cannot iterate container design as quickly as less regulated packaging categories can respond to shifting customer preference. Commercially this slows innovation and favours established manufacturers with existing certified product lines over newer entrants. Manufacturers are mitigating the constraint through modular design platforms that preserve certification across minor specification variations.
Market Impact: Flexible bags grow 7.8% annually
4 additional market trends, 3 additional growth drivers, and 2 additional restraints and challenges are covered in the full report. Contact sales@marketmindsadvisory.com to access the complete intelligence.

Segment CAGR and Growth Architecture

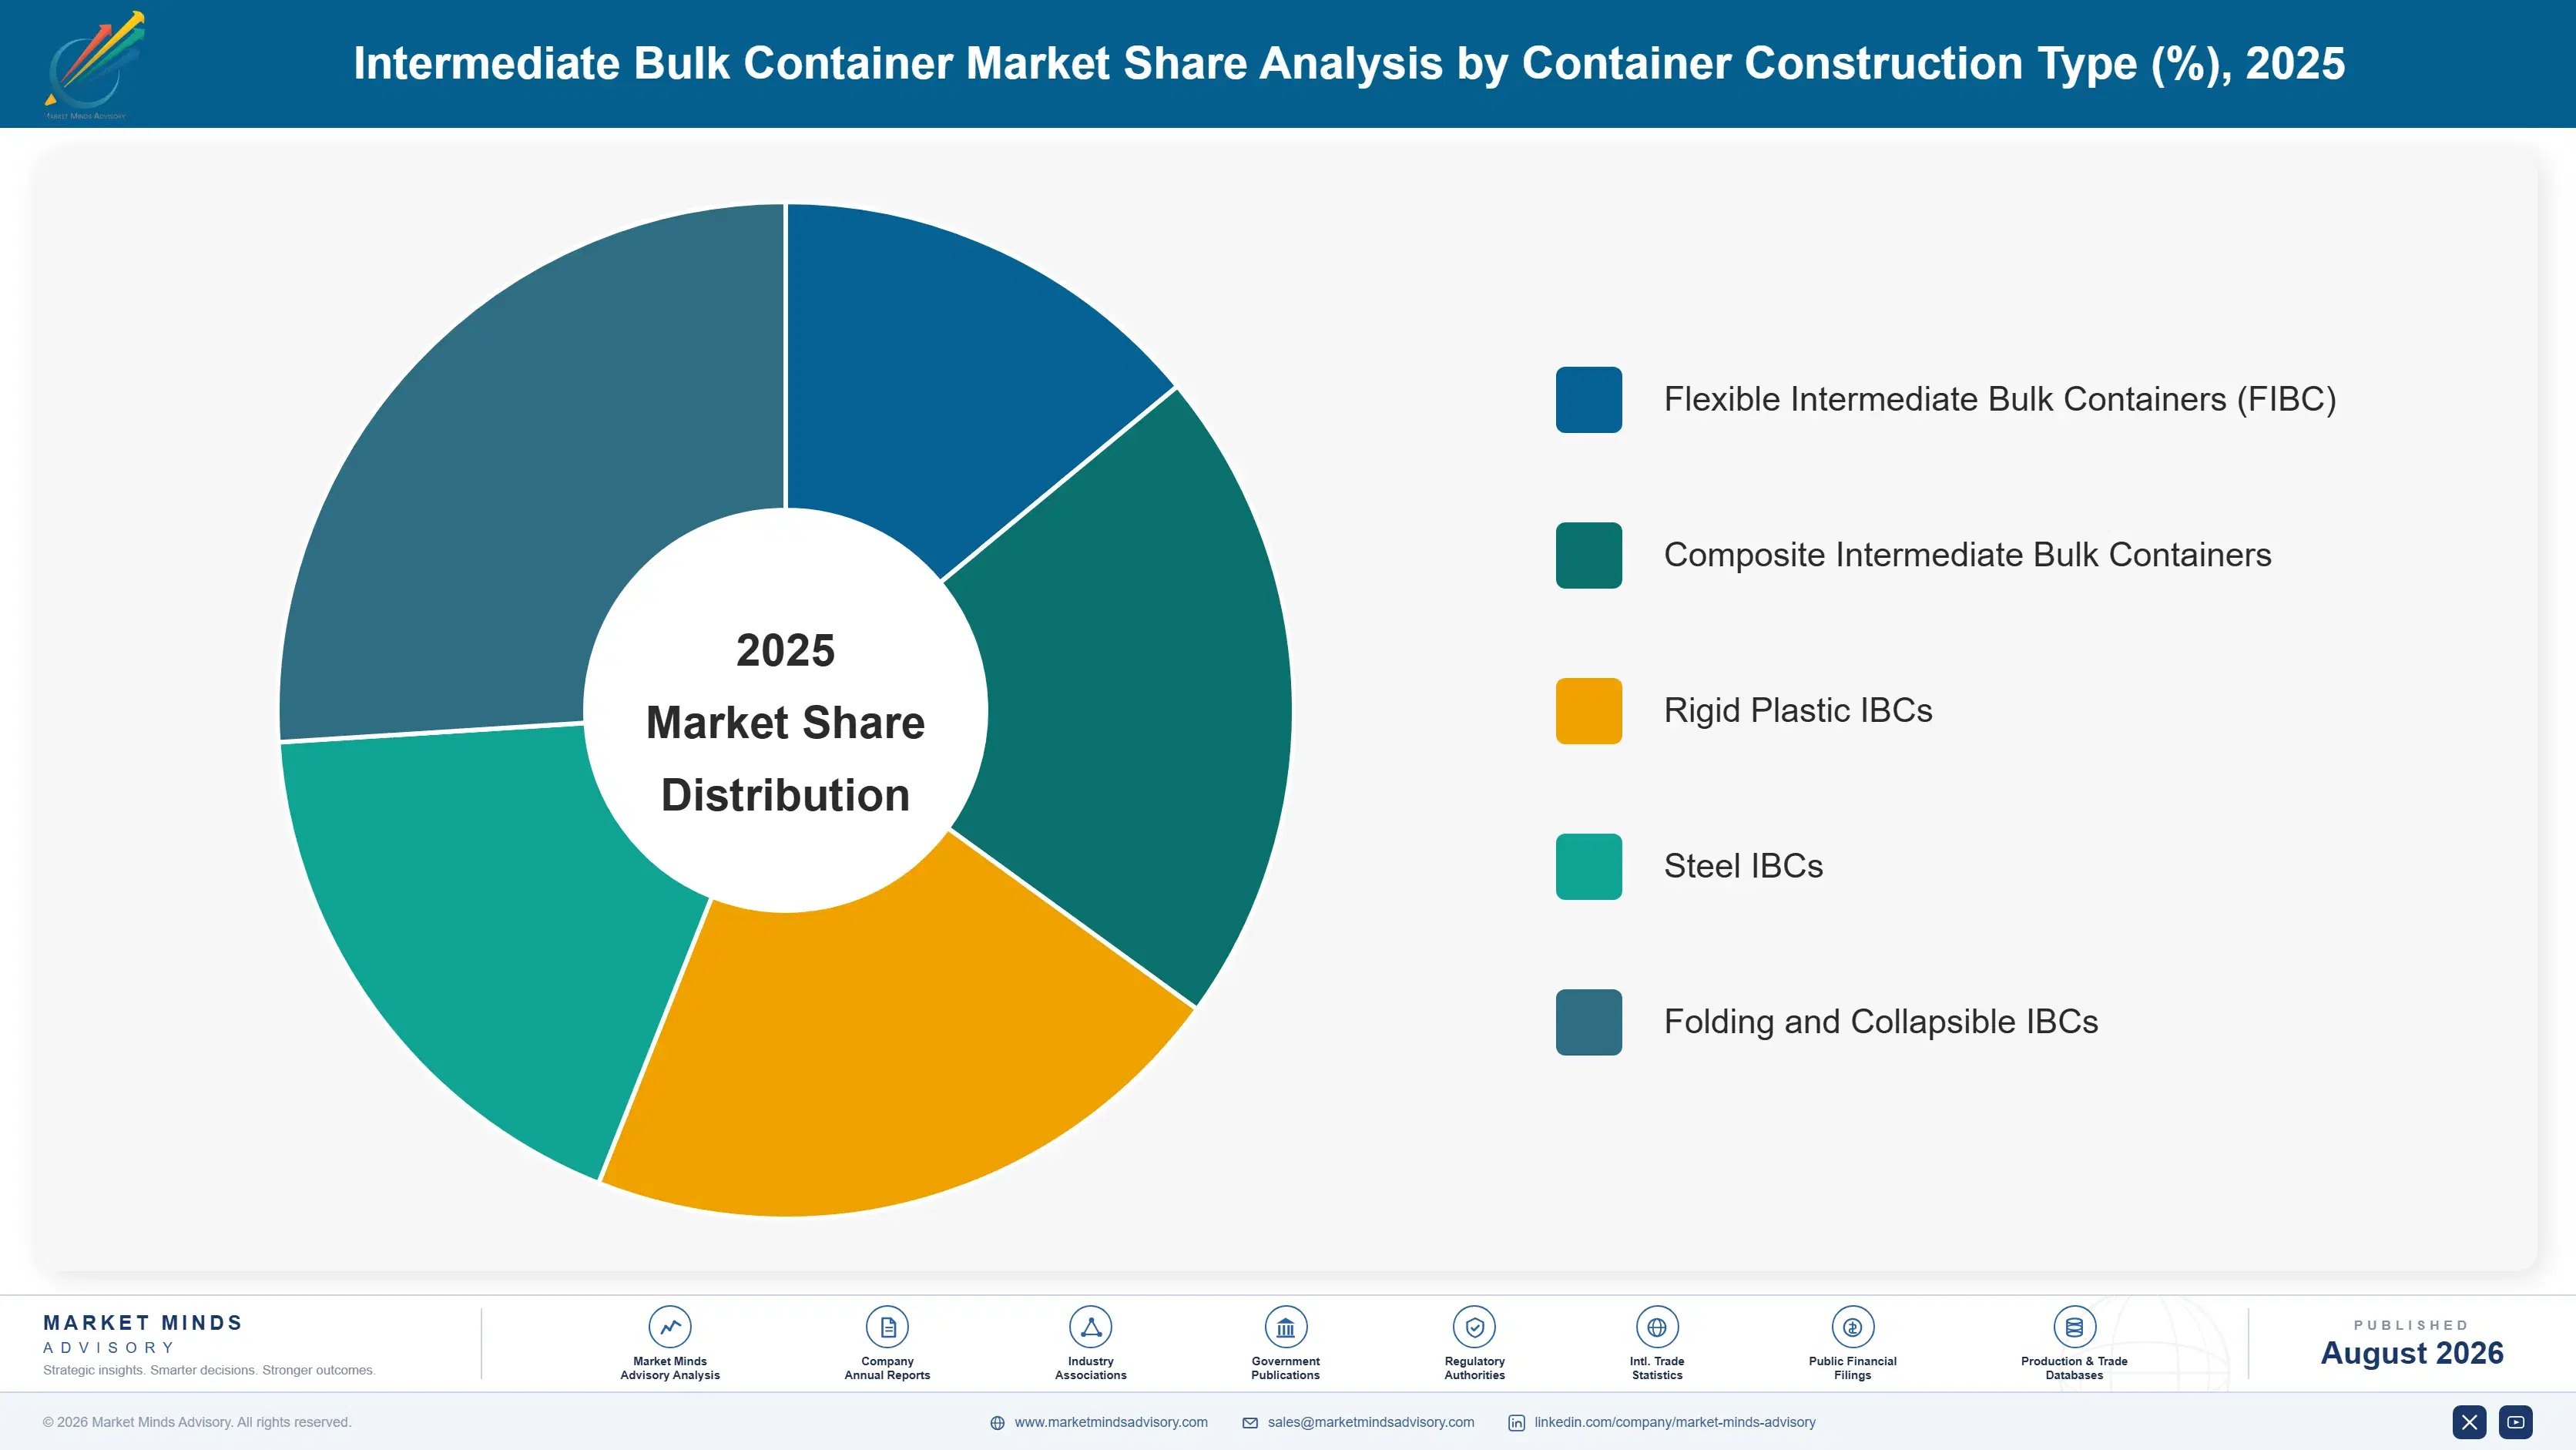
Segmentation follows container construction type, a single engineering logic describing what the container is actually built from and how it handles cargo in transit. Each type carries its own weight, durability, and reconditioning profile, so commercial position tracks construction type rather than the cargo carried. End-use application and ownership model appear separately in the framework.
intermediate-bulk-container-market-market-share-analysis-1787324772119

Flexible Intermediate Bulk Containers (FIBC)

Flexible intermediate bulk containers grow fastest at 7.8%, about 1.70 times the overall 4.6% rate, covering large woven polypropylene bags that fold flat for return shipment and weigh considerably less than rigid alternatives carrying comparable cargo volume. Agricultural and construction material shippers increasingly favour flexible containers for dry bulk cargo, since lower shipping weight and folding storage both cut logistics cost meaningfully across long shipping routes. Jumbo Bag Limited and Emmbi Industries have both scaled manufacturing substantially to serve this demand, targeting segments previously served almost entirely by rigid plastic and steel containers. The segment carries considerably lower reconditioning potential than rigid alternatives, since flexible material degrades faster under repeated reuse cycles.
CAGR 7.8%

Composite Intermediate Bulk Containers

Composite intermediate bulk containers grow second-fastest at 6.2%, combining a plastic inner bottle with an outer steel or plastic cage that provides structural support while keeping unit weight manageable for handling and transport across the supply chain. This construction type dominates liquid chemical and food-grade applications specifically, since the plastic bottle can be replaced independently of the reusable cage structure during reconditioning, extending effective service life considerably beyond single-material alternatives available elsewhere. Mauser Packaging Solutions and Schutz Container Systems both hold strong positions in this category, having built dedicated reconditioning infrastructure specifically around bottle replacement economics. Growth reflects both rising chemical trade volume and the segment's favourable reconditioning economics relative to fully rigid alternatives.
CAGR 6.2%
Full segment breakdown across 5 segments available in the complete report.

Regional Architecture and Country Demand Map

Chemical manufacturing density and trade flow patterns together set this distribution across the seven regions tracked here almost entirely on their own. East Asia leads on dense chemical manufacturing demand, while share elsewhere tracks how much bulk chemical and industrial trade each region genuinely generates.

North America

North America holds 24% of value, and dense chemical manufacturing along the Gulf Coast provides the deepest single demand concentration anywhere in the region by a considerable margin over other domestic clusters. Mauser Packaging Solutions and Greif both operate extensive reconditioning networks domestically, capturing recurring service revenue across multiple container generations in active circulation. Regulatory requirements for hazardous material transport certification run comparatively strict here, favouring established manufacturers with proven certified product lines over newer market entrants. Cross-border trade with Mexico under regional trade agreements adds meaningful incremental volume beyond purely domestic chemical shipments. Growth of 4.9% tracks chemical trade volume and reconditioning network expansion together, reinforcing each other steadily.
Share: 24% | CAGR: 4.9% (2026 to 2036)

Western Europe

Western Europe holds 22% of value, and the continent's mature, highly regulated chemical industry provides steady demand even as manufacturing capacity growth has slowed relative to Asian production expansion in recent years. Schutz Container Systems and other European manufacturers hold genuine technology leadership in composite container design, reflecting decades of chemical industry engineering collaboration built up over time. Stringent European Union chemical transport regulation keeps certification standards among the strictest globally, a burden smaller manufacturers increasingly struggle to sustain independently. Reconditioning infrastructure here is among the most mature anywhere, reflecting decades of industry investment in circular container economics. Growth of 3.1%, the slowest of the seven regions, reflects a mature chemical manufacturing base facing limited capacity expansion.
Share: 22% | CAGR: 3.1% (2026 to 2036)
Regional intelligence for 5 additional markets available in the complete report: East Asia, South Asia and Pacific, Latin America, Middle East and Africa, Eastern Europe. Contact sales@marketmindsadvisory.com.
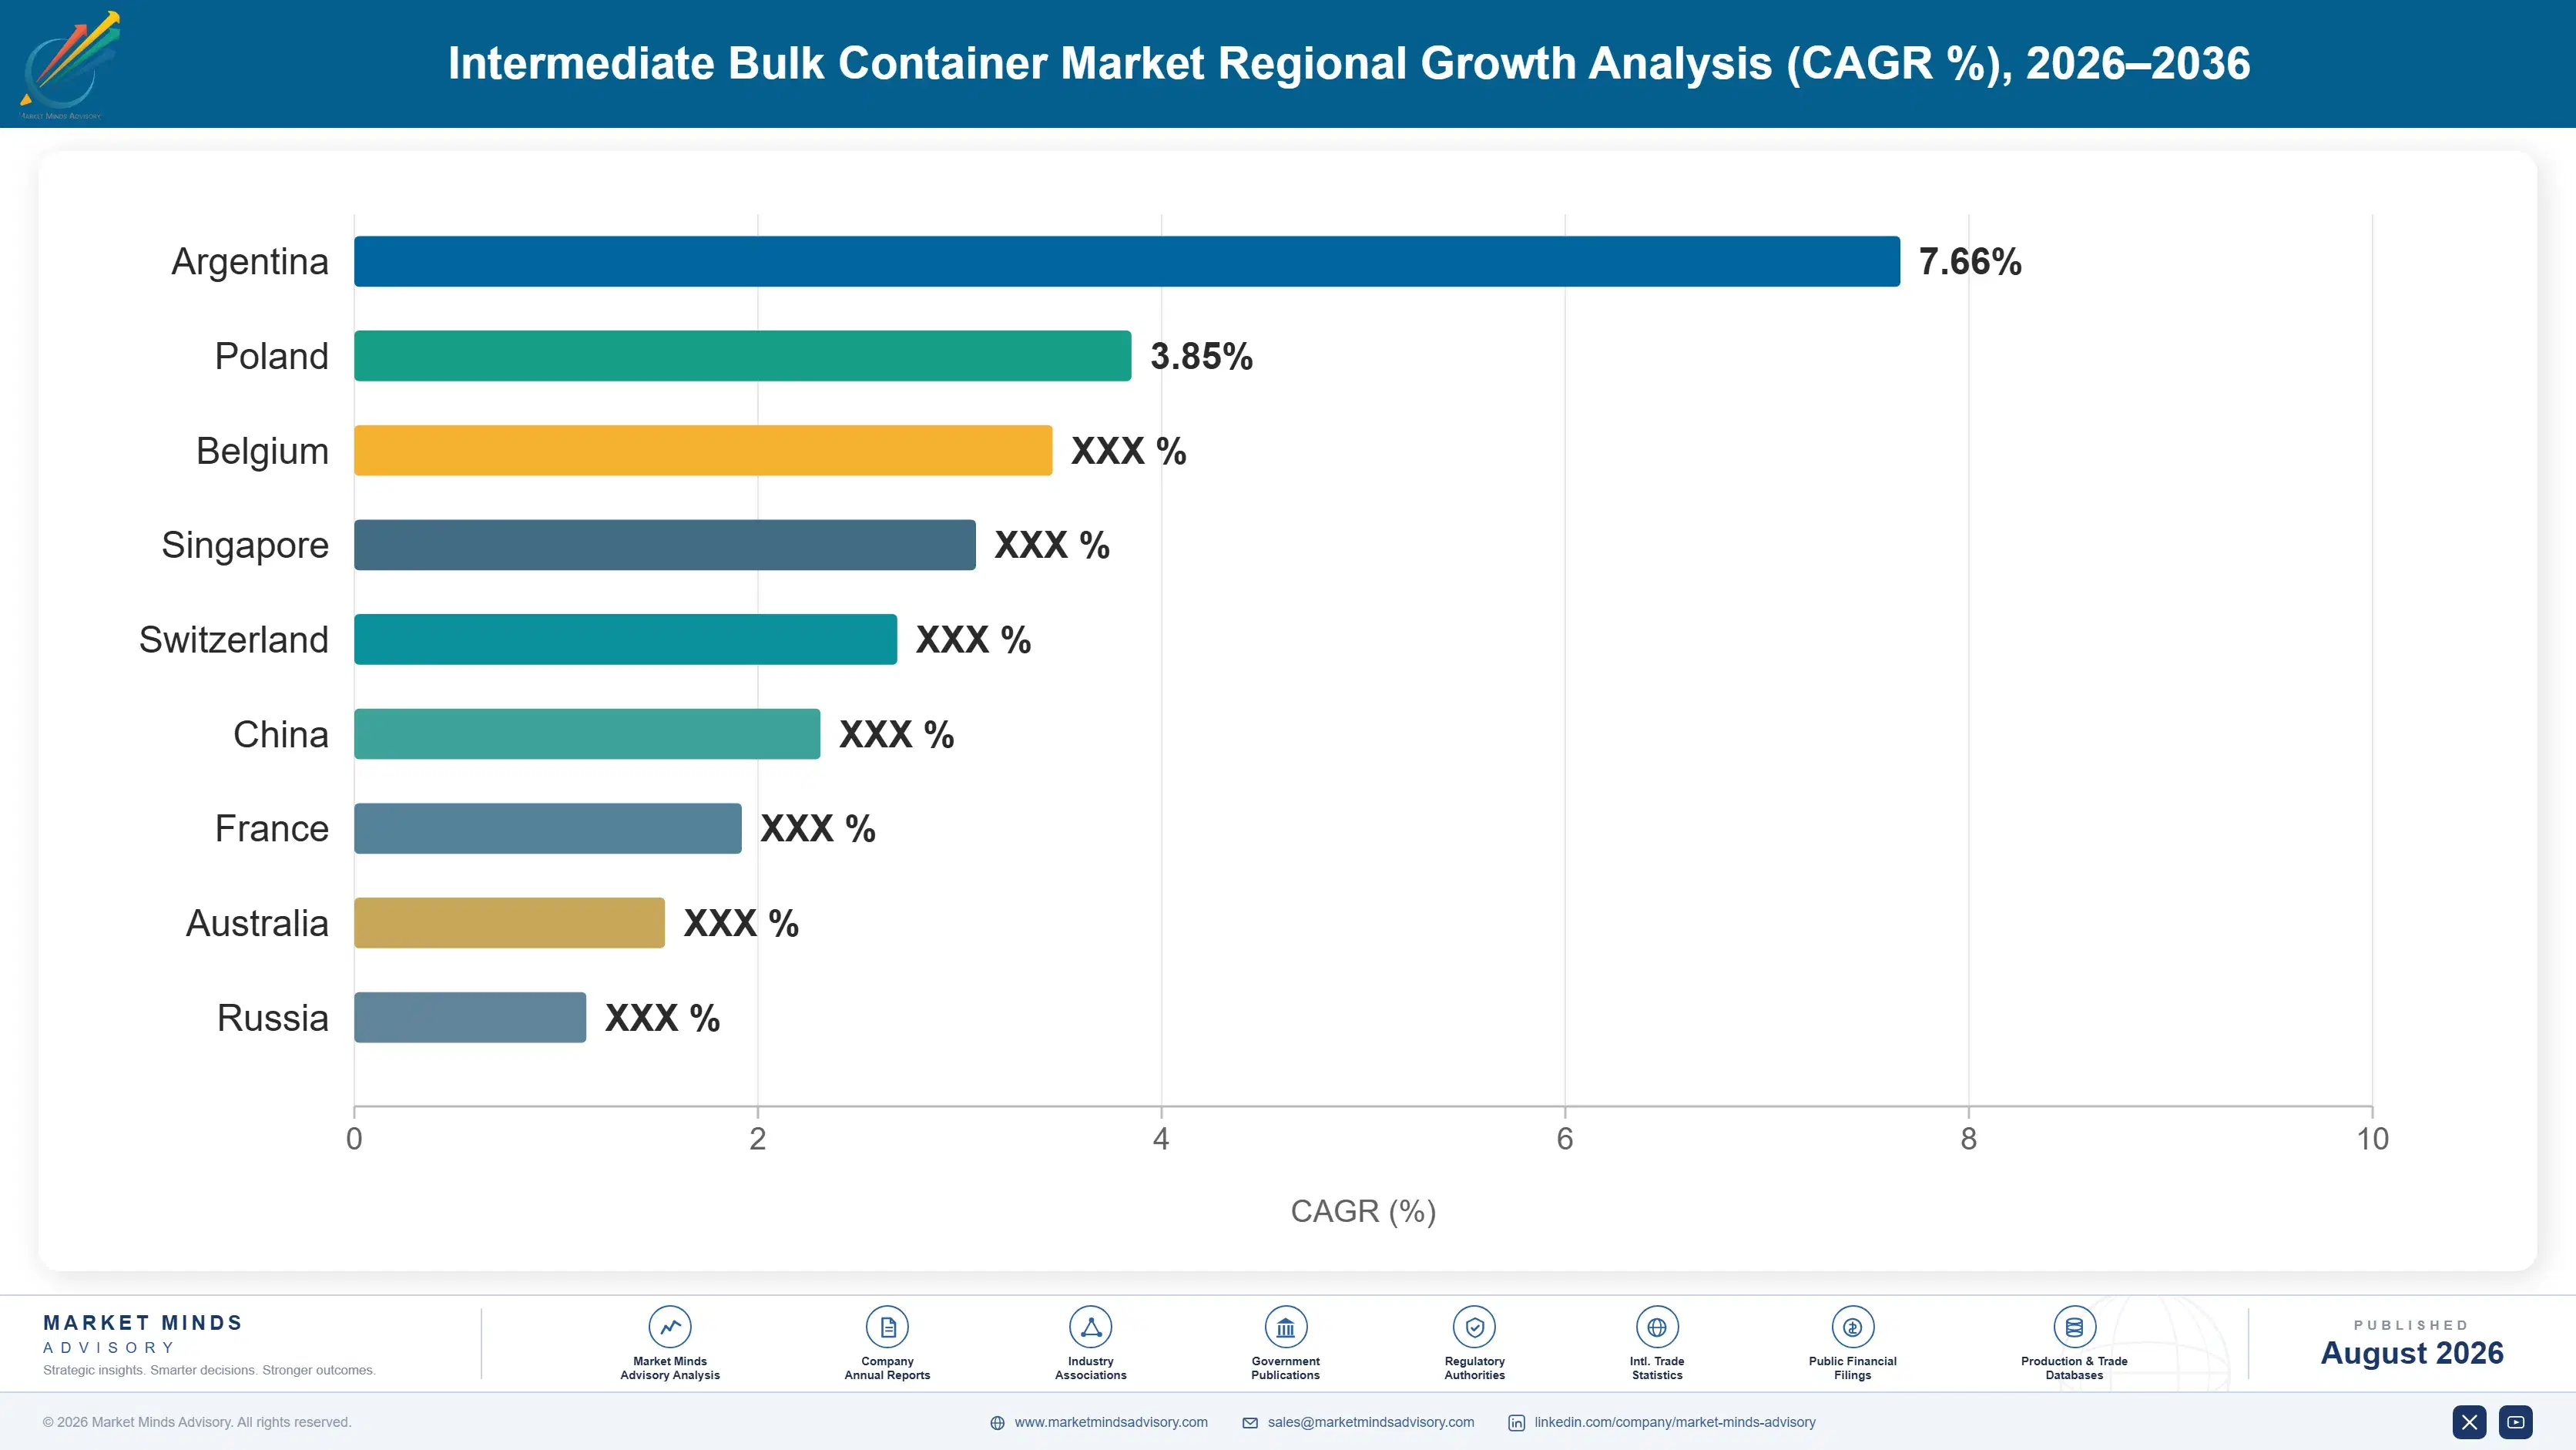
intermediate-bulk-container-market-country-cagr-analysis-1787324772630

Where Container Value Survives Reconditioning Erosion

Selling only new containers against a market where 65% of rigid units get reconditioned instead of replaced is a race manufacturers relying purely on new sales are already losing steadily, year after year. The four moves below shift value toward positions reconditioning cannot erode: owned reconditioning networks, flexible container capability, certification depth, and pooling programme participation.

Build Owned Reconditioning Networks Rather Than Cede Them

Reconditioning rates near 65% for rigid containers mean the majority of existing capacity gets reused rather than replaced, and every reconditioning cycle a manufacturer does not capture becomes revenue an independent reconditioner captures instead across the whole product lifetime and beyond. Mauser Packaging Solutions and Greif have both built substantial dedicated reconditioning infrastructure specifically to capture that recurring service revenue rather than ceding it entirely to third parties operating independently and outside their control. Manufacturers without owned reconditioning networks increasingly lose large shipper contracts to those who have built this capability directly and at scale.
Market Impact: Reconditioning captures 40% to 60%

Expand Flexible Container Manufacturing To Capture Displacement

Flexible intermediate bulk containers grow at 7.8% against a market at 4.6%, capturing dry goods volume rigid container manufacturers historically served almost entirely on their own for decades of steady demand. That displacement represents a genuine capability many rigid-only manufacturers have not yet built, since flexible container manufacturing requires different tooling and material science than rigid plastic or steel production uses across the whole process. Manufacturers adding flexible product lines capture share from competitors still selling rigid-only into a segment increasingly preferring lighter, foldable packaging over bulky alternatives that cost more to ship both ways.
Market Impact: Flexible segment outgrows the marke

Maintain Certification Depth Ahead Of Competitors' Product Lines

United Nations packaging certification testing adds 6 to 12 months to new product development, and manufacturers with established certified product lines win contracts newer entrants without comparable certification simply cannot bid for at all in this specific category of regulated goods. That certification barrier protects incumbent margin considerably longer than most industrial packaging categories allow competitors without it to compete on price alone across the tender process. Manufacturers should treat certification breadth as a genuine strategic asset worth continued investment, not merely a compliance cost line item to minimise wherever possible.
Market Impact: Certification adds 6 to 12 months p

Participate In Shipper Pooling Programmes For Recurring Volume

Large chemical shippers increasingly participate in container pooling programmes that guarantee recurring reconditioning and replacement volume to participating manufacturers over multi-year agreements spanning 3 to 5 years rather than one-off purchase transactions negotiated separately each time a shipment moves. Manufacturers who join or establish pooling programmes lock in predictable, contracted revenue that spot-market new container sales alone cannot provide with comparable certainty across an entire fiscal year. That recurring relationship also generates valuable usage data informing future product design and reconditioning process improvement, compounding the advantage considerably over time as the dataset grows.
Market Impact: Pooling programmes lock in 3 to 5 y

Who Controls the Margin Pool

Concentration is moderate: the top five hold roughly 42% of revenue, spanning integrated manufacturers with owned reconditioning networks and regional producers competing on quite different commercial models across every material type. The gap between leaders and challengers is reconditioning infrastructure and certification breadth rather than manufacturing scale alone, which is widely distributed across dozens of credible producers. All participants are assessed on one basis, revenue from bulk
Competition runs along three lines. First, reconditioning network scale, since manufacturers capturing recurring service revenue outperform those relying purely on new unit sales at comparable price. Second, certification breadth, where established product lines win contracts newer entrants cannot bid for. Third, flexible container capability, since rigid-only manufacturers are losing dry goods volume to specialists building comparable capacity.

Pressure is building from two directions. Flexible container manufacturers including Jumbo Bag Limited are winning dry goods volume from rigid-only competitors slower to diversify product lines at comparable pace. Meanwhile independent reconditioning operators are capturing service revenue original manufacturers without owned networks cannot access directly. Rankings should favour companies with genuine reconditioning infrastructure and flexible container capability over those competing on new unit price alone.
intermediate-bulk-container-market-company-positioning-matrix-1787324773152

Competitive Moat and Risk Dimensions

MAUSER PACKAGING SOLUTIONS

Moat: Reconditioning network and material breadth

Mauser Packaging Solutions operates one of the most extensive reconditioning networks globally, giving it recurring service revenue and customer relationships competitors relying purely on new sales take years to build. Its breadth across rigid, composite, and steel container types lets it serve shippers across their full container portfolio rather than a single material category alone.
MAUSER PACKAGING SOLUTIONS

Risk: Reconditioning cannibalises new unit sales

A meaningful share of Mauser's own new container volume faces cannibalisation from its own reconditioning success, creating an internal tension between maximising reconditioning revenue and protecting new unit sales that competitors without comparable reconditioning scale do not face directly. Flexible container competitors are also capturing dry goods volume outside Mauser's core rigid container strength.
GREIF

Moat: Composite container reconditioning economics

Greif holds genuine technology leadership in composite container design, where the plastic bottle can be replaced independently of the reusable steel cage during reconditioning, extending effective service life considerably. Deep relationships with large chemical shippers give it pooling programme scale smaller competitors struggle to match.
GREIF

Risk: Flexible container segment gap

Greif's manufacturing scale and expertise concentrate heavily in rigid and composite containers, leaving it less positioned in the flexible container segment growing fastest across the market overall. Specialist flexible manufacturers without that internal focus on rigid categories can move faster on flexible product development specifically.

Players Tracked

Prominent Players

Mauser Packaging Solutions
Greif
Schutz Container Systems
Snyder Industries
Time Technoplast

Other Key Players

Balmer Lawrie
Thielmann
Bulk Lift International
Hoover Ferguson Group
Nittel GmbH
CDF Corporation
Werit Kunststoffwerke
LC Packaging
Conitex Sonoco
National Bulk Equipment
Custom Metalcraft
Bulkmatic Transport
Flexpack Systems
Jumbo Bag Limited
Emmbi Industries

Recent Developments

MARCH 2025

Mauser Packaging Solutions expands reconditioning capacity in the Netherlands

Mauser Packaging Solutions commissioned an expanded reconditioning facility in the Netherlands, adding capacity to serve growing chemical shipper demand for verified reconditioned composite containers. This was an organic capacity expansion rather than any acquisition or joint venture, targeting the segment where reconditioning increasingly wins shipper contracts.
Signal: Reconditioning capacity investment tracks
SEPTEMBER 2024

Greif signs multi-year pooling agreement with major chemical shipper

Greif signed a multi-year pooling agreement with a major chemical shipper for composite container supply and reconditioning services across a substantial portion of the shipper's bulk liquid logistics network worldwide. This was a supply and service agreement rather than an acquisition or merger, reflecting shippers increasingly favouring pooling arrangements.
Signal: Multi-year pooling agreements signal shipp
JANUARY 2025

UN updates composite container certification testing protocols

Regulators finalised updated United Nations packaging certification testing protocols for composite intermediate bulk containers, clarifying requirements that had left several manufacturers uncertain about compliance timelines for months. This was a regulatory standards update rather than any corporate transaction, affecting certification timelines across the whole industry.
Signal: Updated certification protocols directly d

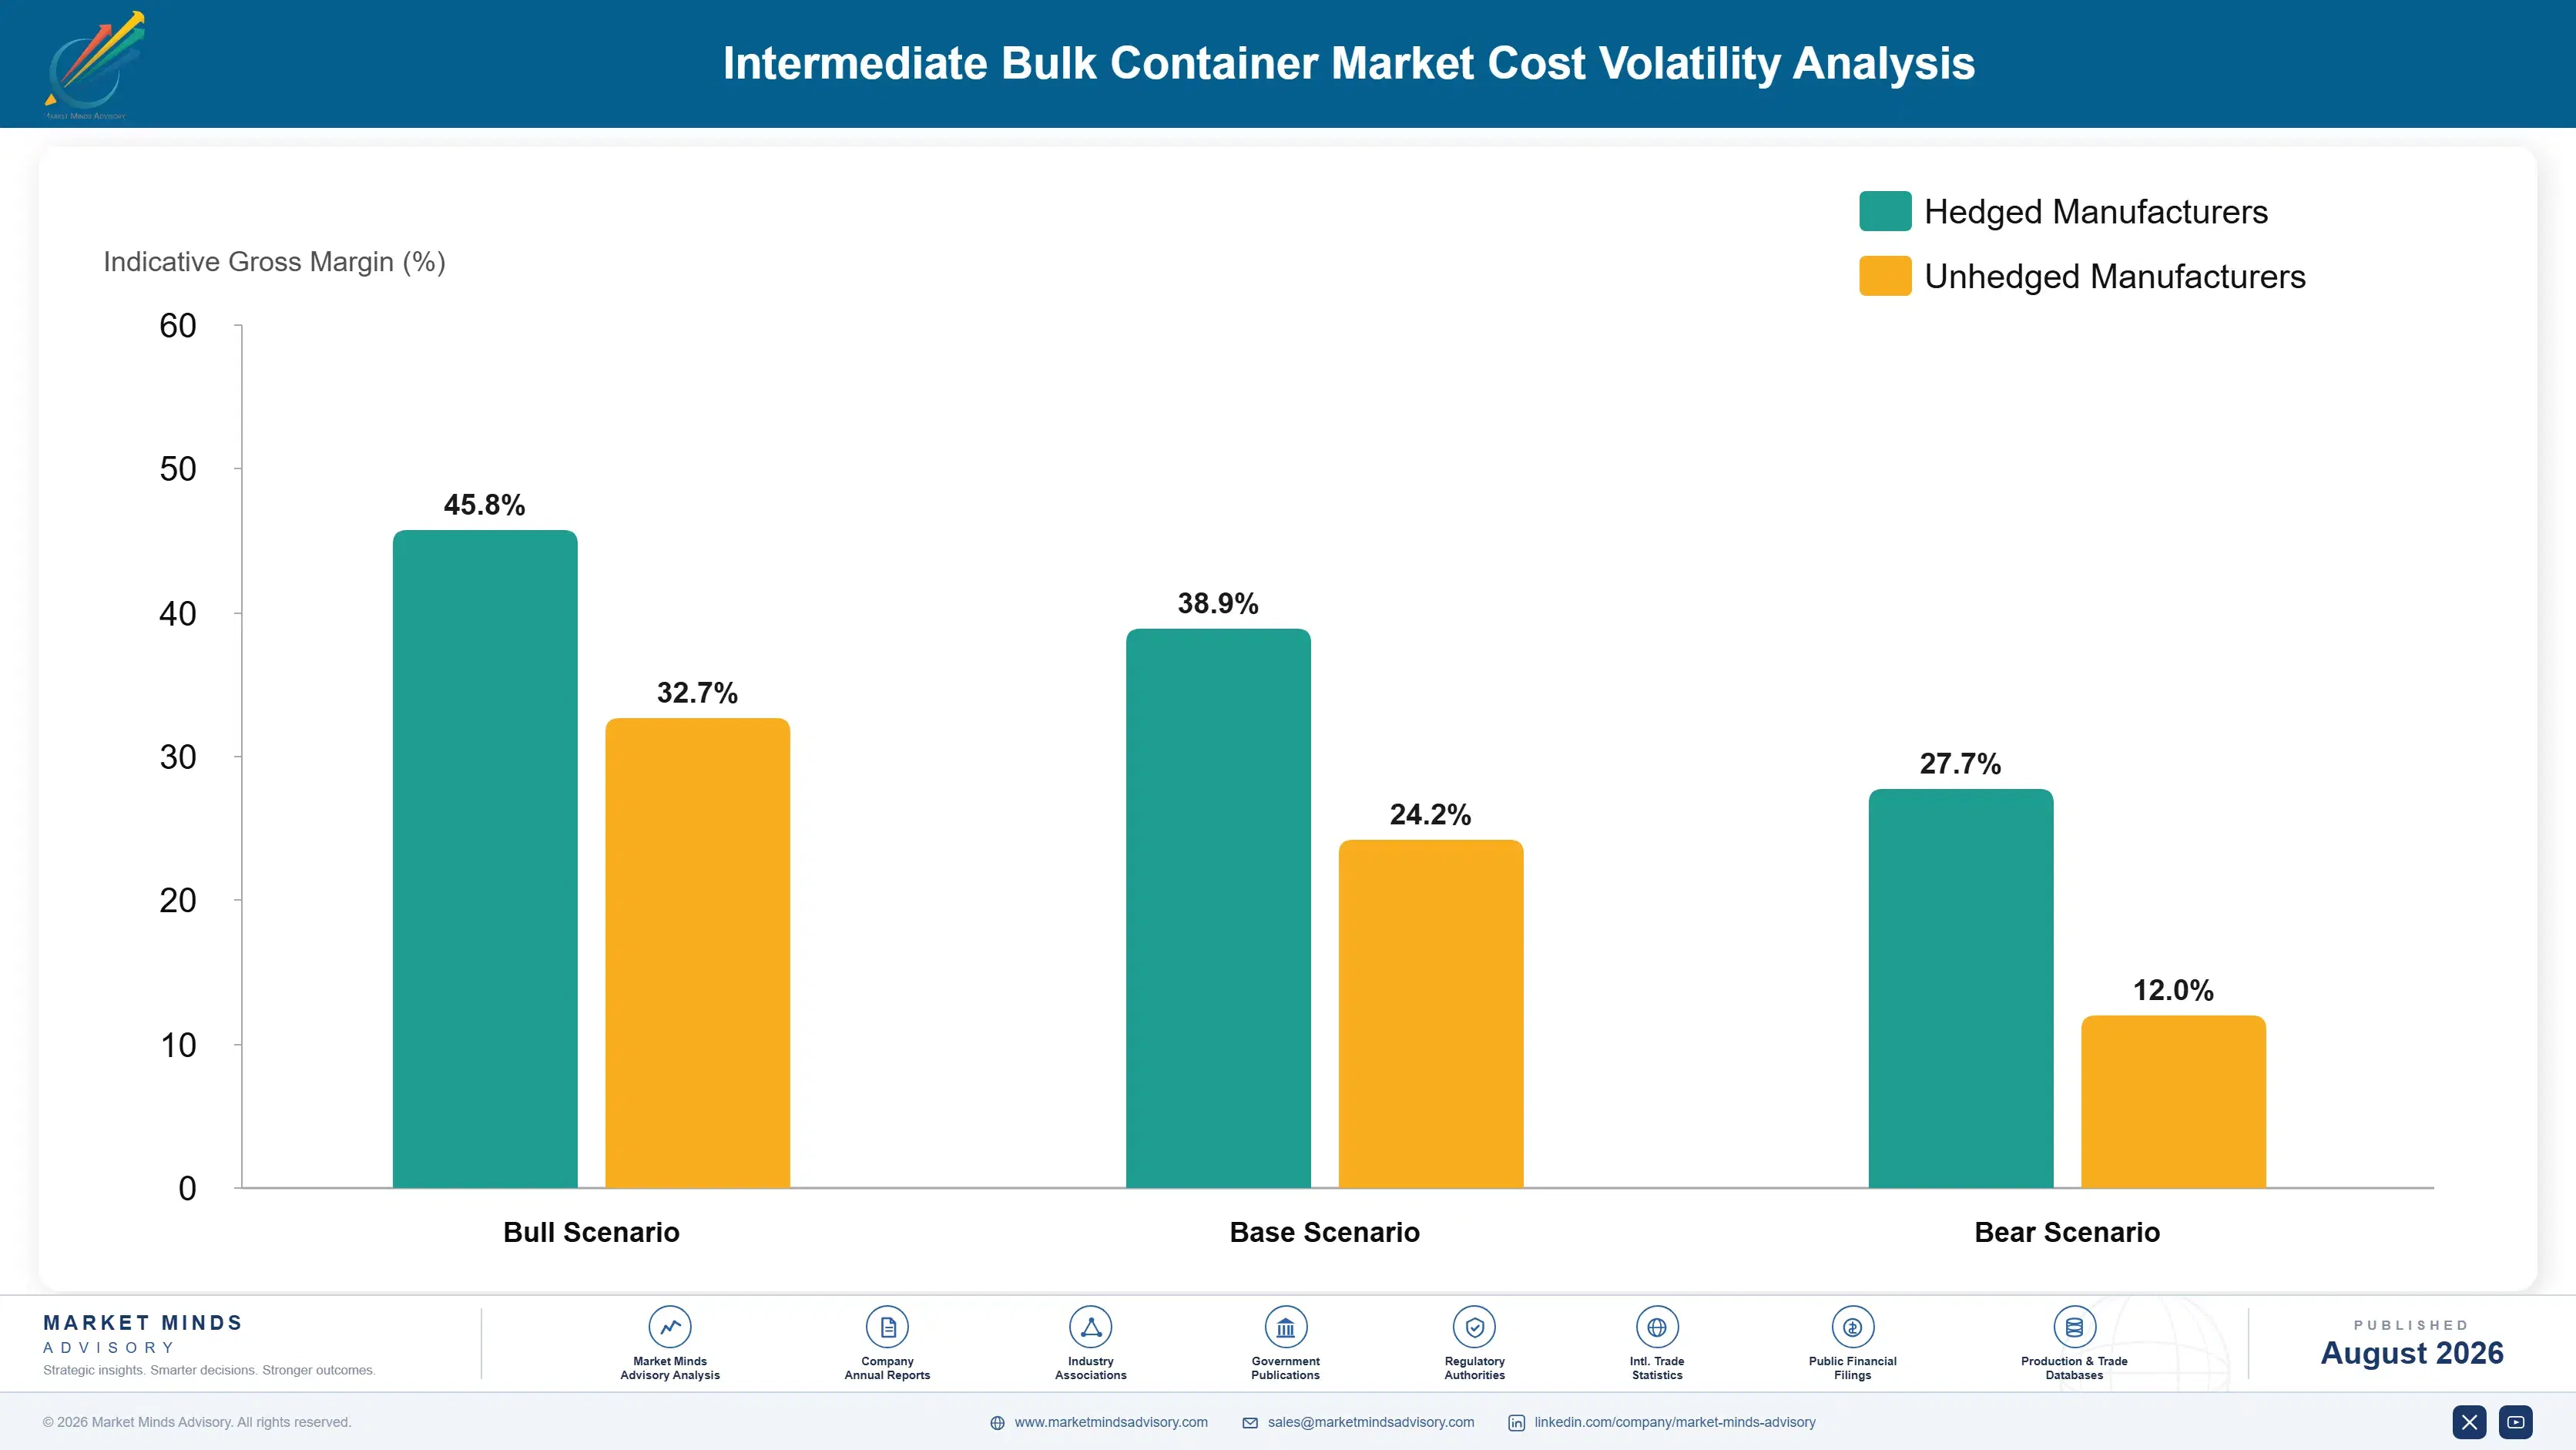
Resin, Steel, And Reconditioning Logistics Cost

HDPE resin and steel account for roughly 45% to 60% of production cost depending on container type, sourced from petrochemical and steel producers across multiple regions and supply chains. Reconditioning logistics, including collection, cleaning, and recertification, adds 15% to 25% of total cost for the reconditioning business line specifically. Tooling and certification compliance make up most of the remainder.
HDPE resin prices spiked considerably through 2021 and 2022 as petrochemical feedstock costs rose alongside broader energy price volatility affecting plastics manufacturing globally across nearly every producing region. The IEA's Oil Market Report noted naphtha and related feedstock prices trading well above prior five-year averages through the period, and Greif's 2022 annual report cited resin cost inflation as a direct pressure on rigid container margins specifically across its global operations.

Exposure separates sharply by material choice and reconditioning integration. Steel-heavy manufacturers carry different cost exposure than HDPE-focused competitors, since the two materials do not move in correlated price cycles. Manufacturers with owned reconditioning networks partially offset new material cost exposure through recurring reconditioning revenue, while pure new-container manufacturers absorb full material volatility without that offsetting revenue stream.
intermediate-bulk-container-market-cost-volatility-analysis-1787324773348

Secure long-term resin supply contracts with petrochemical producers

Spot market resin purchasing exposed manufacturers fully to the 2021 and 2022 price spike with no protection whatsoever against the sudden swing that followed almost immediately afterward across the industry. Long-term supply contracts with petrochemical producers smooth exposure across cycles and give manufacturers planning certainty that spot purchasing simply cannot ever provide at any real scale.

Expand reconditioning revenue to offset material cost exposure

Manufacturers dependent purely on new container sales absorb full resin and steel price volatility with no offsetting revenue stream to smooth results across a genuinely difficult cycle affecting margins broadly. Reconditioning revenue, priced independently of raw material cost, provides a genuine hedge against material volatility that pure new-unit manufacturers simply cannot access at comparable scale.

Diversify container material mix across resin and steel

A manufacturer producing only HDPE containers carries full resin price exposure with no offsetting revenue base to absorb volatility during a genuine price spike affecting the whole market simultaneously. Offering both resin-based and steel-based container types lets manufacturers shift customer recommendations toward whichever material carries more favourable cost conditions at any given point in time.

Portfolio Architecture for Margin Defence

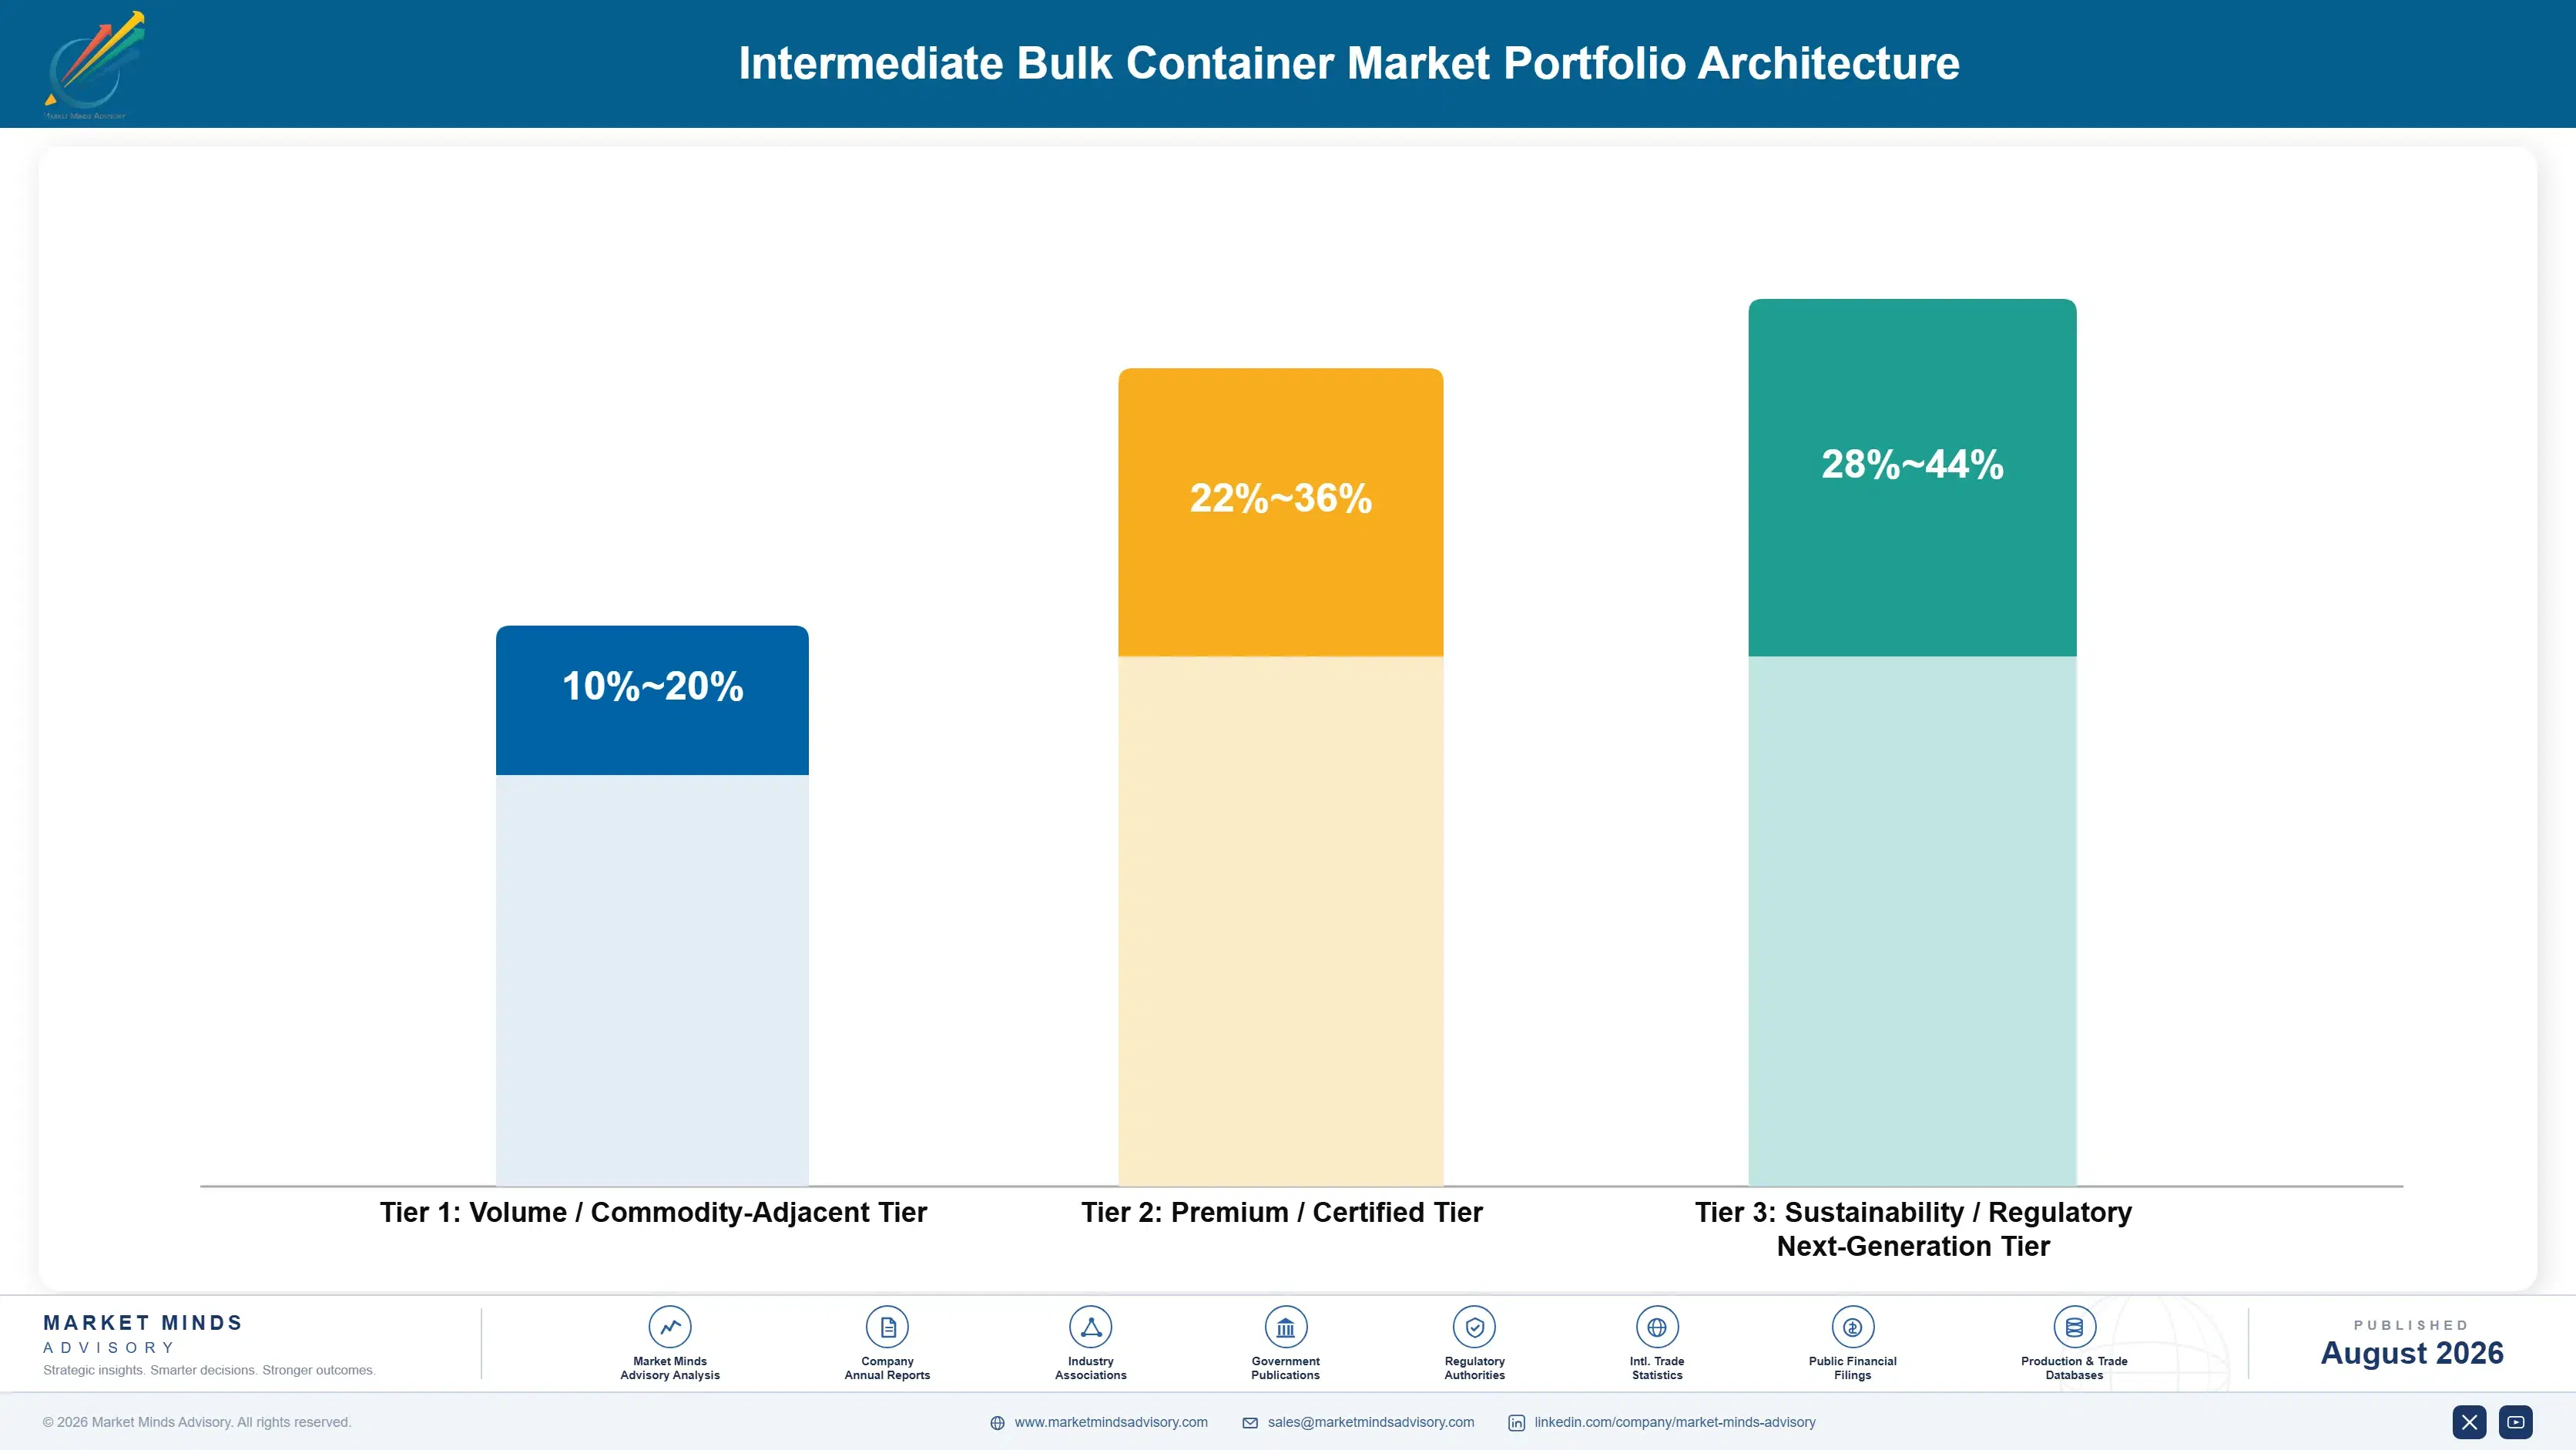
The portfolio splits into three tiers with sharply different economics. Commodity new rigid container sales form the volume tier, priced against regional manufacturers with thin, closely benchmarked margin across every qualified competitor. Reconditioning services and flexible container sales earn considerably more, since recurring service relationships and material substitution advantages both resist pure price negotiation between shipper and manufacturer throughout the relationship.
Tension runs between the new container volume business funding today's operations and the reconditioning and flexible container investment that captures tomorrow's premium across every material category. A manufacturer defending new unit volume too aggressively under-invests in the reconditioning infrastructure and flexible product lines buyers actually reward from every credible bidder now competing for large shipper contracts. Yet abandoning volume revenue too early starves the cash flow that funds the very capability build a manufacturer needs simply to compete.

High-value pools concentrate where genuine reconditioning or material barriers limit competition meaningfully: owned reconditioning networks capturing recurring service revenue, flexible containers displacing rigid alternatives in dry goods, and certified composite systems commanding premium pricing few competitors can match. Commodity new rigid containers for undifferentiated bulk sale sit at the other end, competing purely on cost against every regional manufacturer.

Volume / Commodity-Adjacent Tier

Commodity new rigid container sales priced near commodity levels, competing directly against regional manufacturers with considerable scale advantage and thin margin throughout the cycle across every qualified bidder in the tender.
Gross Margin: 10-20%

Premium / Certified Tier

Certified composite containers and reconditioning services carrying validated recertification documentation, where recurring relationships resist pure price negotiation between the parties across the full multi-year contract term negotiated carefully at signing.
Gross Margin: 22-36%

Sustainability / Regulatory / Next-Generation Tier

Owned reconditioning networks, flexible container systems, and pooling programme participation commanding premium pricing on genuine differentiation few competitors can currently match at comparable operating scale, depth, or certification breadth achieved.
Gross Margin: 28-44%
intermediate-bulk-container-market-portfolio-architecture-1787324773846

High-value Sub-segments and Strategic Watch-out

Flexible Intermediate Bulk Containers (FIBC)

High value and fastest-growing at 7.8%, as dry bulk shippers favour lighter, foldable packaging over rigid alternatives that cost more to ship both ways across every long route in either direction. Very few rigid-only manufacturers have built comparable flexible manufacturing capability today across the industry, leaving genuine room for specialists.
Gross Margin: 22-34%

Composite Intermediate Bulk Containers

High value with strong growth at 6.2%, as the plastic bottle can be replaced independently of the reusable cage during reconditioning, extending effective service life considerably beyond single-material alternatives available elsewhere. Manufacturers with dedicated reconditioning infrastructure capture disproportionate value here consistently across every reuse cycle.
Gross Margin: 24-38%

Rigid Plastic IBCs

The volume core across most chemical and industrial applications, growing steadily at 4.5% but priced through routine negotiation that leaves limited room for margin expansion over time regardless of buyer sophistication involved in the tender. Scale and reconditioning access, not differentiation, decide who wins this business consistently.
Gross Margin: 14-24%

Steel IBCs

The strategic watch-out, growing just 2.8% and steadily displaced by lighter composite and flexible alternatives across most applications tracked here today across the industry. Volume persists mainly where steel's specific structural and chemical resistance properties remain genuinely necessary for the specific cargo carried on board.
Gross Margin: 12-22%

How Container Revenue Compounds Over Reuse

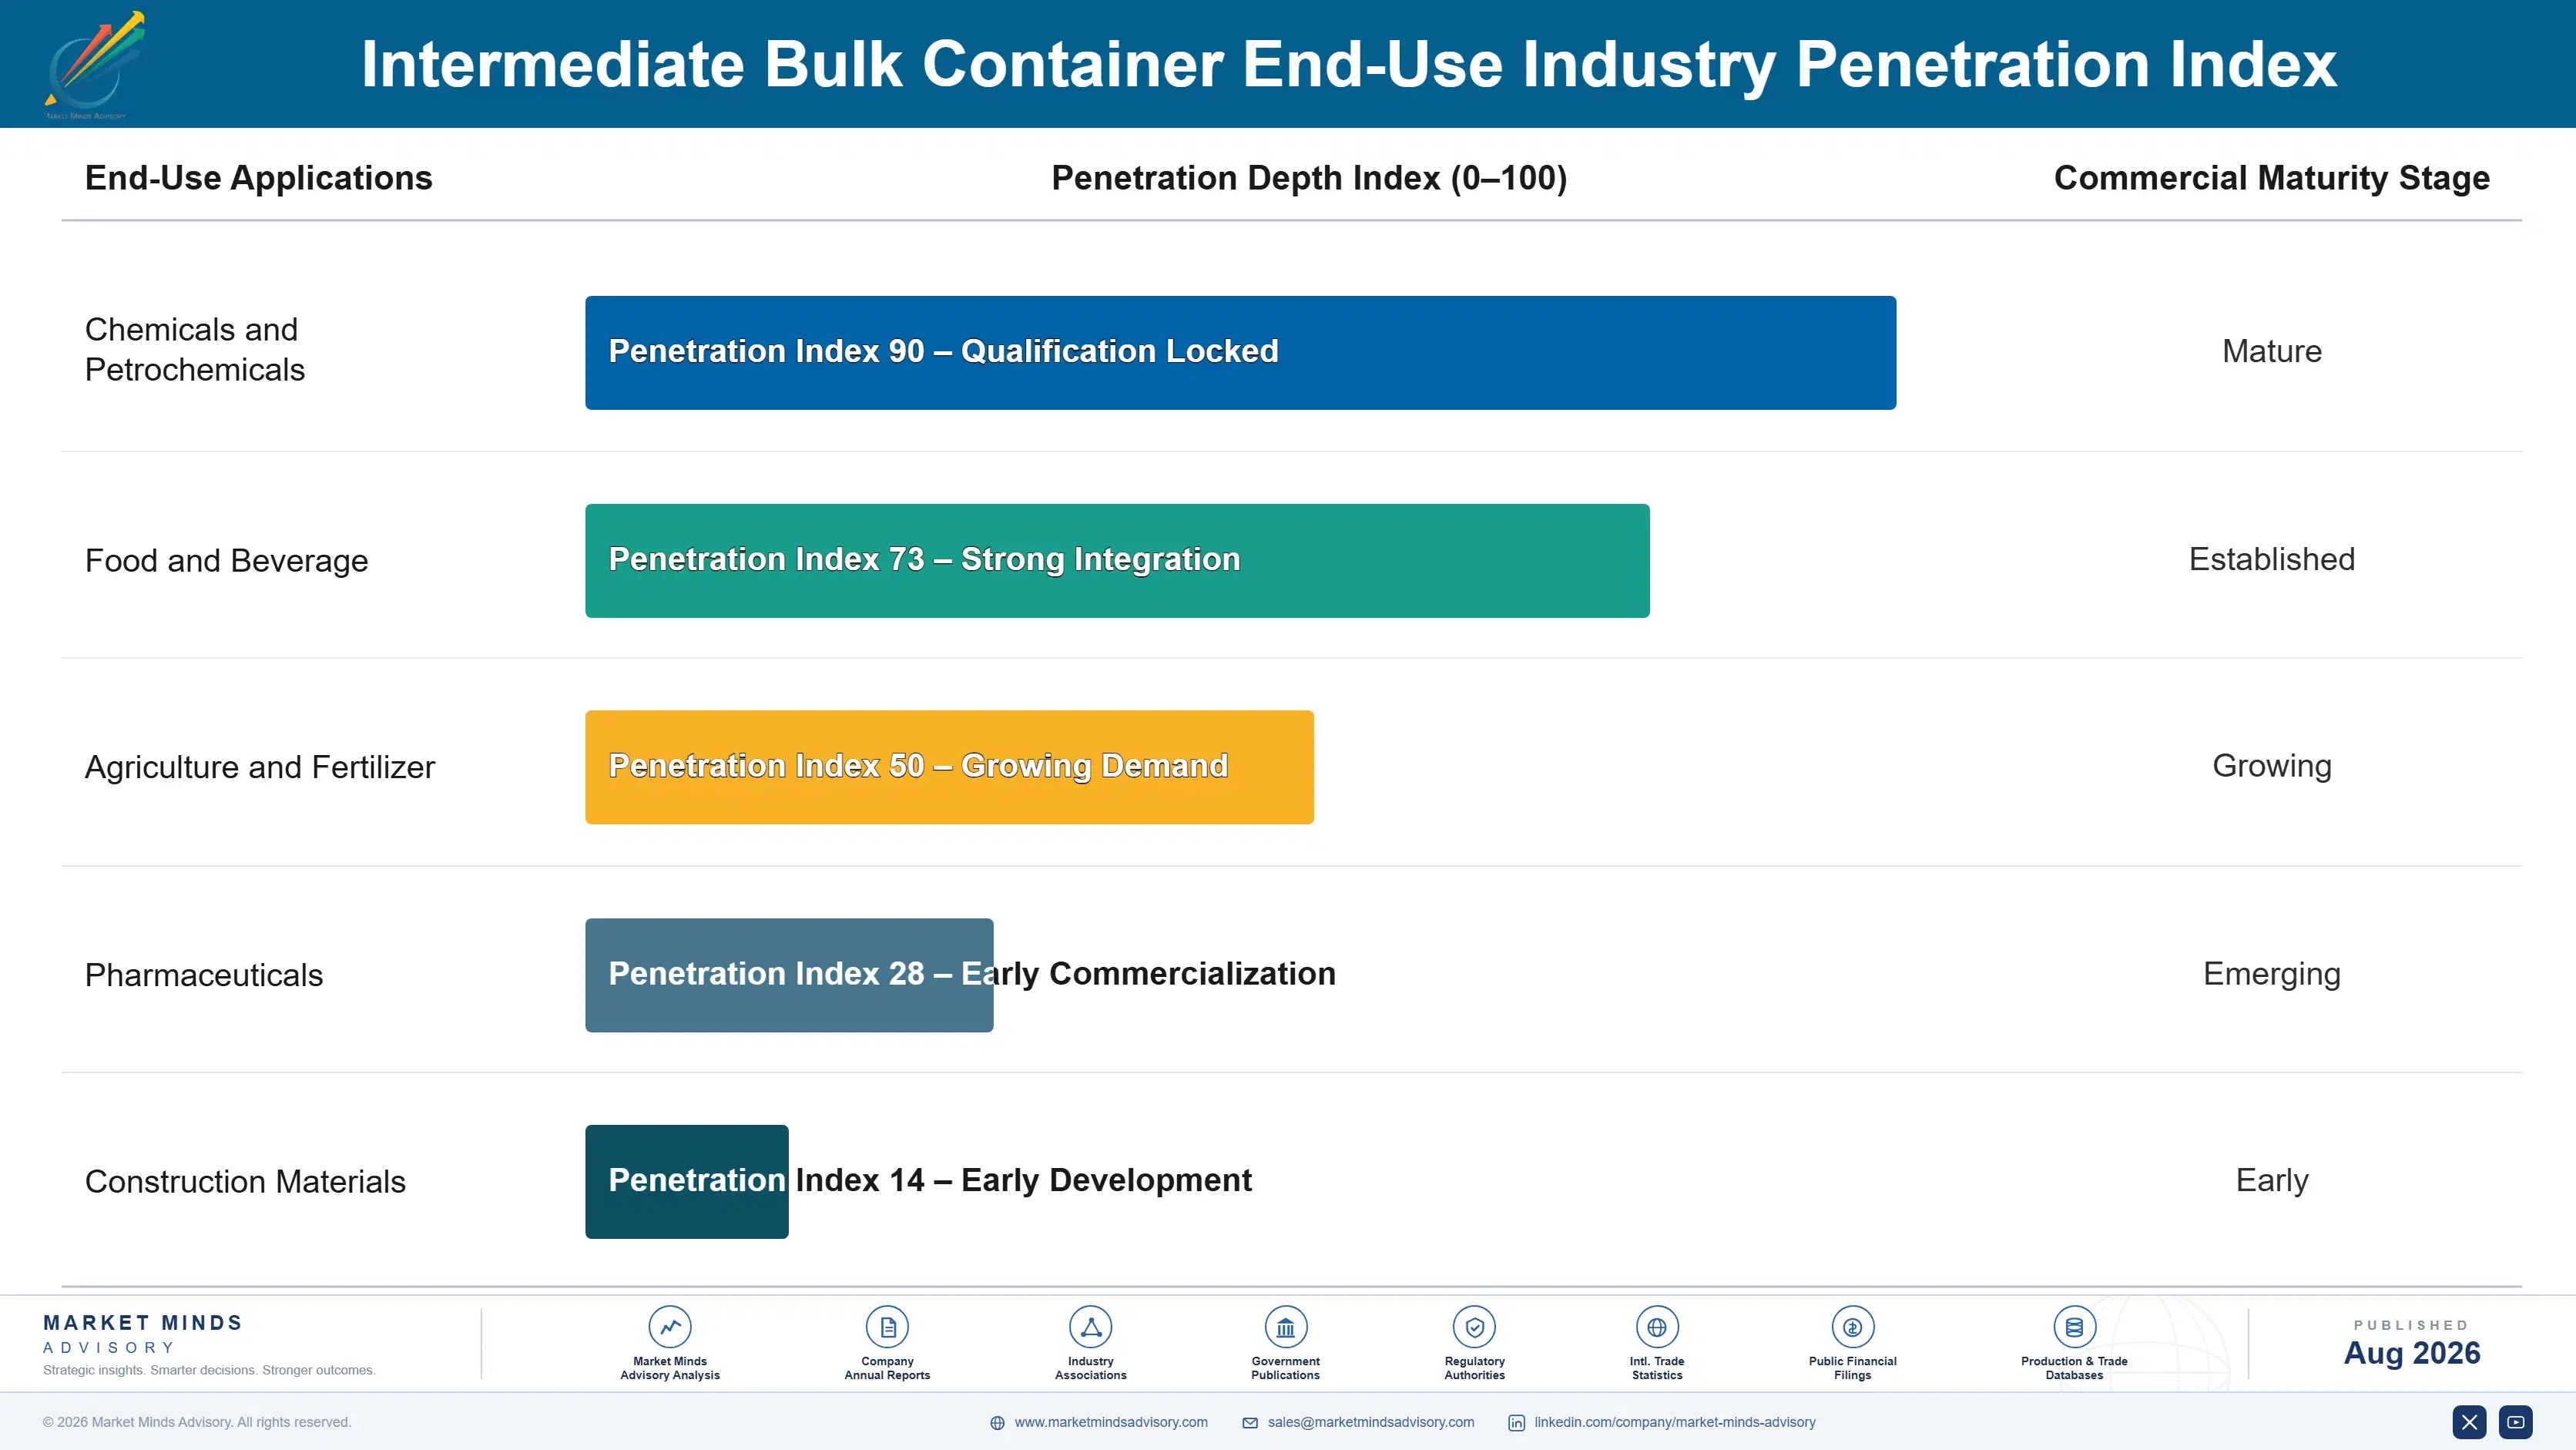
Revenue depends on multi-cycle reconditioning relationships rather than a one-time equipment sale, and a manufacturer's real earnings increasingly come from years of reconditioning, cleaning, and recertification service across a container's full operating life rather than the initial sale alone. A manufacturer winning a shipper relationship captures recurring reconditioning revenue for the container's full service life, typically 5 to 10 reuse cycles, while losing the relationship means lost rev
Adoption depth varies sharply by shipper scale. Large chemical shippers adopt pooling programmes and reconditioning relationships fastest, since the scale justifies dedicated account management and recurring service contracts. Mid-sized shippers follow with a meaningful lag, weighing reconditioning convenience against simpler outright purchase arrangements. Smaller shippers retain simple purchase and disposal patterns largely unchanged, since reconditioning logistics rarely justify themselves at limited shipment volume.

Buyer profiles have shifted from pure procurement teams toward supply chain sustainability and cost optimisation leadership, who increasingly treat container sourcing as a total cost of ownership decision rather than a one-time purchase. Younger logistics leadership increasingly treats reconditioning access as a purchase criterion equal to initial unit price, which favours manufacturers with genuine reconditioning infrastructure over those competing on new unit cost alone.
intermediate-bulk-container-market-end-use-penetration-index-1787324774336

Our Read On Intermediate Bulk Containers

These are among the four positions where our research anticipates prominent divergence between winners and laggards over the coming forecast period. Each is grounded in the demand model, the regulatory perimeter, and the announced capacity pipeline.
01 / RECONDITIONING REDEFINES VALUE

Recurring service revenue now rivals new unit sales

Reconditioning rates near 65% for rigid containers mean the majority of existing capacity gets reused rather than replaced, and every reconditioning cycle a manufacturer does not capture becomes revenue an independent reconditioner captures instead across the whole product lifetime and beyond. Mauser Packaging Solutions and Greif have both built substantial dedicated reconditioning infrastructure specifically to capture that recurring service revenue rather than ceding it entirely to third parties. Manufacturers should build owned reconditioning networks now, since the revenue opportunity only continues growing.
02 / FLEXIBLE BAGS DISPLACE RIGID

Weight and folding advantage keeps winning dry goods share

Flexible intermediate bulk containers grow at 7.8% against a market at 4.6%, capturing dry goods volume rigid container manufacturers historically served almost entirely on their own for decades of steady demand. That displacement represents a genuine capability many rigid-only manufacturers have not yet built, since flexible container manufacturing requires entirely different tooling and material science than rigid production uses across the whole process. Rigid-only manufacturers should add flexible product lines before competitors capture the segment permanently and lock in the shipper relationship for years.
03 / CERTIFICATION PROTECTS INCUMBENT MARGIN

Regulatory testing burden favours established product lines

United Nations packaging certification testing adds 6 to 12 months to new product development, and manufacturers with established certified product lines win contracts newer entrants without comparable certification simply cannot bid for at all in this heavily regulated category of goods. That certification barrier protects incumbent margin considerably longer than most industrial packaging categories allow competitors to compete on price alone at any real scale. Incumbents should defend and extend certification breadth deliberately, since it remains a genuine and durable competitive advantage worth protecting.
04 / CHEMICAL TRADE SETS FLOOR

Steady trade growth anchors the market despite substitution

Global chemical production and trade volume keeps growing gradually as manufacturing capacity expands across Asia and shipping networks connect production regions to consumption markets more efficiently than in prior decades of comparatively fragmented, less coordinated logistics. Every additional tonne of liquid or granular chemical shipped needs bulk container capacity matching the cargo's specific handling requirements precisely and reliably at every step. Manufacturers should treat this steady trade growth as the reliable demand floor beneath every other trend reshaping the category right now.

Engagement Snapshot From the Field

A live engagement with an industry participant carrying material or product regulatory and market exposure ahead of a defining policy shift, showing how our research translates into a defensible multi-year portfolio strategy.
MARKET MINDS ADVISORY · CLIENT ENGAGEMENT SUMMARY
Intermediate Bulk Container Producer Strategic Portfolio Review and Transition Roadmap 2026·Investment Scenario on Intermediate Bulk Container Exposure Evaluation 2025-26
CLIENT PROFILE
A regional rigid container manufacturer selling primarily new units engaged MMA as large chemical shipper customers began shifting purchasing toward competitors with owned reconditioning networks. The client reported annual revenue near USD 165 million, with roughly 92% tied to new unit sales and no dedicated reconditioning infrastructure in its current operations (client-reported, unverified by MMA).
STRATEGIC CHALLENGE
Commercial leadership wanted to compete on new unit pricing to retain shipper volume, a strategy that would have compressed already thin margins further without addressing why customers were actually leaving for competitors. Operations leadership worried building reconditioning infrastructure from scratch would require capital investment the board had not yet approved for this specific purpose.
MMA APPROACH
MMA modelled margin and customer retention outcomes under continued new-unit price competition versus building dedicated reconditioning capability instead of matching competitor pricing directly across every account. We assessed which specific shipper customers had already shifted volume toward reconditioning providers, and we quantified the investment and timeline required to build comparable capability in-house.
KEY FINDINGS
  1. Three of the client's five largest shipper customers had already shifted a majority of their volume toward reconditioning-capable competitors within just eighteen months.
  2. Building dedicated reconditioning infrastructure required roughly ten months and USD 14 million in facility and equipment investment across two sites (client-reported, unverified by MMA).
  3. Reconditioning-capable competitors captured recurring service revenue worth roughly 45% of comparable new unit sales measured across each container's entire full working lifetime.
  4. Continued new-unit-only competition carried an estimated 20% further margin compression within two years as more customers migrated toward reconditioning-capable providers entirely instead.
CLIENT PROFILE
A regional rigid container manufacturer selling primarily new units engaged MMA as large chemical shipper customers began shifting purchasing toward competitors with owned reconditioning networks. The client reported annual revenue near USD 165 million, with roughly 92% tied to new unit sales and no dedicated reconditioning infrastructure in its current operations (client-reported, unverified by MMA).
STRATEGIC CHALLENGE
Commercial leadership wanted to compete on new unit pricing to retain shipper volume, a strategy that would have compressed already thin margins further without addressing why customers were actually leaving for competitors. Operations leadership worried building reconditioning infrastructure from scratch would require capital investment the board had not yet approved for this specific purpose.
MMA APPROACH
MMA modelled margin and customer retention outcomes under continued new-unit price competition versus building dedicated reconditioning capability instead of matching competitor pricing directly across every account. We assessed which specific shipper customers had already shifted volume toward reconditioning providers, and we quantified the investment and timeline required to build comparable capability in-house.
KEY FINDINGS
  1. Three of the client's five largest shipper customers had already shifted a majority of their volume toward reconditioning-capable competitors within just eighteen months.
  2. Building dedicated reconditioning infrastructure required roughly ten months and USD 14 million in facility and equipment investment across two sites (client-reported, unverified by MMA).
  3. Reconditioning-capable competitors captured recurring service revenue worth roughly 45% of comparable new unit sales measured across each container's entire full working lifetime.
  4. Continued new-unit-only competition carried an estimated 20% further margin compression within two years as more customers migrated toward reconditioning-capable providers entirely instead.
RECOMMENDED STRATEGY
Phase 1: Phase 1 (0 to 3 months): Halt new-unit price competition and secure board approval for reconditioning facility investment immediately and decisively. Phase 2: Phase 2 (3 to 10 months): Build reconditioning infrastructure and pursue certification for composite and rigid container recertification services fully. Phase 3: Phase 3 (10 to 18 months): Launch reconditioning services to at-risk shipper customers and expand toward pooling programme participation broadly.
OUTCOME
The client built reconditioning infrastructure and retained two of the three at-risk shipper relationships within the first year of the new service launch. Recurring reconditioning revenue reached roughly 30% of total revenue within eighteen months, a shift the board credited as decisive for long-term viability (client-reported, unverified by MMA).

Frequently Asked Questions

Foundational context covering the market sizes, CAGR, scope, country, region and competition that inform every finding below. This section is provided to cover basics and most often pre-purchase conversations, answered from the MMA Primary Research Dataset.

What is the current size of the Intermediate Bulk Container Market?

The global intermediate bulk container market is valued at USD 6.8 billion in 2025, covering rigid, composite, steel, and flexible reusable containers for liquid and dry bulk transport. Drums and tank trucks are excluded.

How large will the Intermediate Bulk Container Market be by 2036?

The market is forecast to reach USD 11.15 billion by 2036 in the base case, about 1.57 times the 2026 level. That represents incremental value of roughly USD 4.04 billion across the decade.

What is the CAGR for the Intermediate Bulk Container Market 2026 to 2036?

The market grows at a 4.6% CAGR in the base case, with bull and bear scenarios at 5.8% and 3.3%. The spread turns mainly on global trade volume and flexible container adoption pace.

Which segment is growing fastest?

Flexible intermediate bulk containers grow fastest at 7.8%, about 1.70 times the overall rate, as dry bulk shippers favour lighter, foldable packaging. Composite containers follow at 6.2%.

Who are the major companies in the Intermediate Bulk Container Market?

Leading companies include Mauser Packaging Solutions, Greif, Schutz Container Systems, Snyder Industries, and Time Technoplast. Concentration is moderate, with the top five holding roughly 42% of revenue.

Which country is growing fastest?

India grows fastest at an 8.5% CAGR, driven by expanding chemical manufacturing and agricultural commodity export volume. China holds the largest share of global unit output.

Report Segmentation Architecture

The full report scope spans multiple orthogonal segmentation dimensions, with cross-tabulated demand data provided for each dimension pair. Coverage extends further to regional breakdowns, trend trajectories, and the competitive detail needed to support segment-level decision-making.

By Container Construction Type

  • Flexible Intermediate Bulk Containers (FIBC)
  • Composite Intermediate Bulk Containers
  • Rigid Plastic IBCs
  • Steel IBCs
  • Folding and Collapsible IBCs

By End-Use Industry

  • Chemicals and Petrochemicals
  • Food and Beverage
  • Agriculture and Fertilizer
  • Pharmaceuticals
  • Construction Materials

By Commercial Dimension

  • New Unit Purchase
  • Reconditioning and Service Contracts
  • Pooling and Leasing Programmes
  • Direct-To-Shipper Procurement

By Region

  • North America
  • Western Europe
  • East Asia
  • South Asia and Pacific
  • Latin America
  • Middle East and Africa
  • Eastern Europe

Scope, Methodology, and Coverage

Every figure in this report is reproducible from documented input assumptions. The scope below maps the historical period, the forecast horizon, the segmentation dimensions, and the countries covered, alongside the underlying primary and qualitative methodology.
Historical Period
2020 to 2025
Forecast Period
2026 to 2036
Base Year
2025 (USD billions; MMA Primary Research Dataset, August 2026)
Market Definition
The intermediate bulk container market comprises reusable industrial containers designed to store and transport liquids, powders, and granular materials in volumes between drums and tank trucks, valued at manufacturer and reconditioner net revenue. It spans rigid plastic, composite, steel, and flexible container types along with reconditioning and recertification services sold to chemical, food, and industrial goods shippers. Drums, tank trucks, ISO tank containers, and single-trip retail packaging are excluded.
Quantitative Units
USD billions (current prices); unit volume where applicable
Segmentation Dimensions
By Container Construction Type; By End-Use Industry; By Commercial Dimension; By Region
Regions Covered
North America, Western Europe, East Asia, South Asia and Pacific, Latin America, Middle East and Africa, Eastern Europe
Countries Covered
USA, China, Germany, France, UK, Japan, South Korea, India, Australia, Canada, Brazil, Mexico, Indonesia, Vietnam, Thailand, Malaysia, UAE, Saudi Arabia, South Africa, Nigeria, Turkey, Poland, Netherlands, Italy, Spain, Sweden, Switzerland, Argentina, Colombia, Singapore, and additional markets relevant to this sector
Key Companies Profiled
Mauser Packaging Solutions, Greif, Schutz Container Systems, Snyder Industries, Time Technoplast, Balmer Lawrie, Thielmann, Bulk Lift International, Hoover Ferguson Group, Nittel GmbH, CDF Corporation, Werit Kunststoffwerke, LC Packaging, Conitex Sonoco, National Bulk Equipment, Custom Metalcraft, Bulkmatic Transport, Flexpack Systems, Jumbo Bag Limited, Emmbi Industries
Quantitative Methodology
Primary survey, n=3,800 respondents, Q4 2025, six countries; demand-side model with trade association cross-validation
Qualitative Methodology
47 expert interviews, Q4 2025; applied to validate demand model assumptions, identify emerging dynamics, and assess competitive positioning
Report Format
PDF and XLSX data workbook (Word format preview document)
Publisher
Market Minds Advisory
Report Code
MMA-2026-PAC-108
Published
August 2026
Contact
sales@marketmindsadvisory.com | www.marketmindsadvisory.com

Purchase the full Intermediate Bulk Container Market Report (2026 to 2036).

The full MMA Intermediate Bulk Container report sizes the market across five construction types, five end-use industries, four commercial dimensions, and seven regions through 2036 in considerable detail. It profiles 20 companies on a consistent revenue basis, scoring each on reconditioning network scale, certification breadth, and flexible container capability. Scenario models quantify how chemical trade volume, flexible container adoption, and reconditioning economics move addressable demand by construction type. The report also includes resin and steel cost benchmarking, reconditioning rate tracking, and regional trade flow analysis for manufacturers and shippers.
Five-type and four-channel market sizing to 2036
Twenty-company benchmark on consistent manufacturer revenue basis
Reconditioning rate tracking across major container construction types
Resin and steel cost benchmarking against volatility events
Flexible container displacement analysis by end-use industry
Regional trade flow assessment for manufacturer strategy teams

Built For The People Who Decide

From boardroom strategy to bench-side execution, this report is read cover-to-cover by leaders shaping the next decade of their industry, turning demand scenarios, market dynamics and valuation benchmarks into decisions.
CXOs/ Presidents/ VPs/ Managers
M&A and Corporate Development
Strategy Teams and R&D Heads
Procurement and Product Directors
Regulatory and Compliance Leaders
Investor Relations and Equity Analysts