

Market Minds Advisory
Interferometric Synthetic Aperture Radar Market

Interferometric Synthetic Aperture Radar Market: Interferometric Synthetic Aperture Radar Market. Trends and Forecast 2026 to 2036

Small satellite constellations are turning ground deformation monitoring from a slow, expensive survey exercise into a near-daily data product, pushing infrastructure operators and insurers toward continuous subsidence tracking rather than periodic manual inspection.

Lead Analyst

Published

September 2026

Make Smarter Decisions with Customized Research Insights

Request a free sample report and evaluate market opportunities, growth trends, and competitive dynamics relevant to your business needs.

2025 MARKET VALUE$1.4BMarket Size 2025
2036 FORECAST VALUE$5.1BBase Case , 2026 to 2036
CAGR 2026 TO 203612.5 %Bull 13.8% / Bear 11.2%
INCREMENTAL OPPORTUNITY$3.5BNet 10- year value creation
EXPANSION MULTIPLE3.25x2036 value over 2026 base
Strategic Levers
M&A Pipeline
Regional Outlook
Country Rankings
Competitive Intelligence
Segmental Deep-dive
Call-Us : 91 93563 13602

Executive Snapshot and Market Trajectory.

Small satellite constellations are compressing InSAR revisit times from weeks to days, letting infrastructure operators detect subsidence and structural movement before it becomes a safety incident rather than after the fact, when repair costs run substantially higher and public trust erodes.
Government agencies are shifting from periodic aerial survey contracts toward continuous satellite-based monitoring subscriptions, driven by insurance industry demand for quantified subsidence risk data ahead of underwriting decisions across large property and infrastructure portfolios spanning multiple regions nationwide today. North America and East Asia concentrate the largest share of commercial InSAR spending, driven respectively by dense commercial satellite operator activity and large-scale infrastructure monitoring programs across major economies globally.
Competitive intensity centers on constellation revisit frequency and processing pipeline speed, since raw radar data has limited commercial value until it's converted into actionable deformation maps within hours rather than weeks of manual analysis by trained specialists. Established aerospace primes and newer small satellite operators are both racing to own this processing layer, with several vendors now bundling automated alert generation directly into subscription contracts rather than selling raw imagery that customers must process themselves.
Market Definition
The Interferometric Synthetic Aperture Radar Market covers satellite and airborne radar systems and processing services that detect ground and structural deformation through interferometric analysis of repeated radar passes. It excludes optical satellite imagery services and general weather radar systems unrelated to deformation measurement.
Base Year Value
$1.4B in 2025 (MMA Primary Research Dataset, September 2026)
Forecast Period
2026 to 2036, eleven discrete annual values
CAGR
12.5% base case. Bull 13.8%. Bear 11.2%.
Fastest Growth Segment
Small Satellite Constellation-Based InSAR Services: 18.0% CAGR
Fastest Growth Country
China: 14.0% CAGR
Fastest Growth Region
South Asia and Pacific: 14.5% CAGR
Largest Region
North America: 30% of 2025 global value
Market Leaders
Leading participants include Airbus, MDA Space, Capella Space, ICEYE, and TRE Altamira.
Primary Survey
n=3,800 procurement and R&D decision-makers, Q4 2025, six countries
Methodology
Demand-side build-up, cross-validated against public data, 47 expert interviews

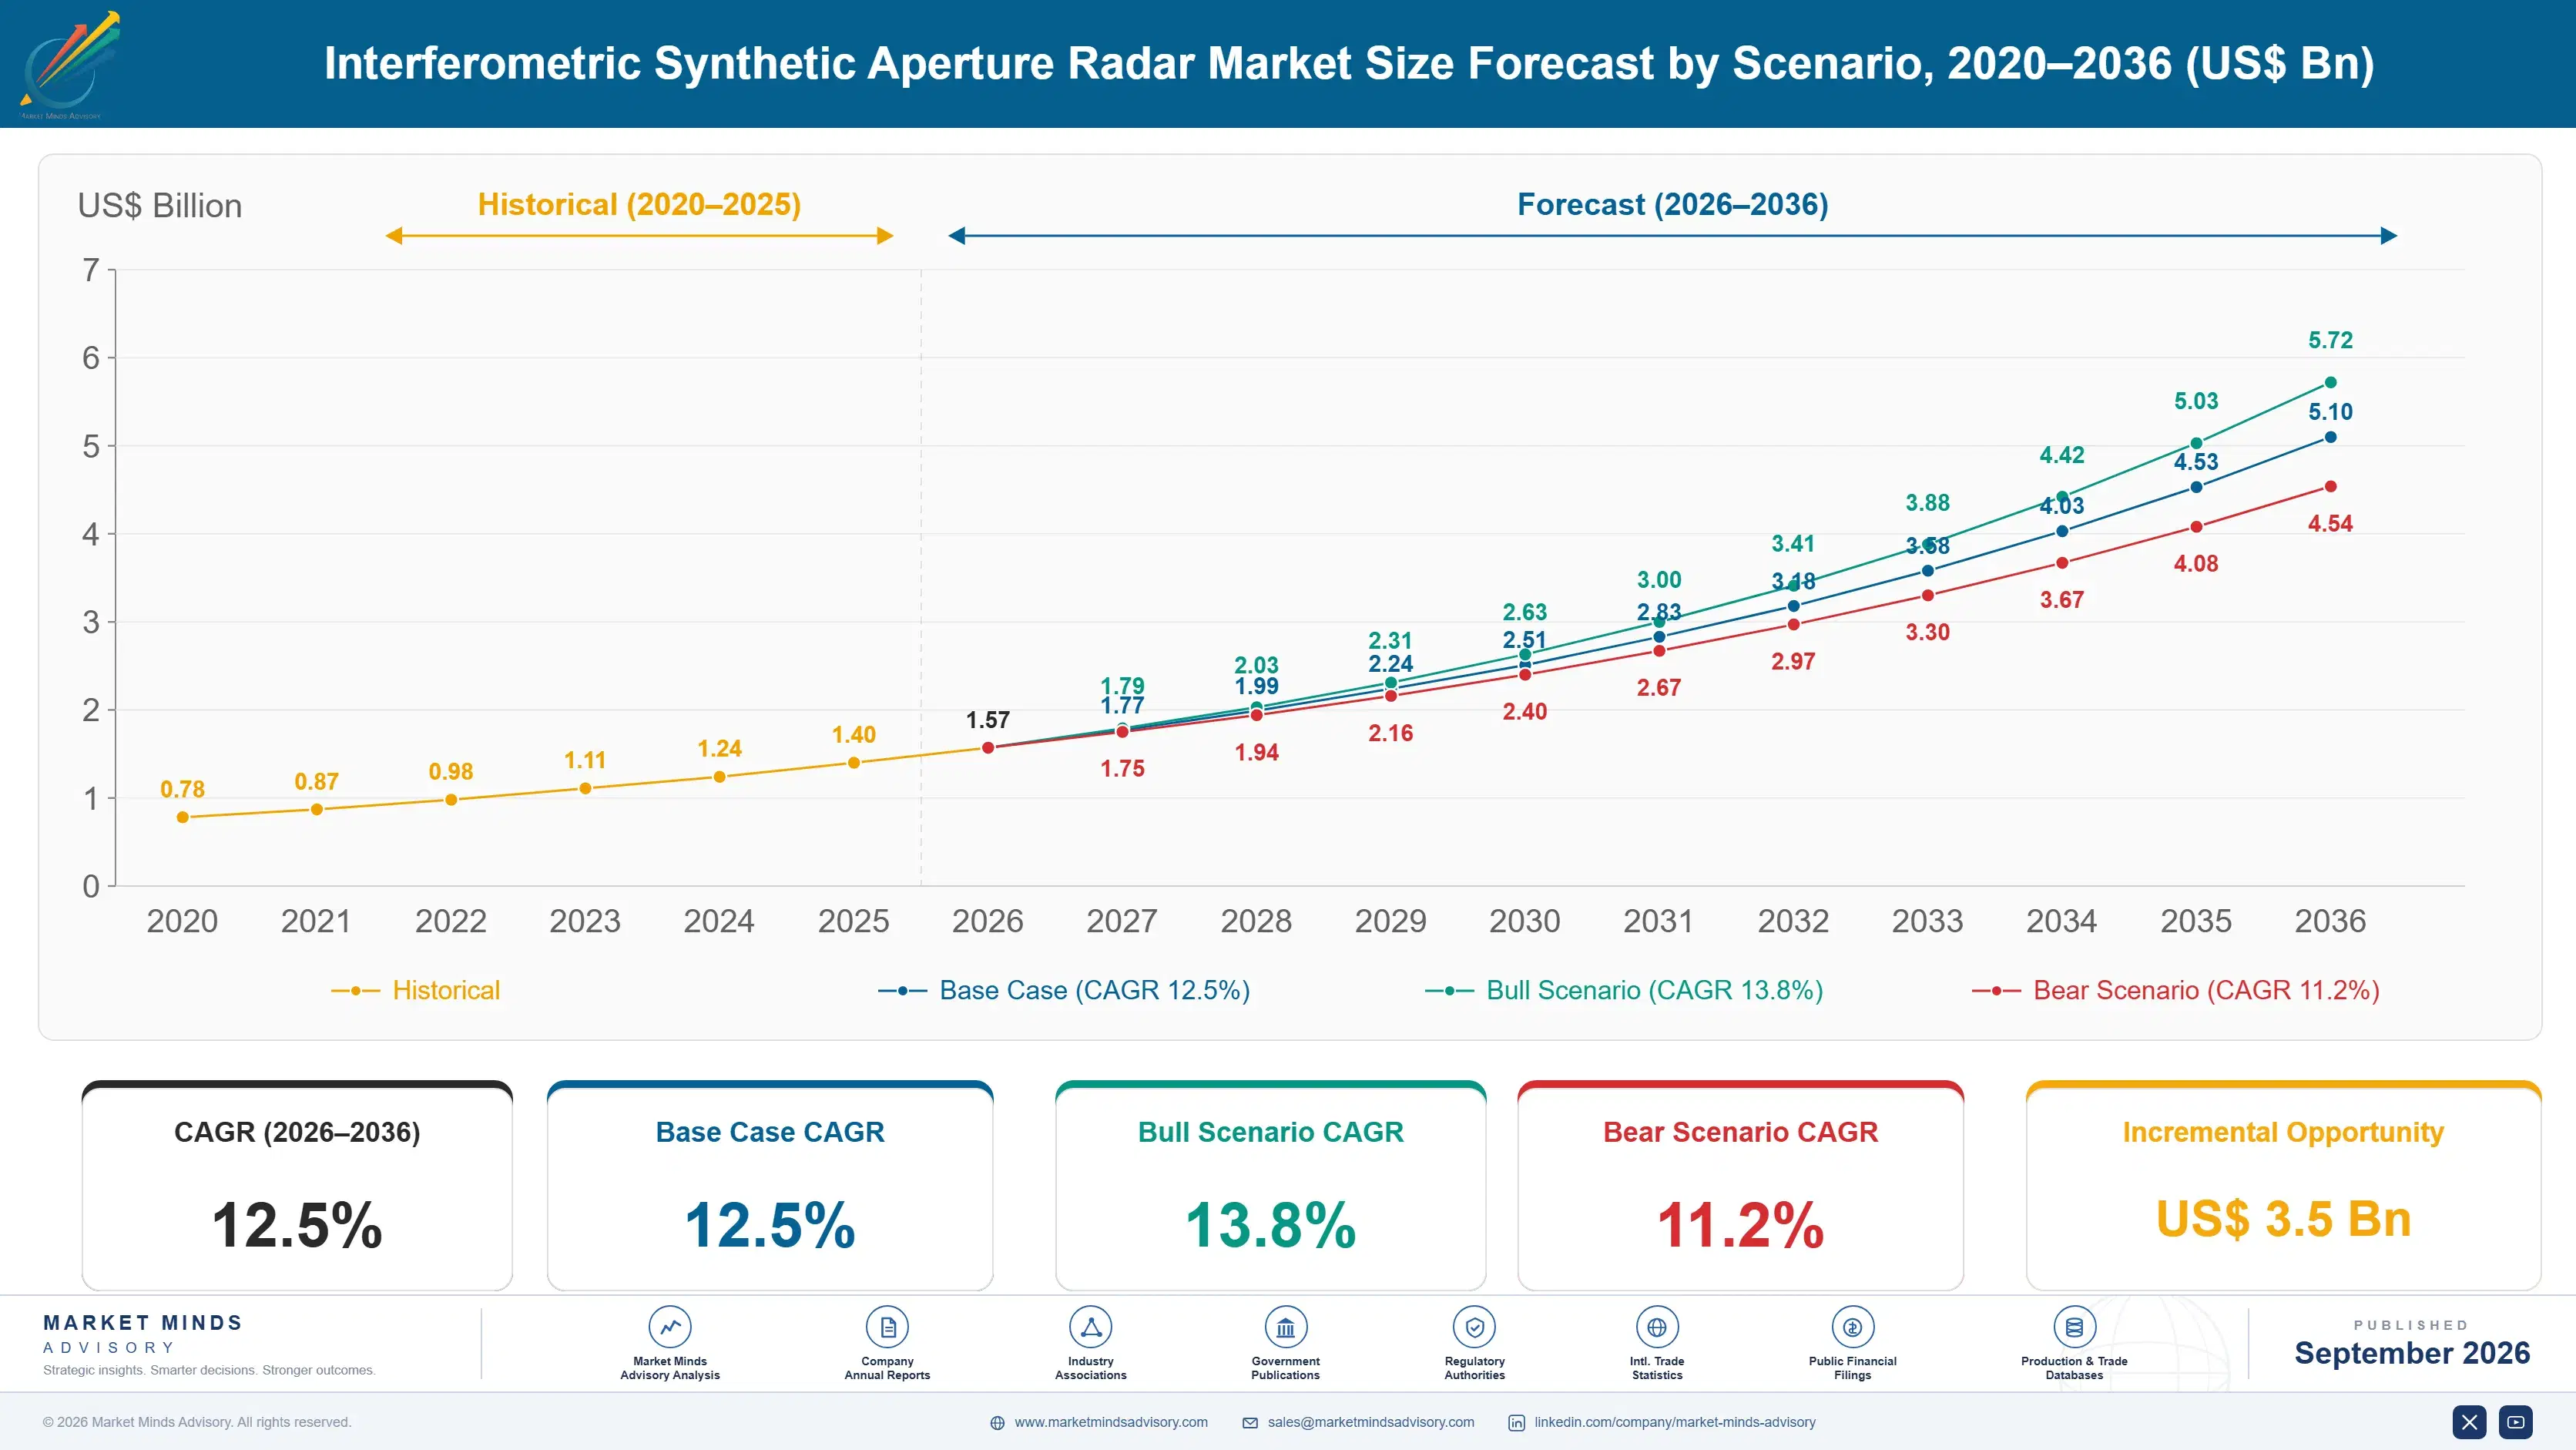
Interferometric Synthetic Aperture Radar Market Forecast Scenarios

interferometric-synthetic-aperture-radar-market-size-forecast-scenario-1789993568984
Between 2020 and 2025, the market grew at a moderate pace anchored by government infrastructure monitoring programs, then accelerated meaningfully as small satellite constellation launches multiplied and processing costs declined significantly near the end of the period. Commercial adoption expanded beyond government contracts as insurers and infrastructure operators discovered the risk quantification value of continuous monitoring.
The base case assumes continued small satellite constellation expansion, declining per-image processing cost, and gradual adoption of subscription-based monitoring models across the entire forecast period through 2036 and beyond. Infrastructure operators will prioritize continuous deformation tracking over periodic survey contracts, insurers will increasingly require quantified subsidence risk data as a standard underwriting input, and government agencies will expand mandatory monitoring requirements for critical infrastructure including dams, bridges, and mining operations.
A bull scenario emerges if mandatory continuous monitoring regulation for critical infrastructure spreads rapidly across major economies, driving accelerated adoption well beyond current voluntary uptake. The bear risk is a slowdown in small satellite launch cadence following a funding pullback in the commercial space sector, which could constrain the constellation capacity needed to deliver the revisit frequency customers increasingly expect.

Where Revisit Frequency Determines Contract Value

Interferometric synthetic aperture radar has shifted from a specialized scientific tool into commercial infrastructure risk management, since insurers and asset owners now treat quantified subsidence data as a standard underwriting and maintenance planning input rather than an occasional research exercise. Vendors that can deliver sub-weekly revisit frequency and automated deformation alerts are capturing disproportionate share of enterprise contracts currently expanding faster than the broader satellite imagery market overall.
MARKET CONCENTRATIONCR5 48%Top five vendors control roughly half of revenue
AVERAGE CONTRACT VALUE$650KTypical annual monitoring subscription fee for large operators
TOP ADOPTING REGION SHARE30%North America leads global commercial InSAR technology spending
DETECTION ACCURACY THRESHOLD1-2mmTypical ground movement precision achieved by leading platforms
CONSTELLATION REVISIT TIME1-3 daysAverage time between repeat radar passes over a site
GOVERNMENT PROGRAM SHARE45%Portion of revenue derived from public sector contracts
Processing speed has become as commercially important as the underlying radar hardware itself, since raw interferometric data requires substantial computational work before it produces an actionable deformation map that a customer can act on. Vendors that have invested in automated processing pipelines delivering results within hours rather than the weeks legacy providers historically required are winning contracts specifically on turnaround time, a metric increasingly weighted alongside detection accuracy in procurement decisions.
Government infrastructure monitoring mandates remain the largest single demand driver, though commercial insurance and mining sector adoption is growing faster as these industries discover the direct financial value of early subsidence detection. Small satellite constellation operators are increasingly competing directly with established aerospace primes for these commercial contracts, narrowing the technology gap that once separated government-grade systems from newer entrants.
"The satellite used to be the product. Now it's the processing pipeline that determines who wins the contract, because customers don't want radar data, they want an answer about whether that dam is moving."
Director, Geospatial Intelligence and Earth Observation Practice · MMA Technology Practice · September 2026

Market Trends

Small Satellite Constellations Compress Revisit Times

Commercial small satellite operators have launched dozens of new radar satellites in recent years, dramatically compressing the time between repeat passes over any given location from weeks to just one to three days for premium subscription customers across most global markets. This shift lets infrastructure operators detect gradual ground movement trends far earlier than legacy systems relying on monthly or quarterly satellite passes could ever support. Several operators have publicly announced plans to expand their constellations further, targeting daily revisit capability across major infrastructure corridors within the next few years.
Market Impact: Applies to portfolios over $50 million

Automated Processing Pipelines Cut Turnaround Time

Vendors are investing heavily in automated interferometric processing pipelines that convert raw radar data into actionable deformation maps within hours rather than the weeks that manual analysis historically required from specialized technical staff working around the clock across multiple time zones, countries, and continents worldwide today. This automation has become a genuine competitive differentiator, since customers increasingly value rapid turnaround for time-sensitive applications like post-earthquake damage assessment or mining slope stability monitoring. Vendors offering automated alert generation directly within subscription contracts are winning a disproportionate share of new enterprise business.
Market Impact: Affects infrastructure exceeding 50 years old

Market Opportunities and Growth Drivers

Insurance Industry Demand Drives Continuous Monitoring Adoption

Property and infrastructure insurers are increasingly requiring quantified subsidence risk data as a standard underwriting input, particularly in regions prone to ground movement from mining, groundwater extraction, or seismic activity that historically relied on infrequent manual inspection reports conducted only annually or even less often. This shift is creating sustained demand for continuous InSAR monitoring subscriptions rather than one-time survey engagements, since insurers need updated risk data across multi-year policy periods to price coverage accurately. Several major insurers have begun mandating InSAR-based monitoring for large commercial property portfolios exceeding certain value thresholds.
Market Impact: Degrades accuracy by up to 20%

Critical Infrastructure Aging Increases Monitoring Requirements

Aging dams, bridges, and pipeline networks across developed economies are approaching or exceeding their original design lifespans, forcing infrastructure operators and regulators to adopt more frequent structural monitoring than periodic visual inspection alone can provide reliably across every single asset class. InSAR-based deformation monitoring offers a cost-effective alternative to expensive physical sensor networks, particularly for monitoring large infrastructure spans or geographically dispersed pipeline networks that would otherwise require thousands of individual ground-based sensors. Regulatory bodies in several countries are beginning to mandate continuous monitoring for infrastructure exceeding certain age thresholds.
Market Impact: Requires capital exceeding $200 million

Market Restraints and Challenges

Atmospheric Interference Limits Measurement Accuracy and Reliability

Atmospheric water vapor and ionospheric conditions can distort radar signal phase measurements, rooted in the physical limitations of radio wave propagation through variable atmospheric conditions between the satellite and ground target across different climate zones. The commercial impact falls hardest on measurements in tropical and coastal regions with high humidity variability, where accuracy can degrade meaningfully compared to arid climate deployments, sometimes requiring additional correction processing that adds cost and delay. Vendors are increasingly deploying machine learning atmospheric correction models trained on historical weather data to improve reliability in these challenging environments.
Market Impact: Cuts revisit times under 3 days

High Upfront Constellation Investment Limits New Entrants

Launching and operating a commercial radar satellite constellation requires capital investment reaching hundreds of millions of dollars, rooted in the specialized manufacturing, launch, and ground station infrastructure required to operate synthetic aperture radar systems reliably at meaningful commercial scale over time and across many regions. The commercial impact falls hardest on new entrants attempting to compete against established constellation operators with existing satellite fleets and customer relationships built over many years of operation. Some newer entrants are pursuing capacity-sharing partnerships with existing satellite operators to reduce upfront capital requirements substantially.
Market Impact: Delivers deformation maps within 24 hours
3 additional market trends, 4 additional growth drivers, and 2 additional restraints and challenges are covered in the full report. Contact sales@marketmindsadvisory.com to access the complete intelligence.

Segment CAGR and Growth Architecture

Interferometric synthetic aperture radar segments by application function across six categories, spanning small satellite constellation services through infrastructure monitoring, mining subsidence tracking, and disaster response used across government and commercial customers worldwide today and going forward. Each represents a distinct commercial use case, rather than overlapping product tiers within a single category or hierarchy.
interferometric-synthetic-aperture-radar-market-market-share-analysis-1789993569535

Small Satellite Constellation-Based InSAR Services

Small satellite constellation-based InSAR services are growing fastest as commercial operators deploy dozens of radar satellites capable of daily or near-daily revisit frequency, a capability legacy single-satellite government programs cannot match at comparable cost or operational scale anywhere nationwide or internationally today or in prior years. These services increasingly serve commercial customers including insurers, mining operators, and infrastructure asset managers who previously could not access sufficiently frequent monitoring data to support operational decision-making across their expanding portfolios and risk profiles. Subscription-based commercial models are displacing one-time survey contracts as the dominant purchasing pattern, since continuous monitoring delivers substantially more value than periodic snapshots for risk management applications requiring ongoing vigilance.
CAGR 18.0%

Infrastructure and Critical Asset Monitoring Services

Infrastructure and critical asset monitoring services are expanding rapidly as aging dams, bridges, and pipeline networks require more frequent structural assessment than periodic visual inspection alone can reliably provide across geographically dispersed asset portfolios and utility networks spanning entire countries and continents worldwide and even much further beyond national borders, coastlines, and jurisdictions. These services increasingly bundle automated alert generation with raw deformation data, letting infrastructure operators respond to emerging structural risks before they escalate into safety incidents requiring costly emergency intervention. Government infrastructure agencies represent the largest customer segment currently, though commercial infrastructure operators including utilities and private toll road operators are adopting this capability at an accelerating pace.
CAGR 14.5%
Full segment breakdown across 6 segments available in the complete report.

Regional Architecture and Country Demand Map

North America leads global commercial InSAR spending given its concentration of small satellite constellation operators and infrastructure monitoring demand. East Asia follows closely behind, while South Asia and Pacific posts the market's fastest regional growth as infrastructure investment and disaster monitoring needs expand rapidly across the region.

North America

North America's dominance rests on the concentration of commercial small satellite operators including Capella Space and Umbra, both headquartered in the United States and racing to expand constellation capacity ahead of growing commercial demand across multiple industries, asset classes, and geographic regions nationwide today and beyond. Government agencies including NASA and the United States Geological Survey have run InSAR research programs for many decades, building institutional expertise that commercial vendors now draw on when developing new applications for insurance and infrastructure clients. Mining operators across the western United States and Canada represent a particularly strong adoption segment, given the direct financial value of early subsidence detection in active extraction sites.
Share: 30% | CAGR: 13.5% (2026 to 2036)

Western Europe

Western Europe's growth trails North America's pace slightly, though the region benefits substantially from the European Space Agency's Copernicus Sentinel program, which provides freely available radar data that commercial vendors layer proprietary processing services on top of at meaningful commercial scale across the continent and well beyond its borders each year. Germany and Italy host significant commercial InSAR expertise, with TRE Altamira and several specialized processing vendors serving infrastructure monitoring contracts across the continent. European Union infrastructure safety regulation is increasingly mandating continuous monitoring for aging dams and bridges, creating steady demand growth even as government budget constraints limit the pace of new program launches across member states and regions.
Share: 22% | CAGR: 11.0% (2026 to 2036)
Regional intelligence for 5 additional markets available in the complete report: East Asia, South Asia and Pacific, Latin America, Middle East and Africa, Eastern Europe. Contact sales@marketmindsadvisory.com.
interferometric-synthetic-aperture-radar-market-country-cagr-analysis-1789993570078

Where Vendors Can Defend Subscription Pricing

Revenue expansion in InSAR services depends increasingly on delivering faster processing turnaround and higher revisit frequency rather than raw radar resolution alone, since customers now demand near-real-time actionable data before committing to expanded multi-site monitoring contracts spanning entire portfolios and infrastructure networks across multiple regions, countries, and continents worldwide each and every single year.

Premium Revisit Frequency Tier Pricing Strategy

Vendors offering premium subscription tiers with daily or sub-daily revisit frequency can command substantially higher pricing than standard weekly monitoring packages, since customers managing safety-critical infrastructure pay directly for reduced detection latency and faster overall response capability across every single asset, site, and location. Several vendors report premium tier pricing running 40 to 60% above standard tier rates for comparable coverage area. This positioning matters most for customers monitoring rapidly evolving hazards like active mining slopes or post-earthquake infrastructure assessment, where detection speed directly affects safety outcomes and liability exposure.
Market Impact: Commands a 40 to 60% premium pricing overall

Automated Alert Generation Module Upsell Strategy

Vendors offering automated deformation alert generation as a subscription add-on capture recurring revenue well beyond raw imagery delivery, since customers increasingly prefer actionable notifications over manually reviewing raw interferometric data themselves each and every single monitoring cycle across every monitored site, asset, and location within their entire portfolio. This service layer can add 25 to 35% incremental revenue per account, since infrastructure operators and insurers prefer outsourcing analysis interpretation to specialized vendors rather than building internal geospatial analysis teams amid persistent technical talent shortages across the industry broadly and consistently.
Market Impact: Adds 25 to 35% of total account revenue

Multi-Site Portfolio Monitoring Bundle Growth Strategy

Vendors offering unified monitoring dashboards spanning dozens or hundreds of infrastructure sites within a single subscription can convert single-site license sales into broader portfolio-wide contracts, capturing incremental revenue that site-specific point solutions never generate for the vendor across expanding customer relationships and increasing account depth over time and across renewal cycles. Vendors offering this consolidation typically see contract expansion of 20 to 30% when customers add portfolio-wide monitoring capability to their existing single-site subscription. This lever works best for large asset owners managing geographically dispersed infrastructure networks requiring centralized oversight.
Market Impact: Expands contract value by 20 to 30% overall

Regulatory Compliance Reporting Module Expansion Strategy

Vendors offering pre-formatted regulatory compliance reports tailored to specific national infrastructure safety mandates can command premium pricing beyond raw monitoring data, since customers value avoiding the internal engineering effort required to translate deformation data into examiner-ready compliance documentation for outside auditors and regulators alike. This capability typically increases total contract value by 15 to 25% over standard monitoring subscriptions, since customers pay for compliance risk reduction alongside the underlying monitoring data itself. Government contractors and utilities operating under strict regulatory oversight represent the strongest adoption segment for this particular capability.
Market Impact: Increases total contract value by 15 to 25%

Who Controls the Margin Pool

The InSAR market shows moderate to high concentration, with the top five vendors controlling roughly 48% of global revenue given the specialized satellite manufacturing, launch, and interferometric processing expertise required to compete credibly. Airbus and MDA Space hold a substantial scale advantage over Capella Space and the remaining challengers, backed by decades of government satellite program relationships that newer commercial entrants cannot quickly replicate.
Current competitive activity centers on premium revisit frequency tier launches and automated alert generation module rollouts, with major vendors announcing expanded constellation capacity to meet growing commercial demand across multiple industries. Several vendors are pursuing multi-site portfolio monitoring bundles, seeking to capture larger infrastructure asset owners managing dozens of geographically dispersed monitoring sites simultaneously across regions.

Emerging pressure comes from newer small satellite operators like Capella Space and ICEYE rapidly closing the technology gap with established aerospace primes, supported by venture capital targeting commercial InSAR applications specifically. Rankings could shift meaningfully over the coming decade as constellation revisit frequency and processing pipeline speed, rather than legacy government relationships alone, become the primary basis for competitive differentiation within the highest-growth commercial segment.
interferometric-synthetic-aperture-radar-market-company-positioning-matrix-1789993570626

Competitive Moat and Risk Dimensions

AIRBUS

Moat: Deep Government Program Relationships

Airbus's moat rests on decades of government satellite program relationships and deep expertise operating radar constellations for European Space Agency missions, letting it win large government contracts newer commercial entrants cannot easily bid on. Switching costs run high: government customers already invested in Airbus-built ground infrastructure face substantial migration friction considering a competing satellite vendor.
AIRBUS

Risk: Slower Commercial Agility Pace

Airbus's government-focused business model moves slower than nimble commercial small satellite operators on pricing flexibility and rapid product iteration, particularly around subscription-based commercial offerings. Commercial customers increasingly evaluate specialized vendors alongside Airbus, and if the gap in commercial agility widens, Airbus risks losing new commercial logo growth to focused competitors even while retaining its large government contract base.
MDA SPACE

Moat: Bundled Satellite and Processing Stack

MDA Space pairs its radar satellite manufacturing capability with decades of Canadian government program experience, letting it sell integrated satellite and ground processing solutions rather than standalone hardware. This bundled positioning makes MDA difficult to displace within accounts already running its RADARSAT constellation data for government monitoring applications.
MDA SPACE

Risk: Government Budget Cycle Exposure

MDA Space's government program concentration creates meaningful revenue exposure to Canadian federal budget cycles, which have shown periodic volatility affecting satellite program funding continuity. A prolonged government spending pullback could disproportionately affect MDA relative to competitors with more diversified commercial revenue streams across insurance and mining customers.

Players Tracked

Prominent Players

Airbus
MDA Space
Capella Space
ICEYE
TRE Altamira

Other Key Players

Umbra Lab
Planet Labs
Thales Alenia Space
OHB System
Synspective
Hydrosat
SkyGeo
GAMMA Remote Sensing
e-GEOS
SAOCOM Argentina
NEC Corporation
Fugro
Sarmap
NV5 Geospatial
Descartes Labs

Recent Developments

FEBRUARY 2026

Airbus acquired a specialized interferometric processing startup in February 2026, adding automated alert generation capability to its existing radar satellite platform. The deal extends Airbus's ability to compete directly with commercial small satellite operators in fast processing turnaround, addressing growing customer demand for actionable deformation data rather than raw imagery.
Signal: Signals automated processing becoming a required baseline platform feature for satellite vendors rather than a differentiator.
MAY 2026

MDA Space and a major cloud infrastructure provider announced a joint venture in May 2026 to deliver managed InSAR processing hosting for mid-market infrastructure operators lacking dedicated geospatial teams. The venture combines MDA's satellite data with elastic compute capacity, targeting customers priced out of monitoring due to high upfront investment.
Signal: Signals major cloud infrastructure providers partnering directly with satellite vendors to reach underserved mid-market monitoring customers.
APRIL 2026

Capella Space secured a multi-year supply agreement in April 2026 with a consortium of mining companies to deploy continuous subsidence monitoring across their combined extraction operations. The agreement represents one of the largest multi-site commercial InSAR deployments announced this year, reinforcing Capella's positioning in cost-sharing arrangements among mid-sized mining operators.
Signal: Signals consortium-based deployments emerging as a viable and durable cost-sharing model for smaller mining sector operators.

Where Launch Costs Squeeze Vendor Margins

Satellite manufacturing and launch services represent approximately 38% of total cost of goods sold for InSAR constellation operators, with ground station infrastructure and cloud processing compute adding a further 20%. Most vendors depend on a concentrated group of launch providers, leaving them exposed to scheduling delays and pricing changes during periods of elevated commercial launch demand across the industry and broader sector.
Launch cost volatility during 2023 and 2024 affected several small satellite operators' constellation deployment schedules, with SpaceX reporting sustained rideshare mission backlogs in its published launch manifests during that same period of elevated commercial demand. The disruption forced smaller vendors to delay planned constellation expansion, temporarily limiting the revisit frequency improvements that customers had been promised in contract renewal negotiations already underway at the time.

Smaller vendors without dedicated launch contracts face a persistent competitive disadvantage, often paying rideshare launch pricing premiums of 15 to 25% above the negotiated rates larger constellation operators secure through multi-launch agreements. This exposure varies by business model too: vendors operating owned constellations absorb more launch cost volatility directly than those licensing processed data from government-operated satellite programs.
interferometric-synthetic-aperture-radar-market-cost-volatility-analysis-1789993570823

Securing Multi-Launch Agreements With Providers

Larger vendors are locking in multi-launch agreements directly with commercial rocket providers, guaranteeing scheduling priority and discounted pricing ahead of single-mission buyers during periods of tight launch capacity across the industry. These agreements typically require upfront capacity commitments but protect margins by fixing launch pricing well ahead of constellation expansion schedules planned in advance.

Diversifying Across Multiple Launch Providers

Several vendors are distributing satellite launches across multiple commercial launch providers, reducing dependency on any single provider's scheduling constraints during periods of elevated commercial demand across the broader industry and sector as a whole. This multi-provider approach adds modest coordination complexity upfront but has proven effective at maintaining consistent constellation deployment schedules over time.

Extending Satellite Operational Lifespan Through Design

Several vendors are engineering satellites for extended operational lifespans, reducing the frequency of replacement launches needed to maintain constellation capacity over time and across successive product generations, design cycles, and platforms. This engineering investment adds modest upfront manufacturing cost but reduces long-term launch expense meaningfully across the constellation's full service life and operational duration.

Portfolio Architecture for Margin Defence

Portfolio architecture in InSAR services splits into three distinct tiers, ranging from commodity single-pass survey products competing on price to certified continuous monitoring subscriptions carrying substantial margin premiums. Gross margins vary from the low twenties on basic survey products to over 55% on integrated continuous monitoring platforms with automated alert generation, reflecting the processing sophistication and constellation infrastructure required to sell credibly into large enterprise infrastructure and insurance accounts.
Volume economics still matter for smaller customers, since basic single-pass survey products account for a meaningful share of total transactions annually across research and academic applications. But value concentrates elsewhere: large enterprise infrastructure operators and insurers running continuous monitoring subscriptions with automated alerts generate a disproportionate share of vendor profit, paying recurring fees for capability that periodic survey products cannot match.

The highest-value pools sit at the intersection of high-frequency revisit capability and automated processing, where vendors combining both can command premium pricing that pure data providers cannot match. Sustainability-adjacent categories, including climate resilience monitoring for coastal infrastructure, remain smaller today but are attracting disproportionate development investment, since regulatory mandates create durable competitive barriers that commodity survey vendors struggle to clear.

Basic single-pass survey products sold largely on per-scene price, with gross margins in the low twenties given intense competition from low-cost regional and legacy data providers offering limited differentiation nationwide.
Gross Margin

Continuous monitoring subscriptions carrying proven detection accuracy and revisit frequency track records, commanding gross margins in the mid-thirties as customers pay for reduced detection latency and greater overall system reliability.
Gross Margin

Fully automated, regulator-recognized monitoring platforms paired with compliance reporting and automated alert generation, achieving gross margins above 55% through certification barriers that competitors cannot easily or quickly replicate at scale.
Gross Margin
interferometric-synthetic-aperture-radar-market-portfolio-architecture-1789993571340

High-value Sub-segments and Strategic Watch-out

Small Satellite Constellation-Based InSAR Services

Small satellite constellation-based InSAR services combine the fastest projected growth with the highest per-contract margins in the portfolio, driven by daily revisit capability that legacy government programs cannot match. Vendors capturing this segment early are positioned to defend pricing power as customers standardize on continuous monitoring platforms.

Infrastructure and Critical Asset Monitoring Services

Infrastructure and critical asset monitoring services pair strong growth with meaningful margin premiums, supported by aging infrastructure requiring more frequent structural assessment than manual inspection alone can provide. This segment carries higher regulatory recognition barriers than commodity survey products, limiting new entrant competition and helping established vendors retain pricing discipline.

Mining Subsidence Monitoring Services

Mining subsidence monitoring services represent the volume core of the market, generating a steady contract base even as growth moderates relative to satellite constellation and infrastructure categories. Margins here run moderately thinner, but the recurring safety compliance obligation provides vendors with a durable revenue stream across every mining customer relationship.

Agricultural Monitoring Services

Agricultural monitoring services carry the slowest growth in the portfolio and warrant strategic monitoring rather than heavy near-term investment, given limited current adoption relative to infrastructure and mining applications. A shift toward mandatory crop insurance risk assessment could extend this segment's relevance meaningfully within certain agricultural markets over time.

Where Monitoring Becomes Recurring Infrastructure Spend

InSAR monitoring subscriptions generate annuity-like economics once integrated into customer risk management workflows, since infrastructure operators and insurers rarely discontinue continuous deformation tracking once it demonstrates measurable early warning value. Vendors capture recurring revenue through subscription renewals, alert generation add-ons, and increasingly through regulatory compliance reporting tiers layered on top of the original monitoring contract, creating revenue that compounds over the customer relationship's lifetime.
Adoption depth and stickiness vary considerably by end-use vertical. Government infrastructure agencies, once integrated with a vendor's monitoring platform and compliance reporting workflows, rarely switch providers given the requalification burden involved, while mining operators show comparatively higher churn given more standardized project-based contracts. Insurance customers sit between these extremes, anchored by underwriting integration but still exposed to competitive displacement during major policy renewal cycles.

A generational shift in buyer profile is underway as chief risk officers and data science leads, rather than pure geospatial specialists, increasingly influence the purchasing decision for InSAR monitoring platforms. These technical buyers prioritize processing speed and integration flexibility over raw satellite specifications, favoring vendors who can demonstrate measurable risk reduction outcomes across comparable customer deployments rather than theoretical accuracy claims.
interferometric-synthetic-aperture-radar-market-end-use-penetration-index-1789993571871

Where Vendors Should Focus Investment

These are among the four positions where our research anticipates prominent divergence between winners and laggards over the coming forecast period. Each is grounded in the demand model, the regulatory perimeter, and the announced capacity pipeline.
01 / PROCESSING SPEED INVESTMENT

Prioritize automated processing pipelines over raw satellite resolution

Customers now value processing turnaround as much as raw radar resolution, since actionable deformation maps delivered within hours provide substantially more commercial value than higher-resolution imagery arriving weeks later after manual analysis by specialized technical staff. Vendors that have invested in automated processing pipelines are winning contracts specifically on turnaround time, a metric increasingly weighted alongside detection accuracy in procurement evaluations. Vendors delaying this investment risk losing enterprise renewals to competitors offering faster, automated deformation alert generation within their subscription contracts.
02 / CONSTELLATION REVISIT FREQUENCY EXPANSION

Expand constellation capacity to defend against commercial displacement

Small satellite constellation operators are rapidly displacing single-satellite government programs by offering revisit frequencies that legacy systems simply cannot match at comparable cost or operational scale across the broader industry landscape. Vendors without expanding constellation capacity risk losing commercial contracts to operators who can deliver daily or near-daily monitoring cadence across large infrastructure portfolios and asset networks. Expanding constellation capacity should be treated as a core strategic priority rather than an incremental capital expenditure decision deferred to later budget cycles.
03 / REGULATORY COMPLIANCE POSITIONING

Pursue regulatory recognition ahead of mandatory monitoring requirements

Regulatory bodies in several countries are beginning to mandate continuous InSAR monitoring for aging critical infrastructure, creating a compliance obligation that vendors can help customers satisfy through pre-formatted regulatory reporting capability. Vendors pursuing regulatory recognition and standardized compliance reporting early can position themselves as preferred partners as more jurisdictions adopt mandatory monitoring requirements over the coming years. This dynamic will likely accelerate as infrastructure failure incidents draw public attention to the value of continuous structural monitoring versus periodic manual inspection.
04 / INSURANCE SECTOR PARTNERSHIP DEVELOPMENT

Build insurance sector partnerships to accelerate commercial adoption

Insurance industry demand for quantified subsidence risk data represents one of the fastest-growing commercial demand sources, since insurers increasingly require continuous monitoring data as a standard underwriting input for large property and infrastructure portfolios. Vendors building dedicated partnership programs with major insurers can secure preferred vendor status ahead of competitors still selling primarily through direct enterprise sales channels alone. This dynamic will likely intensify as more insurers publish underwriting guidelines explicitly referencing quantified subsidence risk data requirements for high-value coverage.

Engagement Snapshot From the Field

A live engagement with an industry participant carrying material or product regulatory and market exposure ahead of a defining policy shift, showing how our research translates into a defensible multi-year portfolio strategy.
MARKET MINDS ADVISORY · CLIENT ENGAGEMENT SUMMARY
Interferometric Synthetic Aperture Radar Producer Strategic Portfolio Review and Transition Roadmap 2026·Investment Scenario on Interferometric Synthetic Aperture Radar Exposure Evaluation 2025-26
CLIENT PROFILE
The client is a mid-sized mining operator running several open-pit and underground extraction sites, generating substantial annual revenue from base metal production (client-reported, unverified by MMA). The organization had relied on periodic manual ground survey inspections for slope stability monitoring, conducted only quarterly given the cost and logistical complexity of deploying survey teams to remote sites.
STRATEGIC CHALLENGE
The client faced escalating regulatory scrutiny following a slope failure incident at a neighboring operation that drew significant attention to inadequate monitoring practices across the sector (client-reported, unverified by MMA). Leadership needed a continuous monitoring solution capable of detecting early-stage ground movement across multiple remote sites without requiring costly permanent sensor network installation.
MMA APPROACH
MMA conducted a comprehensive audit of existing monitoring coverage gaps, vendor evaluation criteria, and total cost of ownership across three competing InSAR service providers under evaluation by the client. The engagement combined primary interviews with site safety and operations leadership, competitive vendor benchmarking against the framework outlined in this report, and a phased rollout sequencing model prioritizing highest-risk slopes first.
KEY FINDINGS
  1. Quarterly manual survey inspections missed early-stage ground movement occurring between measurement cycles, creating a detection gap of up to three months at the client's highest-risk extraction sites.
  2. Two of the client's five sites showed measurable ground movement trends that had gone undetected for over a year under the previous quarterly manual inspection schedule and methodology.
  3. Competitors already running continuous InSAR monitoring showed meaningfully faster incident response times than the client across comparable slope stability events during the same measurement period reviewed.
  4. Site safety teams lacked a standardized data format for communicating ground movement trends to corporate risk management, creating inconsistent escalation practices across the client's five operating sites.
CLIENT PROFILE
The client is a mid-sized mining operator running several open-pit and underground extraction sites, generating substantial annual revenue from base metal production (client-reported, unverified by MMA). The organization had relied on periodic manual ground survey inspections for slope stability monitoring, conducted only quarterly given the cost and logistical complexity of deploying survey teams to remote sites.
STRATEGIC CHALLENGE
The client faced escalating regulatory scrutiny following a slope failure incident at a neighboring operation that drew significant attention to inadequate monitoring practices across the sector (client-reported, unverified by MMA). Leadership needed a continuous monitoring solution capable of detecting early-stage ground movement across multiple remote sites without requiring costly permanent sensor network installation.
MMA APPROACH
MMA conducted a comprehensive audit of existing monitoring coverage gaps, vendor evaluation criteria, and total cost of ownership across three competing InSAR service providers under evaluation by the client. The engagement combined primary interviews with site safety and operations leadership, competitive vendor benchmarking against the framework outlined in this report, and a phased rollout sequencing model prioritizing highest-risk slopes first.
KEY FINDINGS
  1. Quarterly manual survey inspections missed early-stage ground movement occurring between measurement cycles, creating a detection gap of up to three months at the client's highest-risk extraction sites.
  2. Two of the client's five sites showed measurable ground movement trends that had gone undetected for over a year under the previous quarterly manual inspection schedule and methodology.
  3. Competitors already running continuous InSAR monitoring showed meaningfully faster incident response times than the client across comparable slope stability events during the same measurement period reviewed.
  4. Site safety teams lacked a standardized data format for communicating ground movement trends to corporate risk management, creating inconsistent escalation practices across the client's five operating sites.
RECOMMENDED STRATEGY
Phase 1: Deploy continuous InSAR monitoring across all five sites within six months, prioritizing the two sites with previously undetected ground movement trends for immediate coverage. Phase 2: Standardize ground movement alert reporting into a single dashboard accessible to both site safety teams and corporate risk management for consistent escalation. Phase 3: Integrate automated deformation alerts into the client's existing safety incident response protocols, establishing clear escalation thresholds tied to movement rate.
OUTCOME
Within six months of full deployment, the client reported detecting ground movement at a third site nearly two months before it would have surfaced under the previous quarterly inspection schedule (client-reported, unverified by MMA). Site safety teams reported meaningfully improved confidence in slope stability data.

Frequently Asked Questions

Foundational context covering the market sizes, CAGR, scope, country, region and competition that inform every finding below. This section is provided to cover basics and most often pre-purchase conversations, answered from the MMA Primary Research Dataset.

What is the current size of the Interferometric Synthetic Aperture Radar Market?

The Interferometric Synthetic Aperture Radar Market reached an estimated $1.4 billion in 2025. This base reflects rising government infrastructure monitoring investment and expanding commercial satellite constellation capacity.

How large will the Interferometric Synthetic Aperture Radar Market be by 2036?

The market is projected to reach approximately $5.1 billion by 2036. This growth reflects sustained small satellite constellation expansion, insurance industry demand, and infrastructure aging concerns globally.

What is the CAGR for the Interferometric Synthetic Aperture Radar Market 2026 to 2036?

The Interferometric Synthetic Aperture Radar Market is projected to grow at a 12.5% compound annual growth rate between 2026 and 2036. This rate reflects accelerating commercial satellite adoption.

Which segment is growing fastest?

Small Satellite Constellation-Based InSAR Services is the fastest-growing segment, expanding at 18.0% annually, roughly 1.44 times the overall market rate. This reflects accelerating commercial revisit frequency demand.

Who are the major companies in the Interferometric Synthetic Aperture Radar Market?

Major companies include Airbus, MDA Space, Capella Space, ICEYE, and TRE Altamira. These vendors combine deep satellite manufacturing expertise with expanding commercial processing and monitoring capability.

Which country is growing fastest?

China is the fastest-growing country, driven by large-scale infrastructure monitoring programs and domestic satellite radar capability investment. Its 14.0% projected CAGR outpaces the broader East Asia regional average meaningfully.

Report Segmentation Architecture

The full report scope spans multiple orthogonal segmentation dimensions, with cross-tabulated demand data provided for each dimension pair. Coverage extends further to regional breakdowns, trend trajectories, and the competitive detail needed to support segment-level decision-making.

By Application Function

  • Small Satellite Constellation-Based InSAR Services
  • Infrastructure and Critical Asset Monitoring Services
  • Mining Subsidence Monitoring Services
  • Disaster Response Monitoring Services
  • Urban Land Subsidence Monitoring Services
  • Agricultural Monitoring Services

By End-Use Industry

  • Government and Public Infrastructure
  • Mining and Natural Resources
  • Insurance and Risk Management
  • Utilities and Energy
  • Transportation and Logistics
  • Agriculture and Environmental Monitoring

By Commercial Dimension

  • Data and Imagery Licensing
  • Continuous Monitoring Subscriptions
  • Automated Alert Generation Services
  • Regulatory Compliance Reporting

By Region

  • North America
  • Western Europe
  • East Asia
  • South Asia and Pacific
  • Latin America
  • Middle East and Africa
  • Eastern Europe

Scope, Methodology, and Coverage

Every figure in this report is reproducible from documented input assumptions. The scope below maps the historical period, the forecast horizon, the segmentation dimensions, and the countries covered, alongside the underlying primary and qualitative methodology.
Historical Period
2020 to 2025
Forecast Period
2026 to 2036
Base Year
2025 (USD billions; MMA Primary Research Dataset, September 2026)
Market Definition
The Interferometric Synthetic Aperture Radar Market covers satellite and airborne radar systems and processing services that detect ground and structural deformation through interferometric analysis of repeated radar passes. It excludes optical satellite imagery services and general weather radar systems unrelated to deformation measurement.
Quantitative Units
USD Billion, CAGR (%)
Segmentation Dimensions
By Application Function, By End-Use Industry, By Commercial Dimension, By Region
Regions Covered
North America, Western Europe, East Asia, South Asia and Pacific, Latin America, Middle East and Africa, Eastern Europe
Countries Covered
United States, Canada, Germany, United Kingdom, France, China, Japan, South Korea, India, Australia, Brazil, Chile, Saudi Arabia, United Arab Emirates, Poland
Key Companies Profiled
Airbus, MDA Space, Capella Space, ICEYE, TRE Altamira, Umbra Lab, Planet Labs, Thales Alenia Space, OHB System, Synspective, Hydrosat, SkyGeo, GAMMA Remote Sensing, e-GEOS, SAOCOM Argentina, NEC Corporation, Fugro, Sarmap, NV5 Geospatial, Descartes Labs
Quantitative Methodology
Primary survey, n=3,800 respondents, Q4 2025, six countries; demand-side model with trade association cross-validation
Qualitative Methodology
47 expert interviews, Q4 2025; applied to validate demand model assumptions, identify emerging dynamics, and assess competitive positioning
Report Format
PDF and XLSX data workbook (Word format preview document)
Publisher
Market Minds Advisory
Report Code
MMA-2026-TEC-947
Published
September 2026
Contact
sales@marketmindsadvisory.com | www.marketmindsadvisory.com

Purchase the full Interferometric Synthetic Aperture Radar Market Report (2026 to 2036).

This report provides comprehensive analysis of the Interferometric Synthetic Aperture Radar Market across all major application functions, regions, and competitive dynamics through 2036. It combines primary survey data from 3,800 respondents with 47 expert interviews conducted across six countries during the fourth quarter of 2025. The analysis covers segment-level growth forecasts, regional demand architecture, and competitive positioning assessments across the full ten-year forecast horizon, spanning infrastructure and mining applications. Readers gain the strategic context needed to inform investment prioritization, vendor selection, and market entry timing decisions.
Ten-year market sizing and forecast model
Segment-level growth and margin analysis breakdown
Regional demand architecture across seven regions
Competitive benchmarking and moat risk assessment
Input cost exposure and mitigation strategies
Anonymized client engagement case study review

Built For The People Who Decide

From boardroom strategy to bench-side execution, this report is read cover-to-cover by leaders shaping the next decade of their industry, turning demand scenarios, market dynamics and valuation benchmarks into decisions.
CXOs/ Presidents/ VPs/ Managers
M&A and Corporate Development
Strategy Teams and R&D Heads
Procurement and Product Directors
Regulatory and Compliance Leaders
Investor Relations and Equity Analysts