Market Minds Advisory
Intelligent Packaging Market

Intelligent Packaging Market: The Technology Works and the Incentives Do Not

An indicator that honestly reports condition reduces waste and creates liability for whoever printed it. The party who saves the money is almost never the party who pays for the tag.

Lead Analyst

Bilal Shaikh

Published

September 2026

Make Smarter Decisions with Customized Research Insights

Request a free sample report and evaluate market opportunities, growth trends, and competitive dynamics relevant to your business needs.

2025 MARKET VALUE$3.9BMarket Size 2025
2036 FORECAST VALUE$12.5BBase Case , 2026 to 2036
CAGR 2026 TO 203611.2 %Bull 12.4% / Bear 10.0%
INCREMENTAL OPPORTUNITY$8.2BNet 10- year value creation
EXPANSION MULTIPLE2.89x2036 value over 2026 base
Strategic Levers
M&A Pipeline
Regional Outlook
Country Rankings
Competitive Intelligence
Segmental Deep-dive
Call-Us : 91 93563 13602

Executive Snapshot and Market Trajectory

Two unrelated businesses share this market's name. One senses condition and reports it, which is a chemistry and liability problem. The other identifies a pack and links it to data, which is a printing and infrastructure problem entirely. Almost every published forecast conflates them anyway.
Growth here comes from regulation rather than from consumer engagement. Printed data carriers and digital links grow fastest at 16.8%, exactly 1.50 times the market rate, because European product passport rules now mandate a carrier on packaging in categories where no commercial case had ever succeeded. Near field communication follows at 12.6% on authentication rather than engagement. Western Europe holds the largest share, above its framework band, entirely on the strength of that legislation.
Concentration reaches 37% across the top five measured on annual component and system revenue, split between label converters and identification suppliers who rarely compete. The category's genuine constraint is incentive rather than capability: only 3% of retail food packs carry any spoilage sensing, and that is a liability problem rather than a technical one. Nobody has ever been blocked by the technology here, and the industry keeps improving it regardless.
Market Definition
This market covers packaging components and systems that sense product condition or carry machine-readable identity, spanning time-temperature indicators, printed data carriers and digital links, near field communication tags, item-level radio frequency identification, freshness and spoilage indicators, and tamper and authentication indicators. Scope is measured at supplier realised prices for tags, indicators, labels, and reader systems. Active packaging that modifies product condition, conventional barcodes for checkout, warehouse automation, and enterprise software platforms are excluded.
Base Year Value
$3.9B in 2025 (MMA Primary Research Dataset, August 2026)
Forecast Period
2026 to 2036, eleven discrete annual values
CAGR
11.2% base case. Bull 12.4%. Bear 10.0%.
Fastest Growth Segment
Printed Data Carriers And Digital Links: 16.8% CAGR
Fastest Growth Country
China: 17.6% CAGR
Fastest Growth Region
South Asia and Pacific: 13.2% CAGR
Largest Region
Western Europe: 29% of 2025 global value
Market Leaders
Avery Dennison. Zebra Technologies. Sealed Air. CCL Industries. Sato Holdings. Source: MMA Analysis based on company annual reports.
Primary Survey
n=3,800 procurement and R&D decision-makers, Q4 2025, six countries
Methodology
Demand-side build-up, cross-validated against public data, 47 expert interviews

Intelligent Packaging Market Forecast Scenarios

intelligent-packaging-market-size-forecast-scenario-1787299374558
The 2020 to 2025 period delivered one genuine success and a great deal of disappointment. Cold chain temperature monitoring scaled properly on vaccine distribution, where product value and regulatory expectation both justified it. Consumer engagement through tagged packaging was promoted heavily and largely failed, because scan rates never approached what the business cases assumed. A 9.8% historical rate averages real pharmaceutical adoption against consumer applications that never left pilot.
Three mechanisms carry the 11.2% base case. European digital product passport rules are the largest, mandating a data carrier on packaging across categories where no voluntary case had worked. Pharmaceutical and biologic cold chain expansion is the second, since a rising share of approved products requires monitored distribution. And authentication demand is the third, driven by counterfeiting in pharmaceuticals, spirits, and cosmetics rather than by any consumer interest in scanning.
The 12.4% bull case rests on freshness indicators finding a liability structure retailers accept, which would open a food waste application worth more than everything else in this category combined. The 10.0% bear case is product passport implementation slipping or settling on carriers so simple that they add almost no value beyond a printed code that costs nothing.

Who Pays and Who Actually Benefits

The technology has worked for years and the commercial model has not, which is unusual and worth understanding properly. A freshness indicator that honestly reports a product is still good three days past its printed date would remove enormous waste from the food system. It would also make the retailer liable if it were ever wrong. Deployment sits at 3% of retail food packs, and that is a liability calculation rather than a technical limitation.
TOP FIVE CONCENTRATION37%Split between label converters and identification technology suppliers
COMMUNICATION TAG UNIT COSTUSD 0.09Against a printed code costing effectively nothing per pack
PRINTED CODE SCAN RATE4%Consumers actually scanning a code present on pack
COLD CHAIN INDICATOR ADOPTION64%Vaccine and biologic shipments carrying a temperature indicator
FRESHNESS INDICATOR DEPLOYMENT3%Retail food packs carrying any spoilage sensing at all
TAG VALUE THRESHOLD2.1%Threshold above which item-level tagging stops being economic
The identification half has a different problem. A near field communication tag costs around nine cents while a printed code costs effectively nothing, and around 4% of consumers scan a code that is already present on the pack. The engagement business case has been promoted for a decade against a scan rate that never justified it, and brands have quietly stopped funding pilots.
Two forces will change this. European product passport rules mandate a data carrier where no voluntary case succeeded, which is the first genuine regulatory driver the category has ever had. And cold chain pharmaceutical monitoring at 64% adoption shows what happens when product value carries the cost easily.
"Every business case we are shown assumes the retailer will pay for a tag that saves the supplier money, or that the consumer wants a relationship with a yoghurt pot. Neither has ever been true. The applications that scaled are the ones where a single party pays and the same party captures the benefit, and there are fewer of those than the industry pretends."
Director. Connected Packaging and Identification Practice · MMA Packaging and Co

Market Trends

Product Passport Rules Mandate What Commerce Never Justified

European ecodesign rules require a digital product passport carried on or with the product across a widening set of categories, which means a machine-readable data carrier on packaging by regulation rather than by business case. That is the first genuine mandate this category has received. Printed two-dimensional codes satisfy the requirement most cheaply, which is why they grow at 16.8% while more capable carriers grow far slower. Brands are complying rather than innovating, and the value captured by suppliers depends entirely on whether they sell the carrier or the data infrastructure behind it.
Market Impact: China grows at 17.6% annually
Cold Chain Monitoring Shows What Working Economics Look Like

Around 64% of vaccine and biologic shipments now carry a temperature indicator, which is the highest adoption anywhere in intelligent packaging and the only application that scaled without regulatory compulsion. The reason is arithmetic: a consignment worth tens of thousands of dollars easily absorbs an indicator costing a few, and the party paying for it is the party who loses the product. Nothing about the technology is more advanced than a freshness indicator. Everything about the incentive structure is different, and that is the whole explanation. Nothing about the technology explains the difference at all.
Market Impact: Some 64% already carry indicators

Market Opportunities and Growth Drivers

Counterfeiting Drives Authentication Where Consumers Never Did

Pharmaceutical, spirits, and cosmetic counterfeiting imposes losses and safety risks that brand owners can quantify precisely, unlike consumer engagement which they never could. Authentication features on packaging, from covert printing through to serialised tags verified against a registry, are bought by brand protection functions with their own budgets and their own board reporting. That makes the sale entirely different from a marketing pilot. Chinese domestic traceability requirements across food and pharmaceutical categories add a second regulatory push, and China contributes the fastest national growth rate here at 17.6%. Brand protection budgets convert where marketing budgets never did.
Market Impact: Deployment stalls at 3% of packs

Biologic Distribution Growth Expands Monitored Cold Chain Volume

More approved therapies require temperature-controlled distribution than at any point previously, and each shipment of a high-value biologic carries an indicator because the consignment value makes it obvious. Adoption already sits at 64% and rises as the proportion of pharmaceutical volume represented by biologics increases. Regulators expect excursion documentation, and a passive indicator supplies it at a fraction of what a data logger costs. This is the one application in intelligent packaging where suppliers compete on performance rather than on justifying the concept to a sceptical buyer. Suppliers here compete on performance rather than on concept.
Market Impact: Threshold sits at 2.1% of value

Market Restraints and Challenges

Honest Freshness Indicators Create Liability Nobody Will Hold

An indicator reporting that food remains good past its printed date would remove substantial waste, and it transfers responsibility from a conservative date code to a sensor that might be wrong. Retailers decline that exposure and only 3% of retail food packs carry any spoilage sensing. The root cause is legal rather than technical: date codes are defensible because everybody uses them, while a sensor reading is an active claim. Participants are exploring indicator readings framed as advisory, retailer-controlled markdown triggers, and back-of-house use rather than consumer-facing display. Date codes are defensible precisely because everybody uses them.
Market Impact: Printed carriers grow at 16.8%

Tag Cost Against Product Value Blocks Grocery Item Tagging

Item-level tagging stops being economic above roughly 2.1% of product value, which is why apparel adopted radio frequency identification at scale and grocery did not. A nine cent tag on a garment worth forty dollars disappears into the margin; the same tag on a yoghurt costs more than the product earns. The root cause is silicon and antenna cost that has fallen steadily but not enough. Printed conductive antennas, chipless approaches, and simple printed codes are all being pursued to reach food-relevant cost points. Silicon and antenna cost has fallen steadily but insufficiently.
Market Impact: Adoption reaches 64% of shipments
2 additional market trends, 3 additional growth drivers, and 4 additional restraints and challenges are covered in the full report. Contact sales@marketmindsadvisory.com to access the complete intelligence.

Segment CAGR and Growth Architecture

Segmentation follows technology type, because each carries entirely different unit economics, buyer functions, regulatory drivers, and adoption barriers. Application category and packaging format both cut across every technology rather than separating them cleanly, so neither works as a primary dimension for a market this internally divided. Six technologies result, and two of them barely relate.
intelligent-packaging-market-market-share-analysis-1787299375097

Printed Data Carriers And Digital Links

The fastest technology at 16.8%, exactly 1.50 times the market rate, and it grows on legislation rather than on any commercial argument that succeeded. European product passport rules require a machine-readable carrier, and a printed two-dimensional code satisfies that requirement at essentially no unit cost, which is why brands are choosing it over anything more capable. The value for suppliers therefore sits in the data infrastructure and resolution services behind the code rather than in printing it. Scan rates among consumers remain near 4%, so anybody selling this on engagement rather than on compliance is still selling the wrong thing entirely. Compliance rather than engagement is what brands are buying.
CAGR 16.8%

Near Field Communication Tags

Second fastest at 12.6%, and the technology with the widest gap between capability and deployment. A tag costing around nine cents supports authentication, tamper detection, and a tap interaction that needs no camera or application, all of which a printed code cannot do. The obstacle is that a printed code costs nothing and covers most of what brands actually want. Where the tag wins is high-value authentication in spirits, cosmetics, and pharmaceuticals, and closure integrity where the tag breaks on opening. Unit cost has fallen for a decade and each fall opens a slightly larger set of products where the arithmetic finally works. Closure integrity applications are where it wins outright.
CAGR 12.6%
Full segment breakdown across 6 segments available in the complete report.

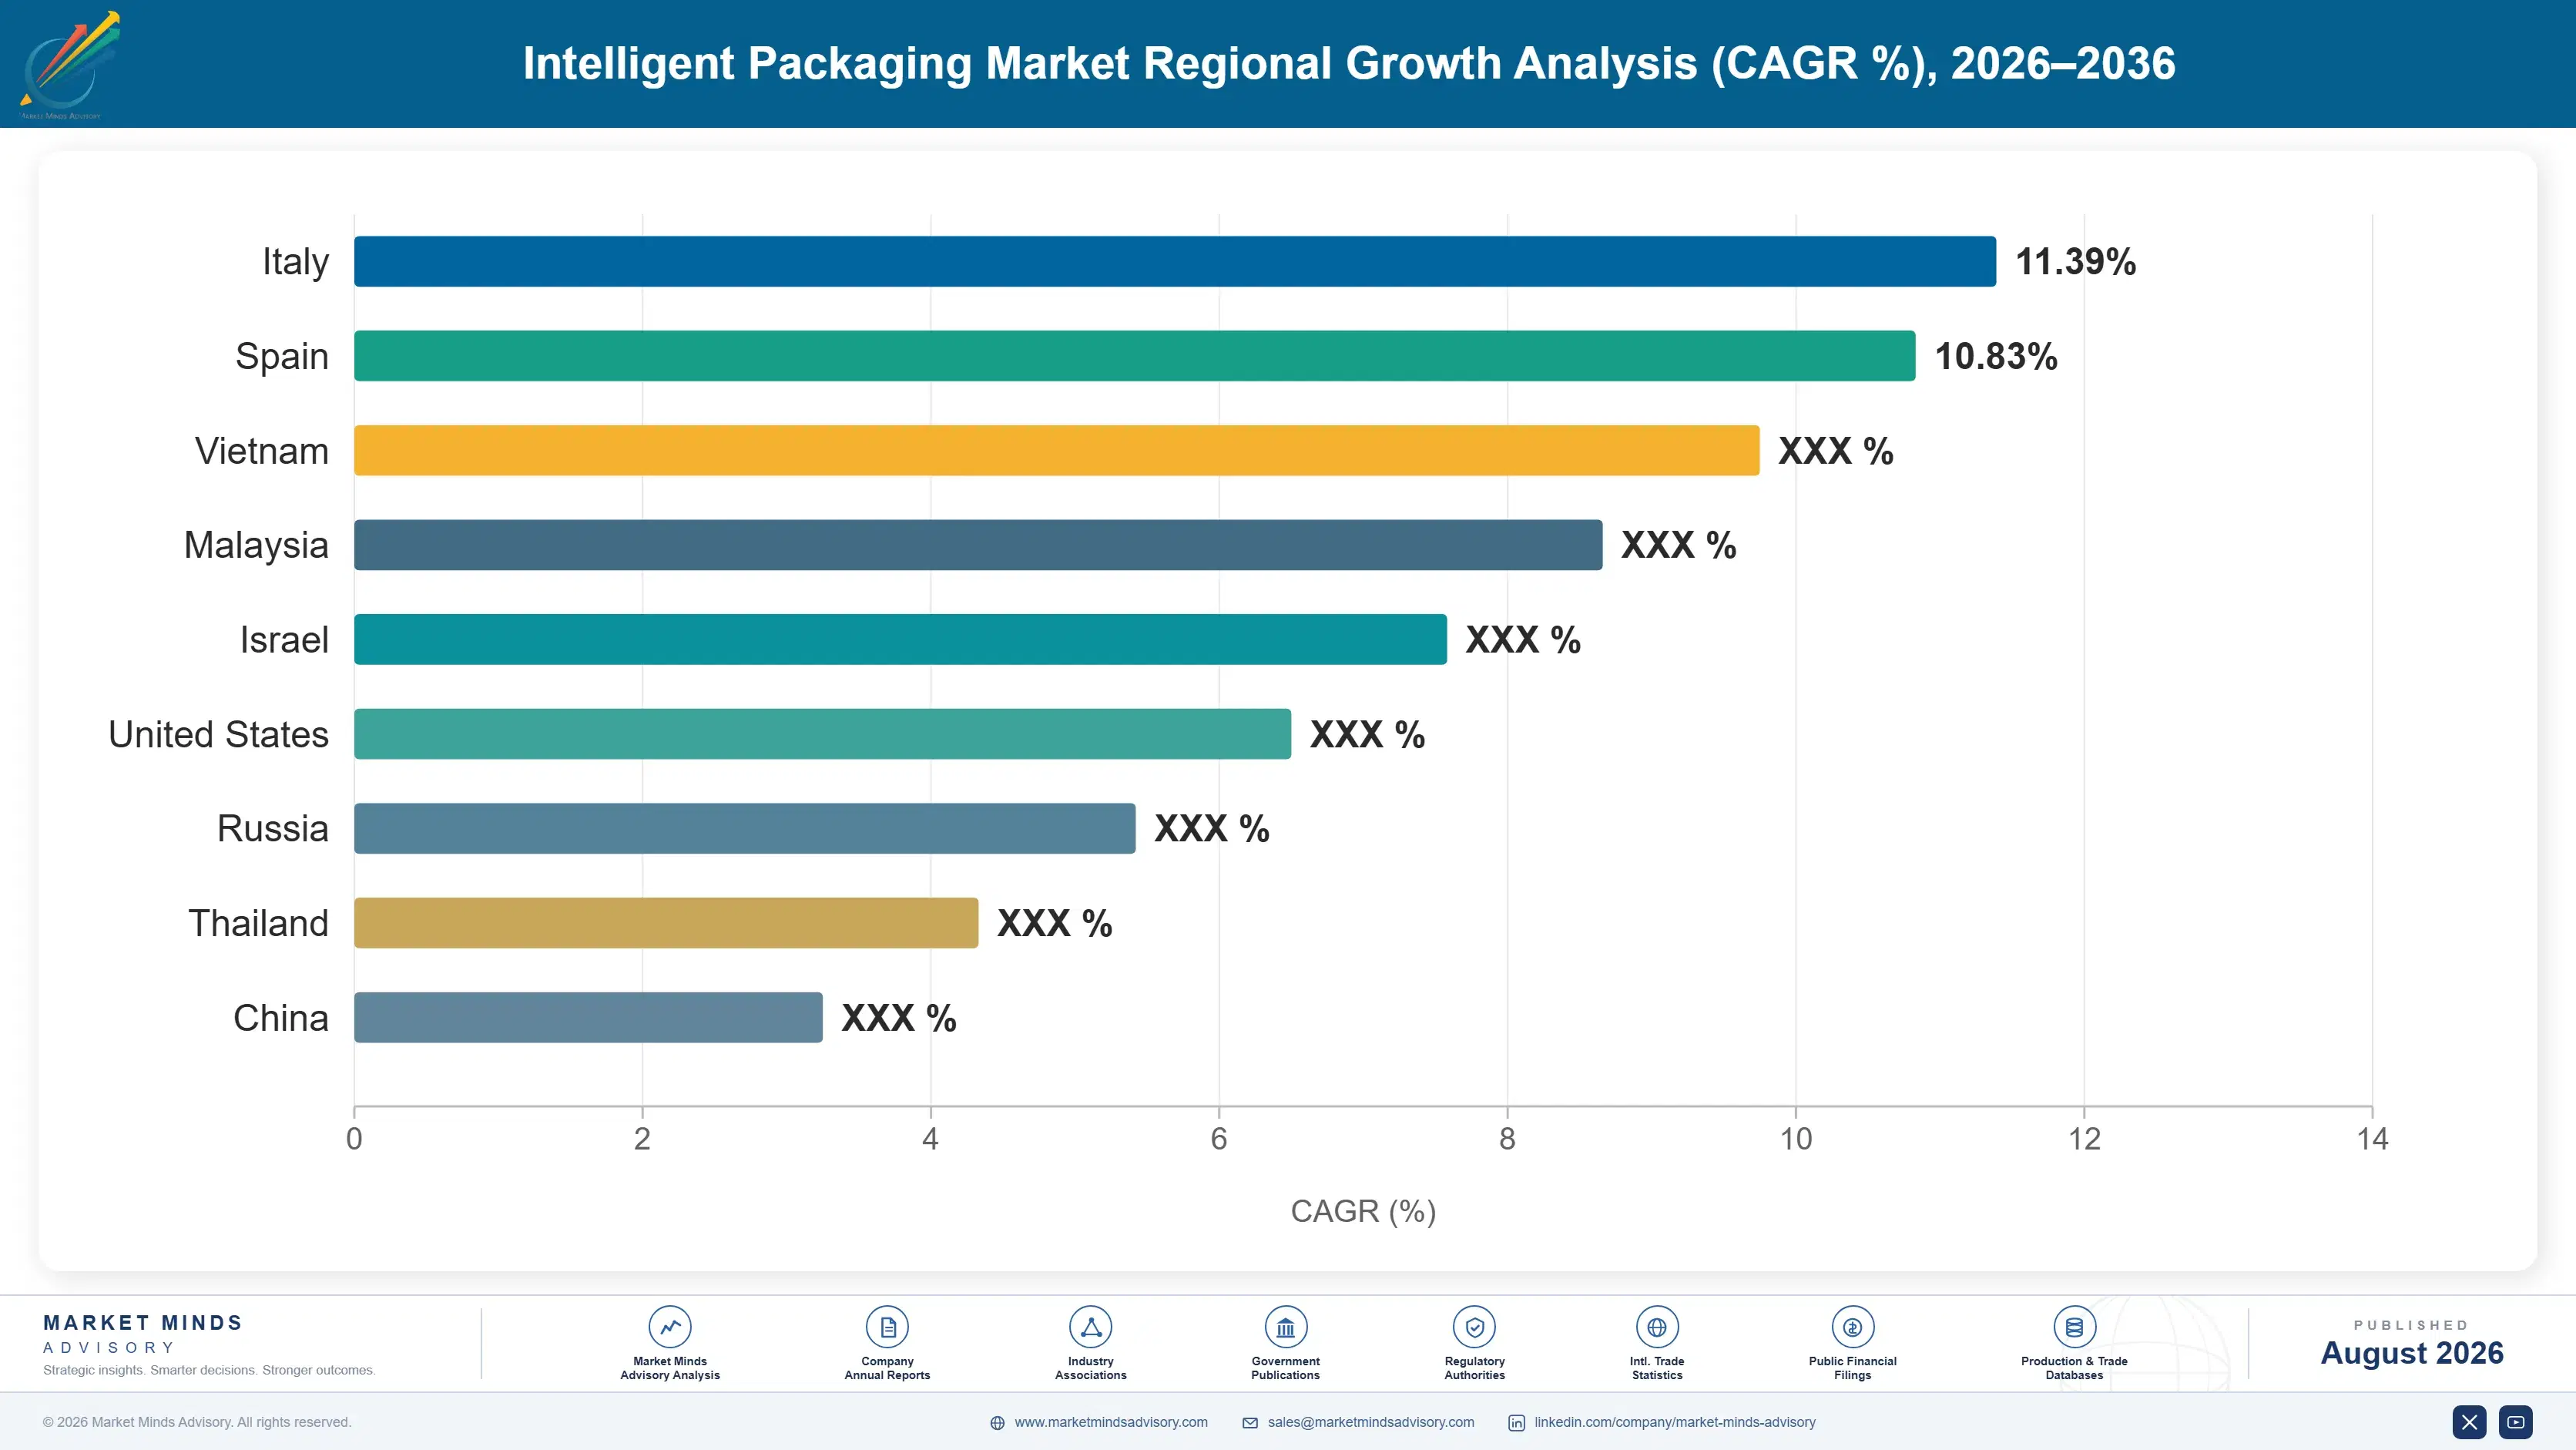
Regional Architecture and Country Demand Map

Adoption here follows regulation and product value rather than any consumer interest anywhere in the world. Western Europe sits well above its framework band purely because product passport legislation now mandates the data carriers that no voluntary business case had ever managed to justify commercially.

Western Europe

Twenty-nine percent, above the framework band, and the justification is legislation rather than any commercial enthusiasm. Ecodesign rules require a digital product passport carried on or with products across a widening category list, which mandates a machine-readable carrier on packaging where a decade of voluntary business cases had failed. Brands are complying at minimum cost, which favours printed codes over more capable tags. Pharmaceutical serialisation requirements add a separate established layer. Growth at 9.8% is the slowest of any region despite the mandate, because compliance is being met with the cheapest carrier available. Pharmaceutical serialisation adds a separate established layer here, and compliance is being met at minimum cost, Voluntary business cases had failed here for a decade.
Share: 29% | CAGR: 9.8% (2026 to 2036)

East Asia

Twenty-six percent, and Chinese domestic traceability requirements across food, pharmaceutical, and agricultural categories drive most of it. China contributes the fastest national growth rate in this forecast at 17.6%, supported by an existing infrastructure of code scanning that consumers already use routinely for payment and information. That behavioural base makes scan rates here far higher than the global average and changes which applications actually work. Japanese and Korean adoption skews toward authentication and cold chain rather than consumer engagement. Growth at 12.4% runs above the global rate on regulatory traceability and on genuine consumer scanning behaviour. Consumers already scan routinely for payment and information, which changes which applications actually work.
Share: 26% | CAGR: 12.4% (2026 to 2036)
Regional intelligence for 5 additional markets available in the complete report: North America, South Asia and Pacific, Latin America, Middle East and Africa, Eastern Europe. Contact sales@marketmindsadvisory.com.
intelligent-packaging-market-country-cagr-analysis-1787299375604

Four Ways to Sell What Actually Works

Technology capability has never been the constraint here and adding more of it changes nothing. Value comes from selling to whoever captures the benefit, from targeting products whose value carries the tag, from building for the mandate, and from solving liability before selling any sensor. Four levers follow, and none of them is technical.

Sell To The Party That Captures The Benefit Directly

Most failed business cases in this category ask one party to pay while a different one saves the money, which is why pilots convert so rarely. Cold chain monitoring scaled because the consignment owner pays and the consignment owner loses the product. Mapping who benefits before designing the offer sounds obvious and is skipped constantly. Suppliers who restructured proposals around a single paying beneficiary report conversion rates 3 times higher than those pitching shared-benefit models to two organisations at once. Cold chain at 64% adoption is the working example, which is the working example everyone cites.
Market Impact: Conversion improves by roughly 3 times over today

Target Products Where Value Absorbs The Tag Cost Easily

Item-level tagging works below roughly 2.1% of product value and fails above it, which is a straightforward filter almost nobody applies before starting a sales process. A nine cent tag suits garments, spirits, cosmetics, pharmaceuticals, and electronics accessories, and does not suit grocery at any realistic volume. Qualifying opportunities against that ratio before investing sales effort avoids the multi-year pilot cycles that have consumed this industry's commercial resources. The filter costs nothing and would have prevented most of the past decade's disappointments. Most of the past decade's disappointments were predictable.
Market Impact: Threshold sits at 2.1% of the product value

Build For The Mandate. Not For Consumer Engagement

Product passport rules require a data carrier and brands will comply at minimum cost, which means printed codes rather than tags. The revenue for suppliers therefore sits in resolution services, data hosting, and compliance reporting rather than in the carrier itself, which is close to free. Building that infrastructure costs around 7 million dollars and creates recurring revenue per stock keeping unit rather than a one-off print charge. Suppliers still selling engagement against a 4% scan rate are competing for budgets that have already been withdrawn. Those engagement budgets have already been withdrawn.
Market Impact: Data infrastructure costs roughly 7 million dollars total

Solve The Liability Structure Before Selling Any Indicator

Freshness sensing sits at 3% deployment because a retailer who displays an indicator becomes responsible for it, and no amount of accuracy data removes that exposure. Framing readings as back-of-house markdown triggers rather than consumer-facing claims transfers the decision to the retailer while keeping the liability with their own judgement. Suppliers who lead with indemnity structures, advisory framing, and internal-use deployment reach commercial conversations that consumer-facing propositions never get. The technology was never the obstacle here. The technology was never the obstacle in this application, and accuracy data does not address it.
Market Impact: Deployment remains stuck at 3% of retail packs

Who Controls the Margin Pool

Concentration reaches 37% across the top five measured on annual component and system revenue, and the field divides along a line that makes direct comparison difficult. Label converters sell indicators and printed carriers as an extension of pressure-sensitive labelling, while identification technology suppliers sell tags, readers, and infrastructure as a data business. Very few compete across both, and the two halves have almost nothing in common commercially. The two halves rarely bid against
Competition runs on three fronts. Regulatory compliance capability is the first and it now decides most European volume. Cold chain indicator performance is the second, where accuracy and validation matter to pharmaceutical buyers who audit properly. Data infrastructure is the third, and it is where the recurring revenue behind product passport compliance will actually sit. Very few suppliers hold positions across all three.

Pressure builds from two directions. Printed codes at essentially zero unit cost undercut every more capable technology wherever compliance rather than function is the requirement. And semiconductor tag costs keep falling, which slowly expands the set of products where tagging finally works. Both pressures favour whoever sells services over hardware, which is not how most incumbents are organised.
intelligent-packaging-market-company-positioning-matrix-1787299376124

Competitive Moat and Risk Dimensions

AVERY DENNISON

Moat: Label reach with tag integration

Supplying intelligent features as part of a label the customer already buys removes the adoption friction that standalone tag suppliers face constantly. A brand adding a carrier to an existing label specification makes a smaller decision than adopting a new component. That converting footprint places the company inside packaging specifications entirely.
AVERY DENNISON

Risk: Label economics dominate tag value

Selling identification as a label feature anchors pricing to label economics, where a few cents matters enormously, rather than to the data value the carrier actually enables. Recurring passport compliance revenue sits in resolution and hosting rather than in printing. A converter sells the cheap half.
ZEBRA TECHNOLOGIES

Moat: Reader infrastructure and enterprise integration

Tags are worthless without readers, and holding the installed reader base across retail, logistics, and healthcare puts the company on the infrastructure side of every deployment rather than competing on tag price. Enterprise integration is where these projects succeed or fail, and it is far harder than manufacturing a tag.
ZEBRA TECHNOLOGIES

Risk: Printed codes need no readers

Product passport compliance is being met with printed two-dimensional codes that any phone camera reads, which bypasses dedicated reader infrastructure entirely. The fastest-growing segment in this market is the one where the company's principal asset provides no advantage. Reader infrastructure remains essential in radio frequency identification deployments, and those are growing considerably more slowly.

Players Tracked

Prominent Players

Avery Dennison
Zebra Technologies
Sealed Air
CCL Industries
Sato Holdings

Other Key Players

Toppan
Dai Nippon Printing
Impinj
NXP Semiconductors
Identiv
Insignia Technologies
Timestrip
Vitsab International
Keep-it Technologies
Varcode
Sensitech
Controlant
Berlinger
Blue Bite
Schreiner Group

Recent Developments

FEBRUARY 2025

European rules confirm data carrier requirement across further categories

European ecodesign implementing measures extended digital product passport requirements to additional product categories, confirming that a machine-readable data carrier must accompany affected products. The measures were regulatory implementation rather than any new primary legislation, and compliance timetables run over several years. Category lists were published alongside the measures.
Signal: The first genuine mandate this category has ever received, and brands will meet it with the cheapest possible carrier
MAY 2025

Retailer trials freshness indicators as back-of-house markdown triggers

A European grocery retailer began trialling spoilage indicators used by staff to trigger markdown decisions rather than displayed to consumers, keeping interpretation and liability inside the retailer's own judgement. The trial was an internal operational pilot rather than any commercial partnership with an indicator supplier.
Signal: Removing the consumer-facing claim removes the liability objection, which is what has blocked this application for years
SEPTEMBER 2025

Chinese traceability requirements widen across food and pharmaceutical categories

Chinese authorities extended product traceability coding requirements across additional food and pharmaceutical categories, building on existing infrastructure that consumers already use for payment and product information. The extension was regulatory rather than any industry initiative, and enforcement timetables are staged. Enforcement dates vary by product category.
Signal: Consumer scanning behaviour is already established there, which makes carriers work commercially rather than only legally

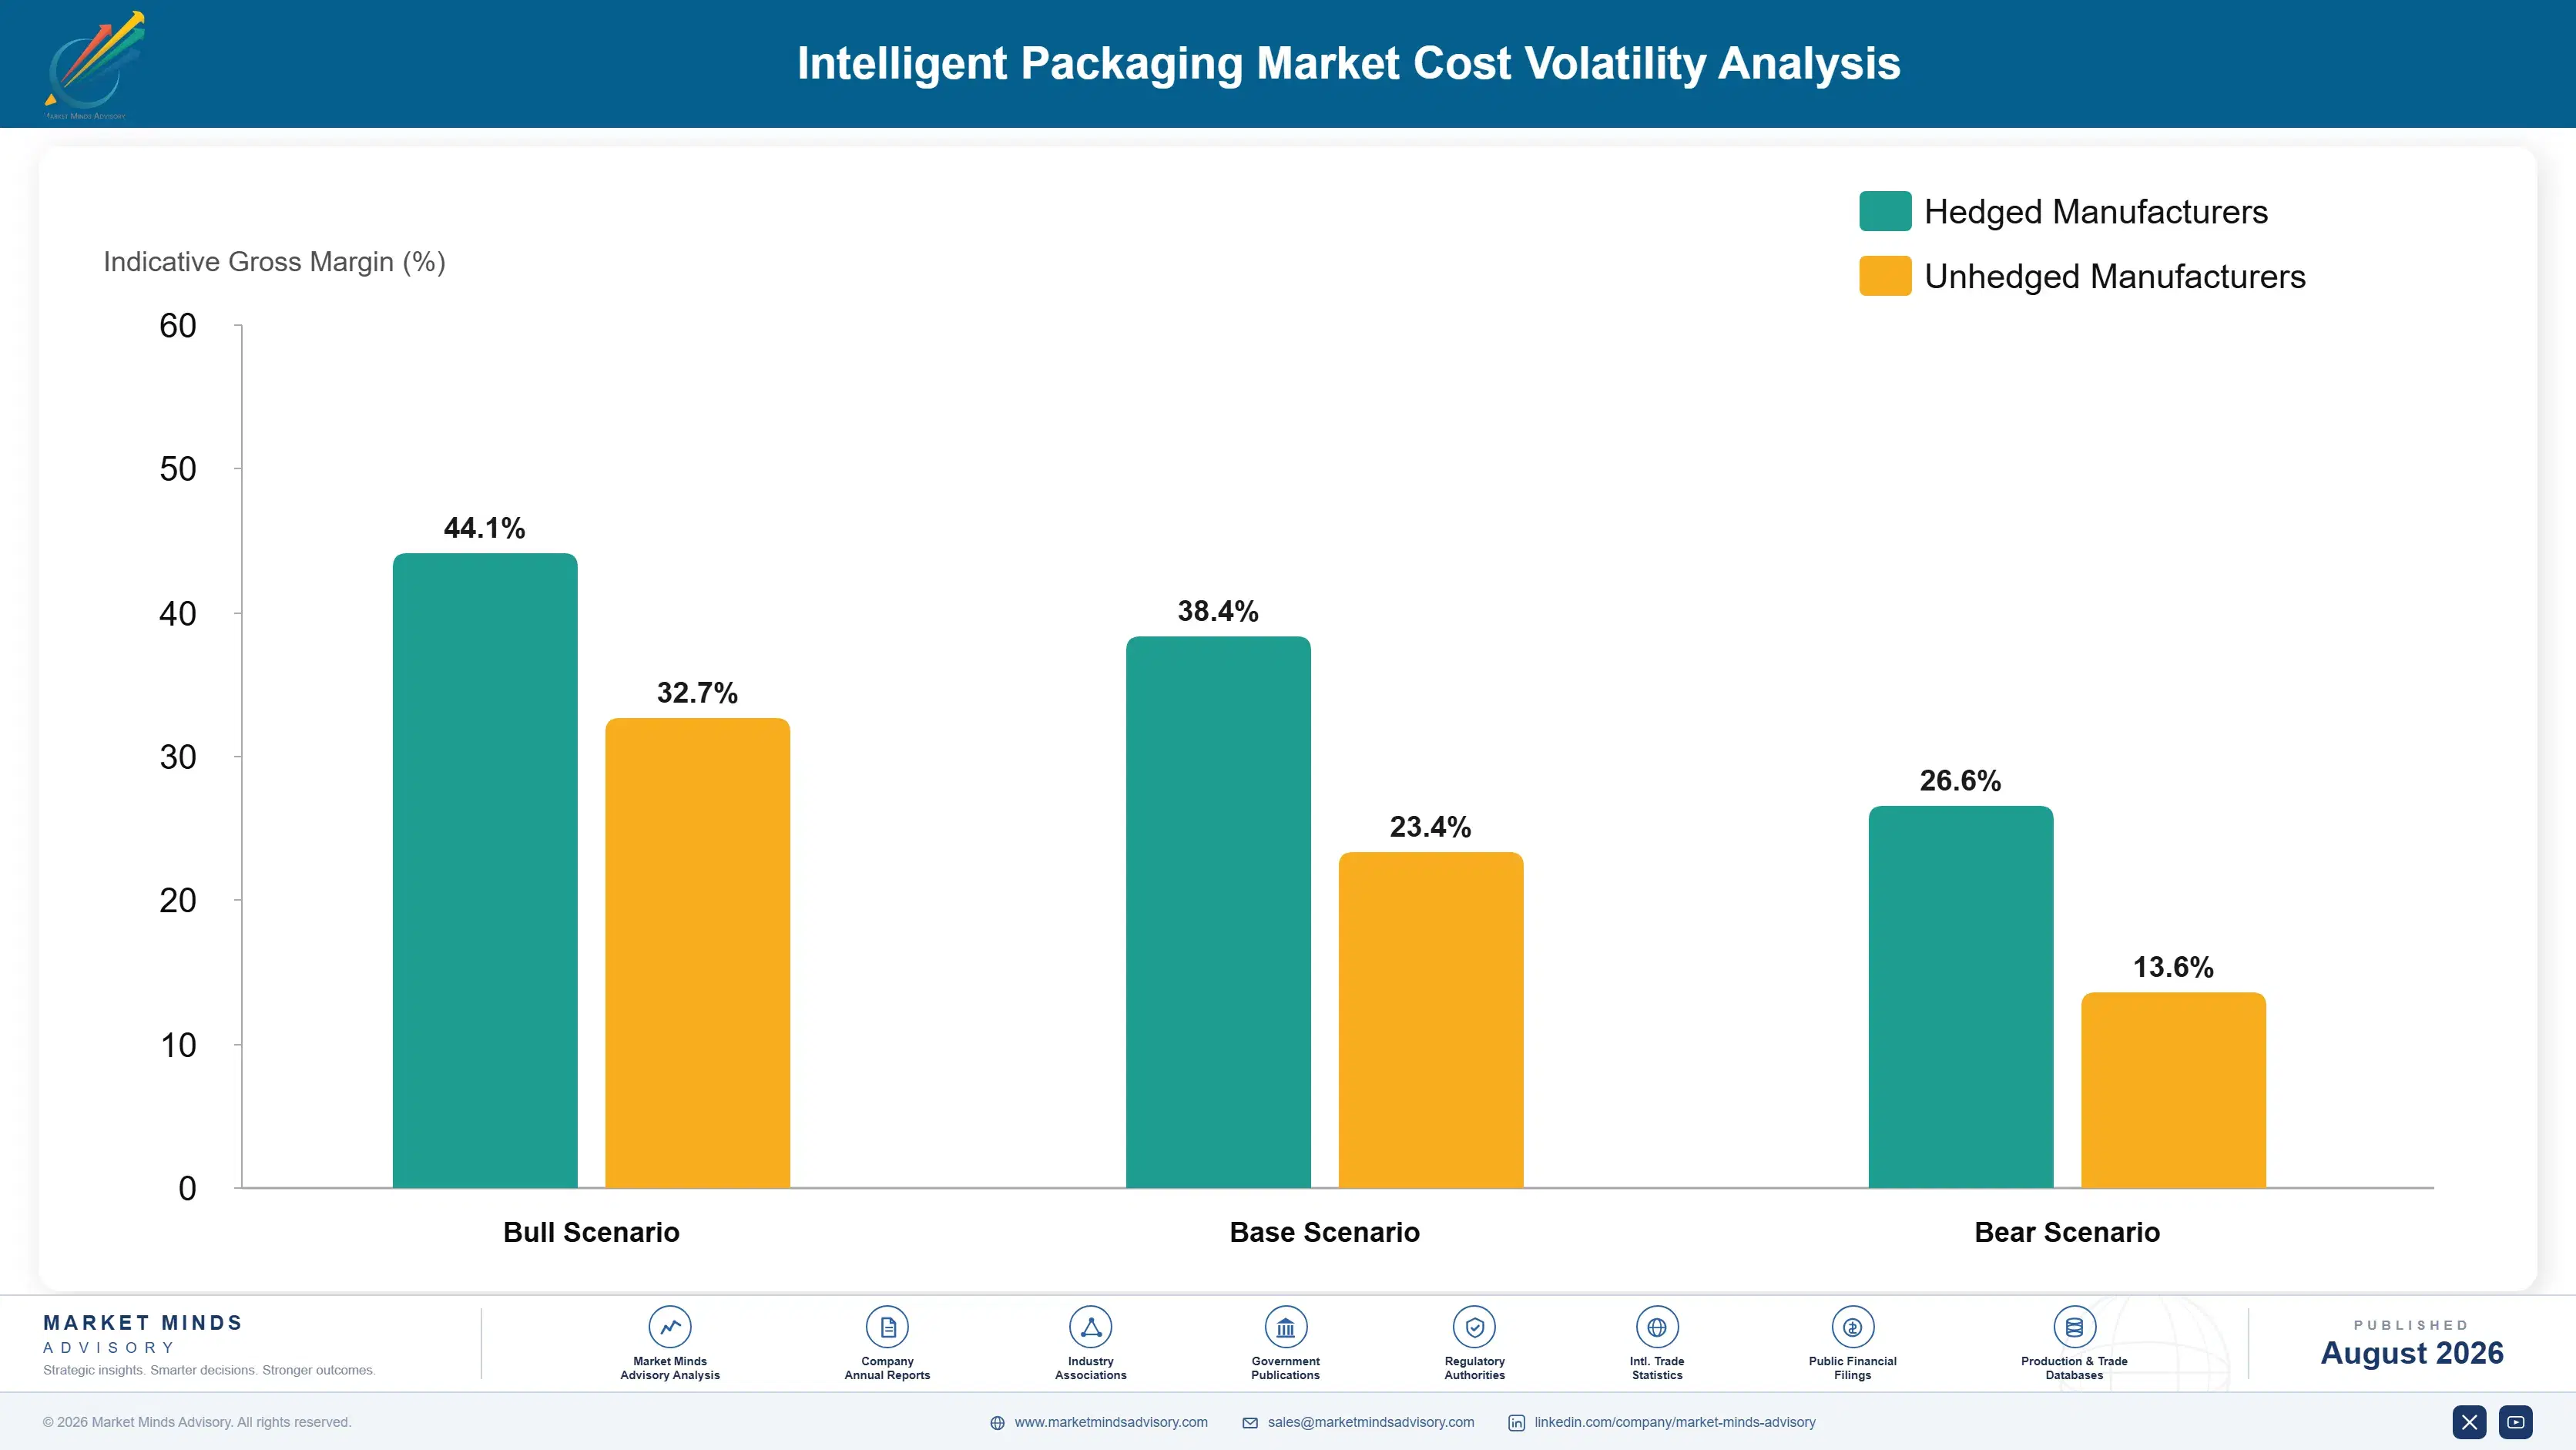
Silicon. Substrate, and Chemistry

Cost structure differs completely by technology. For communication and identification tags, the integrated circuit runs about 38% of unit cost and the antenna a further 21%, with conversion and label substrate making up the remainder. For indicators, reactive chemistry and the barrier construction protecting it carry around 44%, with substrate and conversion covering the rest. Printed carriers cost essentially nothing beyond the ink already being applied.
Semiconductor availability was the exposure that bit hardest. Tag integrated circuits are low-value parts made on mature nodes, which puts them at the back of every allocation queue when foundry capacity tightens, and lead times stretched severely during the recent disruption. Company annual reports across identification suppliers describe the constraint consistently. Aluminium and copper for antennas moved separately on metal pricing without ever threatening availability.

The competitive disadvantage mechanism runs through foundry relationships rather than assembly capability. A supplier with committed wafer allocation ships tags while one buying on the open market waits behind customers ordering higher-value silicon. Antenna and conversion capability is widely available and confers nothing. Indicator suppliers face an unrelated problem entirely, since reactive chemistry formulations are frequently single-sourced from specialty producers with no alternative qualified.
intelligent-packaging-market-cost-volatility-analysis-1787299376322

Hold committed wafer allocation for tag integrated circuits

Tag chips are low-value parts on mature process nodes, which means they are deprioritised whenever foundry capacity tightens and higher-value silicon competes for the same wafers. Committed allocation agreements secure scheduling position rather than merely price. Suppliers without them discovered during the last disruption that lead times stretched beyond what any customer would accept, and orders simply moved elsewhere.

Qualify printed antenna alternatives to etched metal construction

Etched aluminium and copper antennas dominate tag construction and carry both metal price exposure and a conversion step. Printed conductive antennas reduce material cost and remove that step, at some cost in read range that many applications tolerate. Qualification takes months of performance testing and cannot be compressed once a cost or supply problem has already arrived.

Dual-source reactive chemistry behind indicator formulations

Time-temperature and freshness indicators depend on reactive chemistry frequently supplied by a single specialty producer, and reformulating around an alternative requires revalidating the entire response curve against the claim being made. That work takes many months and regulatory or customer requalification alongside it. Nobody does it during a shortage because nobody can, which is exactly why it must precede one.

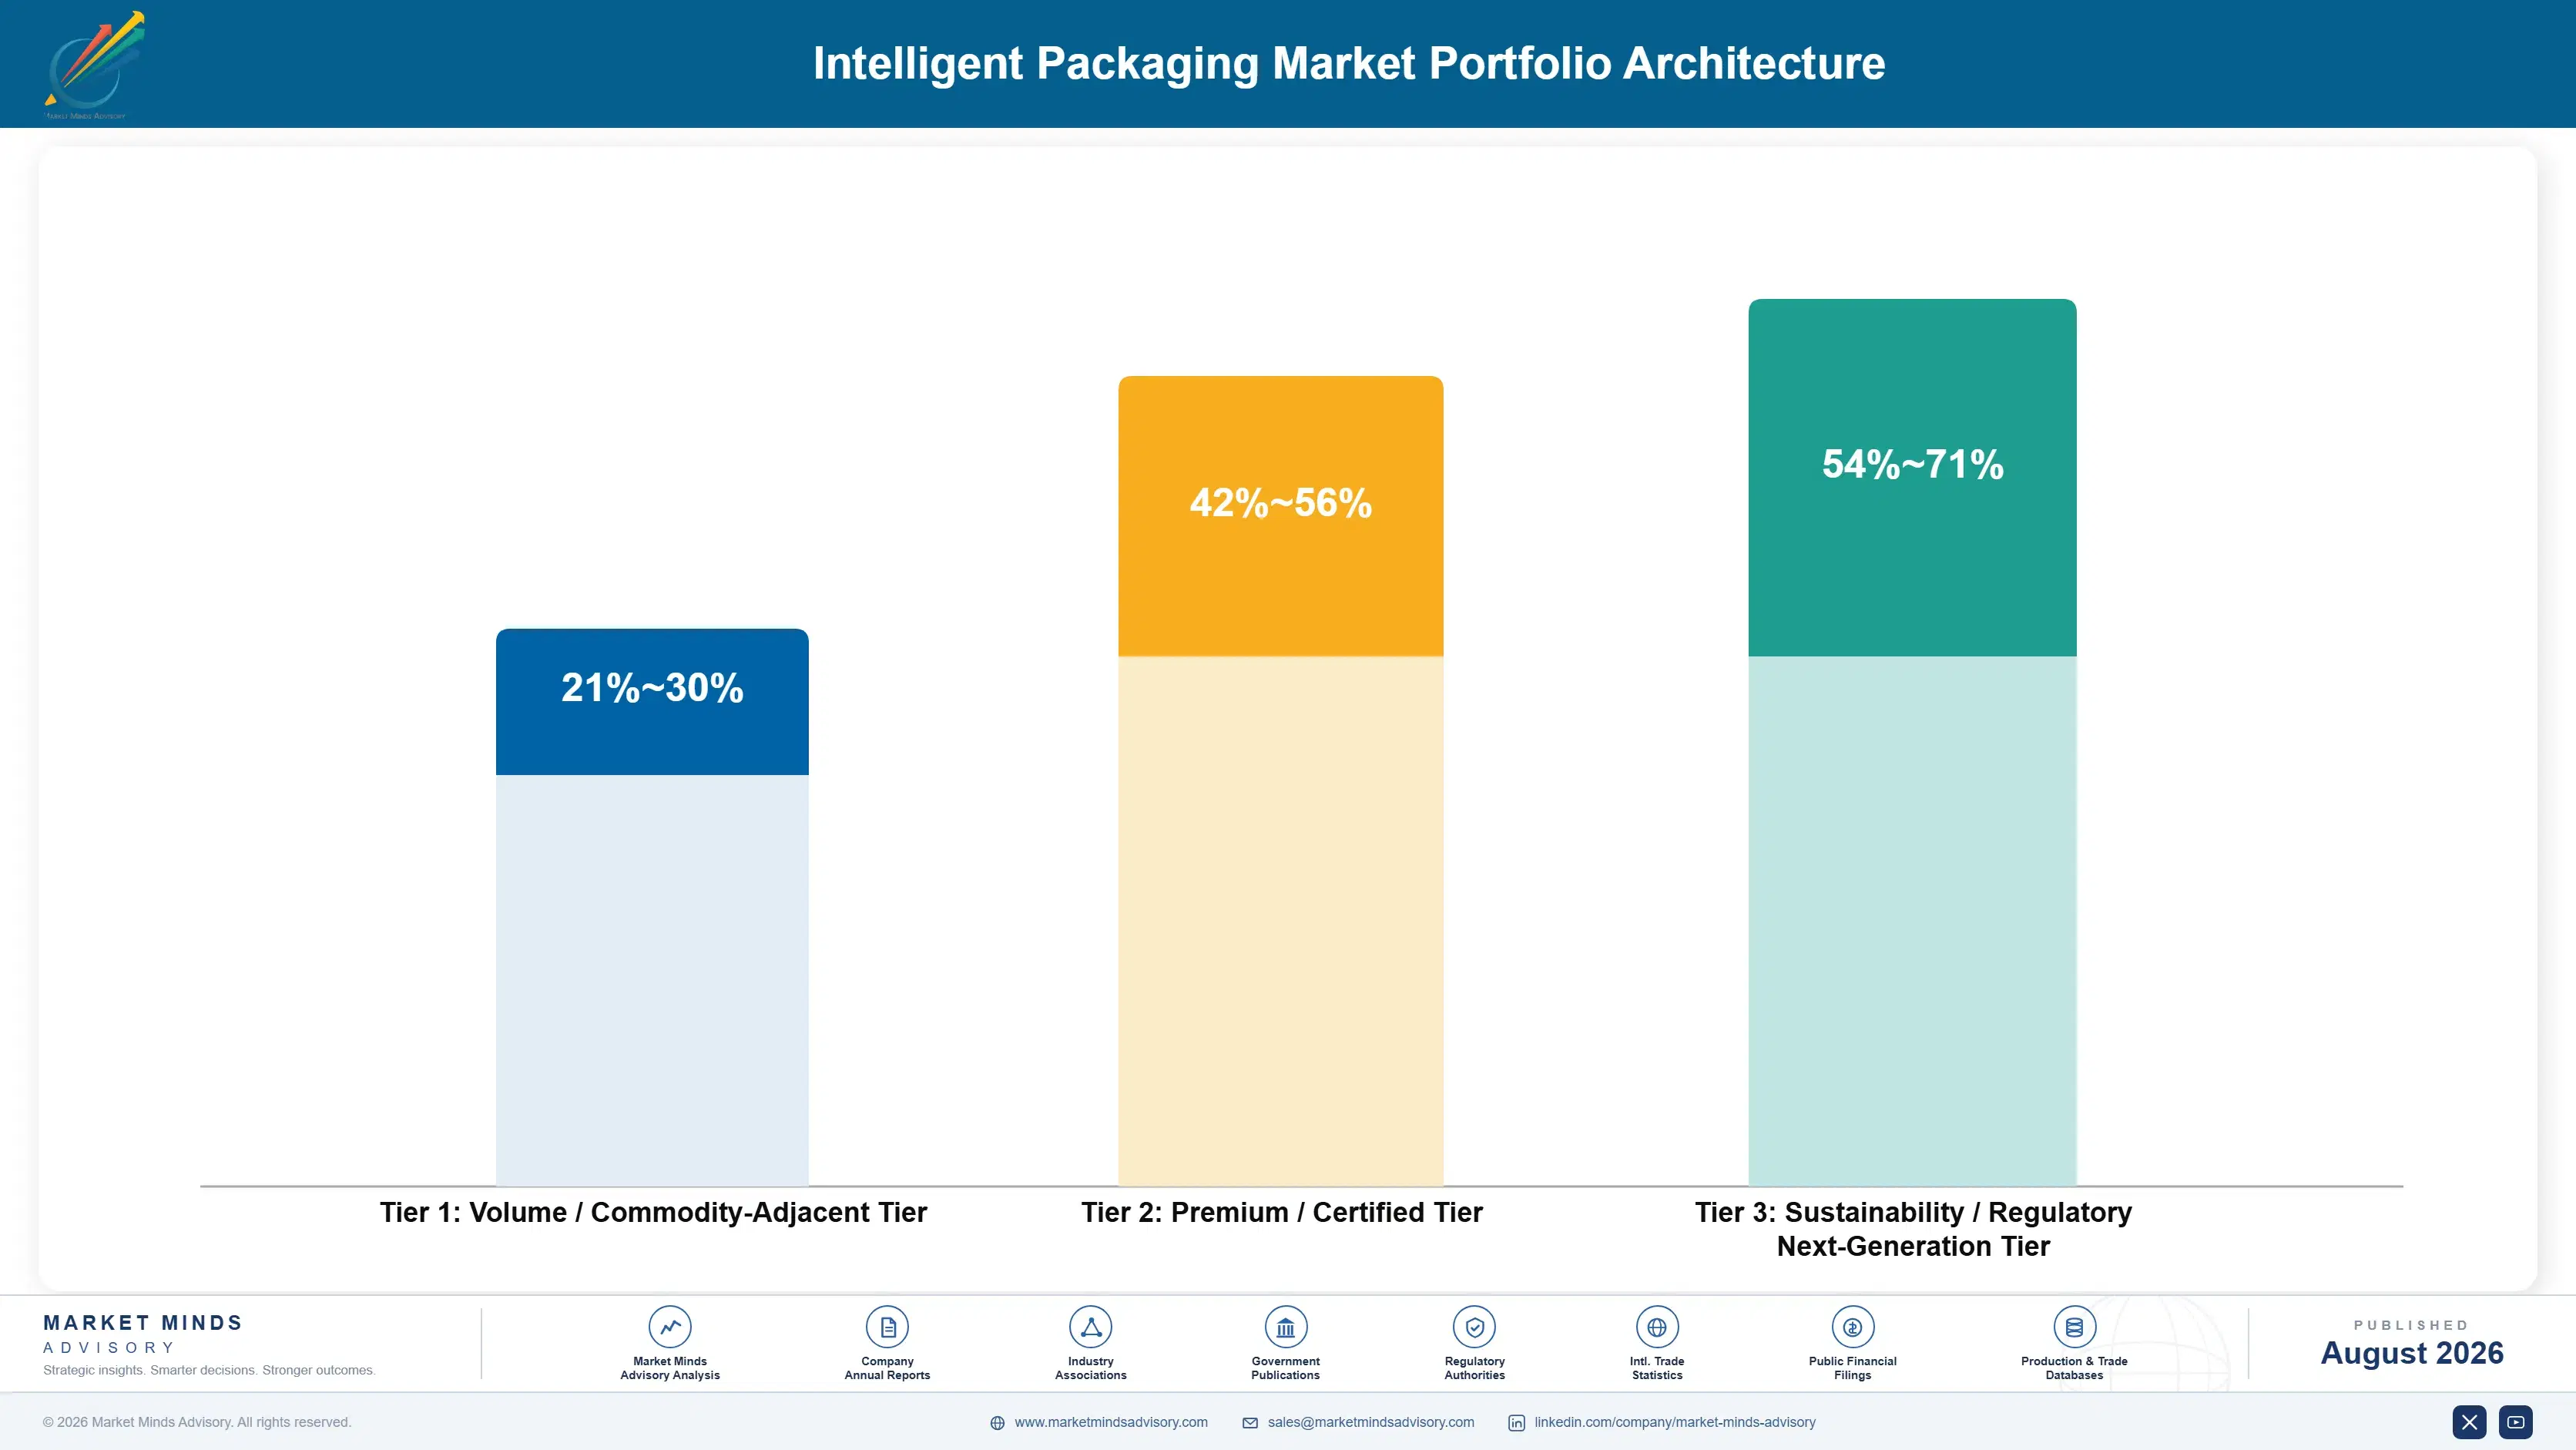
Portfolio Architecture for Margin Defence

Three tiers describe this business and the margin spread reflects who is paying and why. Printed data carriers sit at the bottom, essentially free to produce and sold as a compliance line item on a label the customer already buys. Validated indicators and authentication tags sit considerably higher, bought by functions with dedicated budgets and audit requirements. And data infrastructure with resolution and reporting services occupies a third tier where revenue recurs rather than arriving once.
The tension is that the mandated volume sits in the cheapest tier. Product passport compliance will attach a carrier to enormous numbers of packs and generate very little revenue per pack, while the valuable services behind that carrier are sold separately and to a different buyer. Suppliers who win the printing and lose the infrastructure will have captured the volume and none of the value. The valuable services sell to an entirely different buyer.

High-value pools concentrate where a function with its own budget buys against a quantified loss. Brand protection and pharmaceutical cold chain both do that, and neither requires convincing anybody the concept is worthwhile. Neither requires convincing anybody the concept is worthwhile, which is a considerable commercial advantage.

Volume / Commodity-Adjacent Tier

Printed two-dimensional codes and simple data carriers applied as part of existing label printing. Almost no incremental cost and almost no incremental revenue, but attached to the enormous volume that product passport compliance will mandate across categories.
Gross Margin: 21-30%

Premium / Certified Tier

Validated time-temperature indicators, authentication tags, and tamper-evident closures bought by cold chain and brand protection functions holding their own budgets. Margin reflects validation, accuracy documentation, and audit support rather than the materials involved in making them.
Gross Margin: 42-56%

Sustainability / Regulatory / Next-Generation Tier

Data resolution services, product passport hosting, compliance reporting, and analytics behind the carrier on pack. Best margin and genuinely recurring, since revenue arrives per stock keeping unit annually rather than once at printing.
Gross Margin: 54-71%
intelligent-packaging-market-portfolio-architecture-1787299376830

High-value Sub-segments and Strategic Watch-out

Product Passport Data Infrastructure

Best margin and genuinely recurring, since resolution and hosting revenue arrives per stock keeping unit every year rather than once. Suppliers winning the printing and losing this will have captured all of the volume and none of the value. Building it costs around seven million dollars.
Gross Margin: 54-71%

Cold Chain And Authentication Indicators

Strong margin bought by functions holding their own budgets against quantified losses, with cold chain adoption already at 64% of biologic shipments. Nobody in these conversations needs convincing that the concept is worthwhile at all. Losses here can be quantified precisely by the buyer and reported internally.
Gross Margin: 42-56%

Printed Data Carriers On Pack

The volume core at minimal margin, attached to enormous mandated volume while generating almost nothing per pack. It is worth holding only as the route into the infrastructure revenue that sits behind the carrier. Brands will comply using the cheapest carrier available, which is a printed code costing nothing.
Gross Margin: 21-30%

Consumer Freshness Indicators

The strategic watch-out, technically ready for years and stuck at 3% deployment because a displayed indicator transfers liability to whoever shows it. Back-of-house markdown framing is the route around it that suppliers have finally started testing. Accuracy data has never once removed that exposure in any trial run so far.
Gross Margin: 38-52%

How This Demand Actually Behaves

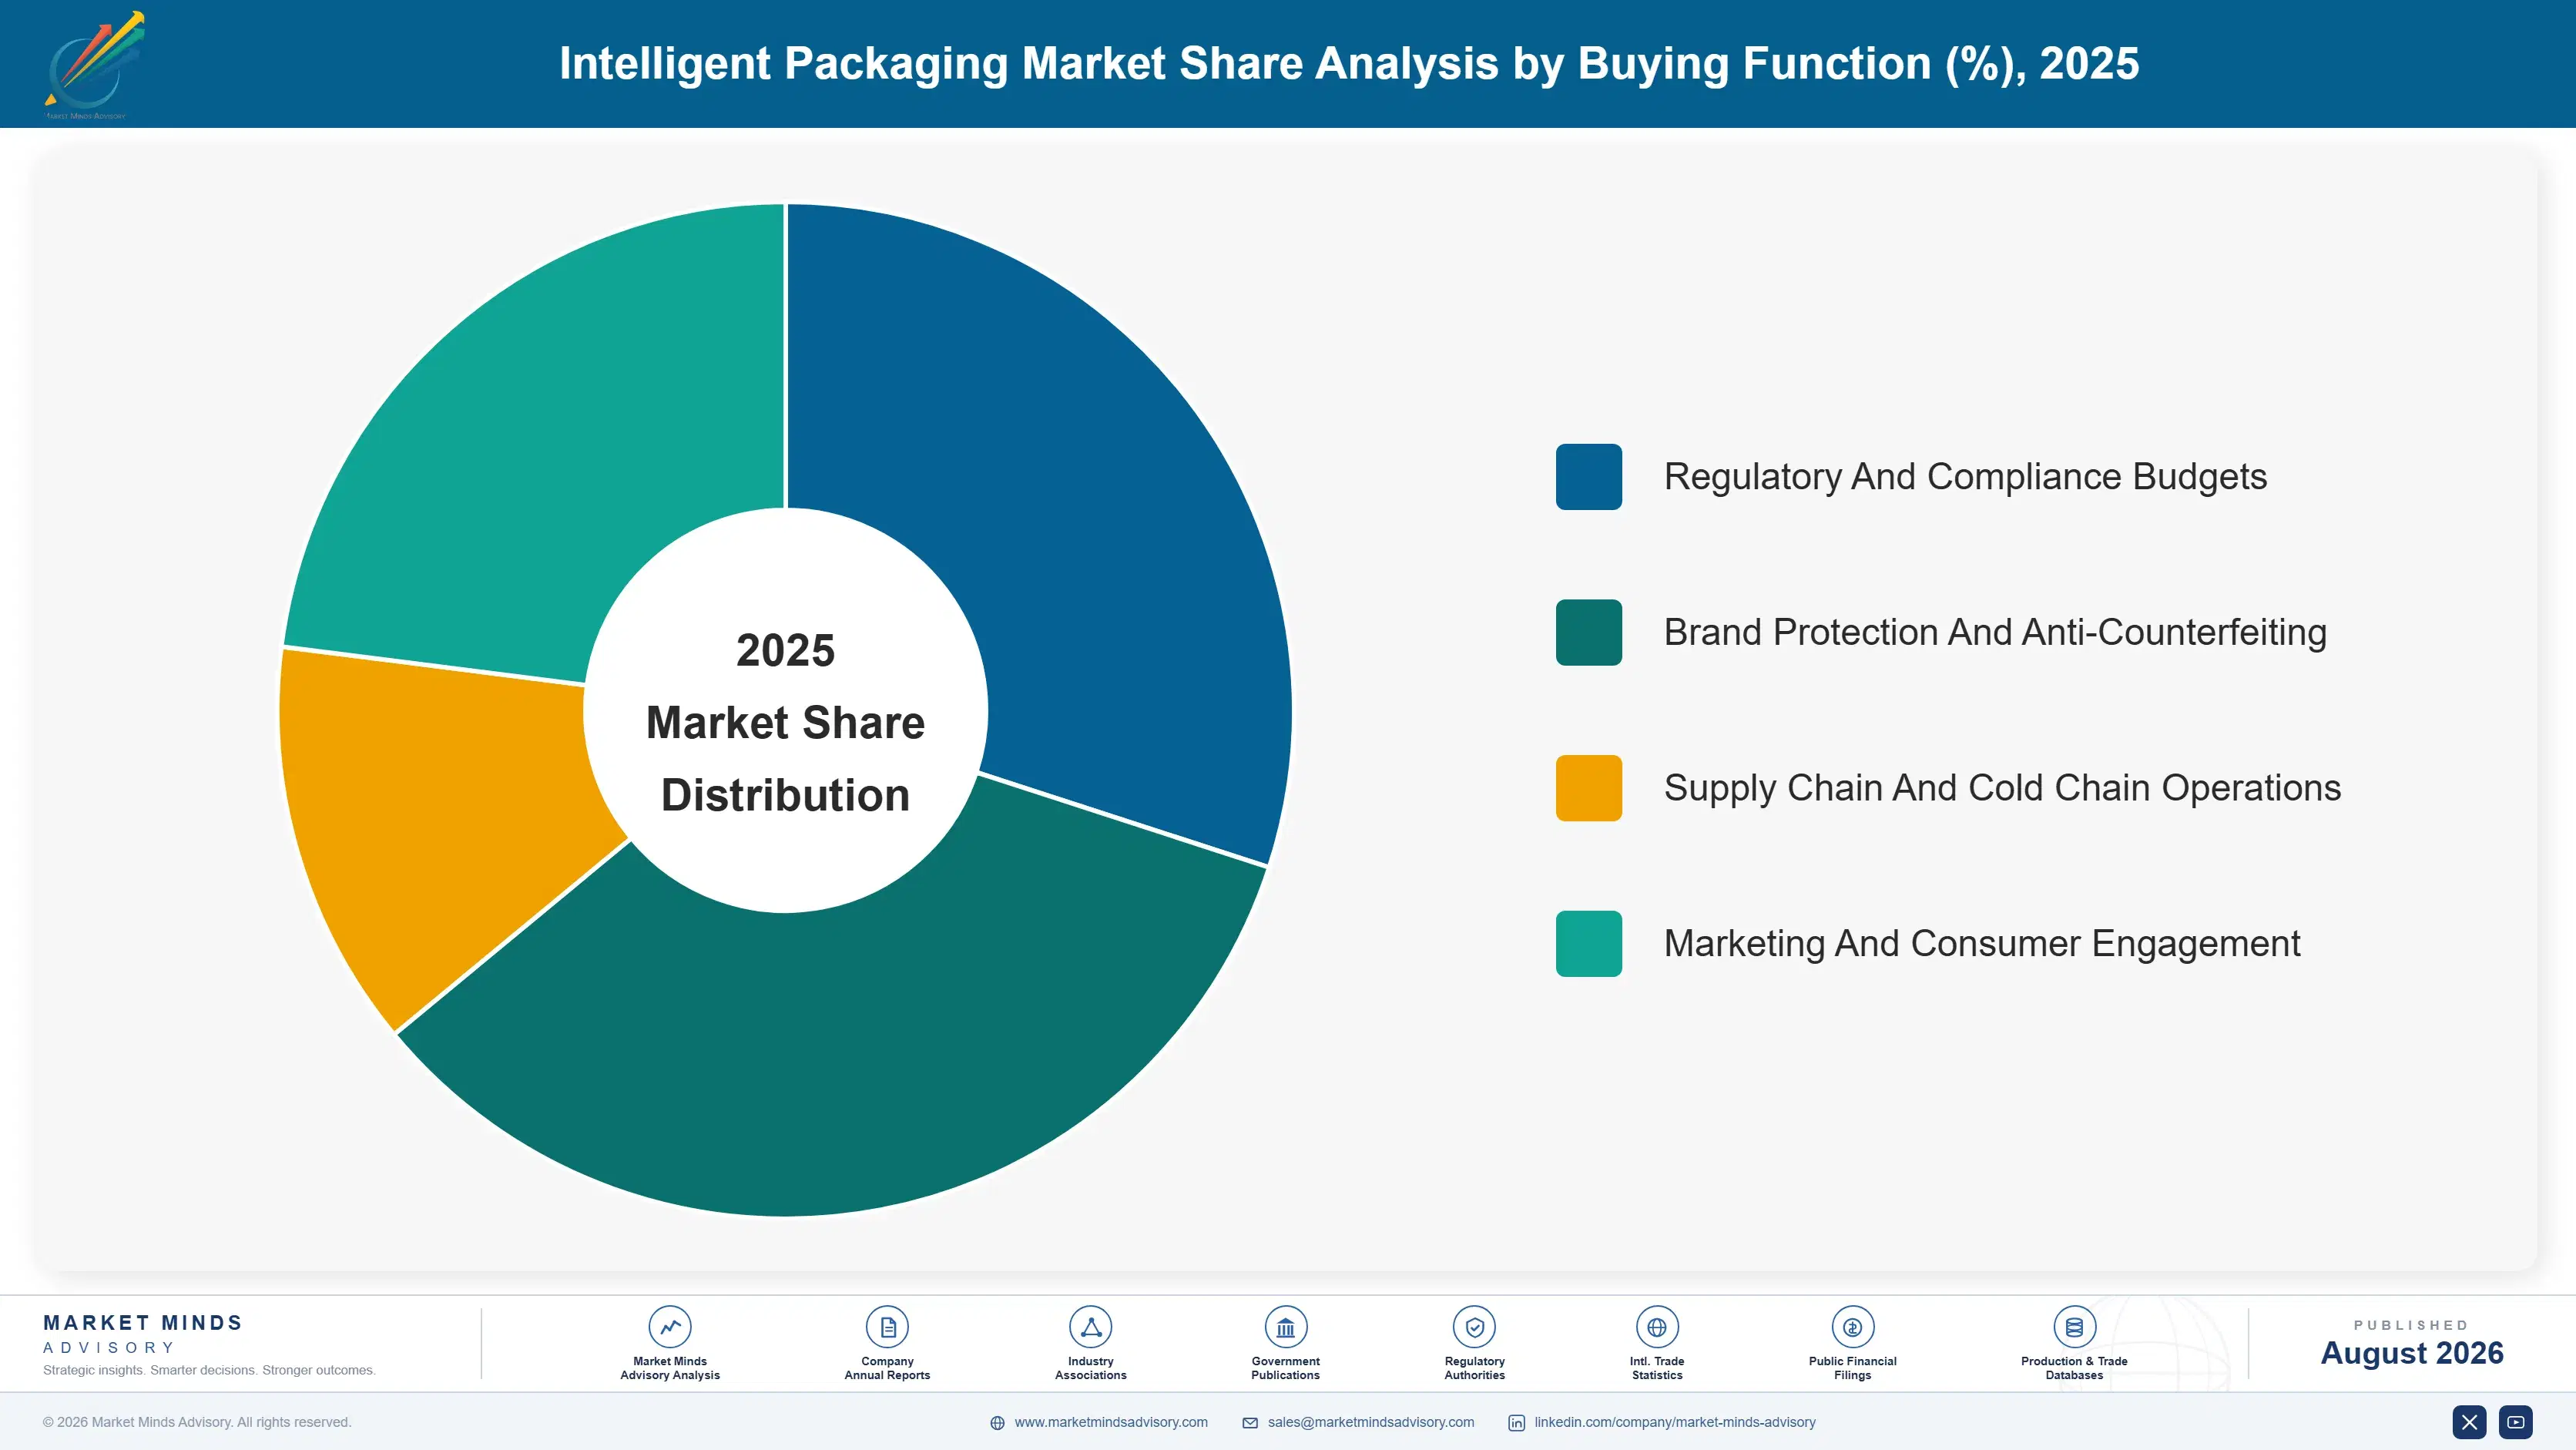
Adoption here is binary rather than gradual, which is unlike most packaging categories. A brand either specifies an indicator or carrier across a product line or it does not, and the decision is made once at a programme level rather than negotiated per order. Once specified, volume follows the product's own sales and the supplier is locked in by artwork, validation, and system integration. Losing an account means losing an entire line at once rather than a percentage of it.
Depth of adoption varies enormously by buying function. Cold chain and brand protection functions hold dedicated budgets, quantify their own losses, and buy without needing the concept justified. Marketing functions funded a decade of consumer engagement pilots and have largely stopped. Regulatory affairs now buys compliance carriers because they must. Operations functions are the newest buyers, and they want indicators for internal decisions rather than for display.

Buyer profiles are shifting decisively away from marketing. The budget that funds intelligent packaging increasingly belongs to compliance, brand protection, or supply chain rather than to anybody selling to consumers. Suppliers organised around marketing relationships are calling on people, who no longer hold the budget at all.
intelligent-packaging-market-end-use-penetration-index-1787299377320

What We Would Tell a Board

These are among the four positions where our research anticipates prominent divergence between winners and laggards over the coming forecast period. Each is grounded in the demand model, the regulatory perimeter, and the announced capacity pipeline.
01 / BENEFICIARY ALIGNMENT DISCIPLINE

One party must pay and benefit, or nothing happens

Cold chain monitoring reached 64% adoption because the consignment owner pays for the indicator and the consignment owner loses the product when it fails, while retail freshness sensing sits at 3% because the supplier saves the waste and the retailer carries the liability. That difference explains this entire market far better than any technology comparison does. Suppliers who map the paying beneficiary properly before designing an offer convert at roughly three times the rate of those still pitching shared-benefit models.
02 / VALUE RATIO QUALIFICATION

Two percent of product value is the whole filter

Item-level tagging works below roughly 2.1% of product value and fails above it, which is why apparel adopted radio frequency identification comprehensively and grocery has declined it repeatedly for twenty years. A nine cent tag disappears entirely into a garment margin and exceeds what a yoghurt pot actually earns. Applying that ratio as a qualification filter before committing any sales effort would have prevented most of the multi-year pilot cycles that consumed this industry's commercial resources across the past decade.
03 / INFRASTRUCTURE REVENUE CAPTURE

Win the carrier and you have won almost nothing

Product passport rules will attach a data carrier to enormous numbers of packs, and brands will meet that requirement with a printed code costing essentially nothing to apply. The revenue sits in resolution services, hosting, and compliance reporting behind the code, which recurs annually per stock keeping unit rather than arriving once at printing. Building that infrastructure costs around 7 million dollars, and suppliers who take the printing without it will hold all of the volume and none of the value.
04 / LIABILITY FRAMING FIRST

Sell the indemnity structure before the sensor

Freshness sensing has been technically ready for years and sits at 3% deployment because a retailer displaying an indicator becomes answerable for it, and no accuracy data has ever removed that exposure. Reframing those readings as back-of-house markdown triggers keeps both interpretation and liability inside the retailer's own judgement, which is a conversation they will actually agree to have. Suppliers leading with indemnity structures and internal-use deployment reach commercial discussions that consumer-facing propositions have never once managed to reach at all.

Engagement Snapshot From the Field

A live engagement with an industry participant carrying material or product regulatory and market exposure ahead of a defining policy shift, showing how our research translates into a defensible multi-year portfolio strategy.
MARKET MINDS ADVISORY · CLIENT ENGAGEMENT SUMMARY
Intelligent Packaging Producer Strategic Portfolio Review and Transition Roadmap 2026·Investment Scenario on Intelligent Packaging Exposure Evaluation 2025-26
CLIENT PROFILE
An intelligent packaging technology supplier with approximately 160 million dollars in annual revenue (client-reported, unverified by MMA), selling communication tags, printed carriers, and freshness indicators into consumer goods and retail across Europe and North America. The company sold predominantly to brand marketing functions, priced carriers as components rather than services, and had run consumer engagement pilots with eleven brands over four years.
STRATEGIC CHALLENGE
Pilot-to-deployment conversion had run below one in five across four years, and freshness indicator sales had stalled entirely despite favourable accuracy testing. Management proposed increased marketing investment to build category awareness. The board wanted an independent assessment of whether awareness was genuinely the constraint before funding it. Nobody had examined the eleven pilots together.
MMA APPROACH
We reviewed all eleven pilots against which function had funded them and what happened at the deployment decision, mapped tag cost against product value across the client's target categories, and interviewed retailer legal and operations functions on freshness indicator liability. Infrastructure revenue models were benchmarked against suppliers selling resolution services rather than carriers.
KEY FINDINGS
  1. Nine of eleven pilots had been funded by marketing budgets against consumer engagement cases, and every one of them failed at deployment on measured scan rates rather than on cost.
  2. More than half the client's target categories sat above the 2.1% tag-to-value threshold where item-level tagging has never worked anywhere, and had never been filtered out.
  3. Retailer legal functions rather than category buyers were blocking freshness indicators, and none had been approached or offered any indemnity or advisory framing at all.
  4. Suppliers selling resolution and hosting services alongside carriers were realising several times the lifetime revenue per stock keeping unit that the client captured from printing alone.
CLIENT PROFILE
An intelligent packaging technology supplier with approximately 160 million dollars in annual revenue (client-reported, unverified by MMA), selling communication tags, printed carriers, and freshness indicators into consumer goods and retail across Europe and North America. The company sold predominantly to brand marketing functions, priced carriers as components rather than services, and had run consumer engagement pilots with eleven brands over four years.
STRATEGIC CHALLENGE
Pilot-to-deployment conversion had run below one in five across four years, and freshness indicator sales had stalled entirely despite favourable accuracy testing. Management proposed increased marketing investment to build category awareness. The board wanted an independent assessment of whether awareness was genuinely the constraint before funding it. Nobody had examined the eleven pilots together.
MMA APPROACH
We reviewed all eleven pilots against which function had funded them and what happened at the deployment decision, mapped tag cost against product value across the client's target categories, and interviewed retailer legal and operations functions on freshness indicator liability. Infrastructure revenue models were benchmarked against suppliers selling resolution services rather than carriers.
KEY FINDINGS
  1. Nine of eleven pilots had been funded by marketing budgets against consumer engagement cases, and every one of them failed at deployment on measured scan rates rather than on cost.
  2. More than half the client's target categories sat above the 2.1% tag-to-value threshold where item-level tagging has never worked anywhere, and had never been filtered out.
  3. Retailer legal functions rather than category buyers were blocking freshness indicators, and none had been approached or offered any indemnity or advisory framing at all.
  4. Suppliers selling resolution and hosting services alongside carriers were realising several times the lifetime revenue per stock keeping unit that the client captured from printing alone.
RECOMMENDED STRATEGY
Phase 1: Phase 1 (months one to six): stop consumer engagement pilots, requalify the pipeline against the tag-to-value ratio, and redirect selling toward brand protection functions. Phase 2: Phase 2 (months six to twenty-one): build product passport resolution and hosting infrastructure to capture recurring revenue behind mandated carriers. Phase 3: Phase 3 (months twenty-one to thirty-six): relaunch the freshness indicators as back-of-house markdown tools with indemnity structures agreed in advance.
OUTCOME
The client ended its consumer engagement programme and redirected commercial effort toward brand protection and compliance buyers. Pilot conversion improved sharply within three quarters, and the first resolution service contracts were signed against product passport compliance (client-reported, unverified by MMA), with the indicator relaunch now in retailer trial.

Frequently Asked Questions

Foundational context covering the market sizes, CAGR, scope, country, region and competition that inform every finding below. This section is provided to cover basics and most often pre-purchase conversations, answered from the MMA Primary Research Dataset.

What is the current size of the Intelligent Packaging Market?

The market is valued at USD 3.9 billion in 2025, rising to USD 4.34 billion in 2026. Cold chain indicators reach 64% adoption while food freshness sensing sits at 3%.

How large will the Intelligent Packaging Market be by 2036?

MMA forecasts USD 12.54 billion by 2036, an increase of USD 8.20 billion over the 2026 base. That represents an expansion multiple of 2.89 times.

What is the CAGR for the Intelligent Packaging Market 2026 to 2036?

The base case CAGR is 11.2%, with a bull case of 12.4% and a bear case of 10.0%. The historical rate from 2020 to 2025 was 9.8%.

Which segment is growing fastest?

Printed data carriers and digital links at 16.8%, exactly 1.50 times the market rate. European product passport rules mandate a carrier that a printed code satisfies at essentially no cost.

Who are the major companies in the Intelligent Packaging Market?

Avery Dennison, Zebra Technologies, Sealed Air, CCL Industries, and Sato Holdings lead on annual component and system revenue. The top five together hold 37% of the market.

Which country is growing fastest?

China at 17.6%, driven by traceability requirements across food and pharmaceutical categories and by consumer code-scanning behaviour that is already routine there. Scan rates far exceed the global average.

Report Segmentation Architecture

The full report scope spans multiple orthogonal segmentation dimensions, with cross-tabulated demand data provided for each dimension pair. Coverage extends further to regional breakdowns, trend trajectories, and the competitive detail needed to support segment-level decision-making.

By Technology Type

  • Time-Temperature Indicators
  • Printed Data Carriers And Digital Links
  • Near Field Communication Tags
  • Item-Level Radio Frequency Identification
  • Freshness And Spoilage Indicators
  • Tamper And Authentication Indicators

By End-Use Industry

  • Pharmaceutical And Biologic Distribution
  • Food And Grocery Retail
  • Spirits, Wine And Premium Beverages
  • Cosmetics And Personal Care
  • Apparel And Consumer Electronics

By Buying Function

  • Regulatory And Compliance Budgets
  • Brand Protection And Anti-Counterfeiting
  • Supply Chain And Cold Chain Operations
  • Marketing And Consumer Engagement

By Region

  • Western Europe
  • East Asia
  • North America
  • South Asia and Pacific
  • Latin America
  • Middle East and Africa
  • Eastern Europe

Scope, Methodology, and Coverage

Every figure in this report is reproducible from documented input assumptions. The scope below maps the historical period, the forecast horizon, the segmentation dimensions, and the countries covered, alongside the underlying primary and qualitative methodology.
Historical Period
2020 to 2025
Forecast Period
2026 to 2036
Base Year
2025 (USD billions; MMA Primary Research Dataset, August 2026)
Market Definition
This market comprises packaging components and systems that sense product condition or carry machine-readable identity linked to data, measured at supplier realised prices across indicators, tags, labels, carriers, reader hardware, and associated resolution services. Technology coverage spans time-temperature indicators, printed data carriers and digital links, near field communication tags, item-level radio frequency identification, freshness and spoilage indicators, and tamper and authentication features. Active packaging that modifies product condition through scavenging or absorption, conventional retail barcodes used solely for checkout, warehouse automation systems, standalone data logger devices, and enterprise supply chain software platforms fall outside scope.
Quantitative Units
USD billions (current prices); billion units deployed annually; realised revenue per stock keeping unit
Segmentation Dimensions
By Technology Type; By End-Use Industry; By Buying Function; By Region
Regions Covered
Western Europe, East Asia, North America, South Asia and Pacific, Latin America, Middle East and Africa, Eastern Europe
Countries Covered
Germany, France, Italy, Spain, Netherlands, Sweden, Belgium, UK, Switzerland, Poland, Czechia, Turkey, China, Japan, South Korea, Taiwan, India, Australia, Singapore, USA, Canada, Mexico, Brazil, Argentina, Colombia, Saudi Arabia, UAE, South Africa, Egypt, and additional markets relevant to this sector
Key Companies Profiled
Avery Dennison, Zebra Technologies, Sealed Air, CCL Industries, Sato Holdings, Toppan, Dai Nippon Printing, Impinj, NXP Semiconductors, Identiv, Insignia Technologies, Timestrip, Vitsab International, Keep-it Technologies, Varcode, Sensitech, Controlant, Berlinger, Blue Bite, Schreiner Group
Quantitative Methodology
Primary survey, n=3,800 respondents, Q4 2025, six countries; demand-side model with trade association cross-validation
Qualitative Methodology
47 expert interviews, Q4 2025; applied to validate demand model assumptions, identify emerging dynamics, and assess competitive positioning
Report Format
PDF and XLSX data workbook (Word format preview document)
Publisher
Market Minds Advisory
Report Code
MMA-2026-PAC-343
Published
August 2026
Contact
sales@marketmindsadvisory.com | www.marketmindsadvisory.com

Purchase the full Intelligent Packaging Market Report (2026 to 2036).

The full report sizes intelligent packaging across six technology types, five end-use industries, four buying functions, and seven regions, with country detail for the twenty largest national markets. Sensing and identification technologies are sized separately throughout, since they share a category name and almost nothing else commercially. Adoption is analysed against the tag-to-value ratio and against which function holds the budget, which explains deployment far better than technology capability does. Competitive profiling covers twenty suppliers on component and system revenue. Product passport compliance timetables are tracked category by category across affected jurisdictions.
Sensing and identification technologies sized entirely separately
Adoption analysed against tag cost to product value ratio
Buying function mapped against deployment success by application
Product passport compliance timetables tracked by category
Cold chain indicator adoption benchmarked by product value band
Resolution service revenue models compared across supplier types

Built For The People Who Decide

From boardroom strategy to bench-side execution, this report is read cover-to-cover by leaders shaping the next decade of their industry, turning demand scenarios, market dynamics and valuation benchmarks into decisions.
CXOs/ Presidents/ VPs/ Managers
M&A and Corporate Development
Strategy Teams and R&D Heads
Procurement and Product Directors
Regulatory and Compliance Leaders
Investor Relations and Equity Analysts