Market Minds Advisory
Integrated Traffic System Market

Integrated Traffic System Market: Connected Corridors, Video Analytics and the Shift Toward Recurring Revenue

Connected vehicle roadside units are moving from pilot corridors into funded deployment, video analytics keeps replacing buried loop detectors, and suppliers are rebuilding around recurring software revenue rather than capital equipment sales.

Lead Analyst

David Horsley

Published

September 2026

Make Smarter Decisions with Customized Research Insights

Request a free sample report and evaluate market opportunities, growth trends, and competitive dynamics relevant to your business needs.

2025 MARKET VALUE$13.5BMarket Size 2025
2036 FORECAST VALUE$32.8BBase Case , 2026 to 2036
CAGR 2026 TO 20368.4 %Bull 9.6% / Bear 7.2%
INCREMENTAL OPPORTUNITY$18.1BNet 10- year value creation
EXPANSION MULTIPLE2.24x2036 value over 2026 base
Strategic Levers
M&A Pipeline
Regional Outlook
Country Rankings
Competitive Intelligence
Segmental Deep-dive
Call-Us : 91 93563 13602

Executive Snapshot and Market Trajectory

Traffic systems are bought by thousands of independent agencies with their own budgets, procurement rules and technical preferences, and that single fact explains more about this market than any technology trend does. Nobody sells to a national customer here, which is precisely why the category stays so persistently fragmented.
Connected vehicle roadside infrastructure grows at 12.6%, a full 1.50 times the market rate, because signal phase and timing broadcast, work zone warnings and emergency vehicle preemption all need equipment at the intersection rather than only in the vehicle. East Asia holds 34% of global value, above the standard regional band, because Chinese municipal command centre deployment has been by some distance the largest single programme of its kind anywhere.
Concentration is very low indeed at 24% for the top five, and it reflects genuine fragmentation rather than a measurement artefact. Detection hardware, signal control, enforcement and management software were historically separate businesses sold to separate buyers, and the integrators pulling them together are only now emerging as a distinct competitive tier. Nobody yet holds a position across the whole estate that an agency actually operates.
Market Definition
This report covers integrated traffic management systems for road networks, spanning traffic signal controllers and adaptive control, vehicle detection and sensing, automated enforcement and number plate recognition, variable message signs, connected vehicle roadside infrastructure, and the traffic management centre software integrating them. Electronic road tolling systems, parking management, public transport ticketing, in-vehicle equipment, road construction and civil works are excluded from the sizing.
Base Year Value
$13.5B in 2025 (MMA Primary Research Dataset, August 2026)
Forecast Period
2026 to 2036, eleven discrete annual values
CAGR
8.4% base case. Bull 9.6%. Bear 7.2%.
Fastest Growth Segment
Connected Vehicle Roadside Infrastructure: 12.6% CAGR
Fastest Growth Country
India: 11.4% CAGR
Fastest Growth Region
South Asia and Pacific: 10.6% CAGR
Largest Region
East Asia: 34% of 2025 global value
Market Leaders
Hikvision, Siemens Mobility, Kapsch TrafficCom, Cubic Transportation Systems and Dahua Technology lead on installed system deployment. Source: MMA Analysis, July 2026.
Primary Survey
n=3,800 procurement and R&D decision-makers, Q4 2025, six countries
Methodology
Demand-side build-up, cross-validated against public data, 47 expert interviews

Integrated Traffic System Market Forecast Scenarios

integrated-traffic-system-market-trends-size-forecast-scenario-1787317021412
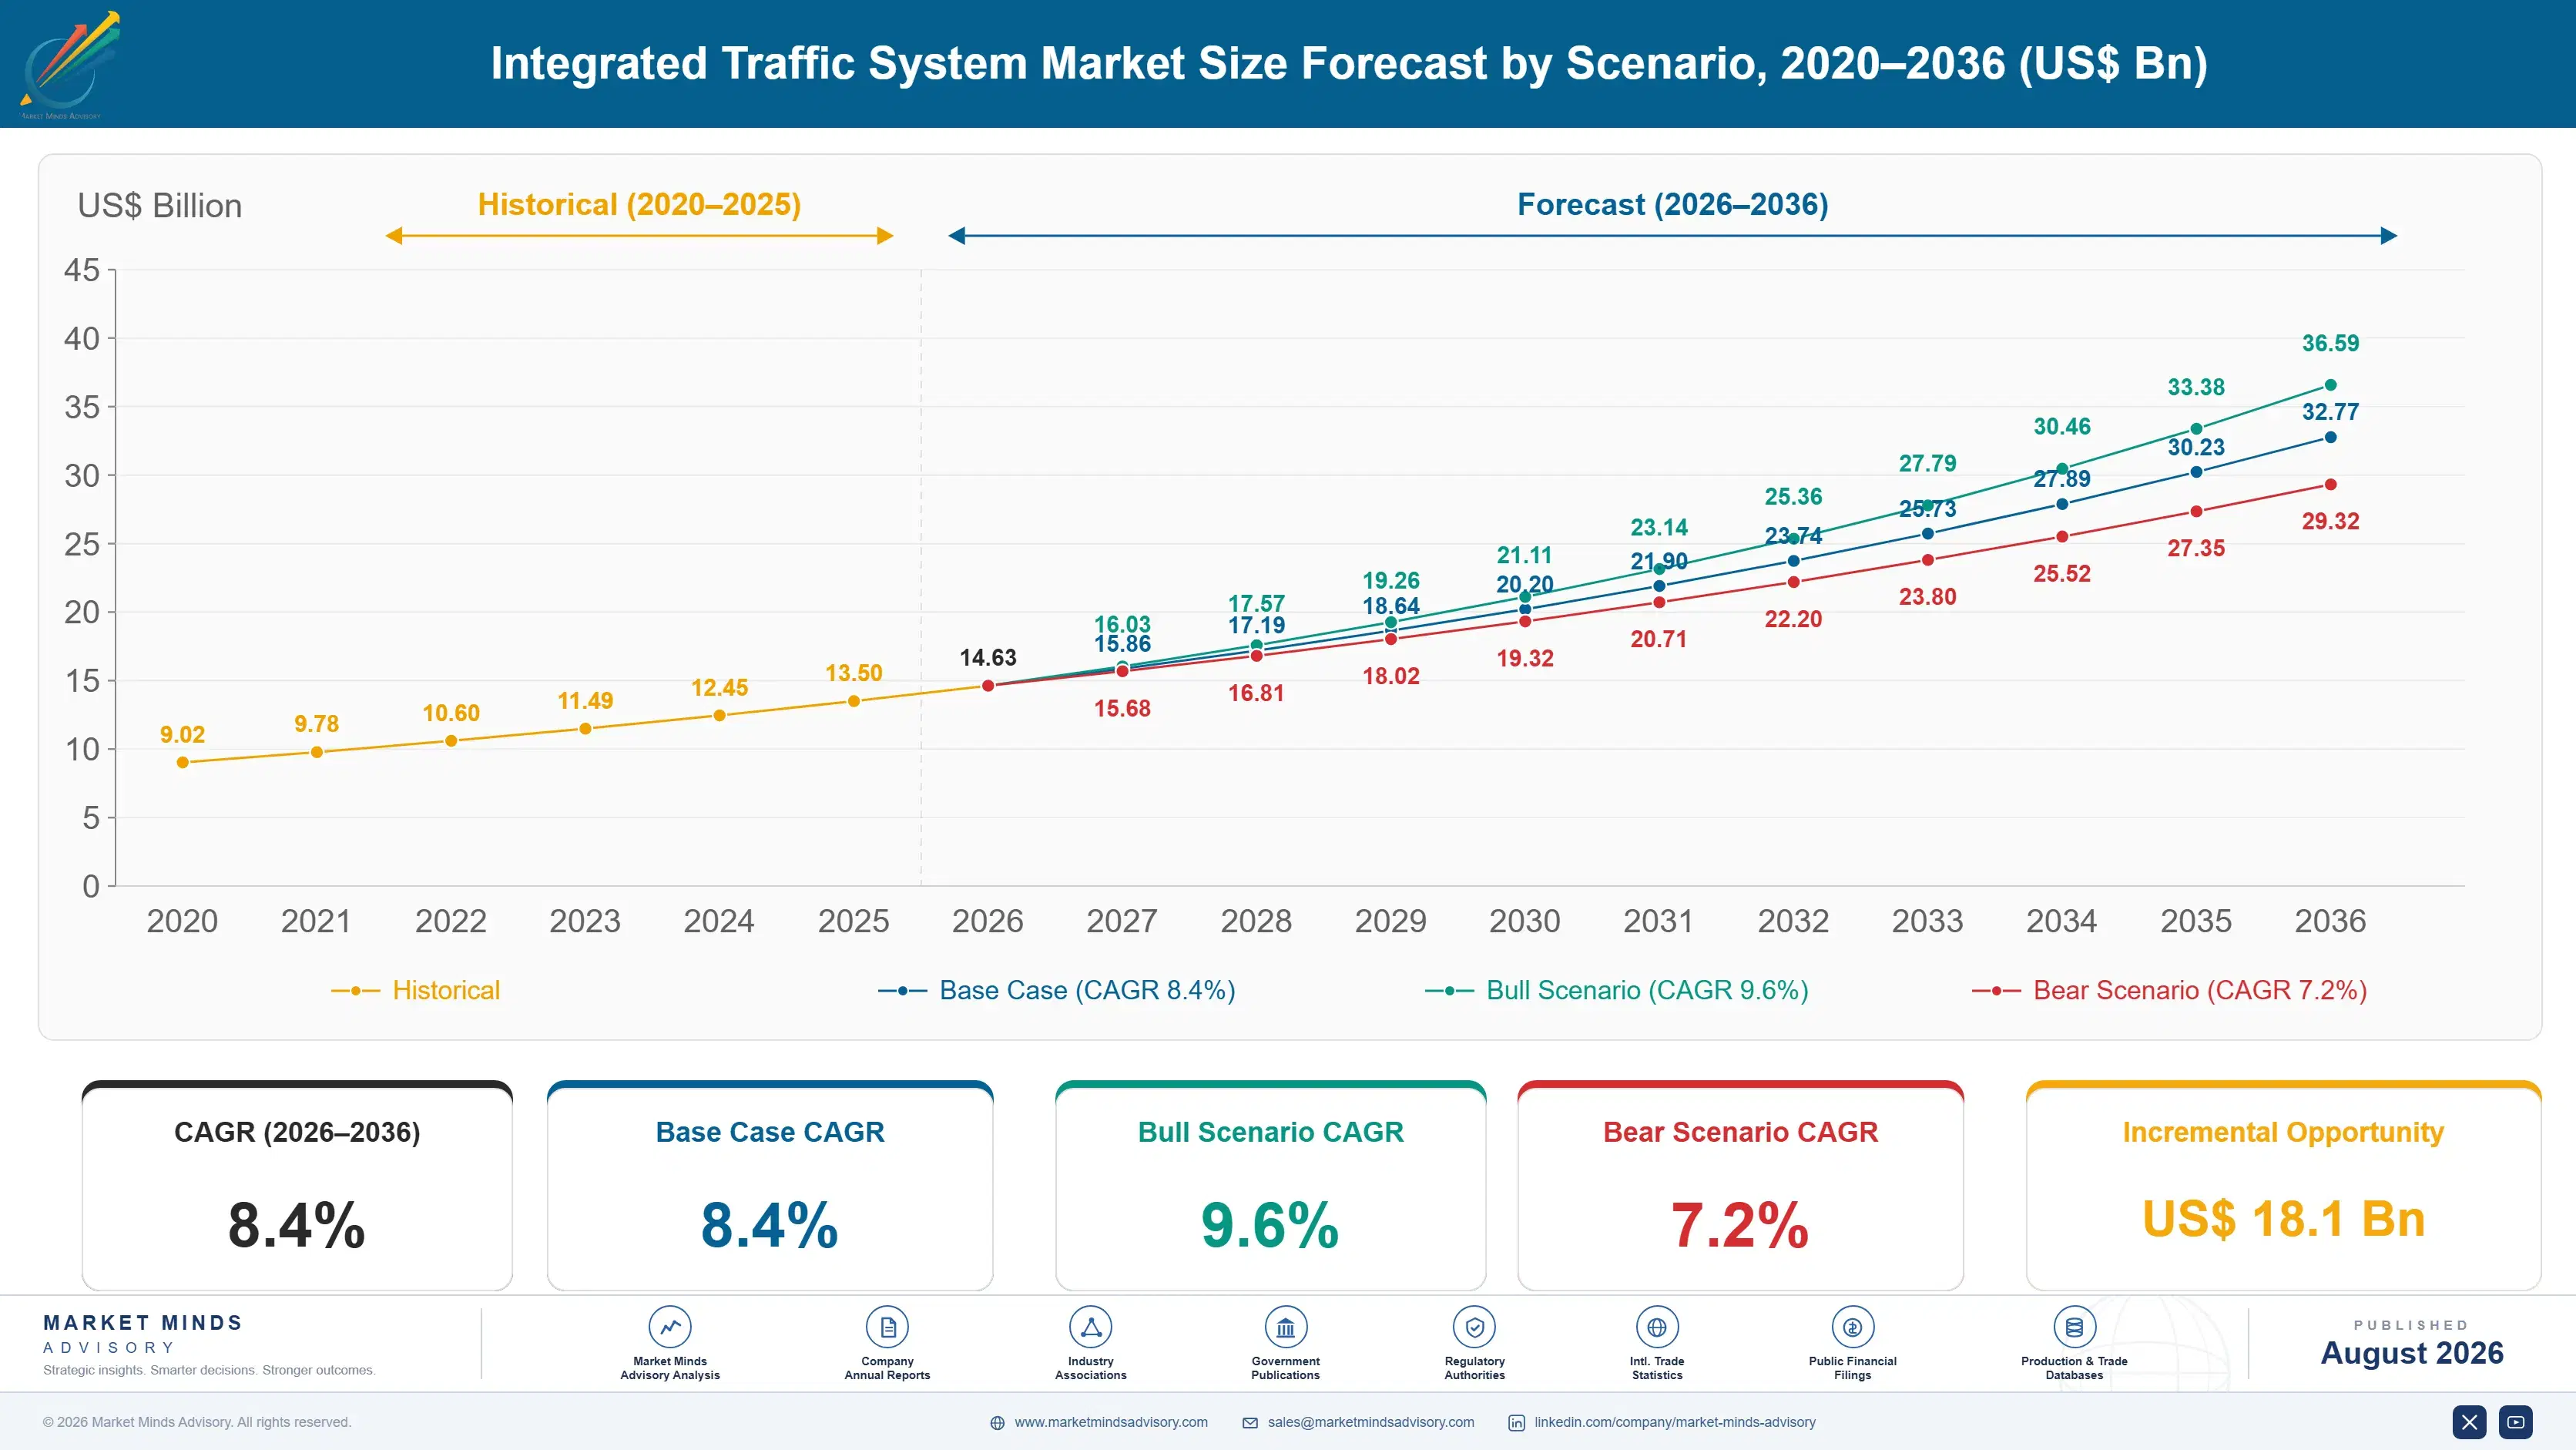
Between 2020 and 2025 the market compounded at 7.0%, and the composition changed more than the total did. Chinese command centre deployment slowed from its extraordinary pace as tier one cities completed coverage. Western spending accelerated in the opposite direction as infrastructure funding programmes reached procurement, and the technology mix shifted decisively from buried loop detectors toward video and radar sensing across every market.
The base case at 8.4% rests on three mechanisms. Infrastructure funding across North America, Europe and India is committed on multi-year schedules that agencies are drawing down steadily, constrained by procurement capacity rather than by budget availability. Connected vehicle roadside deployment moves from pilot corridors into funded programmes as standards settle. Software and managed service revenue keeps rising as a share of the total, which lifts realised value per deployment ahead of equipment volume.
The bull case at 9.6% turns on connected corridor deployment accelerating once vehicle penetration reaches the level where roadside investment demonstrably pays back, which several agencies now expect before 2030. The bear case at 7.2% is municipal procurement capacity failing to keep pace with available funding, which has already delayed committed programmes and would leave the money appropriated but genuinely unspent.

What Actually Governs Traffic System Value

The commercial character of this market is set by who buys. A signalised intersection belongs to a city, a county or a state transport agency, each with its own budget cycle, procurement rules, engineering standards and political calendar. There are thousands of them and none of them buys the same way.
TOP FIVE CONCENTRATION24%Share held by the five largest global traffic system suppliers
INTERSECTION DEPLOYMENT COST$68,000Typical cost to instrument and connect one signalised intersection
SOFTWARE REVENUE SHARE29%Portion of supplier revenue from software and recurring services
GLOBAL INTERSECTION BASE3.6 millionSignalised junctions operating across major urban road networks
PROCUREMENT CYCLE26 monthsTypical time from tender publication through to contract award
REPLACEMENT INTERVAL12 yearsTypical service life before a control system is fully replaced
That fragmentation has two consequences. Selling costs are high relative to contract value, because every deployment requires its own tender response, integration work and stakeholder management, and procurement runs around 26 months from publication to award. It also makes incumbency unusually durable: an agency that has trained staff on one supplier's control software, built its operating procedures around it and holds twelve years of configuration history does not switch casually, and replacement cycles at that length mean the decision comes round rarely.
Where the economics are improving is software. Historically this was a capital equipment business selling controllers and detectors against competitive tenders. Recurring revenue from analytics platforms, managed detection services and hosted management centres now supplies roughly 29% of supplier revenue at margins the hardware never approached, and agencies increasingly prefer that model because it moves cost from constrained capital budgets into operating ones.
"Everybody in this industry talks about connected vehicles and almost nobody talks about the fact that a city transport department has three engineers and a procurement backlog. The binding constraint on this market is not technology maturity, it is how many tenders an understaffed agency can actually run in a year."
Practice Director, Transport Infrastructure and Mobility Systems, Market Minds Advisory &middo

Market Trends

Connected Corridors Move From Pilots Into Funded Deployment

Roadside units broadcasting signal phase and timing, work zone warnings and emergency vehicle preemption have moved past demonstration corridors into programmes with committed budget behind them. Standards settling on cellular vehicle to everything after years of competing approaches removed the main objection agencies had, since nobody wanted to buy equipment that a standards decision would strand. Deployment costs run roughly $14,000 per intersection above conventional instrumentation. The remaining constraint is vehicle penetration, because roadside investment only pays back once enough equipped vehicles actually pass through the junction to register a measurable benefit.
Market Impact: Commits 8 years of funding
Video Analytics Displaces Buried Inductive Loop Detection

Inductive loops cut into road surfaces have detected vehicles for sixty years and fail predictably whenever the pavement is resurfaced, which makes their whole life cost considerably worse than the installed price suggests. Camera and radar sensing with onboard classification now delivers count, speed, classification and turning movement data from equipment mounted above the road, where maintenance requires no lane closure or traffic management at all. It also produces data loops never could, including pedestrian and cyclist movement that safety programmes now increasingly require agencies to measure and report on formally.
Market Impact: Targets 50% casualty reduction

Market Opportunities and Growth Drivers

Committed Infrastructure Funding Reaches Municipal Procurement

National infrastructure programmes across North America, the European Union and India have committed multi-year spending on road safety, congestion relief and connected corridors, and that money is now finally reaching agency procurement rather than sitting unspent in appropriation. The commitment horizon matters commercially: agencies planning against several years of funding buy systems rather than replacing equipment piecemeal, which favours suppliers offering integrated platforms over single-component vendors bidding piecemeal. Drawdown rates remain the genuine uncertainty, since procurement capacity at municipal level constrains actual spending considerably more than budget availability ever does.
Market Impact: Delays awards by 26 months

Road Safety Targets Convert Detection Into Policy Obligation

Vision Zero commitments and equivalent national road safety strategies now impose measurable casualty reduction targets on transport agencies, and meeting them requires detection, enforcement and signal priority investment that becomes a policy obligation rather than discretionary spending. That distinction matters commercially, because obligated spending survives budget pressure in a way that optional technology investment simply does not. Requirements now increasingly include pedestrian and cyclist detection as well, which inductive loops cannot provide at all, and which therefore forces sensing upgrades entirely independently of any congestion argument an agency might otherwise make.
Market Impact: Adds 18% integration cost

Market Restraints and Challenges

Fragmented Municipal Procurement Constrains Deployment Pace

Thousands of independent agencies each run their own tender, and the process takes around 26 months from publication to award with engineering staff who are usually managing several programmes at once. The root cause is administrative capacity rather than any funding shortfall. Commercially this caps how quickly committed money converts into deployed systems and makes selling cost high relative to contract value. Participants are responding by pursuing cooperative purchasing agreements that let one tender serve many agencies, by standardising deployment packages, and by supporting agencies through the procurement documentation itself.
Market Impact: Adds $14,000 per intersection

Interoperability Gaps Create Costly Proprietary Lock-In

Agencies operating equipment from several suppliers frequently find that detection, control and management systems do not exchange data without custom integration work paid for repeatedly. The root cause is that open standards exist but implementation varies enough that conformance claims do not guarantee interoperability in practice. Commercially this raises total cost of ownership considerably and makes agencies cautious about adding any new supplier. Participants are responding by supporting open interface standards more genuinely, by publishing application programming interfaces, and by competing on integration breadth rather than on individual component performance.
Market Impact: Removes 90% of lane closures
3 additional market trends, 4 additional growth drivers, and 2 additional restraints and challenges are covered in the full report. Contact sales@marketmindsadvisory.com to access the complete intelligence.

Segment CAGR and Growth Architecture

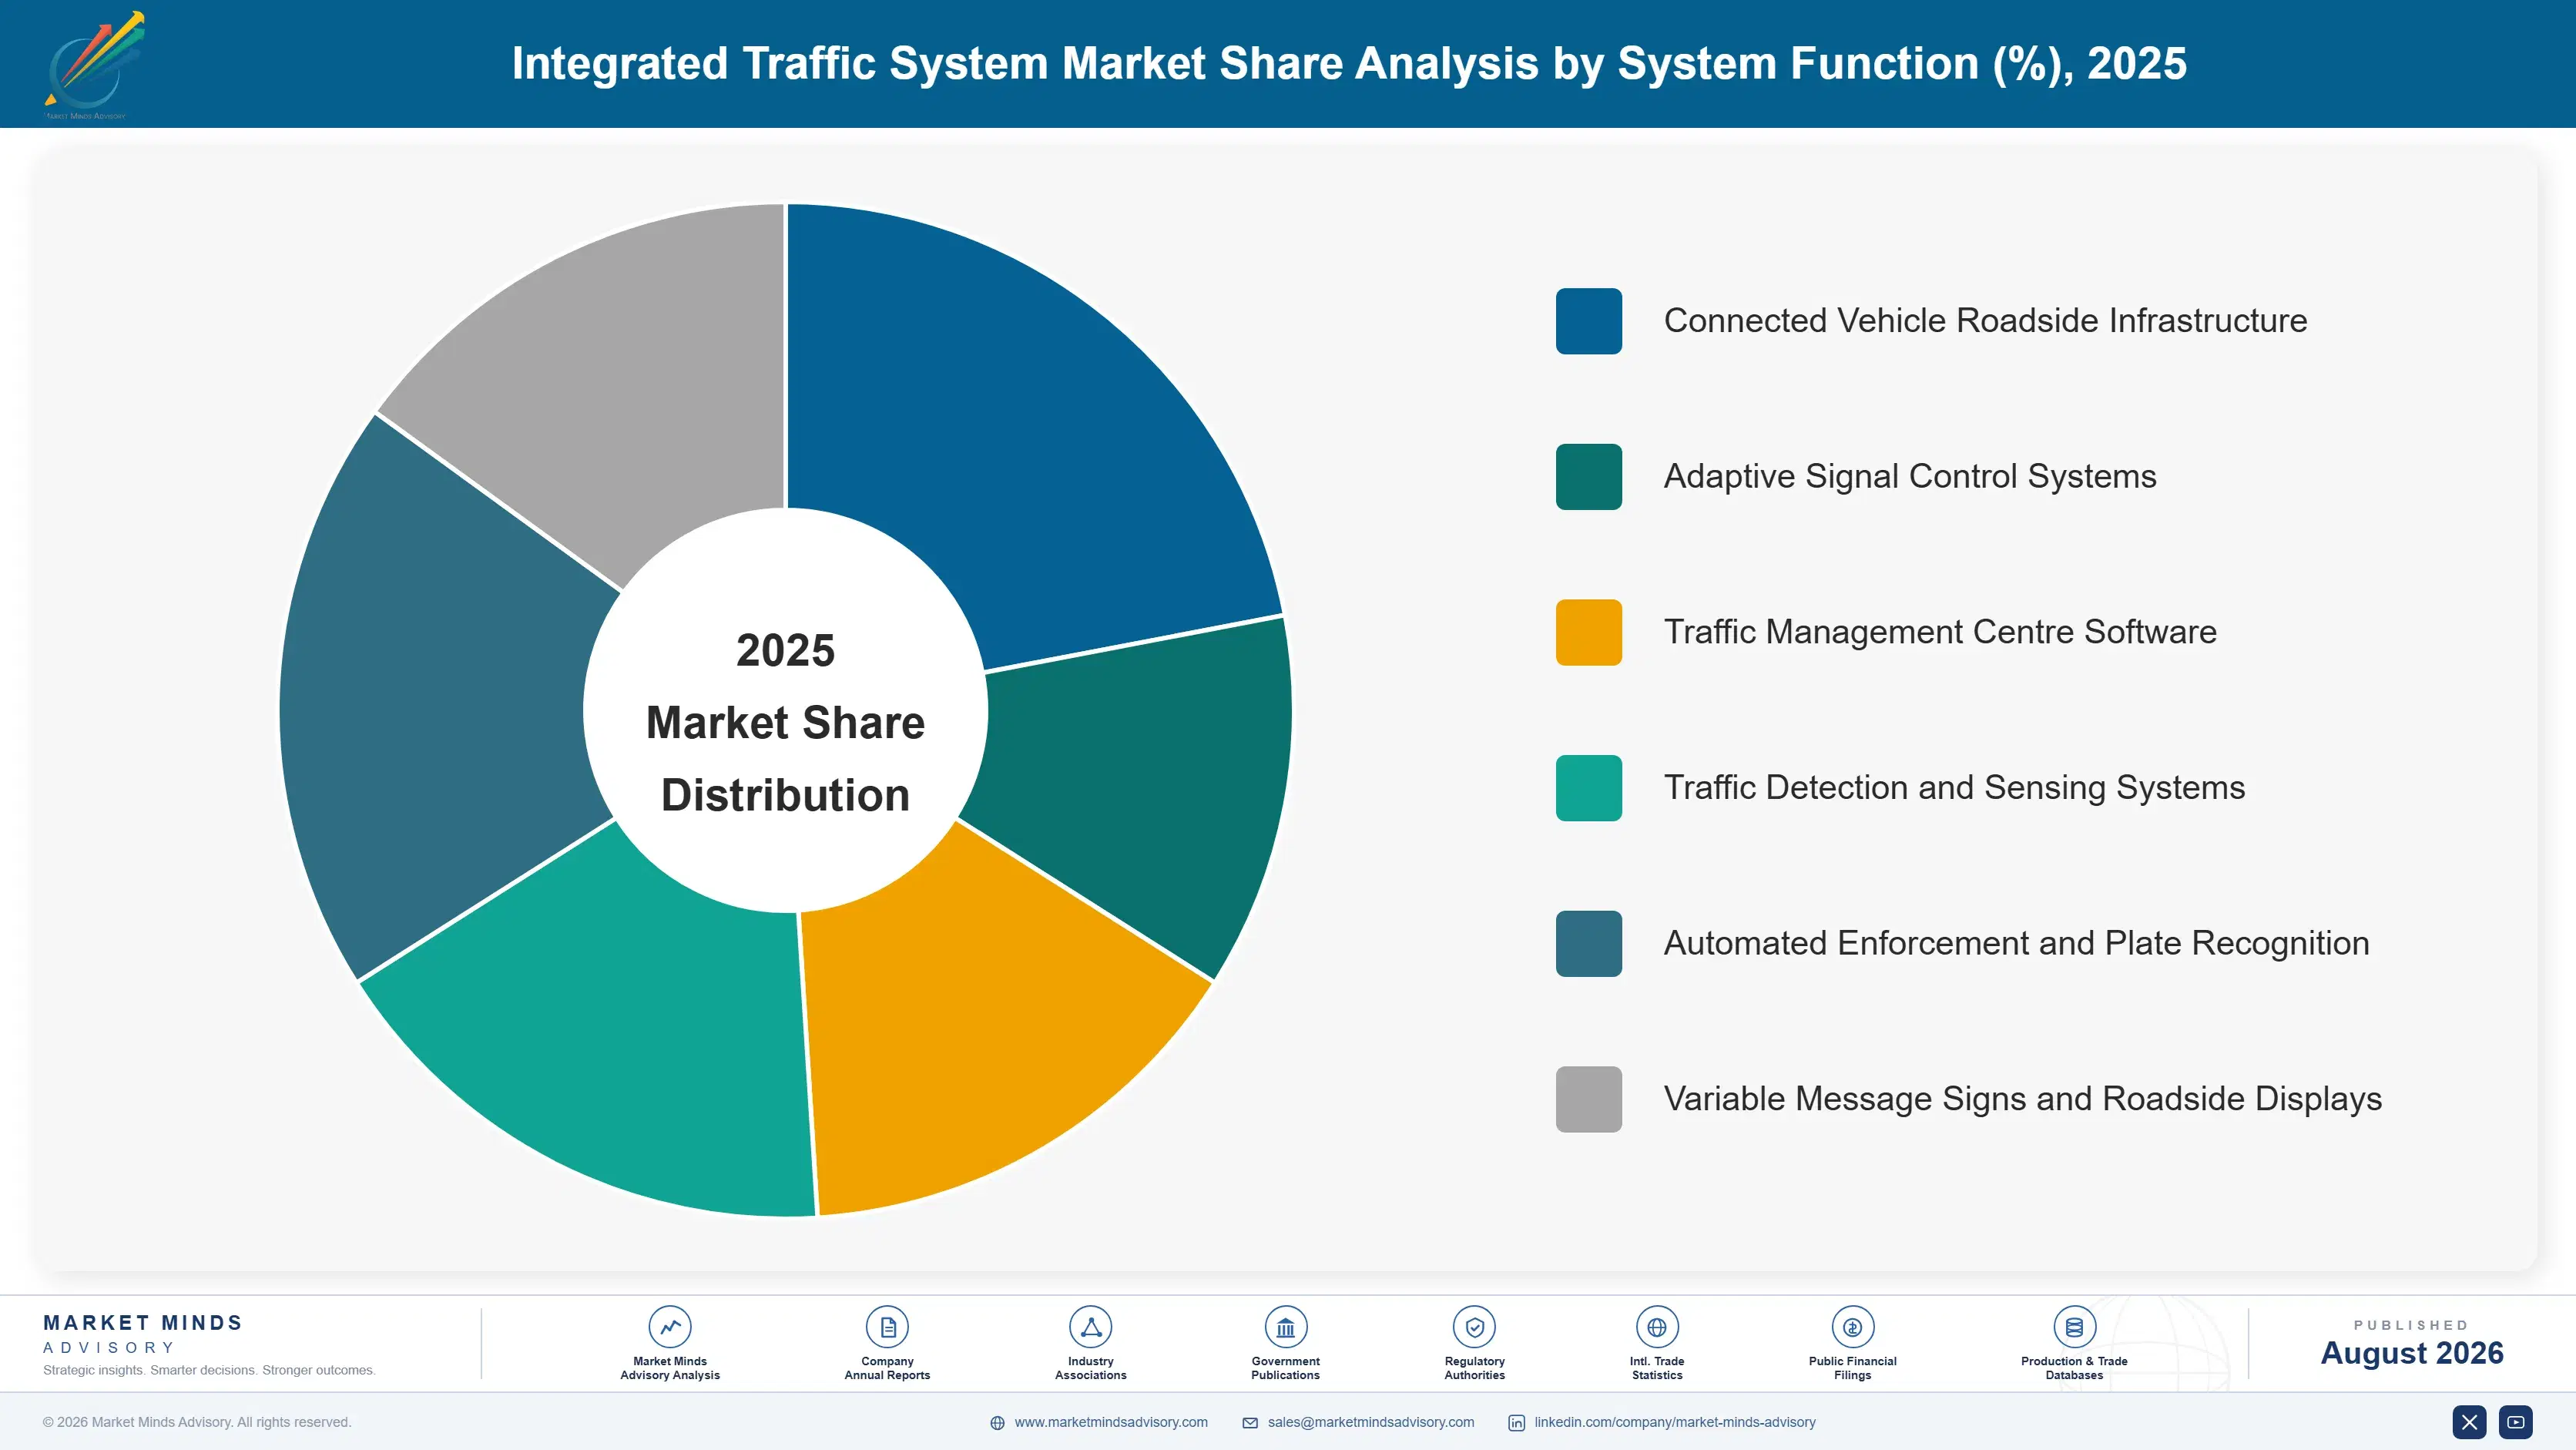
Segmentation follows system function, because what a subsystem actually does determines which agency budget funds it, which procurement route applies, the software content it carries and the realised value per deployment. Vendor architecture, communication protocol, hardware specification and service model all sit downstream of that functional decision, and every one of them is priced against it.
integrated-traffic-system-market-trends-market-share-analysis-1787317022467

Connected Vehicle Roadside Infrastructure

The fastest segment at 12.6%, a full 1.50 times the market rate, covering roadside units and supporting back office infrastructure that broadcast signal phase and timing, work zone warnings, emergency vehicle preemption and hazard alerts to equipped vehicles. Standards settling is what opened the segment commercially. Years of competing approaches left agencies unwilling to buy equipment a standards decision might strand, and convergence on cellular vehicle to everything removed that objection almost overnight. Deployment adds roughly $14,000 per intersection above conventional instrumentation. What still limits the pace is vehicle penetration, since roadside investment only repays once enough equipped vehicles actually pass through the junction to generate measurable safety or flow benefit.
CAGR 12.6%

Adaptive Signal Control Systems

Growing at 10.2% on control systems that adjust signal timing continuously against measured demand rather than running fixed plans by time of day. The argument agencies actually respond to is delay reduction without any construction, since adding capacity through better timing costs a fraction of widening a road and requires no land acquisition or political fight. Modern systems draw on video and radar detection rather than buried loops, which improves the data quality the algorithms depend on considerably. What limits adoption is that adaptive control demands well-maintained detection at every approach, and agencies with degraded sensing infrastructure must fix that first, which is exactly the investment their budgets have historically deferred.
CAGR 10.2%
Full segment breakdown across 6 segments available in the complete report.

Regional Architecture and Country Demand Map

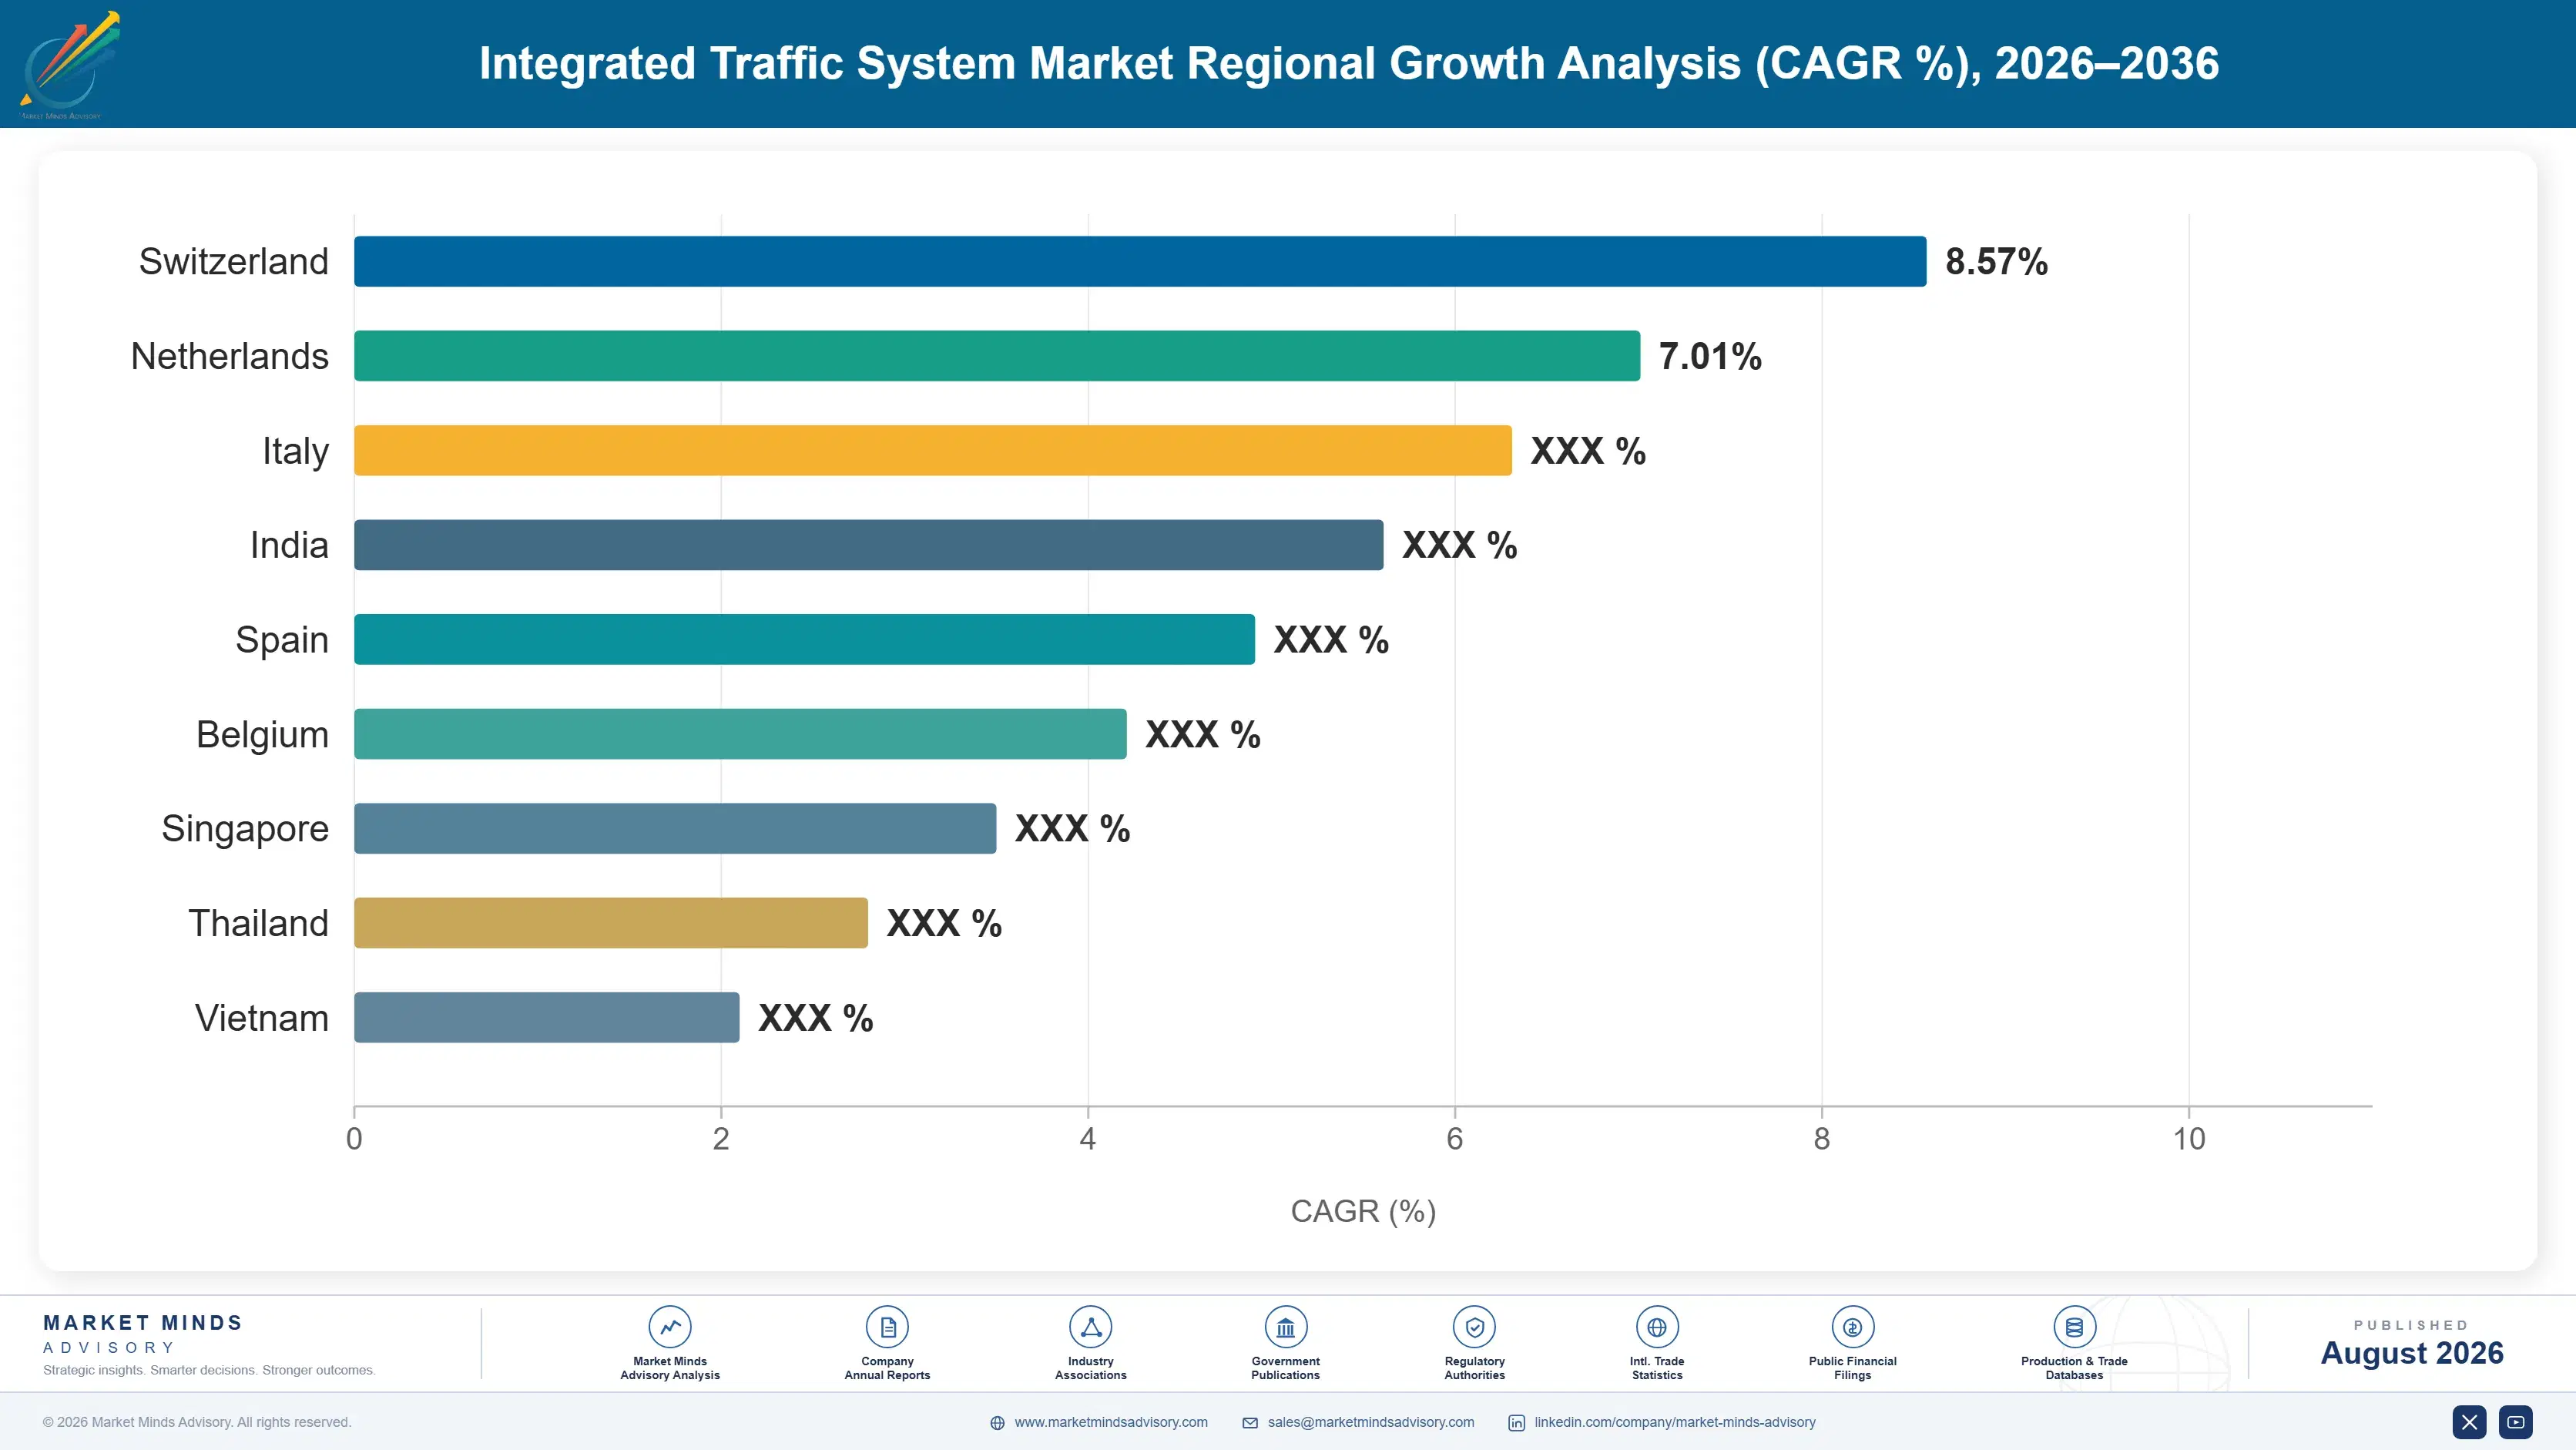
East Asia holds 34% of global value on Chinese municipal command centre deployment at a scale no Western procurement process could match. North America follows on committed infrastructure funding, while growth runs fastest across South Asia and Pacific on national programme funding rather than municipal initiative.

East Asia

Note: East Asia holds 34% against a 22 to 30% band because Chinese municipal traffic command centre deployment has been the largest single infrastructure programme of its kind anywhere. Hikvision, Dahua and Huawei between them equipped tier one and tier two cities with integrated detection, signal control and enforcement at a pace no Western procurement process could match. Japanese deployment is mature and replacement-driven, with Sumitomo and Kyosan serving a network already fully instrumented decades ago. South Korean cities have pushed connected vehicle corridors further into production than most Western equivalents. Export activity across Southeast Asia, Africa and Latin America now runs substantial from all three markets. Replacement rather than new build now carries China.
Share: 34% | CAGR: 9.6% (2026 to 2036)

North America

Federal infrastructure funding shapes this region more than any technology cycle. Programme money for road safety, congestion relief and connected corridors has committed multi-year spending that states and municipalities are drawing down slowly, constrained by procurement capacity rather than by budget. Deployment is fragmented across thousands of independent agencies, which makes this the hardest market in the world to sell into and the most durable once a supplier is established. Federal restrictions on Chinese video hardware reshaped the detection supply base entirely after 2019, creating openings that domestic and European suppliers moved to fill and still hold. Procurement capacity rather than budget is what actually limits how fast this region deploys anything at all.
Share: 24% | CAGR: 7.9% (2026 to 2036)
Regional intelligence for 5 additional markets available in the complete report: Western Europe, South Asia and Pacific, Latin America, Middle East and Africa, Eastern Europe. Contact sales@marketmindsadvisory.com.
integrated-traffic-system-market-trends-country-cagr-analysis-1787317023323

Where Traffic System Margin Is Won

Four positions separate suppliers building durable businesses from those winning individual tenders at cost: converting capital equipment sales into recurring software revenue, securing cooperative purchasing agreements that serve many agencies from one tender, owning the management platform rather than the roadside hardware, and actively supporting agencies through the procurement work they simply lack the staff capacity to run themselves.

Convert Equipment Sales Into Recurring Software Revenue

Software and managed services already supply 29% of supplier revenue at gross margins running 20 to 28 points above hardware, and agencies increasingly prefer that model because it moves cost from constrained capital budgets into operating ones they control more easily. Suppliers structuring analytics, hosted management and managed detection as subscriptions rather than perpetual licences hold the customer through the full twelve year replacement interval instead of only at the point of sale. The revenue also survives entire budget years when no capital spending happens at that agency at all.
Market Impact: Adds 28 margin points across all so

Secure Cooperative Purchasing Agreements Serving Many Agencies

Procurement runs around 26 months per tender and thousands of separate agencies each run their own, which makes selling cost brutal relative to any individual contract value. Cooperative purchasing vehicles let a single competitive award serve dozens or hundreds of agencies afterwards without any further tendering, which cuts effective sales cost by 40% to 55% per deployment. Winning the underlying award is genuinely competitive and demands considerable effort, but the commercial position it then creates compounds for years afterwards, while competitors keep bidding intersection by intersection against it. Incumbency compounds quietly here.
Market Impact: Cuts selling cost 55% on every agen

Own The Management Platform Not The Roadside Hardware

Detection cameras and signal controllers are increasingly commodity purchases with several credible suppliers available, while the management platform that an agency trains its staff on and builds twelve years of configuration inside is genuinely difficult to displace at all. Suppliers holding the platform capture 25% to 35% more lifetime revenue per agency, because hardware refreshes then flow through them regardless of who actually manufactured the device. It also positions them to integrate competitors' equipment behind their own software, rather than finding themselves integrated by somebody else's platform instead. That distinction decides everything.
Market Impact: Captures 35% more lifetime revenue

Support Agencies Through Procurement They Cannot Staff

Transport agencies typically run several programmes simultaneously with a handful of engineers, and the binding constraint on deployment is administrative capacity rather than any shortage of funding. Suppliers providing specification support, funding application assistance and deployment planning shorten award timelines by 20% to 30%, and they shape the resulting requirements toward capability that they already hold. It costs engineering and bid team time rather than any capital, and it converts a passive tender response into an active commercial position established well before the tender documents are ever published. Timing is the whole advantage.
Market Impact: Shortens tender award timelines by

Who Controls the Margin Pool

Concentration sits at 24% for the top five measured on installed system deployment, the basis used throughout this section, and it is genuinely low rather than a measurement artefact. Hikvision and Dahua lead on installed volume through Chinese municipal deployment, while Siemens Mobility, Kapsch TrafficCom and Cubic hold the strongest Western integration positions. The gap to the next tier barely exists, because detection, control and management software were historically separate businesses.
Competitive activity runs on three fronts. Management platform ownership is the first and the most consequential, since it determines who integrates whom across a twelve year replacement interval. Recurring software revenue is the second, and suppliers are restructuring commercial models around it aggressively. The third is connected vehicle roadside capability, where standards have settled and agencies are beginning to place funded orders rather than pilot ones.

Pressure arrives from two directions. Federal restrictions on Chinese video hardware reshaped the North American detection supply base entirely and created openings that domestic and European suppliers still hold. Separately, analytics specialists are entering from software rather than infrastructure heritage. Rankings will shift on who owns the management platform when the current replacement cycle comes round.
integrated-traffic-system-market-trends-company-positioning-matrix-1787317024341

Competitive Moat and Risk Dimensions

SIEMENS MOBILITY

Moat: Platform depth and agency incumbency

Decades of installed signal control across European and North American agencies create switching friction that no product comparison overcomes on its own, because staff training, operating procedures and years of configuration history all sit inside the platform. Integration breadth across detection, control, enforcement and management also lets the business absorb competitors' hardware rather than being absorbed itself.
SIEMENS MOBILITY

Risk: Slow procurement revenue conversion

Revenue depends on agency procurement cycles running around 26 months, which makes growth difficult to accelerate even when funding is plainly available. Smaller specialists competing on single subsystems can move faster on individual opportunities, and the cost of maintaining full integration capability across every function is carried whether or not agencies are actually buying.
HIKVISION

Moat: Detection hardware cost position

Manufacturing scale across security and traffic video gives a delivered cost position on detection hardware that no Western supplier approaches, and the Chinese municipal deployment base provides reference installations at a scale nobody else can point to. Analytics capability developed against that volume of real traffic imagery is genuinely difficult to replicate quickly.
HIKVISION

Risk: Regulatory exclusion from Western markets

Federal procurement restrictions have removed access to North American agency business entirely and European scrutiny has tightened alongside, which caps addressable market regardless of cost or capability. Growth therefore depends on Asian, African and Latin American demand, where competition on price is fiercest and contract values are considerably lower.

Players Tracked

Prominent Players

Hikvision
Siemens Mobility
Kapsch TrafficCom
Cubic Transportation Systems
Dahua Technology

Other Key Players

SWARCO
Q-Free
Yunex Traffic
Iteris
Econolite
TransCore
Indra Sistemas
Thales
Huawei Technologies
Teledyne FLIR
Jenoptik
Sensys Gatso Group
Rekor Systems
Miovision
Efkon

Recent Developments

FEBRUARY 2025

Connected corridor deployment awarded across multi-city programme

A regional transport authority awarded full roadside unit deployment across a multi-city connected corridor programme during the year, which moves well beyond the pilot installations of previous years into permanently funded infrastructure broadcasting signal timing, work zone warnings and hazard alerts to equipped vehicles continuously.
Signal: Standards settling on a single communicati
JULY 2025

Cooperative purchasing award opens access across hundreds of agencies

A supplier won a cooperative purchasing agreement allowing several hundred municipal agencies to procure detection and control systems directly without running their own individual tenders, which converts a single competitive award into a durable commercial position that competitors must now bid against agency by agency.
Signal: Cooperative purchasing vehicles are now qu
NOVEMBER 2025

Managed detection service replaces capital equipment procurement

A large metropolitan agency contracted its detection estate as a managed service rather than purchasing cameras and radar outright, moving the cost from a constrained capital budget into an operating one and transferring maintenance, replacement and technology refresh obligations onto the supplier entirely for the contract term.
Signal: Agencies are restructuring detection procu

What Drives Traffic System Cost

This is a systems business, so cost structure looks unlike a manufactured product. Detection hardware, controllers and roadside equipment together account for roughly 38% of delivered project cost, with semiconductors and image sensors the dominant content inside them. Software development and integration engineering add around 26%. Installation, cabling, cabinet work and civil trenching contribute a further 22%, and project management plus commissioning roughly 9% across a typical deployment.
The 2021 semiconductor shortage delayed traffic controller and camera deliveries by many months and pushed several agency programmes past their funding deadlines entirely, which was a costly lesson in single-sourced components inside long-cycle public procurement. Federal restrictions on Chinese video hardware reshaped North American detection sourcing from 2019 onward. Siemens Annual Report 2025 identifies component availability and project cost inflation as continuing factors across its mobility business.

The disadvantage mechanism is fixed-price contract exposure rather than component cost. Agency contracts are typically fixed price across multi-year deployments, so a supplier that bid before an input move absorbs the whole swing with no adjustment mechanism at all. Exposure varies by scope too: suppliers carrying civil installation hold construction labour risk that equipment-only vendors avoid entirely.
integrated-traffic-system-market-trends-cost-volatility-analysis-1787317024671

Qualify detection hardware from multiple approved vendors

Detection cameras and radar units from two or three qualified vendors, integrated behind the same management platform, remove the single-source exposure that both semiconductor shortage and procurement restriction created. The cost is duplicated integration and validation work at platform level. Against a programme that missed its funding deadline waiting on one vendor, that cost recovers immediately.

Separate civil works scope from system supply contracts

Trenching, cabinet installation and cabling carry construction labour risk that has moved faster than equipment pricing and that system suppliers are poorly placed to manage. Contracting those elements separately, or through a specialist partner carrying the exposure, protects margin on the technology scope. Some agencies prefer single-point responsibility, which makes this a negotiation rather than a unilateral decision.

Index multi-year deployment contracts to published benchmarks

Deployment programmes running three or four years at fixed price carry real exposure to component and labour movement that nobody can forecast at bid. Indexing to published semiconductor and construction labour benchmarks moves that volatility onto a verifiable formula. Public procurement rules complicate it, but several agencies now accept indexation on longer programmes precisely because fixed pricing produced supplier failures.

Portfolio Architecture for Margin Defence

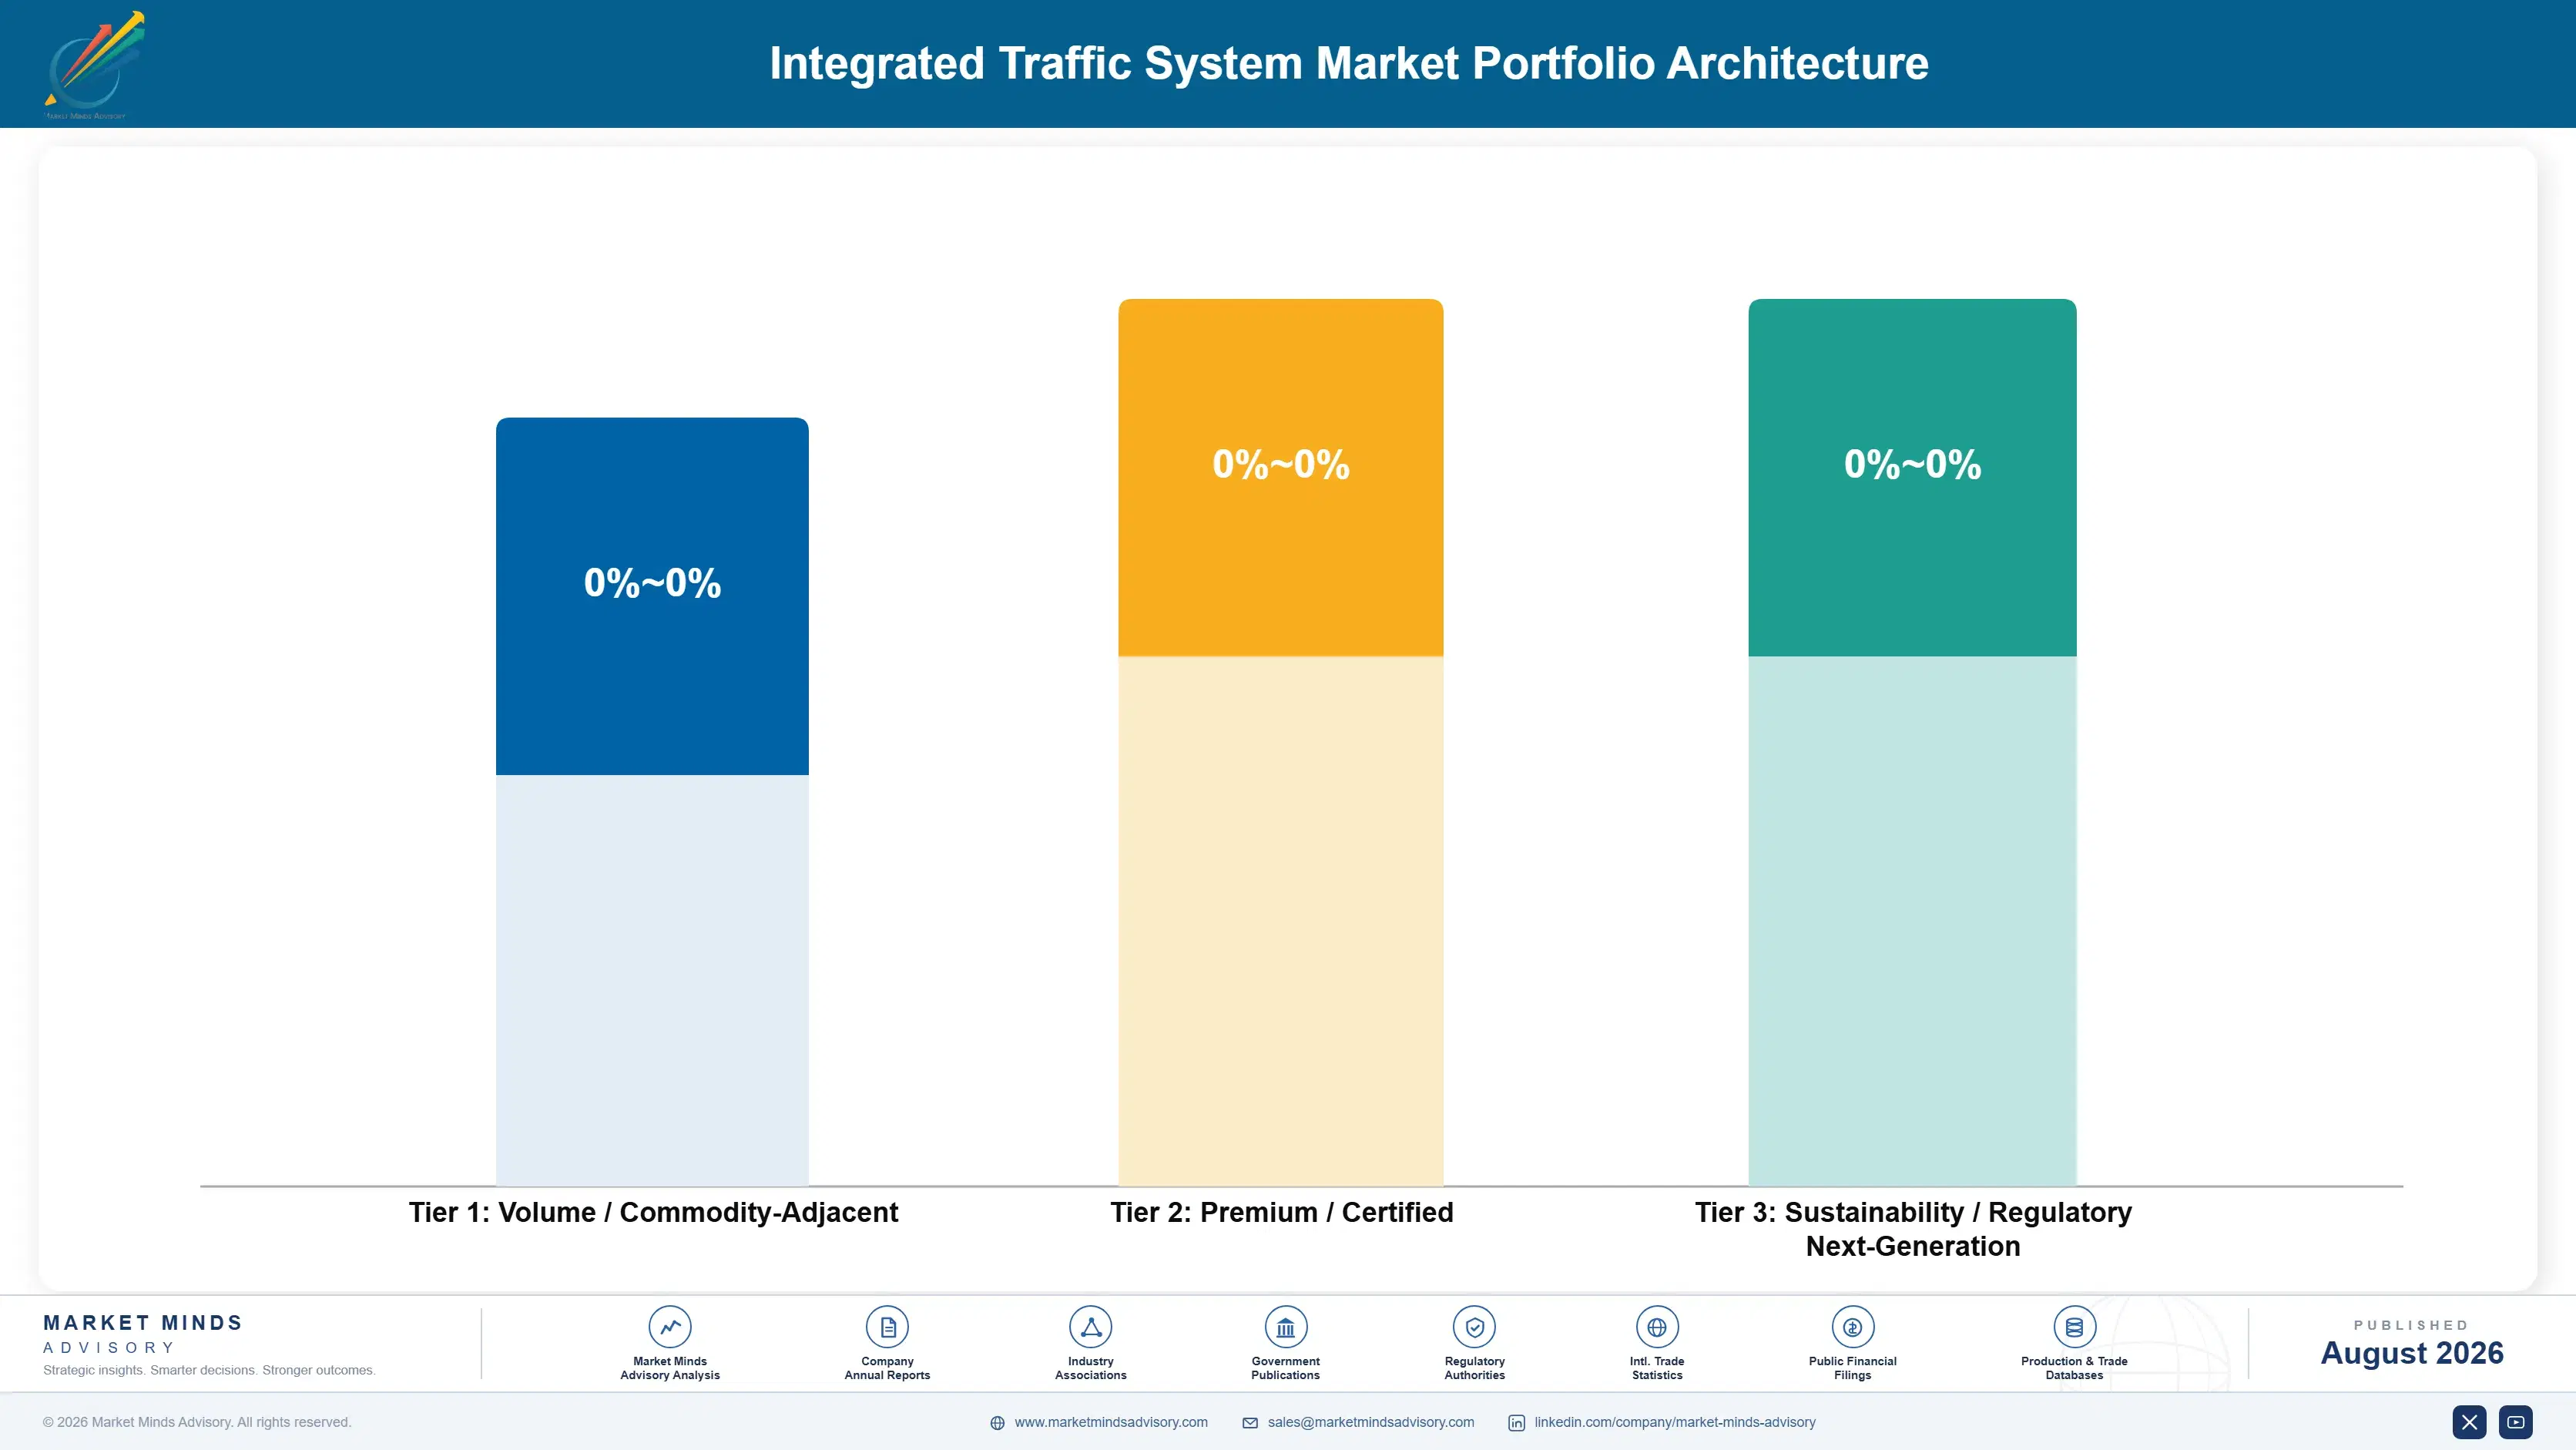
Portfolio economics here divide on recurring content rather than on subsystem. Competitively tendered hardware supply, meaning detection cameras, controllers or roadside cabinets quoted into an agency tender against several credible alternatives, earns gross margins in the mid teens because specification is written to be comparable and price is the deciding variable once compliance is established. Volume secures the agency relationship rather than the margin.
The premium tier is integration and management platform work. Supplying the software an agency trains its staff on, builds operating procedures around and populates with twelve years of configuration is far harder to displace than any device, and it positions the supplier to integrate competitors' hardware rather than the reverse. Margins run in the low to mid thirties.

Above both sits recurring software and managed services. Analytics subscriptions, hosted management centres and managed detection contracts carry margins in the low forties, arrive whether or not the agency has capital budget in a given year, and hold the customer through the whole replacement interval rather than only at the point of sale. Agencies increasingly prefer the model because it fits budgets they can actually expand.

Volume / Commodity-Adjacent

Competitively tendered detection hardware, controllers and roadside cabinets. Specification is written for comparability, several suppliers meet it, and price decides the award once basic technical compliance has been established by everyone bidding.
Gross Margin: 14 to 20%

Premium / Certified

Integration engineering and traffic management platform supply. The range reflects how much of the agency workflow a platform genuinely owns, which varies considerably between full command centres and single-function tools.
Gross Margin: 29 to 36%

Sustainability / Regulatory / Next-Generation

Analytics subscriptions, hosted management centres and fully managed detection service contracts. The wide range spans basic data feeds through to fully outsourced detection estates carrying refresh, maintenance and availability obligations.
Gross Margin: 38 to 46%
integrated-traffic-system-market-trends-portfolio-architecture-1787317025596

High-value Sub-segments and Strategic Watch-out

Managed Detection And Analytics Subscriptions

High value and high growth sitting squarely together. Recurring revenue arrives whether or not an agency holds capital budget that year, the model fits operating budgets agencies can actually expand, and the supplier retains that customer relationship right across the entire twelve year replacement interval.
Gross Margin: 39 to 47%

Traffic Management Platform Integration

High value running on genuinely steady growth. Staff training, operating procedures and a decade of accumulated configuration together make a platform genuinely difficult to displace, and holding it lets the supplier integrate competitors' hardware behind it rather than being integrated by somebody else's platform instead.
Gross Margin: 29 to 36%

Connected Vehicle Roadside Deployment

The emerging core of this whole market. Standards settling has removed the objection that stalled agency buying for years, funded programmes are now replacing pilot installations, and the competitive field remains genuinely thin for as long as practical deployment expertise stays this scarce among suppliers.
Gross Margin: 26 to 34%

Competitively Tendered Hardware Supply

The strategic watch-out sitting squarely inside this particular portfolio. Volumes here keep manufacturing loaded and maintain the agency relationships behind everything else, but the specification is deliberately written for comparability across bidders, and nothing durable at all accrues to whoever happens to win any individual award.
Gross Margin: 14 to 20%

How Traffic System Demand Repeats

The annuity here is the agency relationship rather than any individual deployment. A control system installed today runs for roughly twelve years, generating maintenance, spares, software updates and incremental expansion revenue throughout, and the agency's staff build their working knowledge around it across that whole period. Winning the original platform decision therefore shapes more than a decade of spending, which is why suppliers accept thin margins on initial hardware to establish the p
Stickiness varies sharply by subsystem. Management platform positions are the deepest, since operating procedures, staff training and configuration history all sit inside the software and none of it transfers. Signal controller estates are nearly as sticky because agencies standardise deliberately to simplify maintenance. Detection hardware is considerably less sticky, replaced on shorter cycles and increasingly integrated behind whatever platform the agency already runs. Enforcement contracts are the least sticky, retendered regularly and often politically contested.

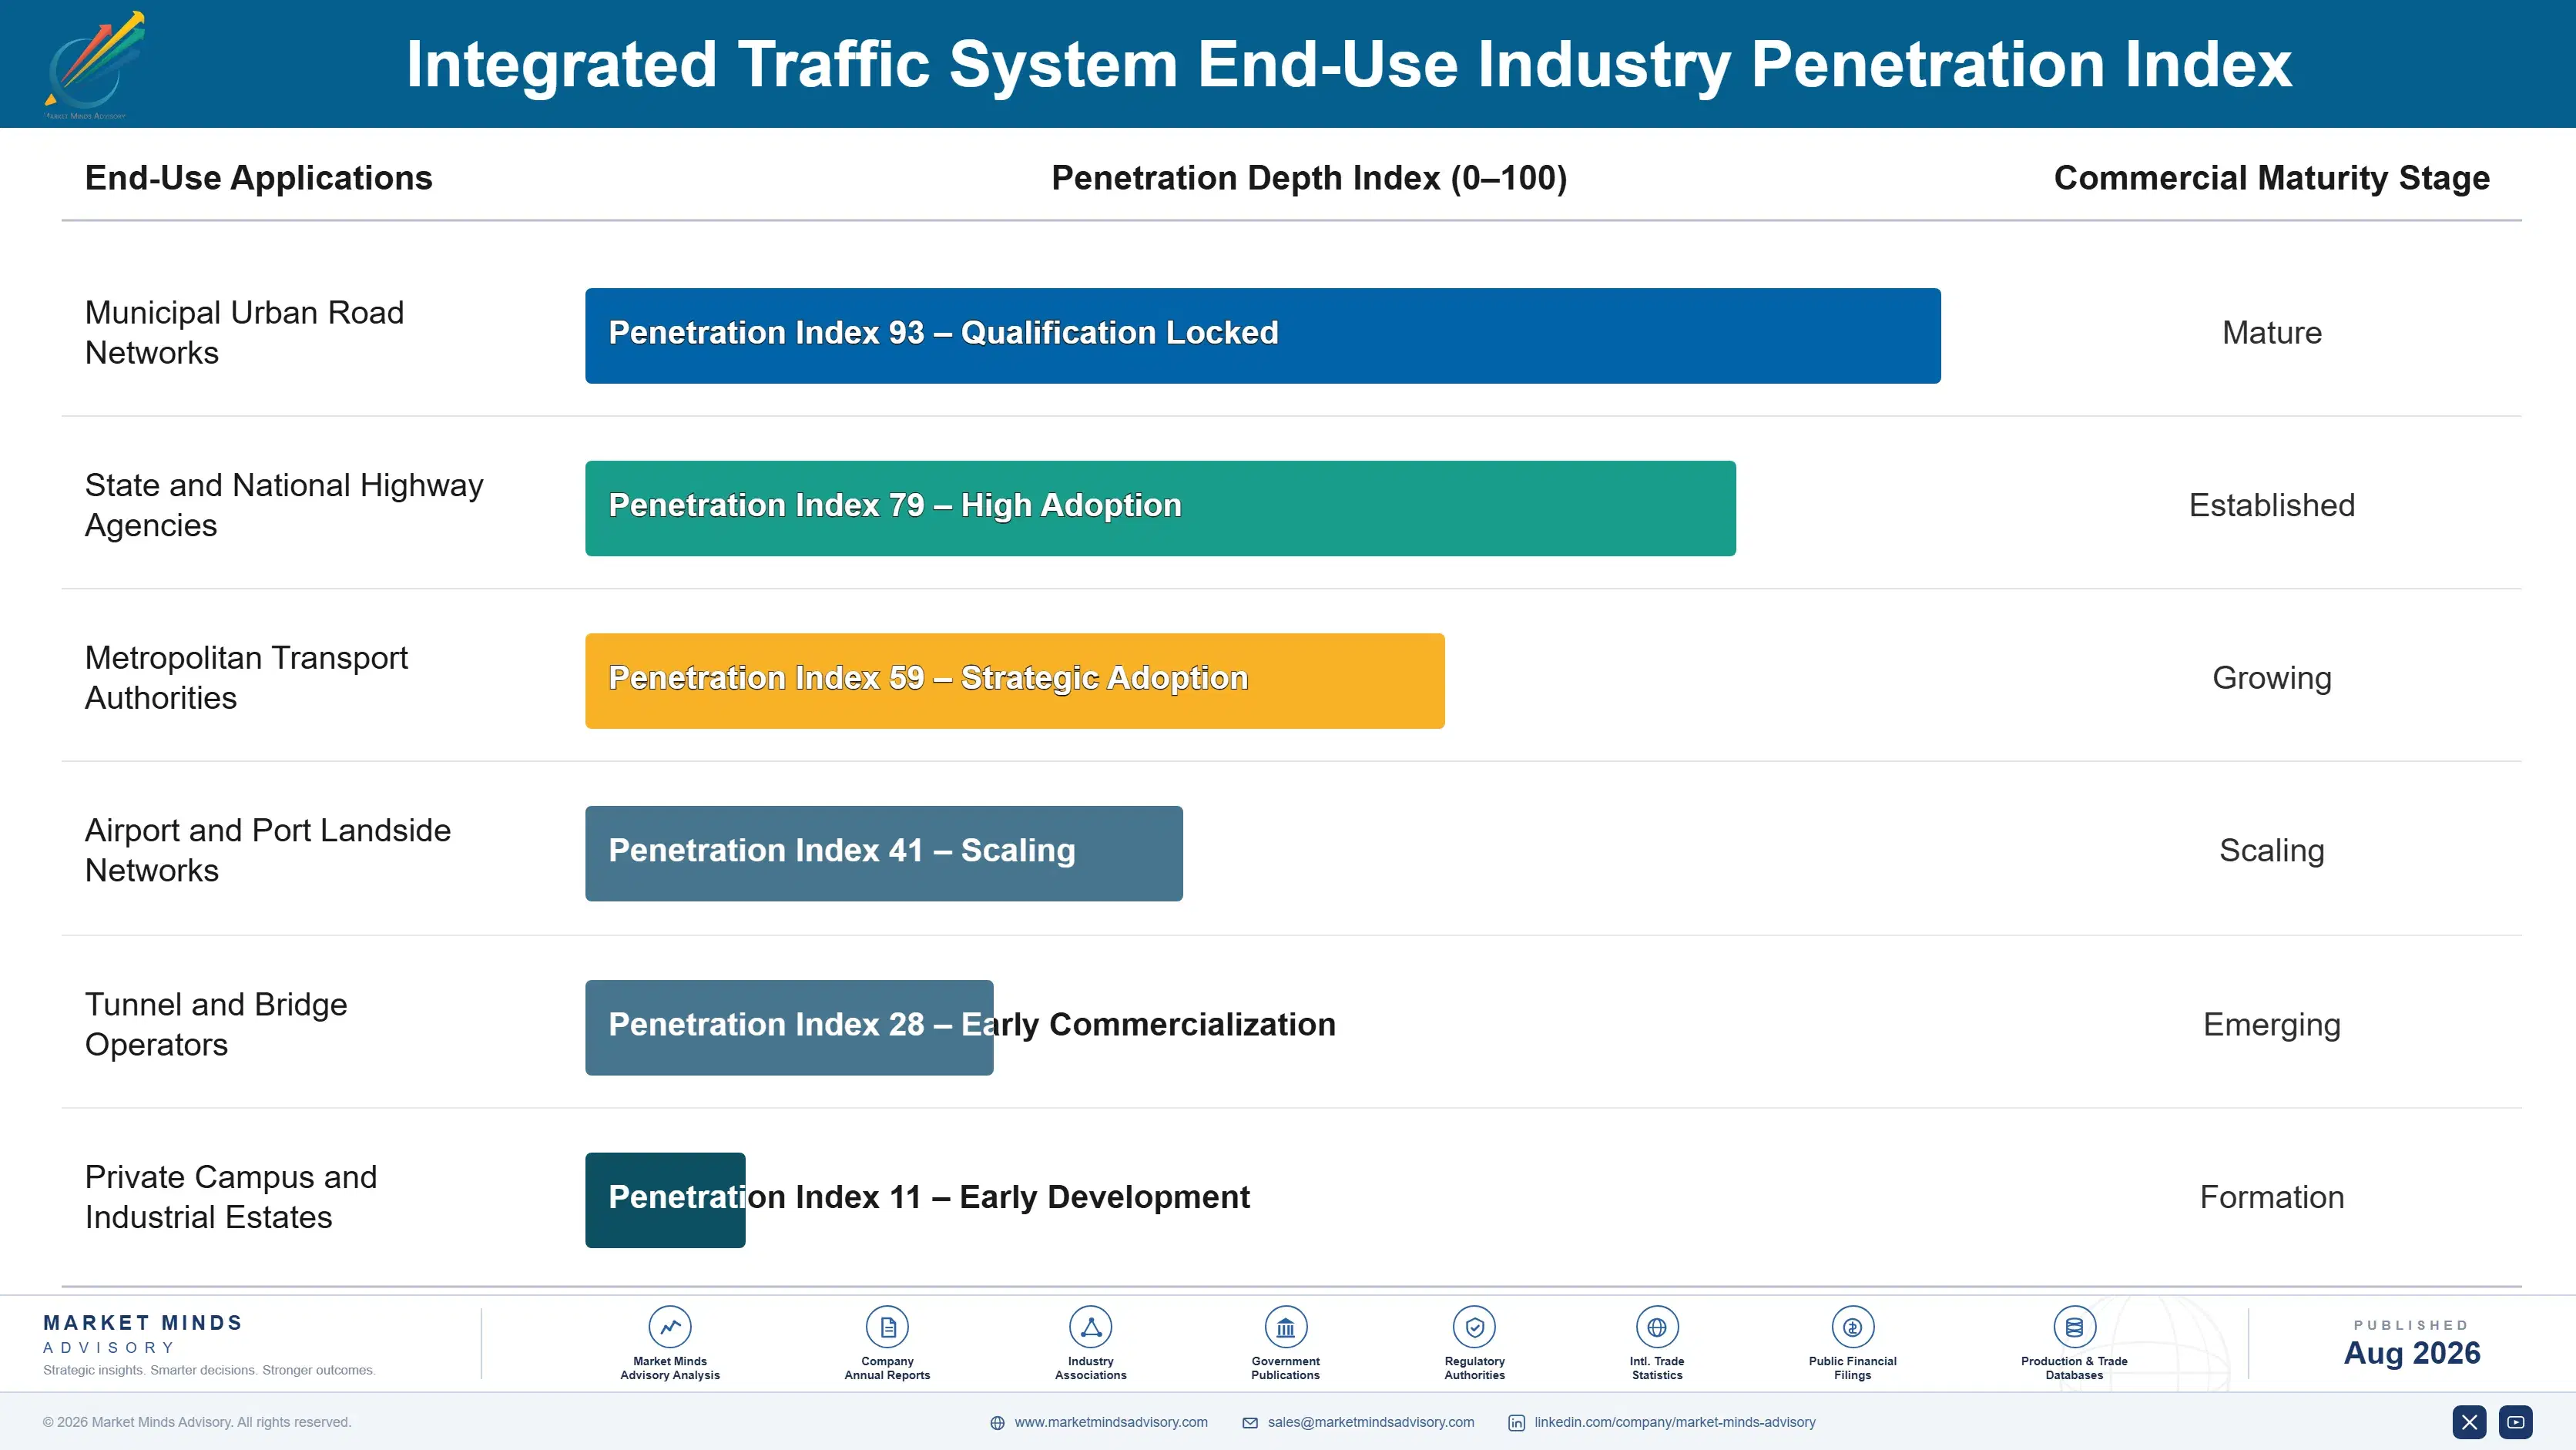
The buyer profile has shifted noticeably. Procurement once sat with traffic engineers evaluating signal timing performance and equipment reliability in isolation. Today it increasingly involves data and technology officers weighing cybersecurity, data ownership, interoperability and hosting arrangements alongside, which favours suppliers who can answer software questions as convincingly as engineering ones.
integrated-traffic-system-market-trends-end-use-penetration-index-1787317026391

Where To Compete And Why

These are among the four positions where our research anticipates prominent divergence between winners and laggards over the coming forecast period. Each is grounded in the demand model, the regulatory perimeter, and the announced capacity pipeline.
01 / RECURRING REVENUE CONVERSION

Subscriptions outlast every capital budget cycle

Software and managed services already supply 29% of supplier revenue at gross margins 20 to 28 points above hardware, and agencies prefer that model because it moves cost into operating budgets they can more easily expand. Structuring analytics, hosted management and managed detection as subscriptions holds the customer right through a twelve year replacement interval rather than only at the point of sale. The revenue also arrives during budget years when no capital spending happens at that agency at all.
02 / COOPERATIVE PURCHASING ACCESS

Win one tender and serve hundreds

Procurement runs around 26 months per tender and thousands of agencies each run their own, which makes selling cost brutal relative to individual contract value. Cooperative purchasing vehicles let a single competitive award serve dozens or hundreds of agencies afterwards without any further tendering, cutting effective sales cost by 40% to 55% per deployment. The underlying award is genuinely contested and demands real effort, but the commercial position it creates then compounds for years while competitors keep bidding intersection by intersection.
03 / PLATFORM OWNERSHIP POSITION

Own the software that outlives the hardware

Detection cameras and controllers are increasingly commodity purchases with several credible suppliers available, while the management platform an agency trains its staff on and populates with twelve years of configuration is genuinely difficult to displace. Suppliers holding the platform capture 25% to 35% more lifetime revenue per agency, because hardware refreshes then flow through them regardless of which company actually manufactured the device. It also determines who integrates whom right across the whole agency estate for a decade or more.
04 / PROCUREMENT CAPACITY SUPPORT

Agencies lack staff not funding

Transport agencies typically run several programmes simultaneously with a handful of engineers, and administrative capacity rather than money is what genuinely constrains deployment across this entire market. Suppliers providing specification support, funding application assistance and deployment planning shorten award timelines by 20% to 30%, and they shape requirements toward capability they already hold. It costs engineering and bid team time rather than any capital, and it establishes a commercial position well before any tender documents are ever published at all.

Engagement Snapshot From the Field

A live engagement with an industry participant carrying material or product regulatory and market exposure ahead of a defining policy shift, showing how our research translates into a defensible multi-year portfolio strategy.
MARKET MINDS ADVISORY · CLIENT ENGAGEMENT SUMMARY
Integrated Traffic System Producer Strategic Portfolio Review and Transition Roadmap 2026·Investment Scenario on Integrated Traffic System Exposure Evaluation 2025-26
CLIENT PROFILE
A North American supplier of traffic detection and signal control systems with annual revenue near $240 million (client-reported, unverified by MMA), roughly 86% of it from competitively tendered hardware sales to municipal and county agencies across eighteen states. The business held strong engineering and long agency relationships but almost no recurring revenue, and its selling cost per contract had risen steadily as procurement cycles lengthened.
STRATEGIC CHALLENGE
Hardware margins had compressed into the mid teens as detection specifications became increasingly comparable across suppliers, while infrastructure funding was creating more opportunities than the sales organisation could pursue at 26 months per tender. Management needed to decide whether to build a management platform, pursue cooperative purchasing agreements, or restructure detection supply as a managed service.
MMA APPROACH
MMA modelled agency spending and replacement timing across 340 municipal and county customers, mapped cooperative purchasing vehicles against the client's addressable territory, and assessed the engineering and commercial requirements for platform development and managed service delivery. Twenty-three expert interviews with agency engineers, procurement officers and technology directors tested how purchasing decisions were genuinely being made.
KEY FINDINGS
  1. Selling cost per awarded contract had reached roughly 19% of contract value, which meant the tender-by-tender model was consuming most of the gross margin the hardware actually generated.
  2. Two cooperative purchasing vehicles covered around 40% of the client's addressable agencies, and winning either would have removed individual tendering across that entire base.
  3. Agencies consistently ranked data ownership and interoperability above hardware specification when awarding, which favoured platform investment over any further detection product development.
  4. Managed detection service pricing tested well with agencies whose capital budgets were constrained, but required balance sheet capacity for equipment the client would own rather than sell.
CLIENT PROFILE
A North American supplier of traffic detection and signal control systems with annual revenue near $240 million (client-reported, unverified by MMA), roughly 86% of it from competitively tendered hardware sales to municipal and county agencies across eighteen states. The business held strong engineering and long agency relationships but almost no recurring revenue, and its selling cost per contract had risen steadily as procurement cycles lengthened.
STRATEGIC CHALLENGE
Hardware margins had compressed into the mid teens as detection specifications became increasingly comparable across suppliers, while infrastructure funding was creating more opportunities than the sales organisation could pursue at 26 months per tender. Management needed to decide whether to build a management platform, pursue cooperative purchasing agreements, or restructure detection supply as a managed service.
MMA APPROACH
MMA modelled agency spending and replacement timing across 340 municipal and county customers, mapped cooperative purchasing vehicles against the client's addressable territory, and assessed the engineering and commercial requirements for platform development and managed service delivery. Twenty-three expert interviews with agency engineers, procurement officers and technology directors tested how purchasing decisions were genuinely being made.
KEY FINDINGS
  1. Selling cost per awarded contract had reached roughly 19% of contract value, which meant the tender-by-tender model was consuming most of the gross margin the hardware actually generated.
  2. Two cooperative purchasing vehicles covered around 40% of the client's addressable agencies, and winning either would have removed individual tendering across that entire base.
  3. Agencies consistently ranked data ownership and interoperability above hardware specification when awarding, which favoured platform investment over any further detection product development.
  4. Managed detection service pricing tested well with agencies whose capital budgets were constrained, but required balance sheet capacity for equipment the client would own rather than sell.
RECOMMENDED STRATEGY
Phase 1: Phase one: bid both cooperative purchasing vehicles as the immediate priority, since either award removes tendering cost across a large share of the addressable base. Phase 2: Phase two: develop a management platform integrating third-party detection alongside the client's own, competing on data ownership and interoperability rather than device specification. Phase 3: Phase three: pilot managed detection service with agencies holding constrained capital budgets, sizing balance sheet exposure carefully before wider rollout.
OUTCOME
The client won one of the two cooperative agreements within nine months and reported selling cost per contract falling from 19% to 11% of value (client-reported, unverified by MMA). Platform development is underway with three agency design partners, managed service pilots are running in two metropolitan areas, and blended gross margin has improved by roughly four points.

Frequently Asked Questions

Foundational context covering the market sizes, CAGR, scope, country, region and competition that inform every finding below. This section is provided to cover basics and most often pre-purchase conversations, answered from the MMA Primary Research Dataset.

What is the current size of the Integrated Traffic System Market?

The global integrated traffic system market was valued at $13.50 billion in 2025, reaching an estimated $14.63 billion in 2026. That covers signal control, detection, enforcement, roadside infrastructure and traffic management software.

How large will the Integrated Traffic System Market be by 2036?

MMA forecasts the market reaching $32.77 billion by 2036, an increase of $18.14 billion over the 2026 base. That represents an expansion multiple of 2.24 times across the forecast period.

What is the CAGR for the Integrated Traffic System Market 2026 to 2036?

The base case compound annual growth rate is 8.4%, with a bull case of 9.6% and a bear case of 7.2%. Historical growth between 2020 and 2025 ran at 7.0% annually.

Which segment is growing fastest?

Connected vehicle roadside infrastructure grows at 12.6%, a full 1.50 times the market rate, now that communication standards have settled. Adaptive signal control systems follow at 10.2% annually.

Who are the major companies in the Integrated Traffic System Market?

Hikvision, Siemens Mobility, Kapsch TrafficCom, Cubic Transportation Systems and Dahua Technology lead on installed system deployment. Together they account for roughly 24% of the market, which is unusually fragmented.

Which country is growing fastest?

India grows fastest at 11.4% annually, driven by smart city and highway corridor programmes committing spending across dozens of cities simultaneously. Vietnam and Saudi Arabia follow on comparable programme funding.

Report Segmentation Architecture

The full report scope spans multiple orthogonal segmentation dimensions, with cross-tabulated demand data provided for each dimension pair. Coverage extends further to regional breakdowns, trend trajectories, and the competitive detail needed to support segment-level decision-making.

By System Function

  • Connected Vehicle Roadside Infrastructure
  • Adaptive Signal Control Systems
  • Traffic Management Centre Software
  • Traffic Detection and Sensing Systems
  • Automated Enforcement and Plate Recognition
  • Variable Message Signs and Roadside Displays

By End-Use Industry

  • Municipal Urban Road Networks
  • State and National Highway Agencies
  • Metropolitan Transport Authorities
  • Airport and Port Landside Networks
  • Tunnel and Bridge Operators
  • Private Campus and Industrial Estates

By Commercial Dimension

  • Competitive Agency Tender Supply
  • Cooperative Purchasing Agreement Sales
  • Managed Service and Subscription Contracts
  • System Integrator Channel Supply
  • Public Private Partnership Concession Delivery

By Region

  • North America
  • Western Europe
  • East Asia
  • South Asia and Pacific
  • Latin America
  • Middle East and Africa
  • Eastern Europe

Scope, Methodology, and Coverage

Every figure in this report is reproducible from documented input assumptions. The scope below maps the historical period, the forecast horizon, the segmentation dimensions, and the countries covered, alongside the underlying primary and qualitative methodology.
Historical Period
2020 to 2025
Forecast Period
2026 to 2036
Base Year
2025 (USD billions; MMA Primary Research Dataset, August 2026)
Market Definition
This report covers integrated traffic management systems for road networks, spanning traffic signal controllers and adaptive control platforms, vehicle and vulnerable road user detection, automated enforcement and number plate recognition, variable message signs, connected vehicle roadside infrastructure, and the traffic management centre software integrating those functions across municipal, highway and authority networks. Electronic road tolling systems, parking management, public transport ticketing and scheduling, in-vehicle equipment, and road construction or civil engineering works are excluded from the sizing.
Quantitative Units
USD billions at supplier realised value; deployed intersections and roadside sites in thousands; average deployment cost in USD per intersection.
Segmentation Dimensions
By system function; by end-use industry; by commercial dimension; by region.
Regions Covered
North America, Western Europe, East Asia, South Asia and Pacific, Latin America, Middle East and Africa, Eastern Europe
Countries Covered
United States, Canada, Mexico, United Kingdom, Germany, France, Netherlands, Sweden, Spain, Italy, China, Japan, South Korea, India, Australia, Indonesia, Brazil, United Arab Emirates, Saudi Arabia, Poland.
Key Companies Profiled
Hikvision, Siemens Mobility, Kapsch TrafficCom, Cubic Transportation Systems, Dahua Technology, SWARCO, Q-Free, Yunex Traffic, Iteris, Econolite, TransCore, Indra Sistemas, Thales, Teledyne FLIR and others.
Quantitative Methodology
Primary survey, n=3,800 respondents, Q4 2025, six countries; demand-side model with trade association cross-validation
Qualitative Methodology
47 expert interviews, Q4 2025; applied to validate demand model assumptions, identify emerging dynamics, and assess competitive positioning
Report Format
PDF and XLSX data workbook (Word format preview document)
Publisher
Market Minds Advisory
Report Code
MMA-2026-TEC-970
Published
August 2026
Contact
sales@marketmindsadvisory.com | www.marketmindsadvisory.com

Purchase the full Integrated Traffic System Market Report (2026 to 2036).

The full report sizes the integrated traffic system market across six system functions, six end-use industries and seven regions, with deployment and pricing detail behind every value estimate. It profiles twenty global suppliers on platform ownership, recurring revenue conversion and connected vehicle capability. Regional chapters cover infrastructure funding programmes, procurement structures and road safety policy by market. Commercial model analysis quantifies the shift from capital equipment toward subscription and managed service delivery. Procurement analysis maps cooperative purchasing vehicles and typical award timelines across major agency markets.
Deployment and pricing detail by system function
Cooperative purchasing vehicle mapping across agency markets
Connected corridor deployment forecasts through 2036
Recurring revenue conversion benchmarking by supplier
Competitive position assessments across twenty global suppliers
Infrastructure funding drawdown tracking by region

Built For The People Who Decide

From boardroom strategy to bench-side execution, this report is read cover-to-cover by leaders shaping the next decade of their industry, turning demand scenarios, market dynamics and valuation benchmarks into decisions.
CXOs/ Presidents/ VPs/ Managers
M&A and Corporate Development
Strategy Teams and R&D Heads
Procurement and Product Directors
Regulatory and Compliance Leaders
Investor Relations and Equity Analysts