

Market Minds Advisory
Insights-As-A-Service Market

Insights-As-A-Service Market: Insights-As-A-Service Market. Trends and Forecast 2026 to 2036

Real-time consumer behavior data is replacing quarterly syndicated reports as the default insight product, pushing legacy research firms to rebuild delivery around continuous data streams or lose enterprise contracts to API-native analytics challengers moving faster.

Lead Analyst

Published

September 2026

Make Smarter Decisions with Customized Research Insights

Request a free sample report and evaluate market opportunities, growth trends, and competitive dynamics relevant to your business needs.

2025 MARKET VALUE$8.4BMarket Size 2025
2036 FORECAST VALUE$26.5BBase Case , 2026 to 2036
CAGR 2026 TO 203611.0 %Bull 12.2% / Bear 9.8%
INCREMENTAL OPPORTUNITY$17.1BNet 10- year value creation
EXPANSION MULTIPLE2.84x2036 value over 2026 base
Strategic Levers
M&A Pipeline
Regional Outlook
Country Rankings
Competitive Intelligence
Segmental Deep-dive
Call-Us : 91 93563 13602

Executive Snapshot and Market Trajectory.

Enterprise buyers increasingly expect insights delivered as continuous data streams rather than periodic reports, forcing established research firms to rebuild delivery infrastructure around real-time analytics platforms and application programming interfaces rather than the quarterly deliverables that defined the category for decades across most industries, buyer segments, and company sizes.
Commercial activity concentrates around real-time consumer behavior analytics, since brands now require continuous visibility into shifting purchase patterns rather than retrospective quarterly summaries that arrive too late for tactical decision-making across most consumer product categories. Real-time analytics platforms show the fastest growth, with India's expanding digital economy and e-commerce data volume absorbing a disproportionate share of new subscription deployments as brands seek regional consumer insight.
Competitive intensity sits moderately concentrated among five vendors controlling roughly a third of subscription revenue, while dozens of specialized challengers compete for narrower embedded analytics, sentiment tracking, and custom consulting niches across most industry verticals and geographic markets served worldwide today across most buyer categories. Rising demand for API-native data delivery and growing scrutiny over data provenance and methodology transparency are reshaping which providers win enterprise renewal contracts across most industries.
Market Definition
The Insights-As-A-Service Market covers subscription-based platforms and application programming interfaces that deliver continuous consumer, market, and behavioral data analytics to enterprise buyers, including real-time dashboards, predictive intelligence, and embedded analytics feeds. It excludes traditional one-time market research reports and standalone business intelligence software sold as separate product categories.
Base Year Value
$8.4B in 2025 (MMA Primary Research Dataset, September 2026)
Forecast Period
2026 to 2036, eleven discrete annual values
CAGR
11.0% base case. Bull 12.2%. Bear 9.8%.
Fastest Growth Segment
Real-Time Consumer Behavior Analytics Platforms: 16.5% CAGR
Fastest Growth Country
India: 15.0% CAGR
Fastest Growth Region
South Asia and Pacific: 13.0% CAGR
Largest Region
North America: 31% of 2025 global value
Market Leaders
Leading participants include Nielsen, Kantar, GfK, Qualtrics, and Circana. Source: MMA Analysis based on company annual reports.
Primary Survey
n=3,800 procurement and R&D decision-makers, Q4 2025, six countries
Methodology
Demand-side build-up, cross-validated against public data, 47 expert interviews

Insights-As-A-Service Market Forecast Scenarios

insights-as-a-service-market-size-forecast-scenario-1789988570555
Between 2020 and 2025 the market grew at a milder 9.8% historical rate as insights delivery remained largely tied to quarterly syndicated reports, with commercial momentum accelerating meaningfully only after real-time analytics platforms demonstrated reliable continuous data streaming capability starting around 2023 across most enterprise research procurement programs, buyer categories, and geographic markets worldwide today.
The base case assumes 11.0% annual growth through 2036, driven by three mechanisms: accelerating real-time consumer behavior analytics adoption replacing quarterly syndicated report subscriptions across most consumer product categories, retail sectors, and financial services buyers, expanding embedded analytics-as-a-service application programming interface adoption across digital-native enterprise buyers and technology platforms, and rapid Indian digital economy growth absorbing a disproportionate share of new subscription deployments as brands seek granular regional consumer insight.
A bull scenario near 12.2% growth would require continued enterprise willingness to pay premium subscription pricing for real-time data streams over legacy quarterly reports across most industry categories and buyer segments. A bear case near 9.8% reflects slower than expected enterprise trust in continuous analytics accuracy, compressing platform adoption across smaller buyers facing tighter research budget constraints and procurement scrutiny enforced today.

Where Insight Delivery Becomes Continuous Infrastructure

Insights-as-a-service emerged from the collision between traditional market research firms and modern data infrastructure, as clients grew tired of paying for quarterly reports that described consumer behavior weeks after it actually happened, missing entire campaign windows and seasonal shifts that mattered most for tactical decision-making. This dissatisfaction pushed both established firms and new entrants to rebuild delivery around continuous data pipelines rather than periodic document production.
MARKET CONCENTRATIONCR5 36%Share held by five largest global insight providers combined
AVERAGE CONTRACT VALUE$78,000 annuallyTypical enterprise subscription spend on insights platform tools
TOP ADOPTING COUNTRYUnited States, 33% shareShare of global platform revenue generated by enterprises there
PLATFORM RETENTION RATE87% annuallyAnnual customer renewal rate across major enterprise platform contracts
REAL-TIME FEATURE ADOPTION41% of enterprise accountsPortion of large accounts actively using real-time data streams
API DELIVERY SHARE29% of subscriptionsPortion of total subscriptions delivered through embedded programming interfaces
Commercial character centers on delivery speed and integration depth: enterprise buyers increasingly demand data feeds that plug directly into their own business intelligence dashboards rather than static presentation decks requiring manual interpretation by internal analyst teams stretched thin across competing priorities. Vendors offering pre-built connectors to common enterprise data platforms are winning renewal contracts over competitors still delivering insights as standalone documents.
Over the next decade, methodology transparency and data provenance documentation will likely determine which providers retain enterprise contracts, as buyers increasingly scrutinize sample sizes and collection methods behind headline statistics before committing to multi-year subscription agreements worth meaningful annual spend. Providers that fail to document methodology rigorously risk losing renewal business to newer entrants built around verifiable data sourcing standards.
"Nobody wants a quarterly deck anymore, they want a dashboard that updates itself, and the research firms that figured that out five years early are the ones still growing."
Director, Data Services and Market Intelligence Practice · MMA Technology Practice · September 2026

Market Trends

Real-Time Data Streams Replace Quarterly Report Cycles

Insights providers are launching continuous data streaming platforms that update consumer behavior metrics daily or hourly rather than compiling quarterly report deliverables, with adoption expanding to roughly 41% of enterprise accounts during 2025 compared with negligible share three years earlier. Nielsen and Kantar have both expanded real-time analytics dashboards significantly since 2024, adding automated alert capability that traditional quarterly syndicated report products never required when serving primarily periodic reporting use cases exclusively for decades. Competing providers now face intense pressure to demonstrate comparable real-time capability quickly to retain enterprise accounts.
Market Impact: Tracked e-commerce data exceeded 2.8 trillion
Methodology Transparency Becomes Standard Procurement Requirement

Enterprise buyers increasingly require documented sample sizes and data collection methodology before renewing insights subscriptions, given growing skepticism about headline statistics lacking transparent sourcing across the broader research industry. Vendors report that roughly 47% of enterprise buyers now specifically request methodology documentation during procurement evaluation, a substantial increase from negligible demand just three years earlier when subscription-based insight delivery first began scaling across mainstream enterprise buyers and industries. Analysts expect this scrutiny to intensify further as procurement teams centralize research vendor evaluation. This trend increasingly determines which vendors survive competitive procurement cycles across most enterprise buyer categories tracked closely.
Market Impact: Marketing budget scrutiny rose roughly 12%

Market Opportunities and Growth Drivers

E-Commerce Data Volume Growth Drives Subscription Demand

Global e-commerce transaction volume generated an estimated 2.8 trillion dollars in tracked consumer data points during 2025, according to industry survey estimates, creating substantial raw material for insights providers to package into subscription products serving brand and retail clients seeking granular purchase pattern visibility. Brands facing intensifying digital competition increasingly view continuous consumer behavior data as essential infrastructure rather than optional research spend, accelerating subscription contract signing across most consumer packaged goods and retail categories facing margin pressure. Vendors specializing in retail-adjacent data packaging are seeing the strongest adoption momentum across most consumer categories industry-wide.
Market Impact: Compliance costs rose roughly 22%

Marketing Budget Accountability Pressure Expands Analytics Spend

Corporate marketing budgets faced roughly 12% average scrutiny increases in 2025 as finance departments demanded clearer proof of campaign-level return on investment before approving continued spend across most advertiser organizations and product categories. Insights-as-a-service providers offering granular attribution and real-time campaign performance data have captured disproportionate enterprise contract wins as chief marketing officers seek defensible data to justify continued marketing investment against competing digital channels facing similar scrutiny pressure from company leadership. Chief financial officers increasingly favor providers with measurable, demonstrable campaign outcomes over speculative research spending initiatives lacking comparable measurement rigor.
Market Impact: Procurement timelines extended by roughly 30%

Market Restraints and Challenges

Data Privacy Regulation Constrains Consumer Tracking Depth

Data privacy regulations across multiple jurisdictions now restrict the granularity of consumer tracking data insights providers can legally collect and package for resale, adding an estimated 22% to typical data collection compliance costs for providers operating across regulated markets. The root cause lies in tightening consent requirements following several high-profile data privacy enforcement actions against consumer tracking practices industry-wide. Providers are mitigating this by shifting toward aggregated, privacy-compliant data collection methods that avoid individual-level tracking entirely. Larger providers with dedicated compliance teams manage this transition more effectively than smaller specialized competitors.
Market Impact: Real-time adoption reached 41% of accounts

Methodology Skepticism Slows Enterprise Contract Renewal

Enterprise buyers increasingly delay subscription renewal decisions pending methodology audits, adding an estimated 30% to typical procurement timelines as buyers demand documented sample sizes and data collection transparency before committing to multi-year contracts. The root cause traces to several publicized instances of inflated or poorly documented statistics undermining broader industry credibility among skeptical procurement teams. Providers are mitigating this by publishing detailed methodology documentation and third-party data quality audits proactively before renewal discussions begin. Providers with established credibility navigate this friction more effectively than newer entrants lacking comparable long-term track records and reputation.
Market Impact: Methodology requests rose to 47%
3 additional market trends, 4 additional growth drivers, and 2 additional restraints and challenges are covered in the full report. Contact sales@marketmindsadvisory.com to access the complete intelligence.

Segment CAGR and Growth Architecture

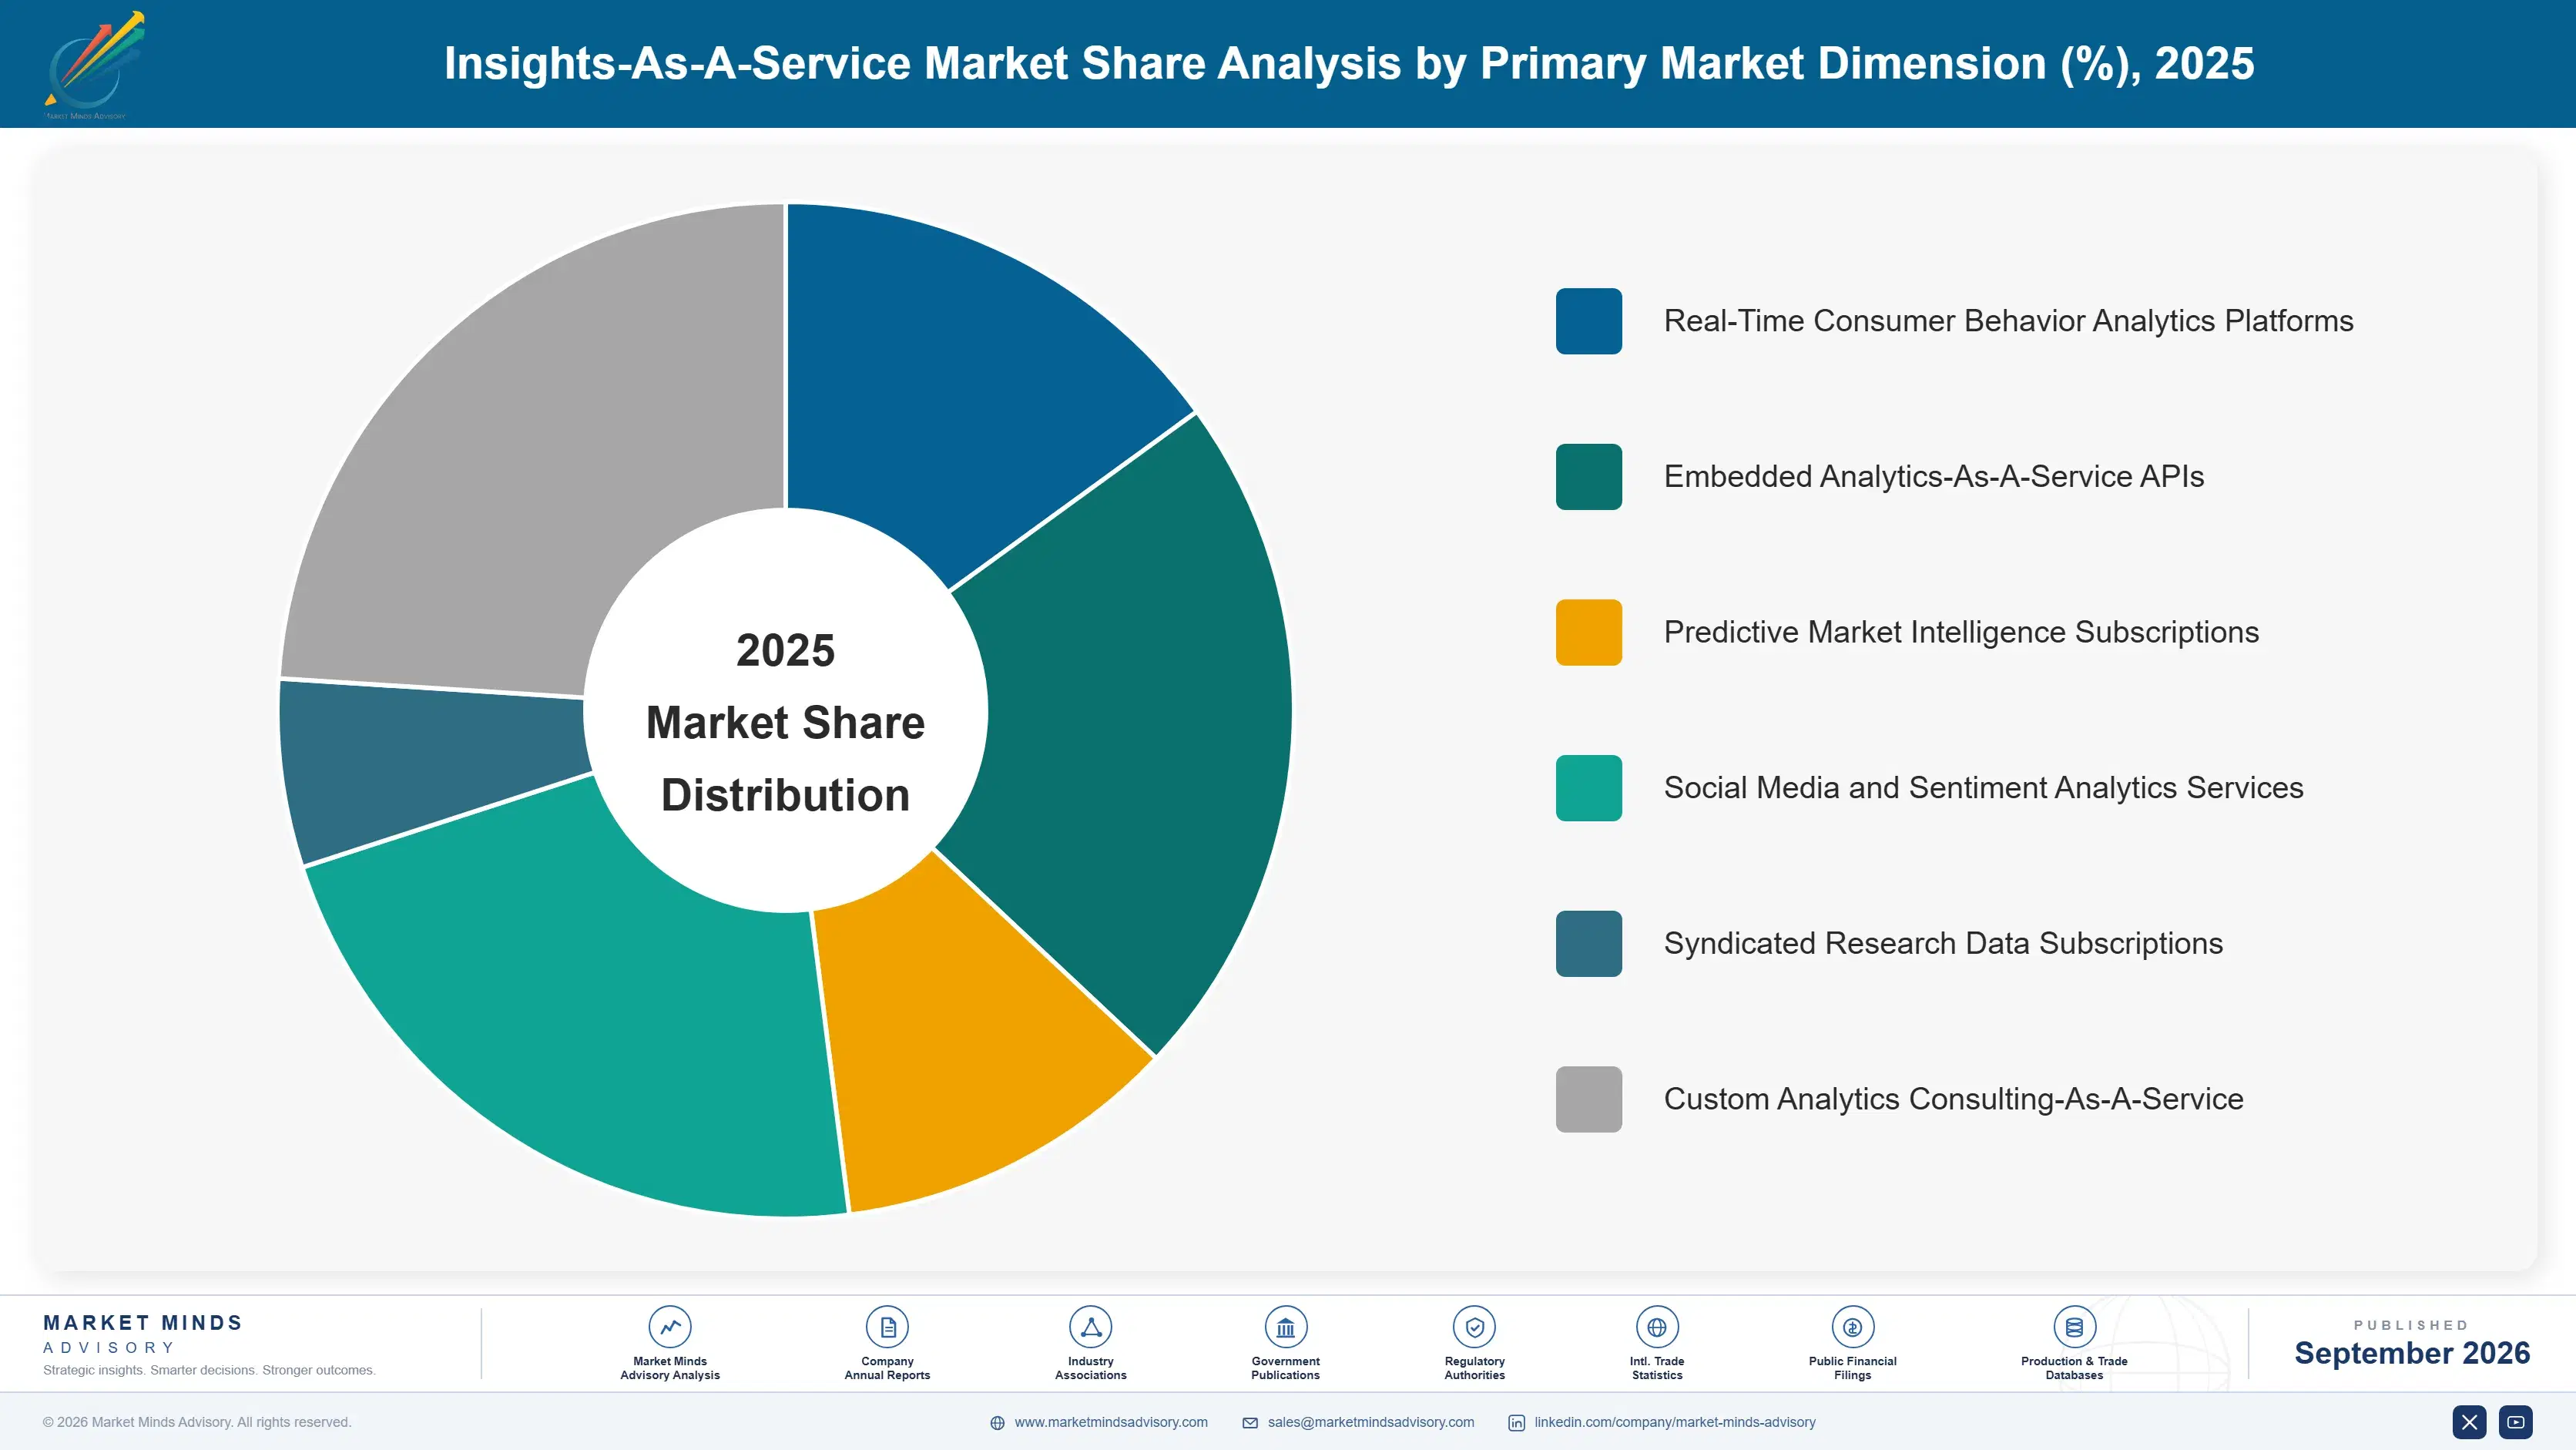
This report segments the Insights-As-A-Service Market by delivery model, the classification enterprises actually use when selecting subscription products for real-time analytics, predictive intelligence, embedded data feeds, or custom research across distinct technical and commercial needs within their broader market intelligence function, capital budget, internal staffing model, and continuously evolving vendor procurement structure requirements today.
insights-as-a-service-market-market-share-analysis-1789988571092

Real-Time Consumer Behavior Analytics Platforms

Real-time consumer behavior analytics platforms are the fastest-growing delivery model, expanding at 16.5% annually as brands demand continuous visibility into shifting purchase patterns rather than retrospective quarterly summaries arriving too late for tactical decisions across most consumer product categories and retail sectors. These platforms bundle automated alerting, trend detection, and dashboard visualization features that traditional syndicated report products never required when serving primarily periodic reporting use cases exclusively for decades. Nielsen and Kantar both lead this category with expanded real-time features launched since 2024, while newer entrants capture share among digital-native mid-market brands specifically. Their established data collection infrastructure represents a meaningful barrier to entry for newer competitors. Smaller competitors increasingly struggle to match this data collection scale independently.
CAGR 16.5%

Embedded Analytics-As-A-Service APIs

Embedded analytics-as-a-service application programming interfaces, the second-fastest-growing delivery model at 14.0% annually, benefit from rising enterprise demand for data feeds that plug directly into internal business intelligence dashboards rather than standalone presentation deliverables requiring manual interpretation by internal analyst teams stretched across competing priorities. Enterprise buyers increasingly require pre-built connectors to common enterprise data platforms as standard capability before signing subscription agreements. Companies specializing in this category, including Qualtrics and GfK, are winning enterprise contracts by demonstrating measurable integration speed against documented baseline implementation timelines. Financial services buyers in particular report the fastest adoption curve among comparable enterprise data categories tracked closely. Adoption is accelerating fastest among enterprises facing the heaviest existing data integration workload.
CAGR 14.0%
Full segment breakdown across 6 segments available in the complete report.

Regional Architecture and Country Demand Map

North America leads given concentrated insights vendor headquarters and enterprise research budget scale across most industries and company sizes today, while East Asia holds meaningful share, and South Asia and Pacific grows fastest as India's rapidly expanding digital economy generates rich consumer behavior data nationwide.

North America

The United States anchors regional demand through concentrated vendor headquarters, including Nielsen and Circana, alongside the largest enterprise marketing and research budget pool spending on continuous insights across most consumer product and retail categories nationwide. Enterprise adoption of real-time analytics and API-native delivery runs ahead of other regions given earlier subscription-based research product maturity. Canada contributes modest additional demand through mid-market retail and consumer goods brands adopting similar platform capabilities. Enterprise procurement teams increasingly evaluate vendors specifically on methodology transparency and API integration depth before signing renewal contracts across most sectors. This scrutiny is reshaping which vendors win the largest and most sophisticated enterprise accounts nationwide. Insurance underwriters increasingly favor documented data governance processes reducing legal exposure from privacy claims.
Share: 31% | CAGR: 10.5% (2026 to 2036)

Western Europe

The United Kingdom and Germany drive regional demand through Kantar and GfK's headquarters presence and a dense population of consumer goods and retail brands requiring continuous market intelligence subscriptions. France contributes meaningful additional demand through luxury goods and retail sector adoption at a steady pace. Growth trails the global average as stricter data privacy regulation compliance requirements weigh more heavily on granular consumer tracking data collection than in less regulated markets. Financial services and consumer goods buyers in particular demand comprehensive documentation of data collection sourcing before deployment approval. This regulatory environment increasingly shapes product development priorities for vendors serving European enterprise customers. Nordic markets add incremental demand through technology sector adoption tied to expanding regional analytics infrastructure investment.
Share: 23% | CAGR: 9.5% (2026 to 2036)
Regional intelligence for 5 additional markets available in the complete report: East Asia, South Asia and Pacific, Latin America, Middle East and Africa, Eastern Europe. Contact sales@marketmindsadvisory.com.
insights-as-a-service-market-country-cagr-analysis-1789988571636

Where Providers Can Defend Subscription Margin

As basic syndicated data commoditizes, providers must build value beyond raw statistics: methodology transparency, embedded API delivery, real-time alerting, and global delivery efficiency that generic dashboard tools and internal analytics teams cannot easily replicate given the deep data collection infrastructure, analyst expertise, and long-standing customer trust built over many sustained years of continued investment.

Methodology Documentation as Premium Trust Signal

Providers publishing comprehensive methodology documentation and sample size transparency capture meaningfully higher renewal rates than competitors offering headline statistics without sourcing detail, since procurement teams increasingly audit data provenance before committing to multi-year contracts. Enterprise accounts requiring this documentation depth pay roughly 27% more than accounts accepting undocumented statistics alone, given the demonstrated risk reduction value for compliance-conscious buyers facing internal audit requirements. Providers positioning this capability strategically are winning disproportionate share in regulated sectors. This trend increasingly separates well-resourced providers from smaller firms lacking comparable compliance capability. Buyers increasingly cite this documentation as decisive in vendor selection reviews.
Market Impact: Methodology transparency commands roughly a 27% overall premium

Embedded API Delivery for Enterprise Stickiness

Providers offering embedded application programming interface delivery that plugs directly into enterprise business intelligence dashboards capture deeper platform lock-in than competitors delivering static reports requiring manual data entry. Enterprise accounts using embedded API delivery report renewal rates roughly 35% higher than accounts receiving standalone document deliverables, since switching providers requires rebuilding internal data pipeline integrations entirely. This stickiness increasingly determines which providers retain large enterprise contracts against price-competitive but less integrated challengers. Buyers increasingly prefer integrated data pipelines over standalone document-based deliverables requiring manual entry. This trend increasingly shapes how competitors structure their own product integration roadmaps going forward.
Market Impact: API delivery lifts renewal rates by roughly 35%

Real-Time Alerting for Tactical Decision Support

Providers offering real-time anomaly detection and automated alerting capability capture premium pricing from brands managing time-sensitive campaign and inventory decisions that quarterly reports cannot adequately support. Real-time alerting subscribers pay roughly 30% more on average than accounts using standard periodic reporting products, given the demonstrated value of catching demand shifts before competitors react. This capability increasingly determines which providers win competitive procurement evaluations against slower-moving legacy alternatives. Retail and consumer goods buyers in particular value this speed advantage during peak selling seasons. This capability increasingly separates premium providers from commodity data resellers competing purely on price.
Market Impact: Real-time alerting commands roughly a 30% price premium

India Delivery Center Expansion for Cost Efficiency

Providers expanding data processing and customer success delivery centers across India's large analytics talent base are reducing platform development and support costs meaningfully while improving service coverage across time zones for global enterprise customers. Companies with established India delivery operations report cost structures roughly 25% more efficient than competitors relying entirely on higher-cost domestic talent for equivalent engineering and support functions. This cost advantage increasingly funds more aggressive product investment and competitive pricing strategies. Vendors without comparable scale increasingly struggle to match resulting pricing competitiveness. This model increasingly shapes how competitors structure their own global delivery footprints going forward.
Market Impact: India delivery centers cut costs by roughly 25%

Who Controls the Margin Pool

Concentration sits moderate, with a CR5 near 36% on a subscription revenue basis and a meaningful gap separating Nielsen and Kantar from mid-tier challengers like Qualtrics and Circana, who compete on real-time analytics depth and embedded API delivery rather than broad syndicated report portfolio breadth across most retail, consumer goods, and financial services buyer categories and geographic markets served today.
Current competitive activity centers on three dimensions: real-time analytics feature launches replacing traditional quarterly syndicated report deliverables across most industry categories, methodology transparency documentation positioned as a premium differentiator commanding meaningfully higher enterprise contract values, and embedded API delivery racing to deepen platform lock-in ahead of price-competitive challengers. India delivery center expansion has also become a meaningful cost lever among providers seeking pricing advantage.

Emerging pressure comes from digital-native data brokers building lightweight, API-first competitive alternatives to traditional syndicated research firms, potentially disintermediating legacy providers entirely for smaller enterprise accounts and mid-market buyers. Providers slow to add real-time delivery or methodology transparency risk losing enterprise renewal contracts to better-prepared competitors already established in these channels, while regional data collection depth increasingly determines which challengers gain meaningful share.
insights-as-a-service-market-company-positioning-matrix-1789988572165

Competitive Moat and Risk Dimensions

NIELSEN

Moat: Decades of Proprietary Panel Data

Nielsen's decades of accumulated proprietary consumer panel and retail measurement data give it a historical baseline comparison advantage that newer entrants cannot replicate without comparable years of longitudinal data collection across retail categories, geographic markets, and demographic segments built over many generations of sustained operation and continued investment.
NIELSEN

Risk: Legacy Delivery Model Modernization Cost

Nielsen's traditional syndicated report delivery model requires substantial ongoing investment to rebuild around real-time API-native architecture that newer, purpose-built competitors offer natively from inception, risking share loss among digital-native brands prioritizing speed over historical data depth and legacy measurement methodology entirely across most modern buyer segments.
KANTAR

Moat: Global Survey Panel Scale

Kantar's extensive global survey panel infrastructure spanning dozens of countries gives it geographic breadth that smaller regional competitors cannot match without comparable years of accumulated respondent recruitment and panel management investment across diverse international markets, demographic segments, and cultural contexts built over many decades of operation.
KANTAR

Risk: Real-Time Feature Development Lag

Kantar's survey-based methodology historically required longer data collection and processing cycles than newer real-time behavioral tracking competitors, risking share loss among brands prioritizing immediate continuous data streams over periodic, methodologically rigorous survey-based insight products requiring longer respondent recruitment and fielding timelines across most consumer segments.

Players Tracked

Prominent Players

Nielsen
Kantar
GfK
Qualtrics
Circana

Other Key Players

Ipsos
YouGov
Morning Consult
Numerator
Brandwatch
Sprinklr
Talkwalker
Similarweb
Semrush
Attest
Dynata
Cint
Suzy
Zappi
Toluna

Recent Developments

FEBRUARY 2025

Nielsen Launches Real-Time Consumer Behavior Dashboard

Nielsen introduced a real-time consumer behavior dashboard offering hourly updated purchase pattern data, targeting brands managing time-sensitive campaign and inventory decisions across most consumer product categories and retail channels tracked. The launch directly addresses growing enterprise buyer demand for continuous visibility replacing traditional quarterly syndicated report deliverables.
Signal: Signals Nielsen's strategic pivot toward real-time delivery infrastructure and away from legacy quarterly reporting entirely and permanently.
JUNE 2025

Kantar Publishes Comprehensive Methodology Documentation Standards

Kantar published comprehensive methodology documentation standards across its subscription products, disclosing sample sizes and data collection procedures previously available only upon direct client request from procurement and compliance teams. The publication addresses growing enterprise buyer scrutiny over data provenance and statistical validity before subscription renewal decisions.
Signal: Signals providers racing to build transparency credentials ahead of tightening enterprise procurement standards across most industries.
OCTOBER 2025

Qualtrics Expands India Engineering Delivery Operations

Qualtrics announced a significant expansion of its India-based engineering and customer success delivery operations, aiming to reduce platform development costs while improving support coverage across global time zones for enterprise clients. The expansion positions Qualtrics to compete more aggressively on pricing against larger, higher-cost domestic competitors.
Signal: Signals continued vendor consolidation of engineering operations toward lower-cost global delivery center locations across most regions.

Data Collection and Panel Recruitment Cost Exposure

Consumer panel recruitment, survey fielding, and cloud data processing costs represent roughly 30 to 38% of total operating cost of goods sold for insights-as-a-service providers, given the ongoing investment required to maintain representative, continuously refreshed data collection infrastructure across markets, demographic segments, and geographic regions served worldwide today, with the remainder split across analyst staffing and platform engineering.
Panel recruitment and survey fielding costs rose an estimated 18% between 2023 and 2025 amid tightening consumer participation rates and rising incentive payment expectations, according to company annual reports from major research firms citing sustained difficulty maintaining representative sample sizes across most demographic segments and geographic markets, as data collection demand accelerated alongside expanding subscription customer bases globally and across most industry verticals tracked closely.

This exposure disadvantages smaller providers lacking established panel infrastructure and long-term respondent relationships, forcing them to absorb higher per-respondent recruitment costs than larger competitors with committed-use panel management agreements across their data collection operations and vendor networks. Providers with proprietary behavioral tracking data reducing dependency on survey-based collection gain a meaningful and durable cost advantage over competitors reliant entirely on traditional panel recruitment.
insights-as-a-service-market-cost-volatility-analysis-1789988572363

Multi-Year Panel Vendor Supply Agreements

Larger providers increasingly negotiate committed-use panel management agreements with survey vendors spanning multiple years, locking in discounted per-respondent recruitment pricing well below standard spot market rates offered broadly to smaller competitors across the broader industry and market today. This reduces exposure to recruitment cost inflation while providing budget predictability across annual planning and procurement cycles.

Proprietary Behavioral Data Reducing Survey Dependency

Some providers are investing in proprietary behavioral tracking data collection, such as retail transaction partnerships, reducing dependency on the most expensive survey-based panel recruitment specifically for common consumer behavior metrics tracked across most product categories. This diversification gradually reduces exposure to panel cost volatility across most subscription product lines and offerings over time considerably.

Automated Data Quality Screening to Reduce Waste

Several providers are implementing automated respondent quality screening tools that filter out low-quality survey responses earlier in the collection process, reducing the need for costly re-fielding of unreliable data across most survey programs, product lines, and geographic markets nationwide. This approach prioritizes upfront quality control over downstream data cleaning and correction costs incurred later.

Portfolio Architecture for Margin Defence

Providers span three margin tiers: basic syndicated report subscriptions generate gross margins around 45 to 52%, while real-time analytics platforms bundling methodology transparency and embedded API delivery command 62 to 70% given technical differentiation and trust value competitors cannot quickly replicate without years of investment. The gap has widened considerably as enterprise buyers pay substantially more for continuous, verifiable data.
Basic syndicated report subscriptions still represent the largest share of subscriber count, particularly among smaller brands managing modest research budgets directly through simple subscription tiers and annual renewal contracts, but the highest value creation now concentrates in enterprise contracts bundling real-time analytics, embedded delivery, and methodology documentation together. Providers must balance product investment between broad self-service accessibility and premium enterprise feature depth requirements.

High-value margin pools concentrate specifically around real-time alerting, embedded API delivery, and methodology transparency documentation, all requiring engineering and data governance investment that smaller regional competitors struggle to replicate quickly at comparable quality and cost. Providers positioned across all three tiers, rather than concentrated purely in basic syndicated subscriptions, are best placed to capture disproportionate profit as continuous data demand keeps expanding globally.

Basic syndicated report subscriptions sold on price to smaller brands managing modest research budgets, generating gross margins of 45 to 52% amid intense competition among numerous low-cost self-service data providers.
Gross Margin

Real-time analytics platforms bundling methodology transparency, embedded API delivery, and alerting commanding gross margins of 62 to 70% given technical differentiation and trust value limiting competitive entry from smaller vendors.
Gross Margin

Privacy-compliant, aggregated data collection tools responding to tightening consumer data protection regulation and enterprise governance requirements, generating gross margins around 55 to 62% as early movers capture premium regulated-industry contracts.
Gross Margin
insights-as-a-service-market-portfolio-architecture-1789988572864

High-value Sub-segments and Strategic Watch-out

Real-Time Consumer Behavior Analytics Platforms

Fastest-growing and highest-margin segment as brands demand continuous visibility into shifting purchase patterns replacing retrospective quarterly summaries across most consumer product categories and retail sectors today. Providers with established real-time infrastructure are capturing premium positioning ahead of competitors still reliant on legacy periodic reporting cycles.

Embedded Analytics-As-A-Service APIs

Second-fastest growing segment tied to rising enterprise demand for data feeds that plug directly into internal dashboards rather than standalone documents requiring manual interpretation by internal analyst teams. Providers building deeper integration credentials here can capture disproportionate value as enterprise procurement cycles increasingly require this capability.

Predictive Market Intelligence Subscriptions

Core revenue segment representing steady subscription renewal demand across most active enterprise and mid-market deployments currently tracked across most industry verticals and company sizes, generating stable margins as competitive pricing pressure persists moderately. This segment remains commercially essential even as growth shifts toward real-time alternatives over the coming forecast period.

Custom Analytics Consulting-As-A-Service

Strategic watch-out segment facing steady commoditization as basic custom consulting engagements become table stakes across nearly all competing providers, vendor tiers, and price points today. Providers overexposed to this category risk meaningful margin erosion absent diversification into real-time or embedded product lines over the coming several years.

Why Insights Subscriptions Keep Renewing

Revenue durability comes primarily from subscription models tied to data volume and dashboard seat count, since enterprises rarely dismantle insights infrastructure once integrated into quarterly planning cycles given the switching cost involved in migrating historical benchmarks, rebuilding comparative baseline data, and retraining teams on new platform interfaces. Providers renewing multi-year enterprise contracts capture predictable recurring revenue even as new customer acquisition slows.
Adoption depth varies meaningfully by vertical: consumer packaged goods and retail buyers show the deepest engagement, running extensive continuous monitoring programs with dedicated insights teams tracking dozens of active metrics and campaign performance indicators daily, while smaller professional services firms use insights subscriptions far more sparingly, often limited to periodic competitive benchmarking managed with minimal dedicated staffing and lighter governance requirements overall.

Younger marketing and insights managers entering enterprise roles increasingly expect real-time dashboards and embedded API delivery as standard subscription features, rather than accepting the quarterly presentation decks that defined the category for the prior decade of market research practice and manual analysis. This generational shift pressures providers still selling static reports to modernize product architecture quickly or risk losing meaningful renewal business.
insights-as-a-service-market-end-use-penetration-index-1789988573351

Modernize Delivery Before Trust Erodes Further

These are among the four positions where our research anticipates prominent divergence between winners and laggards over the coming forecast period. Each is grounded in the demand model, the regulatory perimeter, and the announced capacity pipeline.
01 / REAL-TIME DELIVERY INVESTMENT

Rebuild delivery infrastructure before digital-native rivals catch up

Providers still architected around quarterly syndicated report cycles face inevitable share loss as brands increasingly require continuous visibility into shifting purchase patterns across most consumer product categories, retail sectors, geographic markets, and buyer segments worldwide today. Building real-time delivery capability now captures the fastest-growing segment, currently expanding at 16.5% annually, well ahead of legacy competitors still retrofitting older platforms slowly and cautiously across most organizations. Delaying this pivot risks permanent share loss to purpose-built real-time entrants already gaining meaningful traction.
02 / METHODOLOGY TRANSPARENCY DOCUMENTATION

Publish documented methodology before scrutiny forces the issue

Enterprise buyers increasingly demand comprehensive sample size and data collection methodology documentation before renewing subscriptions, given growing skepticism about undocumented headline statistics across the broader research industry and competitive landscape overall and across most global regions today. Providers publishing this documentation capture roughly 27% higher contract values than competitors offering unsourced statistics alone across comparable enterprise accounts, buyer categories, and industry verticals tracked closely. Competitors delaying this transparency investment risk losing renewal business to already-differentiated, documentation-focused rivals gaining procurement favor.
03 / EMBEDDED API DELIVERY EXPANSION

Build deeper platform integration before switching costs disappear

Enterprise accounts using embedded application programming interface delivery report renewal rates roughly 35% higher than accounts receiving standalone document deliverables, since switching providers requires rebuilding internal data pipeline integrations entirely from scratch across most enterprise technology stacks and vendor relationships today. This stickiness increasingly determines which providers retain large enterprise contracts against price-competitive but less integrated challengers gaining market attention across most buyer segments and industries. Providers without comparable API depth risk losing renewal business to more deeply integrated competitors.
04 / GLOBAL DELIVERY COST OPTIMIZATION

Expand India delivery operations to fund competitive pricing

India's analytics talent base is expanding rapidly, and providers building substantial engineering and support delivery operations there report cost structures roughly 25% more efficient overall than competitors relying entirely on higher-cost domestic talent for equivalent engineering and support functions across most product lines, service categories, and organizational structures. This cost advantage increasingly funds more aggressive product investment and pricing flexibility during competitive procurement negotiations with price-sensitive buyers. Providers without comparable global delivery scale risk losing price-sensitive mid-market accounts to better-positioned rivals.

Engagement Snapshot From the Field

A live engagement with an industry participant carrying material or product regulatory and market exposure ahead of a defining policy shift, showing how our research translates into a defensible multi-year portfolio strategy.
MARKET MINDS ADVISORY · CLIENT ENGAGEMENT SUMMARY
Insights-As-A-Service Producer Strategic Portfolio Review and Transition Roadmap 2026·Investment Scenario on Insights-As-A-Service Exposure Evaluation 2025-26
CLIENT PROFILE
The client is a mid-sized consumer packaged goods brand manufacturing household products distributed across major retail chains in the United States and Canada and several neighboring markets. The company reported (client-reported, unverified by MMA) annual marketing research budget of approximately $9 million and had historically relied on quarterly syndicated reports delivered as static presentation documents.
STRATEGIC CHALLENGE
The brand faced repeated instances of reacting too slowly to shifting consumer preferences, since its quarterly syndicated reports arrived weeks after purchase pattern shifts had already occurred, limiting the value of resulting strategic recommendations. Leadership needed an independent assessment of real-time analytics vendors before committing capital ahead of the next annual research budget planning cycle.
MMA APPROACH
MMA conducted a comparative assessment of insights-as-a-service vendors' real-time delivery and methodology transparency capability, benchmarking against primary survey data covering similar consumer packaged goods brand deployments across comparable retail distribution environments. The engagement combined expert interviews with the client's marketing insights leadership alongside MMA's competitive landscape data to identify the vendor best suited to the brand's specific category and distribution footprint.
KEY FINDINGS
  1. Quarterly reporting cycles caused the client to miss meaningful demand shifts during at least three major seasonal selling periods each year (client-reported, unverified by MMA).
  2. Comparable consumer packaged goods brands had already migrated to real-time analytics platforms roughly eighteen full months earlier on average across the broader industry.
  3. The client's internal analyst team spent an estimated 30% of working hours manually reformatting quarterly report data for internal distribution and review.
  4. Real-time platforms offering methodology documentation demonstrated meaningfully higher internal stakeholder trust scores than the client's existing static report provider overall today across departments.
CLIENT PROFILE
The client is a mid-sized consumer packaged goods brand manufacturing household products distributed across major retail chains in the United States and Canada and several neighboring markets. The company reported (client-reported, unverified by MMA) annual marketing research budget of approximately $9 million and had historically relied on quarterly syndicated reports delivered as static presentation documents.
STRATEGIC CHALLENGE
The brand faced repeated instances of reacting too slowly to shifting consumer preferences, since its quarterly syndicated reports arrived weeks after purchase pattern shifts had already occurred, limiting the value of resulting strategic recommendations. Leadership needed an independent assessment of real-time analytics vendors before committing capital ahead of the next annual research budget planning cycle.
MMA APPROACH
MMA conducted a comparative assessment of insights-as-a-service vendors' real-time delivery and methodology transparency capability, benchmarking against primary survey data covering similar consumer packaged goods brand deployments across comparable retail distribution environments. The engagement combined expert interviews with the client's marketing insights leadership alongside MMA's competitive landscape data to identify the vendor best suited to the brand's specific category and distribution footprint.
KEY FINDINGS
  1. Quarterly reporting cycles caused the client to miss meaningful demand shifts during at least three major seasonal selling periods each year (client-reported, unverified by MMA).
  2. Comparable consumer packaged goods brands had already migrated to real-time analytics platforms roughly eighteen full months earlier on average across the broader industry.
  3. The client's internal analyst team spent an estimated 30% of working hours manually reformatting quarterly report data for internal distribution and review.
  4. Real-time platforms offering methodology documentation demonstrated meaningfully higher internal stakeholder trust scores than the client's existing static report provider overall today across departments.
RECOMMENDED STRATEGY
Phase 1: Phase one: migrate to a real-time analytics platform with documented methodology within a six-month transition window overall each fiscal quarter. Phase 2: Phase two: integrate the platform's embedded API delivery directly into internal business intelligence dashboards used company-wide every single business day. Phase 3: Phase three: establish quarterly methodology review meetings with the vendor to maintain data quality and stakeholder trust continuously over time.
OUTCOME
Within one year of platform migration, the client reported (client-reported, unverified by MMA) meaningfully faster response times to emerging demand shifts and reduced internal analyst time spent on manual report reformatting overall. Internal stakeholder confidence in the data improved considerably following the methodology transparency rollout.

Frequently Asked Questions

Foundational context covering the market sizes, CAGR, scope, country, region and competition that inform every finding below. This section is provided to cover basics and most often pre-purchase conversations, answered from the MMA Primary Research Dataset.

What is the current size of the Insights-As-A-Service Market?

The Insights-As-A-Service Market is valued at $8.4 billion in 2025. This reflects global spend on subscription platforms delivering continuous consumer and market behavioral analytics data.

How large will the Insights-As-A-Service Market be by 2036?

The market is projected to reach $26.46 billion by 2036. Growth is anchored primarily by real-time analytics adoption and continuous data delivery demand worldwide today.

What is the CAGR for the Insights-As-A-Service Market 2026 to 2036?

The market is forecast to grow at a 11.0% compound annual growth rate between 2026 and 2036. This reflects accelerating enterprise adoption of continuous insight delivery models.

Which segment is growing fastest?

Real-Time Consumer Behavior Analytics Platforms is the fastest-growing segment at a 16.5% CAGR, roughly 1.5x the overall market rate. Continuous purchase pattern visibility is driving this rapid expansion.

Who are the major companies in the Insights-As-A-Service Market?

Leading companies include Nielsen, Kantar, GfK, Qualtrics, and Circana. These five firms compete on real-time delivery, methodology transparency, and API integration depth today across industries.

Which country is growing fastest?

India is the fastest-growing country at a 15.0% CAGR. Its expanding digital economy generates rich consumer behavior data that brands increasingly subscribe to access nationwide.

Report Segmentation Architecture

The full report scope spans multiple orthogonal segmentation dimensions, with cross-tabulated demand data provided for each dimension pair. Coverage extends further to regional breakdowns, trend trajectories, and the competitive detail needed to support segment-level decision-making.

By Primary Market Dimension

  • Real-Time Consumer Behavior Analytics Platforms
  • Embedded Analytics-As-A-Service APIs
  • Predictive Market Intelligence Subscriptions
  • Social Media and Sentiment Analytics Services
  • Syndicated Research Data Subscriptions
  • Custom Analytics Consulting-As-A-Service

By End-Use Industry

  • Consumer Packaged Goods
  • Retail and E-Commerce
  • Financial Services
  • Technology and Media
  • Healthcare and Pharmaceuticals

By Commercial Dimension

  • Enterprise Direct Contracts
  • Self-Service Subscription
  • Managed Service Provider Channel
  • API Marketplace Distribution

By Region

  • North America
  • Western Europe
  • East Asia
  • South Asia and Pacific
  • Latin America
  • Middle East and Africa
  • Eastern Europe

Scope, Methodology, and Coverage

Every figure in this report is reproducible from documented input assumptions. The scope below maps the historical period, the forecast horizon, the segmentation dimensions, and the countries covered, alongside the underlying primary and qualitative methodology.
Historical Period
2020 to 2025
Forecast Period
2026 to 2036
Base Year
2025 (USD billions; MMA Primary Research Dataset, September 2026)
Market Definition
The Insights-As-A-Service Market covers subscription-based platforms and application programming interfaces that deliver continuous consumer, market, and behavioral data analytics to enterprise buyers, including real-time dashboards, predictive intelligence, and embedded analytics feeds. It excludes traditional one-time market research reports and standalone business intelligence software sold as separate product categories.
Quantitative Units
Value in USD Billion, Subscriber Count in Thousand Accounts
Segmentation Dimensions
By Delivery Model, By End-Use Industry, By Commercial Dimension, By Region
Regions Covered
North America, Western Europe, East Asia, South Asia and Pacific, Latin America, Middle East and Africa, Eastern Europe
Countries Covered
United States, Canada, United Kingdom, Germany, France, Japan, South Korea, China, India, Indonesia, Vietnam, Australia, Brazil, Mexico, Saudi Arabia, United Arab Emirates, South Africa, Poland
Key Companies Profiled
Nielsen, Kantar, GfK, Qualtrics, Circana, Ipsos, YouGov, Morning Consult, Numerator, Brandwatch, Sprinklr, Talkwalker, Similarweb, Semrush, Attest, Dynata, Cint, Suzy, Zappi, Toluna
Quantitative Methodology
Primary survey, n=3,800 respondents, Q4 2025, six countries; demand-side model with trade association cross-validation
Qualitative Methodology
47 expert interviews, Q4 2025; applied to validate demand model assumptions, identify emerging dynamics, and assess competitive positioning
Report Format
PDF and XLSX data workbook (Word format preview document)
Publisher
Market Minds Advisory
Report Code
MMA-2026-TEC-928
Published
September 2026
Contact
sales@marketmindsadvisory.com | www.marketmindsadvisory.com

Purchase the full Insights-As-A-Service Market Report (2026 to 2036).

This report provides a comprehensive assessment of the global Insights-As-A-Service Market, covering market sizing, segmentation, and regional dynamics through 2036. It examines competitive positioning among leading data providers, the shift toward real-time delivery models, and revenue opportunities within methodology transparency and embedded API distribution channels. The analysis draws on primary survey data, expert interviews, and company disclosures to quantify demand shifts across enterprise, self-service, and API-native channels. Readers gain a data-grounded view of where platform investment and vendor selection decisions carry the greatest commercial return.
Ten-year market sizing and forecast model
Six-segment delivery model segmentation with growth rates
Seven-region demand and competitive share breakdown
Twenty-company competitive landscape and moat assessment
Panel recruitment cost and volatility risk analysis
Portfolio margin and revenue lever guidance

Built For The People Who Decide

From boardroom strategy to bench-side execution, this report is read cover-to-cover by leaders shaping the next decade of their industry, turning demand scenarios, market dynamics and valuation benchmarks into decisions.
CXOs/ Presidents/ VPs/ Managers
M&A and Corporate Development
Strategy Teams and R&D Heads
Procurement and Product Directors
Regulatory and Compliance Leaders
Investor Relations and Equity Analysts