Market Minds Advisory
Inlay Paper Market

Inlay Paper Market: Plastic substitution, barrier conflict and tooling economics to 2036

Replacing a plastic tray with a formed paper one costs a tool, a redesign and three times the freight volume, which is why the conversion everybody announces keeps taking longer than anybody planned.

Lead Analyst

Bilal Shaikh

Published

September 2026

Make Smarter Decisions with Customized Research Insights

Request a free sample report and evaluate market opportunities, growth trends, and competitive dynamics relevant to your business needs.

2025 MARKET VALUE$5.6BMarket Size 2025
2036 FORECAST VALUE$10.2BBase Case , 2026 to 2036
CAGR 2026 TO 20365.6 %Bull 6.9% / Bear 4.4%
INCREMENTAL OPPORTUNITY$4.3BNet 10- year value creation
EXPANSION MULTIPLE1.72x2036 value over 2026 base
Strategic Levers
M&A Pipeline
Regional Outlook
Country Rankings
Competitive Intelligence
Segmental Deep-dive
Call-Us : 91 93563 13602

Executive Snapshot and Market Trajectory

The packaging inside the packaging is being converted from plastic to fibre and almost nobody outside the industry has noticed. Around 31% of internal packaging components have already moved, driven by European packaging regulation and brand owner commitments rather than by any cost advantage the fibre version holds.
Formed paperboard inlays grow at 8.4%, half again the market rate of 5.6%, because a pressed board tray replaces a thermoformed plastic one directly and recycles in the standard paper stream. East Asia holds 29% of value on consumer goods packaging volume and converter capacity together. Flat board inlay cards, still the largest single category, grow at under 4%. The conversion is real and it is slower than the announcements suggest.
Five converters hold 27% of supply, which is the most fragmented packaging category in this series and reflects a product that ships badly and therefore gets made close to the customer. What decides position is tooling: a formed inlay needs a tool that only amortises above roughly 240,000 units, which locks a converter into a programme and locks everybody else out of it for the product's commercial life. That threshold governs the entire competitive structure.
Market Definition
This report covers paper and paperboard supplied as internal packaging components, spanning flat inlay cards, formed paperboard inlays, corrugated inserts and dividers, barrier-coated inlays, laminated and metallised inlay papers, and moulded pulp protective inlays. Value is measured at converter level. Excluded are outer cartons and cases, labels and printed wraps, flexible film packaging, plastic thermoformed trays, and the base paper sold unconverted to converters.
Base Year Value
$5.6B in 2025 (MMA Primary Research Dataset, August 2026)
Forecast Period
2026 to 2036, eleven discrete annual values
CAGR
5.6% base case. Bull 6.9%. Bear 4.4%.
Fastest Growth Segment
Formed Paperboard Inlays: 8.4% CAGR
Fastest Growth Country
India: 8.3% CAGR
Fastest Growth Region
South Asia and Pacific: 7.8% CAGR
Largest Region
East Asia: 29% of 2025 global value
Market Leaders
Smurfit Westrock, Mondi, International Paper, Huhtamaki and Stora Enso lead the market. Source: MMA Primary Research Dataset, July 2026.
Primary Survey
n=3,800 procurement and R&D decision-makers, Q4 2025, six countries
Methodology
Demand-side build-up, cross-validated against public data, 47 expert interviews

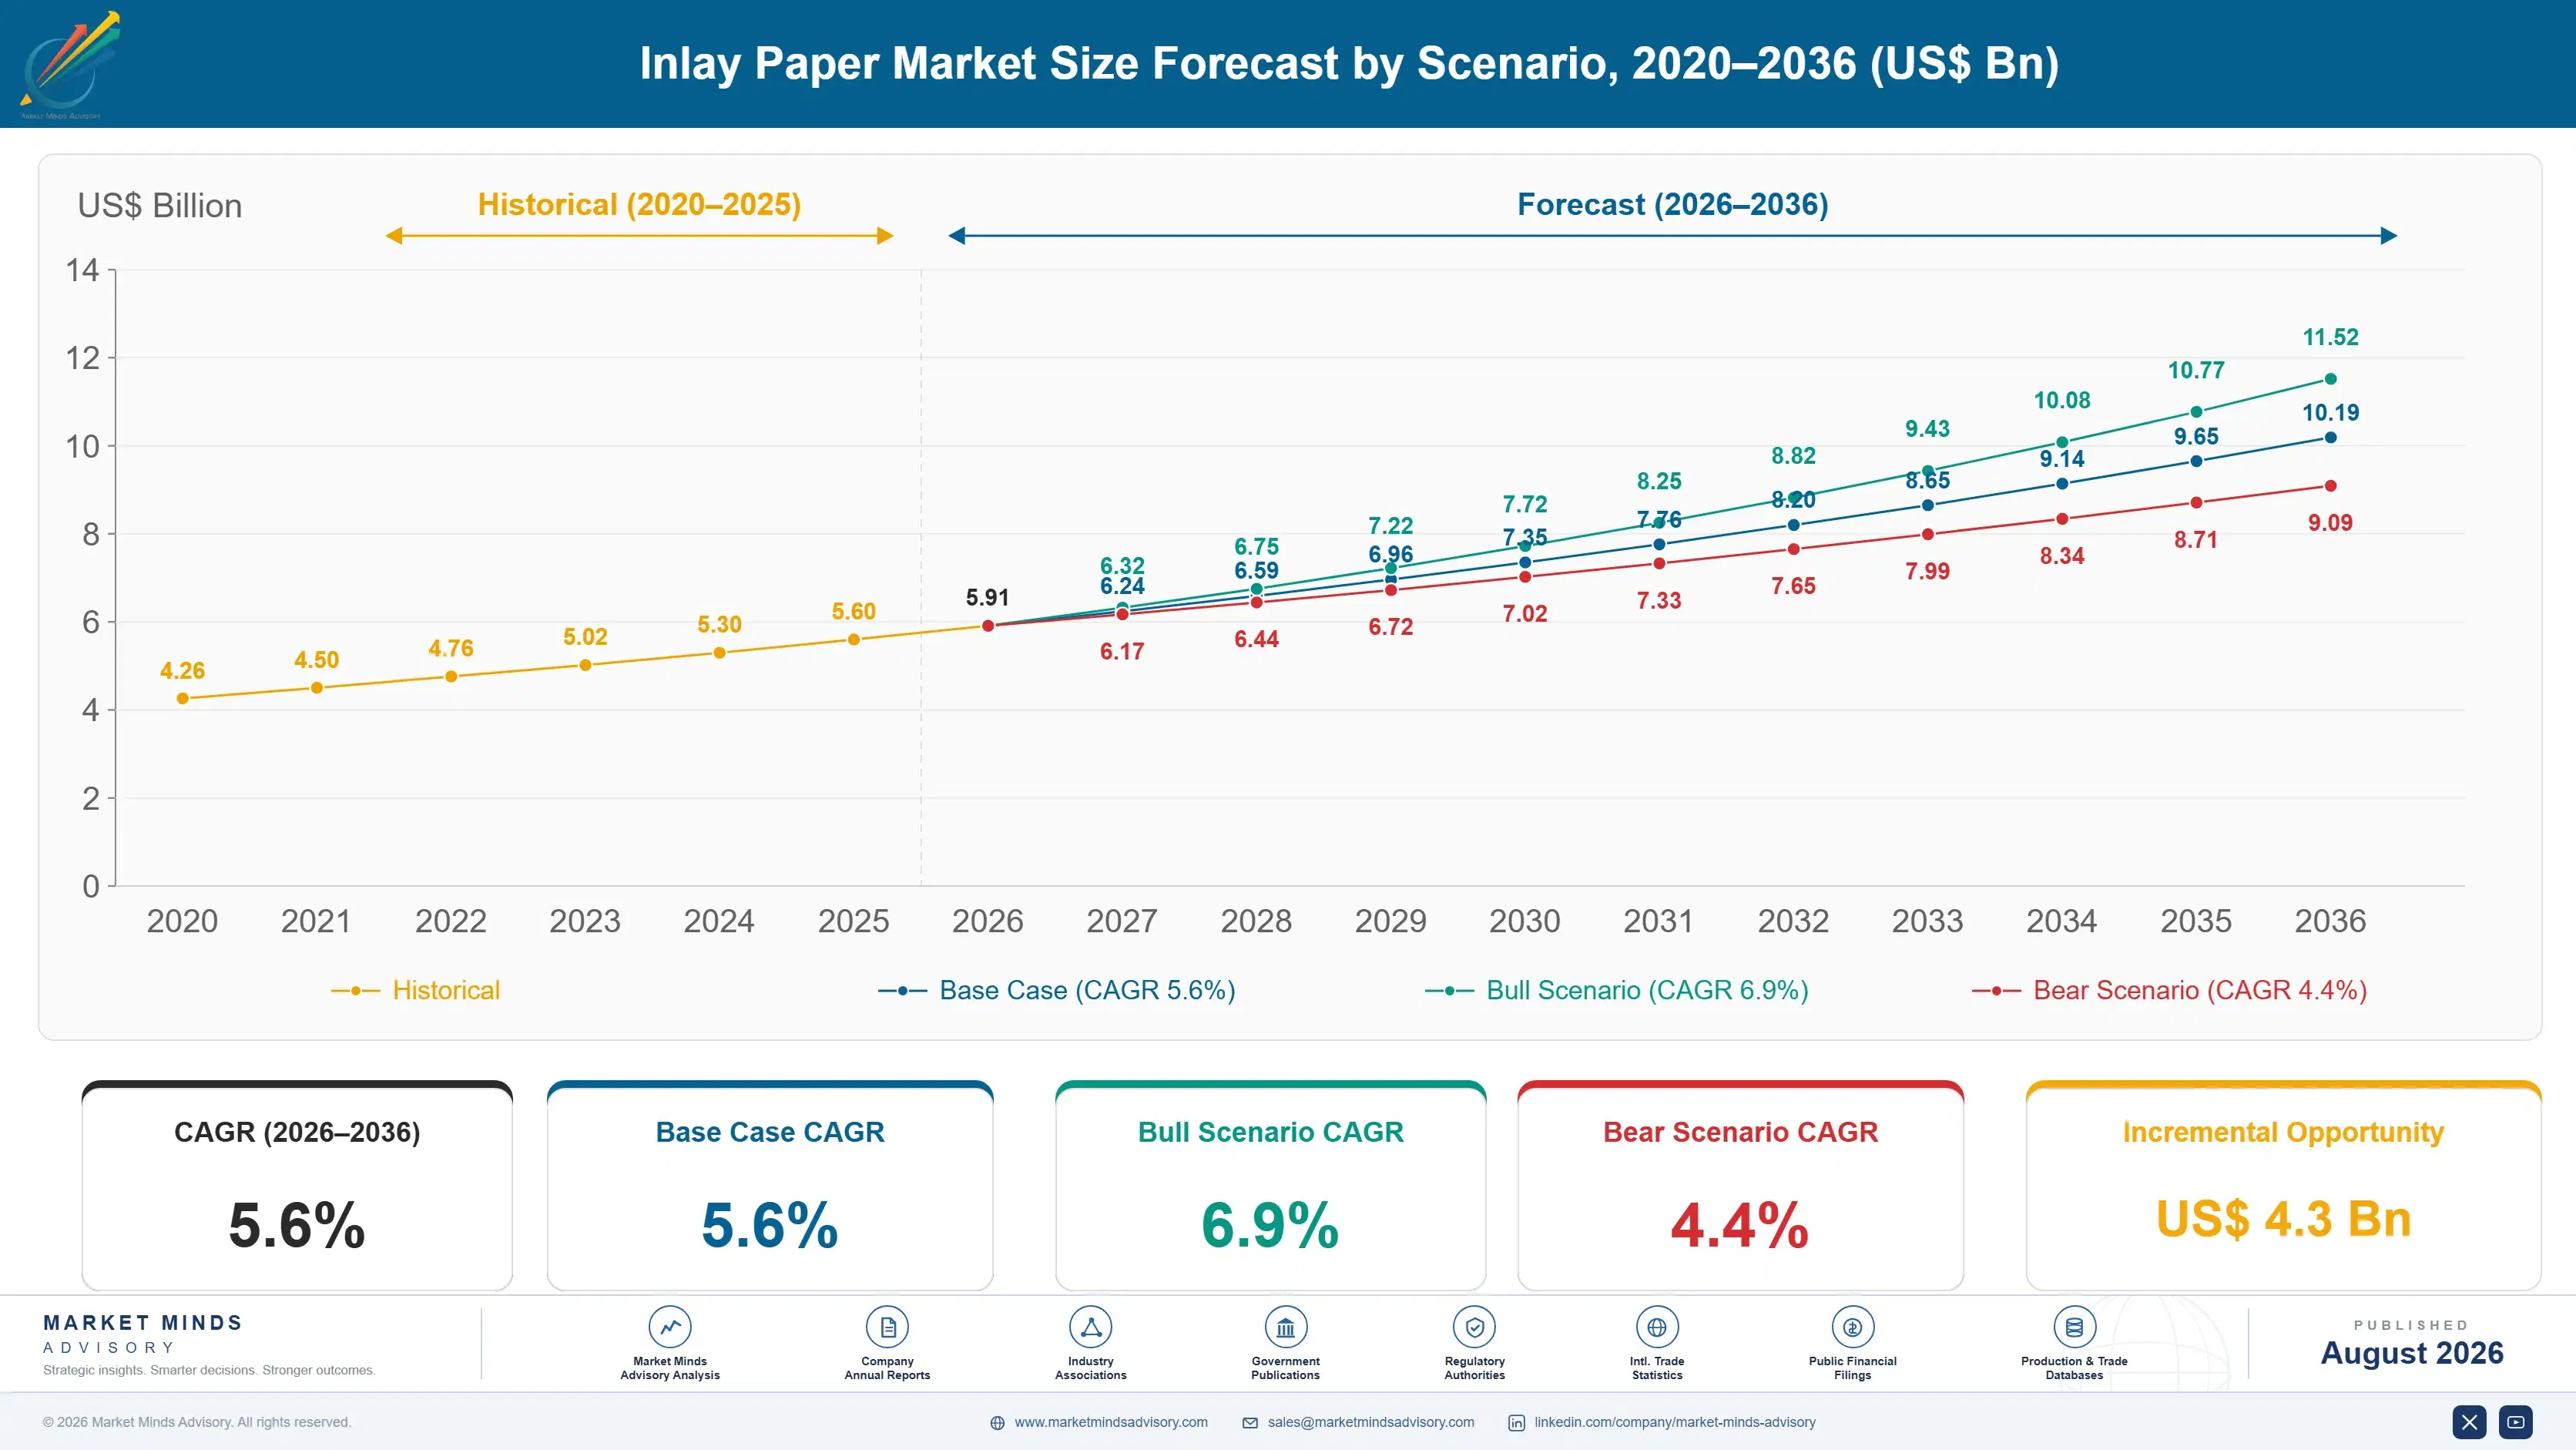
Inlay Paper Market Forecast Scenarios

inlay-paper-market-size-forecast-scenario-1787553431098
Growth ran at 4.2% between 2020 and 2025 and the composition changed more than the total did. Electronics and cosmetics packaging converted to fibre inlays fastest, driven by brand commitments announced before anybody had costed the tooling. Tobacco inlay card volume declined with cigarette consumption. Electronic commerce protective inserts grew from almost nothing as retailers removed plastic void fill from their own operations.
The 5.6% base case rests on three mechanisms. European packaging regulation keeps pushing recyclability requirements onto internal components that previously escaped attention entirely, which converts plastic volume into fibre at 8.4% in formed inlays. Consumer electronics and cosmetics brands keep announcing plastic reduction commitments that internal packaging is the easiest place to deliver. And electronic commerce volumes keep growing, and every parcel needs protection that used to be plastic and increasingly is not.
The 6.9% bull case is barrier coating technology reaching a point where food contact inlays recycle in standard paper streams, which would open a category currently closed on recyclability grounds. The 4.4% bear case is freight: a formed inlay ships at roughly three times the volume of flat board, and if transport costs rise sharply the conversion economics stop working outside a short radius.

The Packaging Nobody Looks At

Internal packaging escaped regulatory attention for decades because nobody outside the industry thinks about it. That has changed. European packaging rules now reach every component of a pack rather than only the outer carton, and a plastic tray inside a paperboard box makes the whole thing harder to recycle. Around 31% of internal components have converted to fibre already and brand owners keep announcing more, generally before anybody has costed what conversion actually requires.
TOP-FIVE CONCENTRATION27%Combined position across converted inlay supply held by leaders
PLASTIC SUBSTITUTION RATE31%Portion of internal packaging converted from plastic to fibre
BARRIER COATING COST SHARE22%Portion of coated inlay cost attributable to the barrier layer
RECYCLABILITY THRESHOLD5%Maximum non-fibre content permitted in standard paper recycling streams
TOOLING AMORTISATION VOLUME240,000 unitsOrder quantity needed to justify a formed inlay tool
FREIGHT DENSITY PENALTY3.1 timesVolume shipped per tonne against flat board of equivalent weight
What it requires is a tool. A formed paperboard inlay needs pressing tooling that only amortises above roughly 240,000 units, which means the conversion works for a running product line and fails for a seasonal one. That single number decides more about this market than any material property does. It also locks incumbency hard: whoever cut the tool holds the programme, because nobody funds a second tool to save a few percent on unit price.
Freight is the other constraint. A formed inlay ships at around 3.1 times the volume of flat board of equivalent weight, which caps the economic delivery radius and explains why this industry is more fragmented than any other packaging category.
"Brand owners announce plastic reduction targets and then discover that the internal packaging conversion needs a tool per stock keeping unit and a redesign of the filling line. The converters who quietly built tooling capacity are collecting on announcements somebody else made."
Director, Packaging Systems and Fibre Conversion Practice · MMA Packaging Practice · August 2026

Market Trends

Packaging regulation reaches components nobody previously examined

European packaging and packaging waste rules apply recyclability requirements to every component of a pack rather than to the outer carton alone, which brings trays, separators, inserts and protective inlays into scope for the first time. A plastic tray inside a paperboard box compromises the whole unit at the recycling stage. Around 31% of internal components have already converted and the timetable keeps tightening. The commercially important detail is that this converts a purchasing decision nobody thought about into a compliance requirement with a date attached, which removes the price argument and rewards whoever has tooling and capacity available.
Market Impact: Delivers 31% conversion already

Formed paperboard displaces thermoformed plastic trays directly

A pressed paperboard tray does what a thermoformed plastic one does, holds the product in the same way, and disappears into the standard paper recycling stream rather than needing separation. Consumer electronics and cosmetics converted fastest because the products are light and the presentation matters. Growth at 8.4% follows those conversions rather than any packaging volume expansion. The barrier is tooling rather than material: a formed inlay needs pressing tools that amortise above roughly 240,000 units, which works for a running product line and fails completely for anything seasonal or short-run.
Market Impact: Grows with 12% parcel volume

Market Opportunities and Growth Drivers

Brand plastic reduction commitments reach internal packaging first

A brand owner announcing plastic reduction has to find the tonnage somewhere, and internal packaging is the easiest place because the consumer barely sees it and no marketing argument gets reopened. Removing a plastic tray from a cosmetics carton delivers a measurable reduction with no brand risk whatsoever. That is why internal components convert ahead of primary packaging almost everywhere. Around 31% have moved already. The awkward part for brand owners is that the announcement happens in a sustainability report and the tooling investment happens eighteen months later in a packaging department that was not consulted.
Market Impact: Caps non-fibre content at 5%

Electronic commerce volumes create protective inlay demand continuously

Every parcel shipped needs the product held still inside it, and the plastic air pillows and foam that used to do that job are being removed from retailer operations on sustainability grounds rather than on cost. Moulded pulp and formed paperboard inserts replace them directly. Parcel volumes keep growing across every market and each one consumes protective material, which makes this the only genuinely volume-driven demand in the category. Retailers with their own packaging operations specify centrally, which concentrates the purchasing decision and makes each award considerably larger than the fragmented market suggests.
Market Impact: Requires 240,000 unit runs

Market Restraints and Challenges

Barrier coating conflicts directly with recyclability requirements

A paper inlay touching food or oily product needs a barrier, and the coating that provides it is exactly what makes the component fail the recycling test. The root conflict is physical rather than regulatory: standard paper recycling tolerates roughly 5% non-fibre content and effective barriers historically needed more than that. Commercially this closes food contact applications that would otherwise convert readily. Dispersion coatings and thin extrusion layers have brought several products under the threshold, and the work continues, but the trade between barrier performance and recyclability has not been solved cleanly for anything greasy.
Market Impact: Covers 27 member state markets

Tooling economics exclude short runs and seasonal products

A formed paperboard inlay needs pressing tooling that costs real money and only amortises above roughly 240,000 units, which rules out seasonal packaging, limited editions and any product line below that volume. The root cause is that forming fibre requires a matched tool in a way that cutting flat board does not. Commercially this splits the market into converted programmes and unconverted ones with very little in between. Converters have responded by developing modular tooling systems that share components across similar geometries, and by offering tooling on amortised supply agreements rather than upfront.
Market Impact: Segment growing at 8.4% annually
3 additional market trends, 4 additional growth drivers, and 2 additional restraints and challenges are covered in the full report. Contact sales@marketmindsadvisory.com to access the complete intelligence.

Segment CAGR and Growth Architecture

Inlays are classified here by construction method, because forming, corrugating, coating and moulding each demand different capital, different tooling and different minimum volumes. End-use industry, product geometry and sales channel are handled separately in the framework, since one construction method serves electronics, cosmetics and food customers with the same equipment behind it. Method decides everything downstream.
inlay-paper-market-market-share-analysis-1787553431649

Formed Paperboard Inlays

Growing at 8.4%, half again the market rate, this is where plastic tray substitution actually happens. Pressing paperboard into a formed shape produces something that holds a product exactly as a thermoformed plastic tray does and recycles in the standard paper stream without separation, which is the whole commercial argument. Consumer electronics and cosmetics converted first because the products are light and presentation matters commercially. The constraint is tooling: pressing tools amortise above roughly 240,000 units, which suits a running product line and excludes anything seasonal. That threshold also locks incumbency hard, since nobody funds a second tool to shave a few percent off unit price. Nobody funds a tool twice for the same pack.
CAGR 8.4%

Barrier-Coated Paper Inlays

This segment sits directly on the conflict between what a food application needs and what a recycling stream accepts. A paper inlay touching anything greasy or moist requires a barrier, and the coating providing it is precisely what pushes non-fibre content past the roughly 5% that standard paper recycling tolerates. Growth at 7.6% comes from dispersion coatings and very thin extrusion layers that have brought several products under the threshold, which opens applications that were closed. Coating adds around 22% to inlay cost, so the conversion only works where regulation or brand commitment overrides the price comparison. Nobody has solved the greasy food case cleanly yet. That case is where the remaining opportunity sits.
CAGR 7.6%
Full segment breakdown across 6 segments available in the complete report.

Regional Architecture and Country Demand Map

East Asia holds 29% of value on consumer goods packaging volume and converter capacity arriving in the same place. Western Europe follows at 24% because the regulation driving conversion originates there. Where products are packed explains most of this map rather than where they are sold.

North America

Electronic commerce is what drives this region and the scale of it has no parallel, since parcel volumes here consume protective inlay material at rates that no European or Asian market approaches. Retailers with their own packaging operations specify centrally and remove plastic void fill on sustainability grounds rather than under any regulation, which makes brand commitment rather than legislation the mechanism here. Consumer electronics packaging converted early and cosmetics followed. State-level packaging legislation is beginning to arrive and creates a patchwork rather than a single requirement. Growth at 5.2% mixes genuine parcel volume expansion with conversion driven entirely by corporate policy decisions. Regulation may eventually arrive and has not decided anything yet.
Share: 23% | CAGR: 5.2% (2026 to 2036)

Western Europe

The regulation reshaping this market originates here and applies recyclability requirements to every pack component rather than to the outer carton alone, which is what brought internal packaging into scope. German, Nordic and Benelux converters built forming capacity earliest and export that capability across the region. Consumer goods brands headquartered here set global packaging specifications, so a conversion decided in Amsterdam or Paris propagates worldwide. Growth at 4.0% is the weakest of the seven regions and reflects a market already substantially converted rather than one standing still. The technical leadership on barrier coating within recycling limits sits here and is genuinely difficult to replicate. Specification decided here propagates across every other region eventually.
Share: 24% | CAGR: 4.0% (2026 to 2036)
Regional intelligence for 5 additional markets available in the complete report: East Asia, South Asia and Pacific, Latin America, Middle East and Africa, Eastern Europe. Contact sales@marketmindsadvisory.com.
inlay-paper-market-country-cagr-analysis-1787553432167

Where Inlay Margin Actually Sits

Four moves matter in a business where a tool decides who holds a programme and freight decides who can bid for it at all. Two are about the tooling threshold and two are about the barrier problem that keeps food applications closed. Competing on board price is not among them and never really was.

Fund the tooling and recover it through supply

A formed inlay tool amortises above roughly 240,000 units and brand owners announcing plastic reduction commitments frequently have not budgeted for it, which stalls conversions that everybody wants. A converter funding the tool and recovering it through an amortised supply agreement removes the obstacle and locks the programme for its commercial life, because nobody funds a second tool to save a few percent. The capital involved is modest against the volume it secures. Converters treating tooling as a customer cost rather than a commercial instrument are losing programmes they could have taken outright.
Market Impact: Secures programmes running above 240,000 annual unit volumes

Solve the barrier problem inside the recycling threshold

Standard paper recycling tolerates roughly 5% non-fibre content and food contact inlays need a barrier that has historically needed more, which keeps a large category closed to fibre conversion entirely. Dispersion coatings and thin extrusion layers have brought some products under the threshold and nothing works cleanly for greasy food yet. A converter that solves that opens applications nobody can currently serve at any price. Coating already adds around 22% to inlay cost, so the pricing headroom exists. The development work is real and the position it creates would hold for years.
Market Impact: Opens applications currently blocked by a 5% limit

Build capacity inside the freight radius, not outside it

A formed inlay ships at around 3.1 times the volume of flat board of equivalent weight, which caps the economic delivery radius tightly and explains why this category is the most fragmented in packaging. Growth therefore requires converting capacity near customers rather than winning customers near capacity. Acquiring or building close to a consumer goods cluster is worth more than any efficiency inside an existing plant. Converters bidding on distant programmes are quoting freight they cannot win on, and generally discover that only after losing several tenders in a row.
Market Impact: Respects a 3.1 times freight density penalty properly

Sell to the sustainability function, not procurement

Around 31% of internal packaging has converted to fibre and almost none of it happened because fibre was cheaper, since it generally is not once tooling and freight are counted. The decision sits with a sustainability or brand function delivering a public commitment rather than with a buyer comparing unit prices. Presenting a conversion as tonnage removed from a sustainability report reaches that budget. Presenting it as a packaging quotation loses to the incumbent plastic every time, which is why so many converters report enthusiasm from customers and no actual orders.
Market Impact: Reaches the full 31% of volume already converting

Who Controls the Margin Pool

Five converters hold 27% of inlay supply, measured on converted inlay revenue at converter level, the basis used throughout this section. That is the most fragmented category in packaging and it follows from freight: a formed inlay ships at 3.1 times the volume of flat board, which caps the delivery radius. The gap between leaders and everybody else is forming capability and tooling capital.
Competition runs on three dimensions and board price is barely one of them. Forming and tooling capability, which decides who can bid on a conversion at all. Barrier coating expertise within recycling limits, which decides who can serve food applications. And plant proximity, since freight caps how far a formed inlay travels economically. Price competes hardest in flat board inlay cards, which anybody with a die cutter can make.

Rankings shift where brand owners consolidate packaging supply across regions, which favours converters with plants in several markets and disadvantages the regional specialists who dominate the volume today. Chinese converters hold cost positions Western ones cannot match. Formed and barrier-coated positions hold longest, because tooling and coating capability both take capital and time to assemble.
inlay-paper-market-company-positioning-matrix-1787553432686

Competitive Moat and Risk Dimensions

SMURFIT WESTROCK

Moat: Plant footprint density

The combined plant network puts converting capacity close to consumer goods clusters across several continents, which matters more here than in most packaging because a formed inlay cannot travel far economically. A brand owner consolidating packaging supply across regions can source identical construction locally in each, and rebuilding equivalent density would require acquisitions rather than construction.
SMURFIT WESTROCK

Risk: Corrugated business dominates

Most of the revenue sits in corrugated cases and containerboard, businesses with their own cycles and enormous capital demands that compete internally against forming tooling investment. Specialist converters focused entirely on internal packaging can commit tooling capital that a containerboard business would never prioritise for a category this size.
HUHTAMAKI

Moat: Moulded fibre process depth

Huhtamaki built moulded fibre capability across food service and packaging applications over decades, and that process knowledge transfers directly into protective inlay manufacture where competitors are learning it now. Moulded fibre punishes inexperience through tooling design and drying control, neither of which any specification captures adequately. Customers who tried alternatives generally came back.
HUHTAMAKI

Risk: Food service exposure concentration

A large part of the business serves food service packaging, a market facing its own regulatory pressure and its own volume questions as single-use rules tighten across several regions. Internal packaging inlays compete internally for capital against a larger business managing its own transition, which slows decisions competitors can take quickly.

Players Tracked

Prominent Players

Smurfit Westrock
Mondi
International Paper
Huhtamaki
Stora Enso

Other Key Players

Sappi
Metsä Board
Billerud
Sonoco
Graphic Packaging
Amcor
Nissha
Nippon Paper Industries
Oji Holdings
Klabin
ITC Limited
Pactiv Evergreen
Brødrene Hartmann
CKF Inc
Hanhe Paper

Recent Developments

MARCH 2025

Huhtamaki expanded moulded fibre capacity for protective packaging in Europe

Huhtamaki commissioned additional moulded fibre production capacity at a European site aimed at protective inlay applications replacing plastic void fill. The investment was organic and funded internally, with no partner or acquisition involved, and it followed retailer commitments to remove plastic protection from parcel operations.
Signal: Capacity is being built against retailer sustainability commitments rather than against any regulation, which is a different planning basis
AUGUST 2025

Mondi signed a multi-year inlay conversion agreement with a European cosmetics brand

Mondi entered a multi-year supply agreement covering formed paperboard inlays across a European cosmetics brand's product range, including tooling funded by the converter and recovered through unit pricing. The arrangement was a supply agreement rather than a joint venture, with no equity participation involved. Tooling recovery was the whole point.
Signal: Converters funding tooling and recovering it through supply is how conversions actually get unblocked rather than merely announced
DECEMBER 2025

Stora Enso extended barrier coating capability within paper recycling limits

Stora Enso brought additional dispersion coating capacity into service for barrier-coated inlay grades designed to remain inside standard paper recycling thresholds. This was an organic capacity expansion funded internally rather than an acquisition, and it targets food contact applications currently closed to fibre conversion. Food contact is the closed category.
Signal: Barrier capability inside recycling limits is where the closed applications sit, and very few converters are investing against it

What Moves Inlay Cost

Paperboard accounts for around 46% of converted inlay cost, with converting labour, tooling amortisation, coating where applied and freight making up the balance. Board comes from Nordic and Asian mills on annual contracts. Barrier coating chemistry adds roughly 22% where it is used and comes from a small number of specialty producers. Freight is unusually large for a packaging component because formed inlays ship mostly air.
European board prices moved sharply through 2022 as energy costs raised mill economics, and IEA data show European industrial gas well above American levels then. Stora Enso recorded energy and raw material cost pressure across its packaging operations in its Annual Report 2022. Converters on annual brand owner agreements absorbed most of it, because a packaging contract is priced for a year and a brand owner does not reopen it for a board price movement.

The tooling lock is what makes this exposure asymmetric. A converter holding a formed inlay programme cannot walk away from it, since the tool is sunk and the customer has nowhere else to go either. Flat board converters reprice or lose the business freely. Converters with integrated board supply carry smaller exposure than those buying on the merchant market.
inlay-paper-market-cost-volatility-analysis-1787553432880

Index brand owner agreements to published board benchmarks

Annual fixed pricing on a product where board is 46% of cost transfers mill volatility to the converter across a period nobody forecasts. Indexing to published containerboard and cartonboard benchmarks with quarterly reset removes the argument, and brand owners accept it because they face the same exposure elsewhere. Resistance comes from procurement rather than packaging engineering.

Design tooling to share components across product geometries

A formed inlay tool amortises above roughly 240,000 units and every distinct geometry needs its own, which excludes short runs and seasonal products entirely. Modular tooling that shares base components across similar shapes lowers the effective threshold and opens volume nobody can currently serve. The engineering work is real and it converts a fixed constraint into a variable one.

Site forming capacity inside consumer goods clusters

A formed inlay ships at 3.1 times the volume of flat board, which caps the delivery radius and makes plant location the single largest determinant of who can bid. Building or acquiring near a packing cluster is worth more than any efficiency improvement inside an existing plant. Converters who treated location as logistics rather than commercial strategy chose badly.

Portfolio Architecture for Margin Defence

Margin in inlays tracks forming difficulty and tooling position rather than board volume. Flat inlay cards run at gross margins in the mid teens, since anybody with a die cutter can make one and brand owners treat them as interchangeable. Formed paperboard inlays run considerably higher, because the tool excludes competitors for the programme's life and the customer cannot switch without funding another one. Barrier-coated grades run higher again where the coating stays inside recycling limits, since very few converters can achieve that reliably.
The tension is that flat board volume fills the converting lines and formed programmes earn the returns, and the two need different capital and different customer conversations. A die cutting operation optimised for throughput handles forming tooling development badly. Converters running both from one structure have generally found the volume business consuming the engineering resource that tooling programmes needed, which is a resource problem rather than a strategic one.

High-value pools sit in formed programmes secured by converter-funded tooling, barrier grades inside recycling limits and plant positions near consumer goods clusters. None of the three is where the tonnage is. Converting capacity by itself defends nothing at all without a tool and a location behind it.

Volume / Commodity-Adjacent

Flat inlay cards, corrugated dividers and simple die-cut inserts sold on price against any converter inside the delivery radius. The seven-point range separates converters with integrated board supply from those buying on the merchant market at prevailing mill prices.
Gross Margin: 14%-21%

Premium / Certified

Formed paperboard inlays and moulded pulp protective inserts made against dedicated tooling for specific product geometries. The eight-point spread reflects whether the converter or the customer funded the tool, which changes the commercial position entirely.
Gross Margin: 25%-33%

Sustainability / Regulatory / Next-Generation

Barrier-coated inlays that remain inside paper recycling thresholds and conversion programmes sold against brand sustainability commitments. The fourteen-point range is wide because pricing reflects capability scarcity and commitment urgency rather than any board cost a buyer can benchmark.
Gross Margin: 32%-46%
inlay-paper-market-portfolio-architecture-1787553433374

High-value Sub-segments and Strategic Watch-out

Converter-Funded Tooling Programmes

A formed inlay tool amortises above 240,000 units and brand owners frequently have not budgeted for it, which stalls conversions everybody wants. Funding it and recovering through supply locks the programme for its life. Most converters still treat tooling as a customer cost. That is a mistake worth correcting.
Gross Margin: 28%-38%

Recyclable Barrier Grades

Standard recycling tolerates roughly 5% non-fibre content and greasy food applications need more, which keeps a large category closed to fibre entirely. Coating already adds 22% to cost so the pricing headroom exists. Whoever solves it opens applications nobody can serve. Nobody has solved the greasy case yet.
Gross Margin: 34%-46%

Flat Inlay Card Volume

The tonnage that fills die cutting lines, growing under 4% and treated as interchangeable by every buyer. Anybody inside the delivery radius can make it and most of them do. Manage it for utilisation rather than for margin. Nothing else defends the position. Margin will not return here.
Gross Margin: 14%-21%

Plant Location Near Clusters

Formed inlays ship at 3.1 times the volume of flat board, which caps the delivery radius and makes plant position the single largest commercial variable. Growth needs capacity near customers rather than customers near capacity. Very few converters plan that way deliberately. Location decides more than efficiency does.
Gross Margin: 22%-34%

How Inlay Demand Renews

Inlay demand is consumption revenue attached to a product line. A formed inlay tooled for a specific pack is consumed for as long as that pack is manufactured, with no repurchasing decision along the way, and the tool makes substitution expensive enough that nobody attempts it. The renewal moment is a pack redesign rather than a purchase order.
Stickiness varies enormously by construction. Tooled formed inlays are close to permanent for the product's life, since replacing the converter means funding another tool. Barrier-coated grades are sticky through capability, because few converters achieve the recycling threshold. Flat inlay cards change supplier on price at every tender, since any die cutter inside the radius can make them. Depth follows the same line: tooled customers consolidate onto one converter while flat board buyers spread across several.

The buyer has moved and most converters still call on the old one. Inlay specification once sat entirely with packaging engineers weighing cost and protection performance. It increasingly sits with sustainability functions delivering a public plastic reduction commitment, and with brand teams weighing consumer perception of the unboxing. Neither has ever compared a board specification.
inlay-paper-market-end-use-penetration-index-1787553433868

Where To Place The Bet

These are among the four positions where our research anticipates prominent divergence between winners and laggards over the coming forecast period. Each is grounded in the demand model, the regulatory perimeter, and the announced capacity pipeline.
01 / TOOLING CAPITAL DEPLOYMENT

Fund the tool and take the programme outright

A formed inlay tool amortises above roughly 240,000 units and brand owners announcing plastic reduction commitments have frequently not budgeted a single currency unit for it, which stalls conversions that both parties genuinely want to happen. A converter funding the tool and recovering it through an amortised supply agreement removes the obstacle and holds the programme for its whole commercial life, since nobody funds a second tool to save a few percent. Treating tooling as a customer cost rather than a commercial instrument loses programmes outright.
02 / RECYCLABLE BARRIER DEVELOPMENT

Solve greasy food inside the recycling threshold

Standard paper recycling tolerates roughly 5% non-fibre content and food contact inlays touching anything greasy have historically needed considerably more than that, which keeps a substantial category closed to fibre conversion entirely today. Dispersion coatings and thin extrusion layers have brought several products under the limit and nothing works cleanly for the greasy case yet. Coating already adds around 22% to inlay cost, so the pricing headroom to fund development plainly exists and the position it creates would hold for years.
03 / PLANT LOCATION STRATEGY

Put capacity near the packing, not the mill

A formed inlay ships at roughly 3.1 times the volume of flat board of equivalent weight, which caps the economic delivery radius tightly and explains why this is the most fragmented category in all of packaging. Growth therefore requires converting capacity near consumer goods clusters rather than winning customers near existing capacity, and acquiring close to a packing cluster is worth more than any plant efficiency. Converters bidding distant programmes are quoting freight costs they simply cannot ever win on.
04 / SUSTAINABILITY CHANNEL SELLING

Present tonnage removed, not a packaging quotation

Around 31% of internal packaging has converted to fibre and almost none of that happened because fibre was cheaper, since it generally is not once tooling and freight are properly counted into the comparison. The decision sits with a sustainability or brand function delivering a public commitment rather than with a buyer comparing unit prices across suppliers. Presenting a conversion as plastic tonnage removed from a published report reaches that budget, and presenting it as a quotation loses to incumbent plastic every time.

Engagement Snapshot From the Field

A live engagement with an industry participant carrying material or product regulatory and market exposure ahead of a defining policy shift, showing how our research translates into a defensible multi-year portfolio strategy.
MARKET MINDS ADVISORY · CLIENT ENGAGEMENT SUMMARY
Inlay Paper Producer Strategic Portfolio Review and Transition Roadmap 2026·Investment Scenario on Inlay Paper Exposure Evaluation 2025-26
CLIENT PROFILE
A global consumer electronics brand with annual revenue around USD 8.4 billion (client-reported, unverified by MMA), shipping across North America, Europe and Asia. A public commitment to remove plastic from packaging had been announced two years earlier with a deadline approaching. Internal trays and separators remained plastic across most of the range. No tooling budget had been allocated anywhere.
STRATEGIC CHALLENGE
Packaging teams had costed fibre conversion across the range at roughly USD 31 million in tooling alone (client-reported, unverified by MMA), which nobody had provisioned for and which the sustainability commitment had not anticipated. Converters quoted unit prices above the incumbent plastic. The board wanted to know whether the commitment could be met without reopening it publicly.
MMA APPROACH
MMA sized conversion cost by product line against actual unit volumes rather than across the range uniformly, separating lines above the tooling threshold from those below it. Converter tooling funding practice was benchmarked through the expert interview programme across European and Asian suppliers. Freight implications of formed inlays were modelled against the client's existing distribution network and packing locations.
KEY FINDINGS
  1. Only eleven product lines exceeded the volume threshold where dedicated tooling amortises, and those eleven carried roughly 70% of the plastic tonnage the commitment covered.
  2. Three converters were willing to fund tooling and recover it through unit pricing, which removed the capital obstacle entirely and nobody internally had asked them.
  3. Formed inlays would raise outbound freight volume noticeably on two product lines packed a long way from the converting capacity available in that region.
  4. The remaining lines below the threshold could use moulded pulp rather than formed board, which needs no dedicated tooling and had not been evaluated at all.
CLIENT PROFILE
A global consumer electronics brand with annual revenue around USD 8.4 billion (client-reported, unverified by MMA), shipping across North America, Europe and Asia. A public commitment to remove plastic from packaging had been announced two years earlier with a deadline approaching. Internal trays and separators remained plastic across most of the range. No tooling budget had been allocated anywhere.
STRATEGIC CHALLENGE
Packaging teams had costed fibre conversion across the range at roughly USD 31 million in tooling alone (client-reported, unverified by MMA), which nobody had provisioned for and which the sustainability commitment had not anticipated. Converters quoted unit prices above the incumbent plastic. The board wanted to know whether the commitment could be met without reopening it publicly.
MMA APPROACH
MMA sized conversion cost by product line against actual unit volumes rather than across the range uniformly, separating lines above the tooling threshold from those below it. Converter tooling funding practice was benchmarked through the expert interview programme across European and Asian suppliers. Freight implications of formed inlays were modelled against the client's existing distribution network and packing locations.
KEY FINDINGS
  1. Only eleven product lines exceeded the volume threshold where dedicated tooling amortises, and those eleven carried roughly 70% of the plastic tonnage the commitment covered.
  2. Three converters were willing to fund tooling and recover it through unit pricing, which removed the capital obstacle entirely and nobody internally had asked them.
  3. Formed inlays would raise outbound freight volume noticeably on two product lines packed a long way from the converting capacity available in that region.
  4. The remaining lines below the threshold could use moulded pulp rather than formed board, which needs no dedicated tooling and had not been evaluated at all.
RECOMMENDED STRATEGY
Phase 1: Phase one: convert the eleven high-volume lines using converter-funded tooling, which delivers most of the committed tonnage with no capital allocation required. Phase 2: Phase two: specify moulded pulp on the lines below the tooling threshold rather than treating them as unconvertible or deferring them indefinitely. Phase 3: Phase three: move converting supply for the two freight-exposed lines to a supplier nearer the packing site before conversion rather than afterwards.
OUTCOME
Nine of the eleven high-volume lines have converted on converter-funded tooling with no capital allocation. Moulded pulp is qualified on the remaining lines. The client reports the commitment is now achievable on the original deadline against an internal estimate that had assumed roughly USD 31 million of capital (client-reported, unverified by MMA).

Frequently Asked Questions

Foundational context covering the market sizes, CAGR, scope, country, region and competition that inform every finding below. This section is provided to cover basics and most often pre-purchase conversations, answered from the MMA Primary Research Dataset.

What is the current size of the Inlay Paper Market?

The market was valued at USD 5.6 billion in 2025, rising to an estimated USD 5.91 billion in 2026. East Asia holds the largest regional share at 29% of value.

How large will the Inlay Paper Market be by 2036?

MMA forecasts USD 10.20 billion by 2036 under the base case, an expansion multiple of 1.72 times the 2026 value. That represents USD 4.29 billion of incremental value.

What is the CAGR for the Inlay Paper Market 2026 to 2036?

The base case runs at 5.6% compound annual growth between 2026 and 2036, with a bull case at 6.9% and a bear case at 4.4%. Historical growth from 2020 to 2025 was 4.2%.

Which segment is growing fastest?

Formed paperboard inlays lead at 8.4%, half again the market rate, because a pressed board tray replaces a thermoformed plastic one directly. Barrier-coated inlays follow at 7.6%.

Who are the major companies in the Inlay Paper Market?

Smurfit Westrock, Mondi, International Paper, Huhtamaki and Stora Enso hold 27% between them. Forming capability and tooling capital sustain those positions rather than board supply scale.

Which country is growing fastest?

India leads at 8.3%, driven by branded consumer goods packaging penetrating categories that previously shipped loosely packed. Specification arrives from Western brand owners rather than domestic regulation.

Report Segmentation Architecture

The full report scope spans multiple orthogonal segmentation dimensions, with cross-tabulated demand data provided for each dimension pair. Coverage extends further to regional breakdowns, trend trajectories, and the competitive detail needed to support segment-level decision-making.

By Construction Method

  • Flat Board Inlay Cards
  • Formed Paperboard Inlays
  • Corrugated Insert and Divider Systems
  • Barrier-Coated Paper Inlays
  • Laminated and Metallised Inlay Papers
  • Moulded Pulp Protective Inlays

By End-Use Industry

  • Consumer Electronics
  • Cosmetics and Personal Care
  • Food and Confectionery
  • Pharmaceutical and Healthcare
  • Electronic Commerce and Logistics
  • Industrial and Automotive Components

By Sales Channel

  • Direct Brand Owner Supply
  • Contract Packer Supply
  • Packaging Distributor Channel
  • Tooled Programme Agreement
  • Retailer Central Specification

By Region

  • North America
  • Western Europe
  • East Asia
  • South Asia and Pacific
  • Latin America
  • Middle East and Africa
  • Eastern Europe

Scope, Methodology, and Coverage

Every figure in this report is reproducible from documented input assumptions. The scope below maps the historical period, the forecast horizon, the segmentation dimensions, and the countries covered, alongside the underlying primary and qualitative methodology.
Historical Period
2020 to 2025
Forecast Period
2026 to 2036
Base Year
2025 (USD billions; MMA Primary Research Dataset, August 2026)
Market Definition
The market comprises paper and paperboard converted into internal packaging components, covering flat inlay cards, formed paperboard inlays, corrugated inserts and dividers, barrier-coated inlays, laminated and metallised inlay papers, and moulded pulp protective inlays. Value is measured at converter level across direct brand owner, contract packer and distributor channels. Outer cartons and cases, labels and printed wraps, flexible film packaging, plastic thermoformed trays, protective foams, and base paper or board sold unconverted fall outside scope.
Quantitative Units
USD billions (current prices); thousand tonnes of converted inlay supplied annually; USD per thousand units by construction method
Segmentation Dimensions
By Construction Method; By End-Use Industry; By Sales Channel; By Region
Regions Covered
North America, Western Europe, East Asia, South Asia and Pacific, Latin America, Middle East and Africa, Eastern Europe
Countries Covered
China, Japan, South Korea, Taiwan, Vietnam, India, Thailand, Indonesia, Australia, United States, Canada, Mexico, Germany, Netherlands, France, United Kingdom, Italy, Spain, Sweden, Finland, Poland, Romania, Czechia, Hungary, Brazil, Argentina, Chile, Turkey, Saudi Arabia, South Africa
Key Companies Profiled
Smurfit Westrock, Mondi, International Paper, Huhtamaki, Stora Enso, Sappi, Metsä Board, Billerud, Sonoco, Graphic Packaging, Amcor, Nissha, Nippon Paper Industries, Oji Holdings, Klabin, ITC Limited, Pactiv Evergreen, Brødrene Hartmann, CKF Inc, Hanhe Paper
Quantitative Methodology
Primary survey, n=3,800 respondents, Q4 2025, six countries; demand-side model with trade association cross-validation
Qualitative Methodology
47 expert interviews, Q4 2025; applied to validate demand model assumptions, identify emerging dynamics, and assess competitive positioning
Report Format
PDF and XLSX data workbook (Word format preview document)
Publisher
Market Minds Advisory
Report Code
MMA-2026-PAC-183
Published
August 2026
Contact
sales@marketmindsadvisory.com | www.marketmindsadvisory.com

Purchase the full Inlay Paper Market Report (2026 to 2036).

The full report sizes the global inlay paper market to 2036 across six construction methods and seven regions, measured at converter level across all supply channels. It maps European packaging regulation and brand owner plastic reduction commitments against converter forming capability, and treats tooling economics and freight density as the two constraints that actually govern conversion. Competitive analysis covers 20 participants evaluated on converted inlay revenue, with moat and risk assessment for the two leaders. The barrier coating conflict with recycling thresholds is quantified by application, and input cost exposure runs from board pricing to tooling-locked programmes. Four quantified revenue levers close the analysis.
Six-method construction sizing with segment-level growth rates
Seven-region share and growth breakdown to 2036
Twenty-participant competitive map on one revenue basis
Tooling thresholds modelled against product line volumes
Input cost exposure traced to board pricing and freight density
Four quantified revenue levers with commercial impact ranges

Built For The People Who Decide

From boardroom strategy to bench-side execution, this report is read cover-to-cover by leaders shaping the next decade of their industry, turning demand scenarios, market dynamics and valuation benchmarks into decisions.
CXOs/ Presidents/ VPs/ Managers
M&A and Corporate Development
Strategy Teams and R&D Heads
Procurement and Product Directors
Regulatory and Compliance Leaders
Investor Relations and Equity Analysts