Market Minds Advisory
Ink Additives Market

Ink Additives Market: Migration listing, supply concentration and digital conversion economics to 2036

Additives are 14% of what an ink costs and decide whether it prints at all, which is an asymmetry the people selling them have never quite managed to price properly.

Lead Analyst

Bilal Shaikh

Published

September 2026

Make Smarter Decisions with Customized Research Insights

Request a free sample report and evaluate market opportunities, growth trends, and competitive dynamics relevant to your business needs.

2025 MARKET VALUE$2.4BMarket Size 2025
2036 FORECAST VALUE$4.5BBase Case , 2026 to 2036
CAGR 2026 TO 20365.8 %Bull 7.0% / Bear 4.6%
INCREMENTAL OPPORTUNITY$1.9BNet 10- year value creation
EXPANSION MULTIPLE1.76x2036 value over 2026 base
Strategic Levers
M&A Pipeline
Regional Outlook
Country Rankings
Competitive Intelligence
Segmental Deep-dive
Call-Us : 91 93563 13602

Executive Snapshot and Market Trajectory

Around 78% of the world's photoinitiator capacity sits in one country, and the printing industry discovered what that meant during the 2021 shortage when ultraviolet curable ink simply stopped being available at any price anybody would pay. Very little has changed since then and nobody has built alternative capacity.
Photoinitiators and curing additives grow at 8.7%, half again the market rate of 5.8%, pulled by ultraviolet and electron beam curing displacing solvent systems across packaging and labels. East Asia holds 30% of value on ink manufacture and additive production arriving together. Conventional oxidative drier chemistry, tied to offset lithography, declines with the printing volumes it serves. Two directions inside one market.
Five suppliers hold 35% of additive revenue and the fragmentation is real, since a formulator buys from a dozen specialists. What decides position is regulatory listing rather than performance: an additive absent from the Swiss Ordinance list or a customer exclusion policy cannot be used in food packaging ink regardless of how well it works, and 46% of that ink volume now carries those requirements. Performance arguments lose to listing arguments almost every single time.
Market Definition
This report covers functional additives supplied into printing ink formulation, spanning dispersants and wetting agents, rheology modifiers, defoamers, photoinitiators and curing additives, waxes and surface additives, and biocides. Value is measured at additive supplier level into ink manufacture. Excluded are pigments and colourants, resins and binders, solvents and monomers, additives sold into paints and coatings, and finished printing inks of every kind.
Base Year Value
$2.4B in 2025 (MMA Primary Research Dataset, August 2026)
Forecast Period
2026 to 2036, eleven discrete annual values
CAGR
5.8% base case. Bull 7.0%. Bear 4.6%.
Fastest Growth Segment
Photoinitiators and Curing Additives: 8.7% CAGR
Fastest Growth Country
India: 8.6% CAGR
Fastest Growth Region
South Asia and Pacific: 8.0% CAGR
Largest Region
East Asia: 30% of 2025 global value
Market Leaders
BASF, Evonik Industries, BYK, Lubrizol and IGM Resins lead the market. Source: MMA Primary Research Dataset, July 2026.
Primary Survey
n=3,800 procurement and R&D decision-makers, Q4 2025, six countries
Methodology
Demand-side build-up, cross-validated against public data, 47 expert interviews

Ink Additives Market Forecast Scenarios

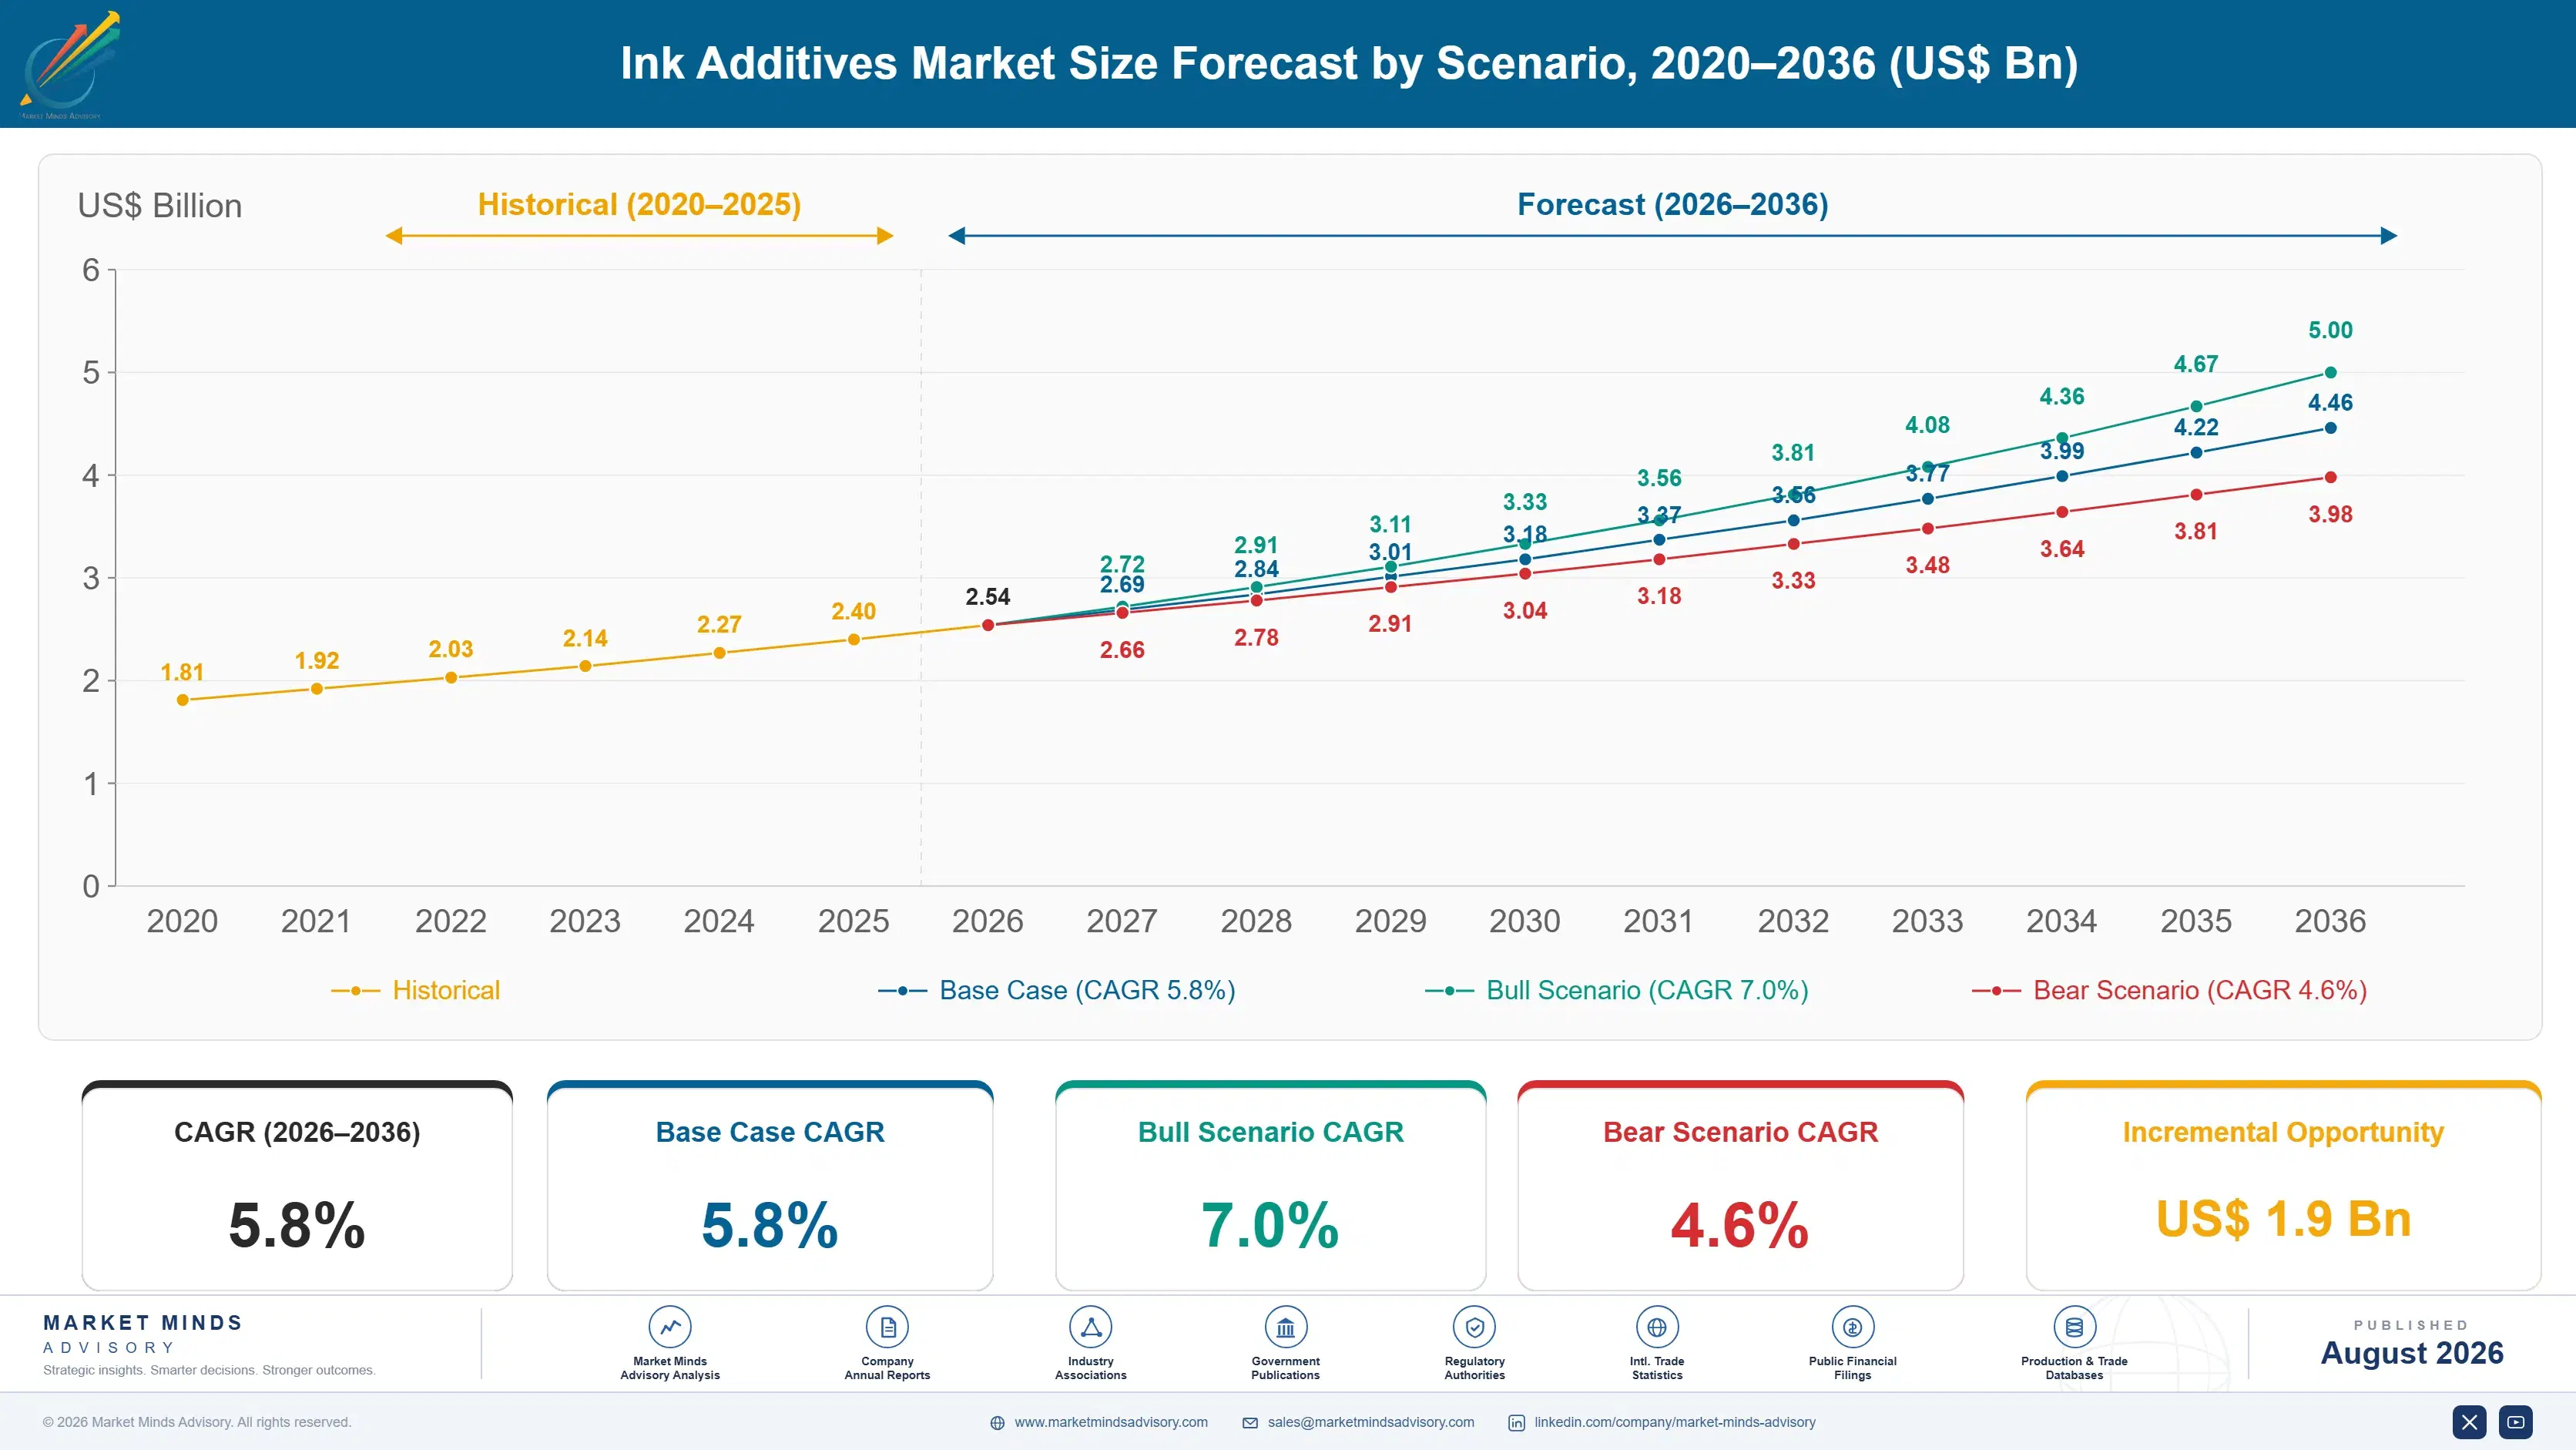
ink-additives-market-trends-size-forecast-scenario-1787553412150
Growth ran at 4.4% between 2020 and 2025 and two disruptions defined the period rather than any trend. The 2021 photoinitiator shortage removed supply the industry had assumed was permanent, and prices moved several hundred percent before settling. European biocide restriction forced water-borne ink reformulation on a timetable nobody chose. Underneath both, digital printing conversion kept adding additive value quietly.
The 5.8% base case rests on three mechanisms. Ultraviolet and electron beam curing keeps displacing solvent systems in packaging and labels, which pulls photoinitiator demand at 8.7% and carries the rest of the curing package with it. Digital printing keeps taking conventional print volume, and inkjet ink carries 2.7 times the additive content by value that offset does. And low-migration food packaging requirements keep spreading, which converts commodity additive volume into listed grades at considerably better prices.
The 7.0% bull case is digital conversion accelerating past current forecasts, which would raise additive intensity across the whole market rather than merely shifting it. The 4.6% bear case is print volume itself: commercial printing has been declining for two decades and packaging growth has been covering it, and if packaging slows there is nothing underneath to hold the number up.

What The Additive Actually Decides

Functional additives account for around 14% of what an ink costs to make and determine almost everything about whether it works. A dispersant decides colour strength and stability, a defoamer decides whether a water-borne ink can be printed at speed, a photoinitiator decides whether the ink cures at all. Ink formulators understand this and buy on performance, which is why this business is more interesting than its cost share suggests.
TOP-FIVE CONCENTRATION35%Combined position across ink additive supply held by leaders
ADDITIVE COST SHARE14%Portion of ink formulation cost attributable to functional additives
PHOTOINITIATOR ORIGIN CONCENTRATION78%Share of global photoinitiator capacity located in a single country
LOW-MIGRATION INK SHARE46%Portion of food packaging ink volume meeting migration exclusion lists
DIGITAL INK ADDITIVE INTENSITY2.7 timesMultiple over conventional ink on additive content by value
REFORMULATION CYCLE LENGTH16 monthsTypical period from additive change to converter production approval
Regulation has changed how that works. In food packaging ink, an additive absent from the Swiss Ordinance list or from a brand owner's own exclusion policy cannot be used regardless of performance, and 46% of food packaging ink volume now carries those constraints. Performance arguments stop mattering once the listing question is settled. Reformulation runs about 16 months from additive change to converter production approval, which makes every listing decision a multi-year commercial event.
Supply concentration is the other governing fact. Around 78% of global photoinitiator capacity sits in China, which the industry learned about the hard way in 2021 and has done nothing about since. Digital inks carry 2.7 times the additive content by value that conventional inks do, which makes conversion good news for exactly this business.
"Every additive supplier I speak to describes their product on performance and every ink formulator describes the decision as a listing question. Those are two different conversations and only one of them decides who gets the business."
Director, Specialty Chemicals and Printing Technologies Practice · MMA Chemicals and Materials Practice · August 2026

Market Trends

Energy curing keeps displacing solvent systems across packaging

Ultraviolet and electron beam curing removes solvent emissions, cures instantly and allows printing on substrates that cannot take heat, which is why packaging and label converters keep switching to it. Every switch pulls a photoinitiator package with it and the additive value per kilogramme of ink rises considerably. Growth at 8.7% follows converter capital investment rather than any print volume expansion. The constraint is supply rather than demand: around 78% of photoinitiator capacity sits in one country and nobody has built meaningful alternative capacity since the shortage that made the problem visible.
Market Impact: Carries 2.7 times additive content
Migration exclusion lists override performance in food packaging

The Swiss Ordinance list and the brand owner exclusion policies that followed the printing industry's contamination incidents mean an additive either appears on the permitted list or cannot be used in food packaging ink at all. Performance stops being the argument. Around 46% of food packaging ink volume now carries those constraints and the share climbs as brand owners tighten their own specifications ahead of any regulator. Suppliers with listed grades hold positions competitors cannot bid against, and getting a molecule listed takes toxicological work measured in years rather than months. Very few suppliers fund that work.
Market Impact: Lifts biocide demand 7.3% annually

Market Opportunities and Growth Drivers

Digital printing carries far higher additive content by value

An inkjet ink has to pass through a nozzle a few tens of microns across, hundreds of times a second, without settling, foaming or drying in the head, and every one of those requirements is met by an additive rather than by the pigment or the vehicle. Digital inks therefore carry around 2.7 times the additive content by value that conventional inks do. Every percentage point of print volume converting from offset or flexography to digital raises additive demand disproportionately, which makes this the one industry trend that unambiguously favours additive suppliers over ink manufacturers.
Market Impact: Concentrates 78% in one country

Biocide restriction forces water-borne ink reformulation across Europe

European biocidal product regulation has progressively restricted the isothiazolinone preservatives that water-borne inks depended on for in-can protection, and the alternatives are less effective, more expensive or both. The root situation is that a water-borne ink without adequate preservation spoils in the can and nobody accepts that. Formulators have been reworking preservation packages continuously for several years and the work is not finished. Growth at 7.3% in biocides reflects reformulation and higher-cost chemistry rather than any volume expansion, which is an unusual and temporarily profitable position for suppliers holding compliant systems. That window will close within a few years.
Market Impact: Runs 16 months per change

Market Restraints and Challenges

Photoinitiator supply concentrates in one country almost entirely

Around 78% of global photoinitiator capacity sits in China and the 2021 shortage showed what that means when production stops for any reason. The root cause is cost: the synthesis is multi-step, uses reagents that Western producers find expensive to handle under their own environmental rules, and margins never justified building capacity elsewhere. Commercially this leaves every energy curable ink formulator exposed to a supply chain nobody outside China influences. Some Western suppliers now hold strategic inventory measured in months, and a small number have begun qualifying alternative synthesis routes that avoid the constrained intermediates entirely.
Market Impact: Segment compounding at 8.7%

Reformulation cycles make additive substitution slow and expensive

Changing an additive in a commercial ink runs about 16 months from decision to converter production approval, because the ink has to be reformulated, tested on press, validated against migration limits where relevant, and accepted by a brand owner who did not ask for the change. The root problem is that the ink is a middle layer between an additive supplier and a customer who never sees it. Commercially this locks incumbency and makes displacement expensive. Suppliers have responded by funding the reformulation work themselves and by getting listed on brand owner specifications directly rather than through the formulator.
Market Impact: Covers 46% of packaging volume
3 additional market trends, 4 additional growth drivers, and 2 additional restraints and challenges are covered in the full report. Contact sales@marketmindsadvisory.com to access the complete intelligence.

Segment CAGR and Growth Architecture

Additives are classified here by the function they perform in the ink, because that determines the chemistry involved, the regulatory exposure it carries and which suppliers compete for it. Ink technology, printing process and end-use application are handled separately in the framework, since a single additive function serves several ink systems with different chemistry behind it.
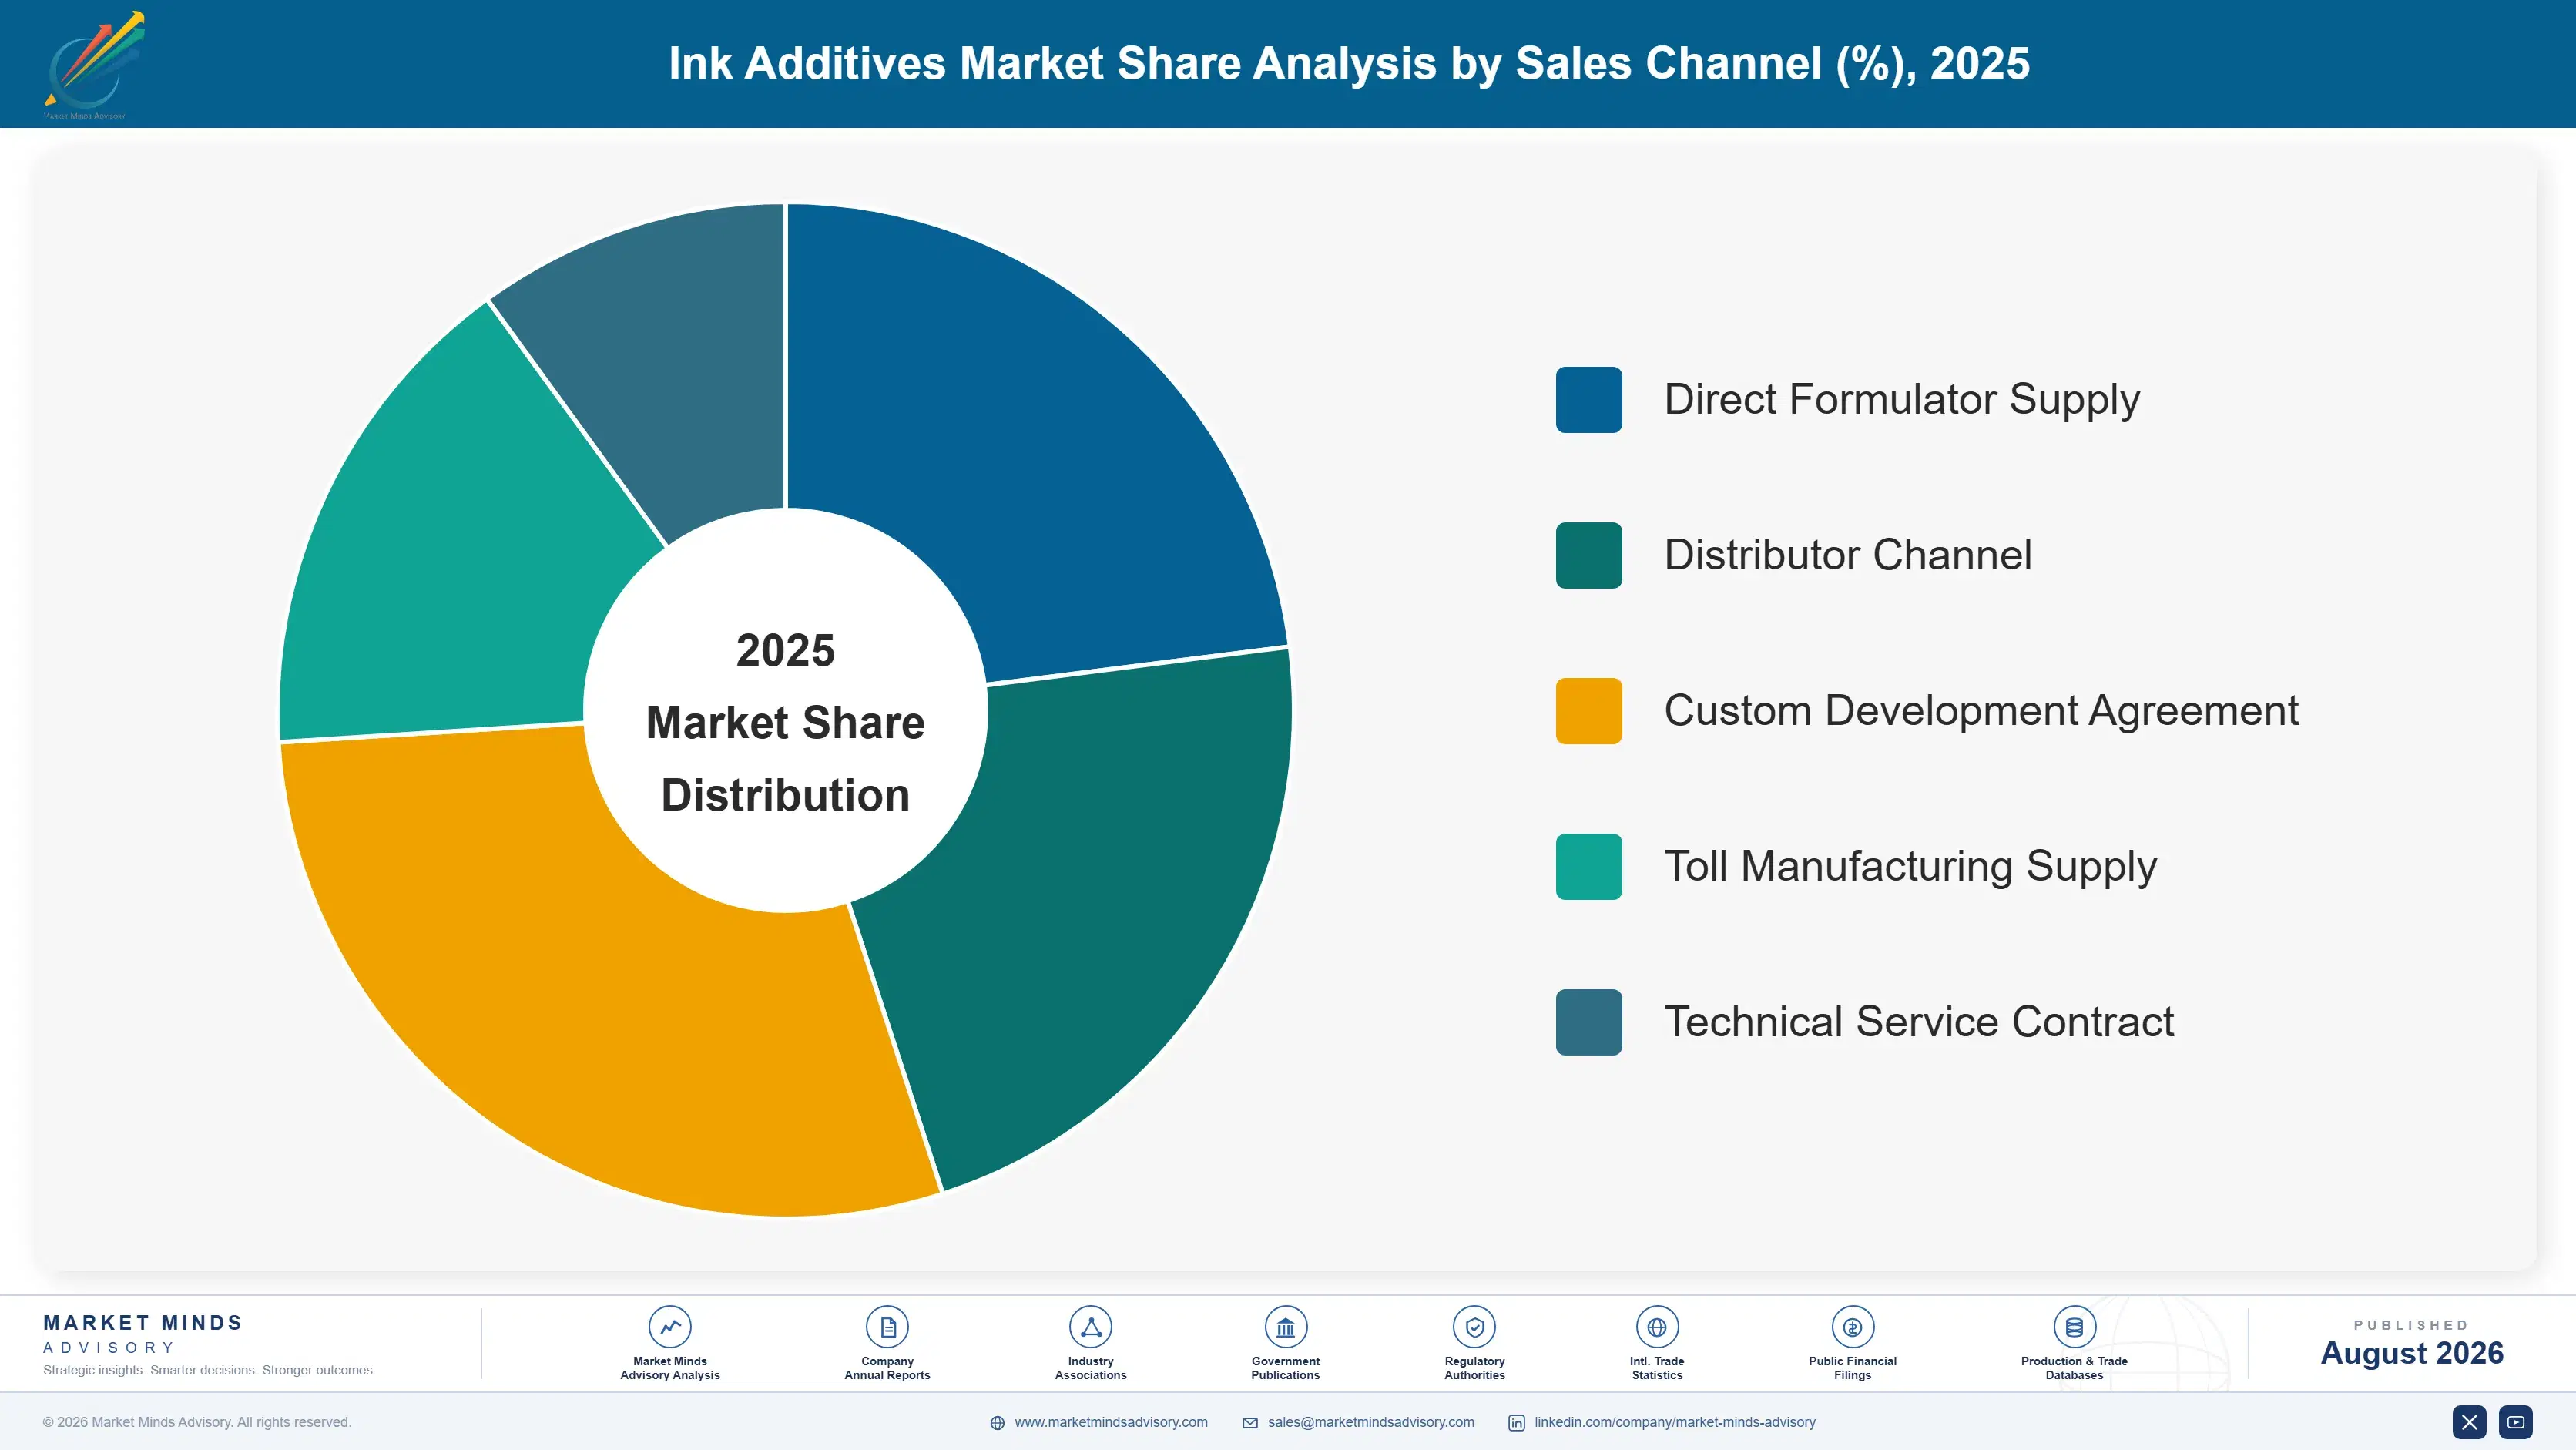
ink-additives-market-trends-market-share-analysis-1787553412680

Photoinitiators and Curing Additives

Growing at 8.7%, half again the market rate, and carrying a supply risk nothing else in this market approaches. Energy curable inks cannot cure without a photoinitiator and around 78% of global capacity sits in one country, which the industry discovered in 2021 when the material became briefly unobtainable. Demand follows converter investment in ultraviolet and electron beam equipment rather than print volume. Regulatory pressure adds a second dimension: several photoinitiator molecules have been reclassified or excluded from food packaging use, which removes options rather than adding cost. Suppliers holding listed low-migration grades are in an unusually strong position and know it perfectly well. Nobody else can bid against a listing.
CAGR 8.7%

Biocides and Preservatives

This segment grows at 7.3% because regulation removed the chemistry that worked and the replacements cost more, which is growth of a sort that nobody enjoys explaining. European biocidal product regulation progressively restricted isothiazolinone preservatives that water-borne inks relied on, and every water-borne system needs in-can protection or it spoils. Formulators have been reworking preservation packages for several years and the work continues. Suppliers holding compliant, effective and reasonably priced systems occupy a temporarily excellent position, since the alternatives generally fail on one of those three. That window closes as new chemistry gets registered and approved, which is a matter of years rather than decades. Everybody in the segment knows the clock.
CAGR 7.3%
Full segment breakdown across 6 segments available in the complete report.

Regional Architecture and Country Demand Map

East Asia holds 30% of value on ink manufacture and additive production arriving in the same geography, including most of the world's photoinitiator capacity. North America follows at 24% on packaging print volume. Where the chemistry is made explains more of this map than where the printing happens.

North America

Packaging print volume sustains this region and food packaging in particular sets the specification, since American brand owners adopted migration exclusion policies alongside their European counterparts and enforce them through supplier agreements rather than through regulation. Around 46% of food packaging ink volume now carries those constraints. Digital printing conversion has moved further here than in most markets, particularly in labels and corrugated, which raises additive intensity across the installed base. Commercial and publication printing continues declining and takes conventional drier chemistry with it. Growth at 5.4% mixes those effects, and the mix improvement matters more than the volume number does. Very few published forecasts separate the three properly at all.
Share: 24% | CAGR: 5.4% (2026 to 2036)

Western Europe

Regulation originates here and lands here first, which is why growth at 4.2% is the weakest of the seven regions and why the technical leadership sits here anyway. The Swiss Ordinance list, European biocidal product regulation and the brand owner exclusion policies that followed contamination incidents all began in this market. German and Dutch additive suppliers hold the deepest formulation and toxicological capability anywhere and increasingly sell that capability into markets facing the same requirements later. Print volume is declining across commercial and publication segments and packaging growth is modest. The value here is regulatory position rather than tonnage, and it has been for some years. That position is genuinely difficult to copy.
Share: 22% | CAGR: 4.2% (2026 to 2036)
Regional intelligence for 5 additional markets available in the complete report: East Asia, South Asia and Pacific, Latin America, Middle East and Africa, Eastern Europe. Contact sales@marketmindsadvisory.com.
ink-additives-market-trends-country-cagr-analysis-1787553413193

Where Additive Margin Actually Sits

Four moves matter in a business where 14% of the formulation cost decides whether the ink works and a regulatory list decides whether anybody may use it. Two are about getting listed before competitors do, and two are about the supply position that 2021 exposed. Competing on performance alone stopped working some years ago.

Fund the toxicology to get molecules listed

An additive absent from the Swiss Ordinance list or from a brand owner exclusion policy cannot be used in food packaging ink regardless of how well it performs, and 46% of that ink volume now carries those constraints. Getting a molecule listed requires toxicological work measured in years and costing real money before any revenue appears. Suppliers who funded it hold positions competitors cannot bid against at all. Those who did not are competing for the shrinking half of the market where performance still decides, and that half keeps getting smaller.
Market Impact: Reaches the full 46% of packaging ink volume

Sell to the brand owner, not the ink maker

The ink formulator is a middle layer between an additive supplier and a brand owner who writes the exclusion policy that actually decides what may be used. Reformulation runs about 16 months and nobody undertakes it voluntarily, which means getting named on a brand owner specification locks a position for years rather than winning an order. Additive suppliers calling only on ink manufacturers are negotiating with somebody who is themselves constrained by a decision taken elsewhere. Very few have built any relationship with the brand owners who set those specifications in the first place.
Market Impact: Locks positions behind 16 month reformulation cycles entirely

Qualify photoinitiator routes outside the concentrated supply

Around 78% of global photoinitiator capacity sits in one country and the 2021 shortage demonstrated what happens when it stops, yet almost nothing has been built elsewhere since. A supplier holding qualified alternative synthesis routes or contracted non-Chinese capacity can sell security alongside chemistry, and energy curable ink formulators growing at 8.7% will pay for it after what they went through. The cost of qualifying alternatives is real and the position it buys is genuinely defensible. Almost nobody has done the work, which is precisely what makes it worth doing now.
Market Impact: Addresses the full 78% supply concentration at source

Price digital additive packages on jetting reliability

An inkjet ink carries around 2.7 times the additive content by value that a conventional ink does, because jetting reliability depends entirely on surface tension, dispersion stability and viscosity behaviour that additives control. A blocked printhead costs a converter production time worth far more than any additive package. Selling on that basis rather than on cost per kilogramme reaches an engineering conversation instead of a purchasing one. Digital conversion is the only trend in printing that unambiguously favours additive suppliers, and rather few of them have positioned for it deliberately.
Market Impact: Monetises the full 2.7 times additive content intensity

Who Controls the Margin Pool

Five suppliers hold 35% of ink additive revenue, measured at additive supplier level into ink formulation, the basis used throughout this section. That fragmentation is genuine, since an ink formulator typically buys from a dozen specialists rather than consolidating. The gap between the leaders and everybody else is regulatory listing depth and application laboratory capability, neither of which appears in any product comparison a purchasing department would run.
Competition runs on three dimensions and unit price is the least of them. Regulatory listing breadth, which decides who may be considered for food packaging at all. Application support depth, since an additive changes how an ink behaves and formulators need help predicting that. And supply security, which mattered little before 2021 and matters enormously now. That reversal happened in a single year.

Rankings shift where Chinese suppliers move from photoinitiator supply into the broader additive range, carrying cost positions Western producers cannot approach and improving on technical support every year. That is already visible in Asia and reaching Europe. Listed food packaging grades hold longest, because toxicological work and brand owner relationships take years that a cost advantage does not shorten.
ink-additives-market-trends-company-positioning-matrix-1787553413711

Competitive Moat and Risk Dimensions

BASF

Moat: Regulatory and toxicology depth

BASF carries toxicological and regulatory affairs capability across a chemical portfolio larger than ink additives, which means listing work for one application supports several others at marginal cost. Specialist competitors fund that work against a single product line and generally cannot justify it, which is why listed grades concentrate among the larger suppliers regardless of who has the better chemistry.
BASF

Risk: Ink additives barely register

Ink additives are a small line inside a chemical group measured in tens of billions, which means they receive attention and capital proportional to that scale rather than to the opportunity. Specialists treating printing as their whole business commit application laboratory resource and customer time that a large portfolio company would struggle to approve.
BYK

Moat: Application laboratory reach

BYK runs application laboratories across its markets and formulators use them as an extension of their development capability, which builds relationships that a price list never reaches. An additive changes how an ink behaves in ways nobody predicts from a datasheet, so the laboratory is the product as much as the chemistry is. Competitors shipping samples lose on that alone.
BYK

Risk: Coatings dominate the business

Most of the additive business sits in paints and coatings rather than printing inks, and the two have different regulatory regimes, different customers and different development priorities. Ink applications compete internally against a larger market for laboratory time and formulation resource, which slows response on requirements that only printing customers have.

Players Tracked

Prominent Players

BASF
Evonik Industries
BYK
Lubrizol
IGM Resins

Other Key Players

Elementis
Croda
Clariant
Dow
Arkema
Münzing Chemie
Solvay
Allnex
Eastman Chemical
Nouryon
Kao Corporation
Tronly
Deuchem
Keim-Additec
Michelman

Recent Developments

MARCH 2025

IGM Resins expanded photoinitiator production capacity outside China

IGM Resins commissioned additional photoinitiator manufacturing capacity at a site outside China, aimed at energy curable ink and coating customers seeking supply security after the 2021 shortage. The investment was organic and funded internally, with no partner involved, and it remains modest against total global capacity.
Signal: Supply security is being built at last, five years late and at a scale that changes very little yet
AUGUST 2025

BASF added listed low-migration additive grades for food packaging inks

BASF completed regulatory listing work on additional low-migration additive grades intended for food packaging ink formulation, extending the range available under exclusion policies. The work was internal and organic rather than any transaction, and it followed brand owner specifications tightening ahead of formal regulation across several markets.
Signal: Brand owners are moving ahead of regulators, which means listing work now follows commercial specifications rather than legal deadlines
JANUARY 2026

Evonik Industries expanded application laboratory capability for digital ink customers

Evonik Industries opened additional application laboratory capacity focused on inkjet formulation support, responding to digital printing conversion raising additive content and technical complexity together. This was an organic expansion of technical service resource rather than an acquisition or partnership of any kind. Jetting reliability drove the whole decision.
Signal: Laboratory capacity rather than production capacity is where suppliers are investing, which tells you what actually wins digital business

What Moves Additive Cost

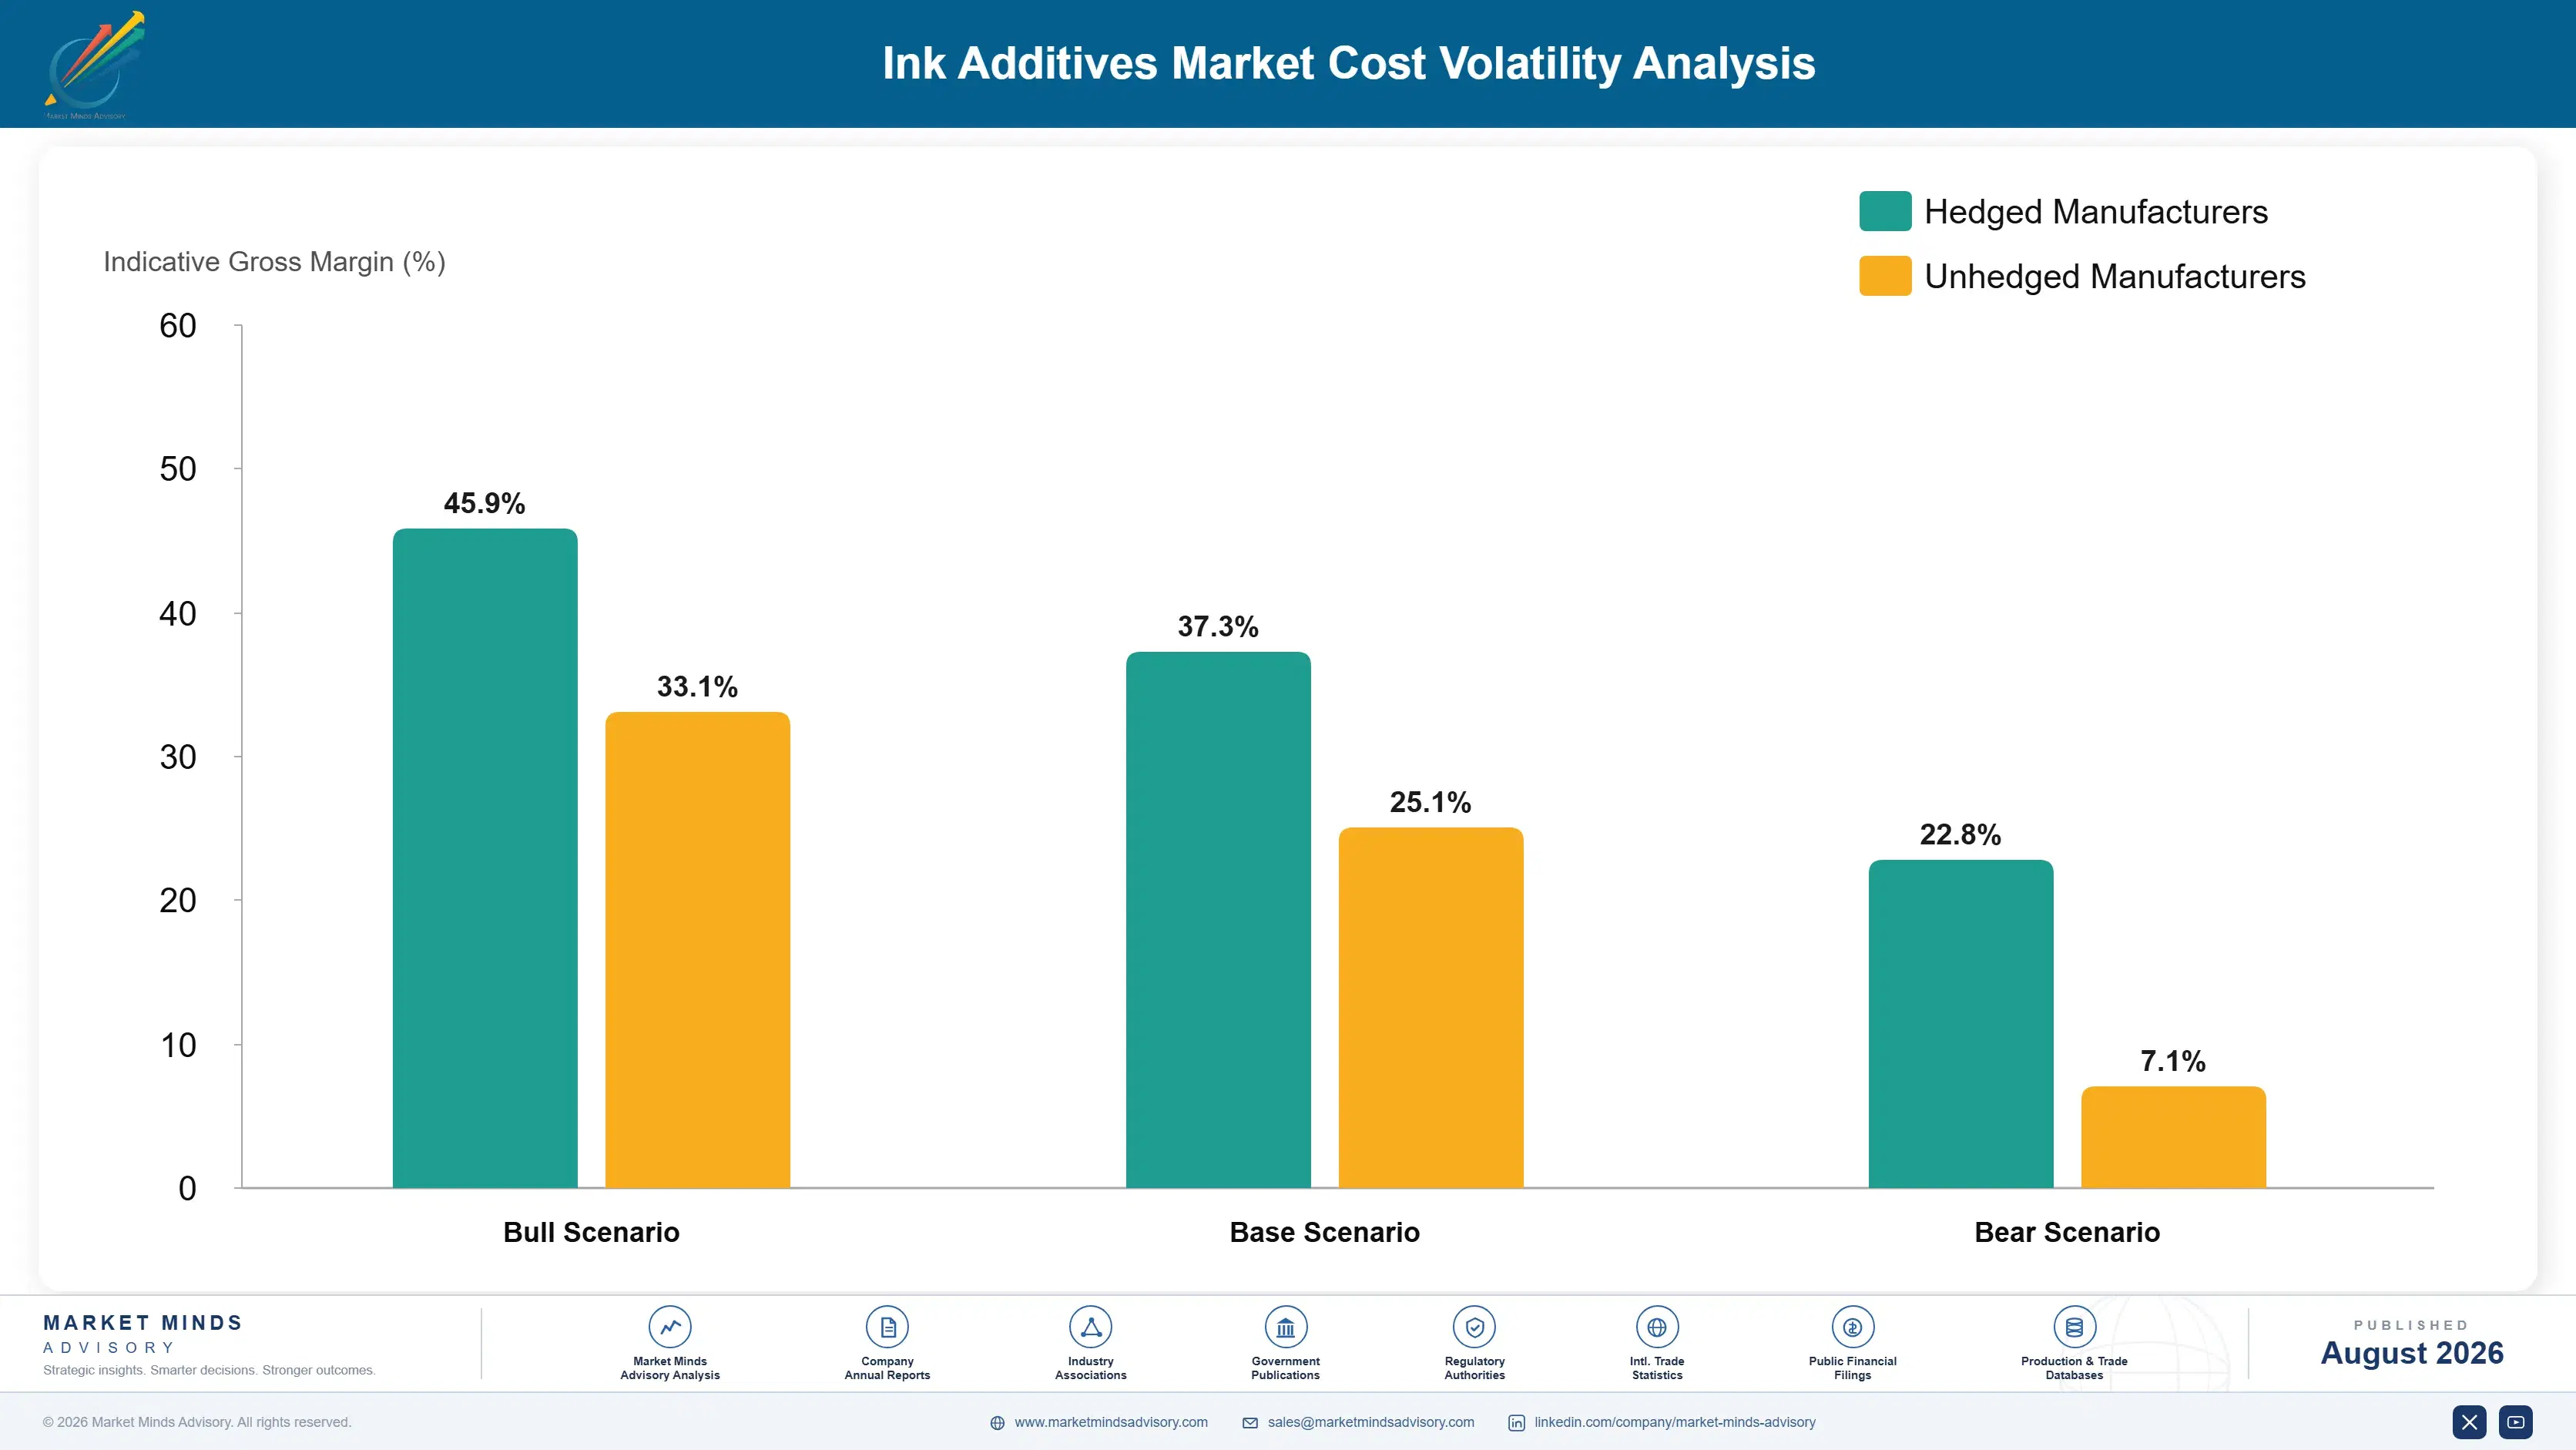
Petrochemical intermediates and specialty monomers account for around 43% of additive cost of goods, with synthesis energy, purification and regulatory maintenance making up the balance. Acrylates and amine intermediates come from European, American and Asian producers. Photoinitiator intermediates concentrate overwhelmingly in China. Silicone intermediates come from a handful of producers in Germany, Japan and the United States.
The 2021 photoinitiator shortage is the clearest example of what concentration does. Prices moved several hundred percent as Chinese production was curtailed, and formulators with no alternative source simply stopped supplying energy curable ink. European energy costs through 2022 raised synthesis expense, and IEA data show European industrial gas running several times American levels. BASF recorded raw material and energy cost pressure across its specialty chemical operations in its Annual Report 2022.

The reformulation lock is what makes this exposure asymmetric. An additive listed on a food packaging specification cannot change synthesis route or intermediate source without triggering 16 months of requalification that nobody will fund. Suppliers selling into general commercial printing reformulate freely. Suppliers with captive intermediate production carry smaller exposure than those buying on the merchant market, and Asian producers gain further from intermediate proximity European operations do not have.
ink-additives-market-trends-cost-volatility-analysis-1787553413907

Qualify a second intermediate source before listing the grade

An additive listed on a food packaging specification cannot change intermediate source without triggering requalification that takes 16 months and that nobody will fund. Qualifying two sources during original development costs testing time and removes an exposure that becomes unfixable afterwards. Almost nobody plans that far ahead, because development budgets reward reaching first commercial sale rather than managing supply risk.

Hold strategic inventory on concentrated supply chains

Around 78% of photoinitiator capacity sits in one country and the 2021 shortage showed how quickly that becomes a production stoppage. Holding inventory sized against realistic disruption rather than normal ordering converts an unmanageable exposure into a working capital cost. These materials store well and the carrying cost is small against the alternative of having nothing to sell.

Index customer agreements to published intermediate benchmarks

Annual fixed pricing on an additive whose intermediates moved by multiples in 2021 and 2022 transfers all volatility to the supplier across a period nobody can forecast. Indexing to published acrylate and amine benchmarks with quarterly reset removes the argument, and ink formulators accept it because they face the same exposure on every other input they buy.

Portfolio Architecture for Margin Defence

Margin in ink additives tracks regulatory listing and application difficulty rather than manufacturing scale. Commodity dispersants and rheology modifiers run at gross margins in the high twenties, competing against several capable suppliers on products formulators treat as substitutable. Listed low-migration grades for food packaging run considerably higher, because the listing excludes competitors entirely and the customer has nowhere else to go. Photoinitiators sit awkwardly between the two, technically demanding and priced by a supply chain nobody in the West controls.
The tension is between volume chemistry that fills reactors and listed grades that earn the returns, and the two need different organisations behind them. Commodity additive production runs on process efficiency and cost. Listed grades run on toxicology, regulatory affairs and brand owner relationships that a manufacturing organisation has no reason to hold. Suppliers running both from one structure have generally found the volume business consuming the technical resource that listing work needed most.

High-value pools sit in listed low-migration grades, digital ink packages sold on jetting reliability and any photoinitiator position outside the concentrated supply chain. None of the three is where the tonnage is. Reactor capacity by itself defends nothing whatsoever in this market.

Volume / Commodity-Adjacent

Standard dispersants, rheology modifiers and waxes sold into general commercial and publication printing where several suppliers offer substitutable products. The seven-point range separates suppliers with captive intermediate production from those buying on the merchant market at prevailing prices.
Gross Margin: 26%-33%

Premium / Certified

Application-engineered additive packages supplied with formulation support into demanding ink systems, including digital and high-speed flexographic applications. The eight-point spread reflects how much application laboratory work the supplier contributes against how much the formulator performs alone.
Gross Margin: 36%-44%

Sustainability / Regulatory / Next-Generation

Listed low-migration grades for food packaging, compliant biocide systems and photoinitiator positions outside the concentrated supply chain. The fourteen-point range is wide because pricing reflects listing scarcity and supply security rather than any cost basis a formulator could benchmark.
Gross Margin: 44%-58%
ink-additives-market-trends-portfolio-architecture-1787553414407

High-value Sub-segments and Strategic Watch-out

Listed Low-Migration Grades

Covering 46% of food packaging ink volume and rising, defended by toxicological work measured in years that competitors cannot shortcut. Performance arguments stop mattering once the listing question is settled, which is an unusually clean competitive position. Very few suppliers fund the work. Most complain about it instead.
Gross Margin: 46%-58%

Digital Ink Additive Packages

Inkjet inks carry 2.7 times the additive content by value that conventional inks do, because jetting reliability depends entirely on additive control. A blocked printhead costs more than any additive package. Digital conversion is the only printing trend that unambiguously favours this industry. Rather few have positioned for it.
Gross Margin: 40%-52%

Commodity Dispersants And Rheology

The volume that fills reactors and funds the technical organisation, growing around 5% and treated as substitutable by every formulator who buys it. Chinese suppliers moving beyond photoinitiators into the broader range are the immediate threat here. Manage it for utilisation. That threat is arriving now.
Gross Margin: 26%-33%

Photoinitiator Supply Security

Around 78% of global capacity sits in one country and 2021 showed what that means, yet almost nothing has been built elsewhere since. A supplier holding qualified alternative routes sells security alongside chemistry to customers who remember. Almost nobody has done that work. The memory has not faded.
Gross Margin: 38%-56%

How Additive Demand Renews

Additive demand is consumption revenue behind a qualification gate. An additive written into a commercial ink formulation is consumed continuously for as long as that ink is manufactured, with no repurchasing decision along the way, and changing it costs 16 months of reformulation that nobody undertakes voluntarily. The renewal moment is a new ink formulation rather than a new order.
Stickiness varies enormously by application. Food packaging positions are close to permanent, since a listed additive inside an approved specification cannot be substituted without reopening a brand owner's own approval. Digital ink formulations are stickier than expected, because jetting reliability is difficult to reproduce with a different additive. Commercial and publication printing changes readily, since qualification is light and formulators treat products as substitutable. Depth follows the same line: packaging customers consolidate onto fewer suppliers while commercial printers spread widely.

The buyer has moved past the formulator. Additive selection once sat entirely with ink chemists weighing performance and price. It increasingly sits with brand owner packaging teams writing exclusion policies, with regulatory affairs functions checking listings, and with converter engineers weighing press reliability. None of those three has ever bought an additive and all of them now decide.
ink-additives-market-trends-end-use-penetration-index-1787553414895

Where To Place The Bet

These are among the four positions where our research anticipates prominent divergence between winners and laggards over the coming forecast period. Each is grounded in the demand model, the regulatory perimeter, and the announced capacity pipeline.
01 / REGULATORY LISTING INVESTMENT

Fund toxicology before funding sales coverage

An additive absent from the Swiss Ordinance list or from a brand owner exclusion policy cannot be used in food packaging ink regardless of how well it performs, and 46% of that volume already carries those constraints. Getting a molecule listed requires toxicological work measured in years and paid for long before any revenue appears against it. Suppliers who funded it hold positions competitors cannot bid against, and everybody else is competing for the shrinking half where performance still decides anything.
02 / BRAND OWNER POSITIONING

Call on the specification writer, not the formulator

The ink formulator sits between an additive supplier and a brand owner who writes the exclusion policy that actually decides what may be used at all anywhere. Reformulation runs about 16 months and nobody undertakes it voluntarily, which means getting named on a brand owner specification locks a position for years rather than winning a single order this year. Additive suppliers calling only on ink manufacturers are negotiating with somebody already constrained by a decision taken somewhere else entirely by other people.
03 / PHOTOINITIATOR SUPPLY SECURITY

Sell security alongside the chemistry

Around 78% of global photoinitiator capacity sits in one country and the 2021 shortage stopped energy curable ink production outright, yet almost nothing has been built elsewhere in the five years since it happened. A supplier holding qualified alternative synthesis routes or contracted capacity outside that concentration can sell continuity to formulators growing at 8.7% who remember exactly what the last disruption cost them. Almost nobody has done the qualification work, which is what makes it worth doing right now instead.
04 / DIGITAL PACKAGE POSITIONING

Price jetting reliability, not cost per kilogramme

An inkjet ink carries around 2.7 times the additive content by value that a conventional ink does, because jetting reliability depends entirely on surface tension, dispersion stability and viscosity behaviour that only additives control. A blocked printhead costs a converter production time worth far more than the entire additive package in the ink. Selling on that basis reaches an engineering conversation rather than a purchasing one, and digital conversion is the only printing trend that unambiguously favours additive suppliers at all.

Engagement Snapshot From the Field

A live engagement with an industry participant carrying material or product regulatory and market exposure ahead of a defining policy shift, showing how our research translates into a defensible multi-year portfolio strategy.
MARKET MINDS ADVISORY · CLIENT ENGAGEMENT SUMMARY
Ink Additives Producer Strategic Portfolio Review and Transition Roadmap 2026·Investment Scenario on Ink Additives Exposure Evaluation 2025-26
CLIENT PROFILE
A European specialty additive supplier with annual revenue around EUR 310 million (client-reported, unverified by MMA), of which printing ink additives accounted for roughly 40%. The business held strong positions in dispersants and rheology modifiers and almost none in listed low-migration grades. Photoinitiator intermediates were bought entirely from Chinese suppliers with no alternative source qualified.
STRATEGIC CHALLENGE
Ink additive revenue had grown 4% across three years while the packaging ink market it served had grown considerably faster (client-reported, unverified by MMA), and the board had attributed the gap to pricing pressure. A programme to cut manufacturing cost had been approved. Nobody had examined whether the client was even eligible to bid on the volume it was missing.
MMA APPROACH
MMA mapped the client's product range against the Swiss Ordinance list and the exclusion policies of the twelve largest brand owners in its served markets, establishing exactly which volume the client could and could not bid for. Toxicological listing cost and timeline were established with contract laboratories. Photoinitiator intermediate supply alternatives were screened, and digital ink opportunities were sized through the expert interview programme.
KEY FINDINGS
  1. The client was ineligible to bid on roughly 46% of packaging ink volume because its grades appeared on no exclusion list, which explained the entire growth gap.
  2. The approved manufacturing cost programme addressed pricing pressure that was not actually happening, since the client was losing on eligibility rather than on price anywhere.
  3. Listing four existing molecules would cost less than the approved cost programme and open the volume the client had been unable to compete for at all.
  4. Photoinitiator intermediate exposure was total, with no alternative source qualified and no strategic inventory held against a supply chain that had already failed once.
CLIENT PROFILE
A European specialty additive supplier with annual revenue around EUR 310 million (client-reported, unverified by MMA), of which printing ink additives accounted for roughly 40%. The business held strong positions in dispersants and rheology modifiers and almost none in listed low-migration grades. Photoinitiator intermediates were bought entirely from Chinese suppliers with no alternative source qualified.
STRATEGIC CHALLENGE
Ink additive revenue had grown 4% across three years while the packaging ink market it served had grown considerably faster (client-reported, unverified by MMA), and the board had attributed the gap to pricing pressure. A programme to cut manufacturing cost had been approved. Nobody had examined whether the client was even eligible to bid on the volume it was missing.
MMA APPROACH
MMA mapped the client's product range against the Swiss Ordinance list and the exclusion policies of the twelve largest brand owners in its served markets, establishing exactly which volume the client could and could not bid for. Toxicological listing cost and timeline were established with contract laboratories. Photoinitiator intermediate supply alternatives were screened, and digital ink opportunities were sized through the expert interview programme.
KEY FINDINGS
  1. The client was ineligible to bid on roughly 46% of packaging ink volume because its grades appeared on no exclusion list, which explained the entire growth gap.
  2. The approved manufacturing cost programme addressed pricing pressure that was not actually happening, since the client was losing on eligibility rather than on price anywhere.
  3. Listing four existing molecules would cost less than the approved cost programme and open the volume the client had been unable to compete for at all.
  4. Photoinitiator intermediate exposure was total, with no alternative source qualified and no strategic inventory held against a supply chain that had already failed once.
RECOMMENDED STRATEGY
Phase 1: Phase one: cancel the manufacturing cost programme and redirect that capital into toxicological listing work on the four identified molecules. Phase 2: Phase two: open direct relationships with the four largest brand owners in the served markets rather than working only through ink formulators. Phase 3: Phase three: qualify one non-Chinese photoinitiator intermediate source and hold strategic inventory sized against realistic disruption rather than normal ordering.
OUTCOME
The cost programme was cancelled and listing work is running on all four molecules, with the first two expected on exclusion lists in 2027. Brand owner relationships have opened with three of the four targets. A second intermediate source is qualified and the client reports the growth conversation has changed entirely (client-reported, unverified by MMA).

Frequently Asked Questions

Foundational context covering the market sizes, CAGR, scope, country, region and competition that inform every finding below. This section is provided to cover basics and most often pre-purchase conversations, answered from the MMA Primary Research Dataset.

What is the current size of the Ink Additives Market?

The market was valued at USD 2.4 billion in 2025, rising to an estimated USD 2.54 billion in 2026. East Asia holds the largest regional share at 30% of value.

How large will the Ink Additives Market be by 2036?

MMA forecasts USD 4.46 billion by 2036 under the base case, an expansion multiple of 1.76 times the 2026 value. That represents USD 1.92 billion of incremental value.

What is the CAGR for the Ink Additives Market 2026 to 2036?

The base case runs at 5.8% compound annual growth between 2026 and 2036, with a bull case at 7.0% and a bear case at 4.6%. Historical growth from 2020 to 2025 was 4.4%.

Which segment is growing fastest?

Photoinitiators and curing additives lead at 8.7%, half again the market rate, driven by energy curing displacing solvent systems in packaging. Biocides and preservatives follow at 7.3%.

Who are the major companies in the Ink Additives Market?

BASF, Evonik Industries, BYK, Lubrizol and IGM Resins hold 35% between them. Regulatory listing depth and application laboratory capability sustain those positions rather than manufacturing scale.

Which country is growing fastest?

India leads at 8.6%, driven by packaging print volume expanding on consumer goods penetration and food packaging conversion. Export requirements pull international additive grades in behind it.

Report Segmentation Architecture

The full report scope spans multiple orthogonal segmentation dimensions, with cross-tabulated demand data provided for each dimension pair. Coverage extends further to regional breakdowns, trend trajectories, and the competitive detail needed to support segment-level decision-making.

By Additive Function

  • Dispersants and Wetting Agents
  • Rheology Modifiers
  • Defoamers and Deaerators
  • Photoinitiators and Curing Additives
  • Waxes and Surface Additives
  • Biocides and Preservatives

By End-Use Industry

  • Flexible Packaging
  • Folding Carton and Corrugated
  • Labels and Tags
  • Commercial and Publication Printing
  • Industrial and Functional Printing
  • Textile and Decorative Printing

By Sales Channel

  • Direct Formulator Supply
  • Distributor Channel
  • Custom Development Agreement
  • Toll Manufacturing Supply
  • Technical Service Contract

By Region

  • North America
  • Western Europe
  • East Asia
  • South Asia and Pacific
  • Latin America
  • Middle East and Africa
  • Eastern Europe

Scope, Methodology, and Coverage

Every figure in this report is reproducible from documented input assumptions. The scope below maps the historical period, the forecast horizon, the segmentation dimensions, and the countries covered, alongside the underlying primary and qualitative methodology.
Historical Period
2020 to 2025
Forecast Period
2026 to 2036
Base Year
2025 (USD billions; MMA Primary Research Dataset, August 2026)
Market Definition
The market comprises functional additives supplied into printing ink formulation, covering dispersants and wetting agents, rheology modifiers, defoamers and deaerators, photoinitiators and curing additives, waxes and surface additives, and biocides and preservatives. Value is measured at additive supplier level into ink manufacture across solvent-borne, water-borne, energy curable and digital ink systems. Pigments and colourants, resins and binders, solvents and reactive monomers, additives sold into paints and coatings, printing equipment, and finished printing inks fall outside scope.
Quantitative Units
USD billions (current prices); thousand tonnes of additive supplied annually; USD per kilogramme by additive function
Segmentation Dimensions
By Additive Function; By End-Use Industry; By Sales Channel; By Region
Regions Covered
North America, Western Europe, East Asia, South Asia and Pacific, Latin America, Middle East and Africa, Eastern Europe
Countries Covered
China, Japan, South Korea, Taiwan, India, Thailand, Vietnam, Indonesia, Australia, United States, Canada, Mexico, Germany, Switzerland, Netherlands, France, United Kingdom, Italy, Spain, Belgium, Poland, Romania, Czechia, Hungary, Brazil, Argentina, Chile, Turkey, Saudi Arabia, South Africa
Key Companies Profiled
BASF, Evonik Industries, BYK, Lubrizol, IGM Resins, Elementis, Croda, Clariant, Dow, Arkema, Münzing Chemie, Solvay, Allnex, Eastman Chemical, Nouryon, Kao Corporation, Tronly, Deuchem, Keim-Additec, Michelman
Quantitative Methodology
Primary survey, n=3,800 respondents, Q4 2025, six countries; demand-side model with trade association cross-validation
Qualitative Methodology
47 expert interviews, Q4 2025; applied to validate demand model assumptions, identify emerging dynamics, and assess competitive positioning
Report Format
PDF and XLSX data workbook (Word format preview document)
Publisher
Market Minds Advisory
Report Code
MMA-2026-CHM-569
Published
August 2026
Contact
sales@marketmindsadvisory.com | www.marketmindsadvisory.com

Purchase the full Ink Additives Market Report (2026 to 2036).

The full report sizes the global ink additive market to 2036 across six additive functions and seven regions, measured at supplier level into ink formulation. It maps migration exclusion lists, biocidal product regulation and photoinitiator supply concentration against supplier capability, treating regulatory listing rather than performance as the binding competitive variable. Competitive analysis covers 20 participants evaluated on additive revenue into ink manufacture, with moat and risk assessment for the two leaders. Digital printing conversion is modelled against additive intensity, and input cost exposure runs from acrylate and amine intermediates to reformulation-locked pricing. Four quantified revenue levers close the analysis.
Six-function segment sizing with segment-level growth rates
Seven-region share and growth breakdown to 2036
Twenty-participant competitive map on one revenue basis
Migration listing coverage mapped across supplier product ranges
Input cost exposure traced to acrylate and amine intermediates
Four quantified revenue levers with commercial impact ranges

Built For The People Who Decide

From boardroom strategy to bench-side execution, this report is read cover-to-cover by leaders shaping the next decade of their industry, turning demand scenarios, market dynamics and valuation benchmarks into decisions.
CXOs/ Presidents/ VPs/ Managers
M&A and Corporate Development
Strategy Teams and R&D Heads
Procurement and Product Directors
Regulatory and Compliance Leaders
Investor Relations and Equity Analysts