Market Minds Advisory
Infertility Drugs Market

Infertility Drugs Market: The Cycle Is Priced, the Drug Is Not

Gonadotrophins account for a modest share of what a patient pays for a treatment cycle, yet drug choice determines whether that cycle succeeds and whether the patient can afford a second one.

Lead Analyst

Alice Ballenger

Published

September 2026

Make Smarter Decisions with Customized Research Insights

Request a free sample report and evaluate market opportunities, growth trends, and competitive dynamics relevant to your business needs.

2025 MARKET VALUE$4.9BMarket Size 2025
2036 FORECAST VALUE$11.9BBase Case , 2026 to 2036
CAGR 2026 TO 20368.4 %Bull 9.6% / Bear 7.2%
INCREMENTAL OPPORTUNITY$6.6BNet 10- year value creation
EXPANSION MULTIPLE2.24x2036 value over 2026 base
Strategic Levers
M&A Pipeline
Regional Outlook
Country Rankings
Competitive Intelligence
Segmental Deep-dive
Call-Us : 91 93563 13602

Executive Snapshot and Market Trajectory

Drugs are roughly 31% of what an assisted reproduction cycle costs a patient, and almost all of the clinical variability. Dosing protocol and product selection determine oocyte yield, cancellation rates, and whether a patient reaches transfer at all, which is why prescribing stays clinic-led rather than payer-led in most markets.
Growth runs at 8.4% and the shift is toward biosimilars. Biosimilar follitropin products grow at 12.6%, exactly 1.50 times the market rate, as originator patents lapse and self-pay patients respond to price in a way insured patients rarely do. East Asia holds the largest share at 30%, on Chinese and Japanese cycle volume rather than on pricing. Manufacturing difficulty rather than regulation has kept biosimilar entry unusually slow here. Discounts stay modest as a result.
Concentration is high at 71% across the top five measured on annual treatment cycles supplied, and it reflects genuine manufacturing difficulty rather than commercial position. Recombinant gonadotrophins are complex biologics requiring cell culture capability few companies hold, which is exactly why biosimilar entry has taken far longer here than in most therapeutic areas. European tendering keeps compressing prices where volume is most predictable. Indian and Chinese capability is being built now.
Market Definition
This market covers pharmaceutical products used to induce ovulation and support assisted reproduction cycles, spanning recombinant follicle stimulating hormone products, urinary-derived gonadotrophin preparations, biosimilar follitropin products, gonadotrophin-releasing hormone agonists and antagonists, and oral ovulation induction agents. Assisted reproduction laboratory consumables, culture media, cryopreservation supplies, diagnostic testing, clinic service fees, and male fertility treatments outside ovulation induction fall outside scope.
Base Year Value
$4.9B in 2025 (MMA Primary Research Dataset, August 2026)
Forecast Period
2026 to 2036, eleven discrete annual values
CAGR
8.4% base case. Bull 9.6%. Bear 7.2%.
Fastest Growth Segment
Biosimilar Follitropin Products: 12.6% CAGR
Fastest Growth Country
India: 11.2% CAGR
Fastest Growth Region
South Asia and Pacific: 10.6% CAGR
Largest Region
East Asia: 30% of 2025 global value
Market Leaders
Merck KGaA, Organon, Ferring Pharmaceuticals, IBSA Institut Biochimique, Livzon Pharmaceutical. Source: MMA Analysis based on company annual reports.
Primary Survey
n=3,800 procurement and R&D decision-makers, Q4 2025, six countries
Methodology
Demand-side build-up, cross-validated against public data, 47 expert interviews

Infertility Drugs Market Forecast Scenarios

infertility-drugs-market-size-forecast-scenario-1787300399272
The 2020 to 2025 period ran at 7.2% and clinic access rather than drug innovation set the pace. Assisted reproduction cycles were postponed heavily through 2020 and 2021, then rebounded above trend as backlogs cleared. Chinese provincial insurance coverage of assisted reproduction, introduced across several provinces from 2023, added cycle volume faster than any product launch did. Biosimilar entry began but remained small through the period.
Three mechanisms carry the 8.4% base case. Public and insurance coverage expansion is the largest, since assisted reproduction moves from self-pay to reimbursed status one jurisdiction at a time and volume follows immediately. Biosimilar price competition is the second, which lowers the cost of a cycle and expands the treatable population. And later maternal age across most high-income countries is the third, mechanically raising cycles per pregnancy. None of the three depends on a new molecule reaching approval.
The 9.6% bull case rests on broader Chinese and Indian public reimbursement, where cycle volume responds to coverage far more sharply than in already-covered markets. The 7.2% bear case is biosimilar price erosion outrunning volume growth, which would expand treated patients while contracting the value of the market measured in revenue rather than in cycles supplied.

Where the Money Actually Goes

Drugs are about 31% of what a patient pays for an assisted reproduction cycle. Clinic fees, laboratory work, monitoring, and the retrieval procedure carry the rest. That ratio explains a great deal about how this market behaves, because a clinic optimising for pregnancy rates will not switch to save part of a third of the bill, and payers negotiating cycle bundles rarely examine the drug line.
DRUG SHARE OF CYCLE31%Of what a patient pays for a full treatment cycle
TOP FIVE CONCENTRATION71%High, reflecting biologic manufacturing difficulty rather than commercial position
SELF-PAY PATIENT SHARE58%Of cycles funded privately rather than by any payer
BIOSIMILAR PRICE DISCOUNT34%Against originator recombinant products at broadly comparable dosing levels
CYCLE CANCELLATION RATE9%Before retrieval, driven substantially by poor stimulation response
CYCLES PER LIVE BIRTH2.4Averaged across age bands, rising sharply with maternal age
What the drug does control is clinical variability. Stimulation protocol and product choice drive oocyte yield, and roughly 9% of cycles are cancelled before retrieval on poor response. A cancelled cycle costs the patient the full clinic fee for nothing, so the drug carrying 31% of cost carries considerably more than 31% of the outcome risk. Prescribing consequently stays with the clinician, and clinical evidence rather than price moves share.
The counterweight is that 58% of cycles worldwide are funded by the patient directly. Self-pay patients behave nothing like insured ones: they price-compare, they ration cycles against savings, and a 34% biosimilar discount changes whether they attempt a second attempt at all. That is the mechanism pulling biosimilar growth well above the market, and it works hardest exactly where coverage is thinnest.
"Clinicians tell me they choose on evidence, and they mostly do. Then a patient asks what a second cycle would cost if the first one fails, and suddenly the biosimilar conversation happens in the same appointment."
Director, Reproductive Health and Specialty Pharmaceuticals Practice · MMA Healt

Market Trends

Biosimilar Follitropins Reach Genuine Commercial Scale

Originator recombinant follicle stimulating hormone patents have lapsed across most major markets, and biosimilar follitropins now compete at discounts near 34% with clinical data clinics accept. Growth runs at 12.6% against 8.4% for the market. Entry took far longer here than in other biologic categories because cell culture manufacturing for gonadotrophins is genuinely difficult, which is also why the discount is more modest than biosimilar entry produces in simpler molecules and why few new entrants have followed. Tendered European health systems convert approval into share considerably faster than clinic-led prescribing does. Self-pay markets move more slowly.
Market Impact: Averages 2.4 cycles per birth

Public Coverage Converts Self-Pay Demand Into Volume

Assisted reproduction is moving from self-pay to reimbursed status jurisdiction by jurisdiction, with Chinese provincial schemes from 2023 the largest single addition to global cycle volume in a decade. Coverage changes behaviour immediately rather than gradually, because patients who had been rationing cycles against savings attempt treatment as soon as the financial obstacle lifts. Around 58% of cycles remain self-pay globally, which is the headroom that makes each new coverage decision commercially significant. Japanese national coverage from 2022 produced a comparable step change in a smaller population. Suppliers positioned before a decision capture that volume.
Market Impact: Cuts cancellation below 9%

Market Opportunities and Growth Drivers

Later Maternal Age Raises Cycles Per Pregnancy

Average maternal age at first birth has risen across essentially every high-income country and across urban populations in middle-income ones, and ovarian response declines with age in a way no protocol fully compensates for. Cycles per live birth average around 2.4 and rise sharply above age thirty-eight, so an ageing patient population increases drug volume mechanically without any change in the number of people seeking treatment. This driver compounds slowly and reverses very rarely. It also raises the share of cycles requiring higher gonadotrophin doses to achieve adequate response. Poor responder populations grow alongside.
Market Impact: Roughly 58% of cycles self-pay

Antagonist Protocols Shorten Treatment And Reduce Risk

Gonadotrophin-releasing hormone antagonist protocols have displaced longer agonist regimens across most clinics because they shorten stimulation, cut ovarian hyperstimulation syndrome risk substantially, and allow a trigger that reduces it further. Shorter protocols use less total gonadotrophin per cycle, which pulls against revenue growth, but they also reduce cancellation below the roughly 9% average and improve patient tolerance enough that repeat cycles become more likely rather than less. Clinics adopting antagonist protocols therefore trade volume per cycle against a better safety profile. A serious adverse event ends the cycle and damages clinic reputation. Nurse training on devices reinforces the switch.
Market Impact: Concentration remains at 71%

Market Restraints and Challenges

Self-Pay Cost Rations Treatment More Than Clinical Need

Around 58% of cycles are funded by patients directly, and treatment decisions consequently follow household finances rather than clinical indication in a large share of cases. The root cause is that assisted reproduction sits outside standard benefit design in most health systems, being classified as elective. Commercial impact is a treatable population far larger than the treated one. Mitigation runs through biosimilar pricing at discounts near 34%, patient financing programmes, and the slow jurisdiction-by-jurisdiction expansion of public coverage. Employer fertility benefits have widened access in North America without closing the gap.
Market Impact: Biosimilars growing at 12.6%

Gonadotrophin Manufacturing Difficulty Limits Competitive Entry Here

Recombinant gonadotrophins require mammalian cell culture, complex glycosylation control, and analytical characterisation that few manufacturers hold, which is why concentration sits at 71% long after patent expiry. The root cause is biological complexity rather than any regulatory obstacle. Commercial impact is discounts near 34% where simpler biosimilars deliver considerably more, so cost relief to patients is limited. Mitigation is slow: capability is being built in India and China, and each new entrant takes years to qualify. Each new entrant requires years of qualification before supplying any market at scale. Cost relief to self-pay patients is correspondingly limited.
Market Impact: About 58% of cycles self-pay
3 additional market trends, 4 additional growth drivers, and 2 additional restraints and challenges are covered in the full report. Contact sales@marketmindsadvisory.com to access the complete intelligence.

Segment CAGR and Growth Architecture

Segmentation follows product class and molecular source, because those determine manufacturing route, regulatory pathway, pricing position, and the clinical role each product plays inside a stimulation protocol. Treatment indication and patient age band both cut across every product class rather than separating them, which makes either a considerably weaker primary dimension here. Manufacturing route decides the pricing position outright here.
infertility-drugs-market-market-share-analysis-1787300399801

Biosimilar Follitropin Products

The fastest class at 12.6%, exactly 1.50 times the market rate, and the only one whose growth comes from price rather than from volume expansion. Discounts near 34% against originator recombinant products change what a self-pay patient can attempt, and around 58% of cycles worldwide are self-pay. Clinical acceptance took time and is now broadly settled in most markets. Entry remains limited because gonadotrophin cell culture manufacturing is difficult, which keeps discounts more modest than biosimilar competition delivers in simpler biologic categories. Tendered European health systems convert approval into share far faster than clinic-led prescribing markets do. Supply reliability matters more than price to most clinics, since a stimulation cycle cannot be paused. Uptake reflects that.
CAGR 12.6%

Gonadotrophin-Releasing Hormone Antagonists

Second fastest at 10.2%, displacing longer agonist regimens across most clinics on protocol duration and safety rather than on cost. Antagonists shorten stimulation, cut ovarian hyperstimulation syndrome risk substantially, and permit a trigger that reduces it further, which matters enormously in a treatment where a serious adverse event ends the cycle and damages clinic reputation. Total gonadotrophin consumption per cycle falls under these protocols, so the class grows while reducing volume elsewhere. Patient tolerance improves enough that repeat cycles become more likely. Nurse training and clinic protocol standardisation both reinforce the switch once it has been made. Protocol amendment requires an internal clinical review that a supplier discount alone very rarely justifies on its own.
CAGR 10.2%
Full segment breakdown across 5 segments available in the complete report.

Regional Architecture and Country Demand Map

East Asia leads at 30% on Chinese and Japanese cycle volume and recent provincial reimbursement rather than on pricing. Western Europe follows on established public coverage, ahead of North America where self-pay dominates. South Asia and Pacific grows fastest on Indian cycle expansion. Payer channel governs price sensitivity everywhere.

East Asia

Thirty percent, the largest share, and cycle volume rather than pricing carries it. China performs assisted reproduction cycles at a scale no other country approaches, and provincial insurance coverage introduced across several provinces from 2023 added volume faster than any product launch has. Japanese national coverage from 2022 produced a similar step change in a smaller population. Domestic Chinese manufacturers hold meaningful gonadotrophin capability, which keeps pricing lower than Western equivalents. Growth at 9.4% runs above the market rate, driven by continued coverage expansion rather than by demographic change. Biosimilar uptake is correspondingly higher than in Western self-pay markets across most provinces. Cycle volume rather than price per cycle carries the regional figure.
Share: 30% | CAGR: 9.4% (2026 to 2036)

Western Europe

Public coverage established decades ago explains this 23% far more than population size does. Belgian, French, Dutch, and Nordic systems fund defined cycle numbers, which produces stable predictable volume and correspondingly disciplined pricing through tender and reference mechanisms. Biosimilar uptake has been quicker here than in self-pay markets because procurement decisions sit with health systems rather than with patients. That same tendering caps revenue growth. Growth at 6.8% is the slowest here, reflecting mature coverage and steady price pressure rather than any volume weakness. Cross-border treatment travel toward Eastern European clinics also removes some domestic volume from these figures. Evidence depth defends prescribing choice here far better than it defends any tender outcome.
Share: 23% | CAGR: 6.8% (2026 to 2036)
Regional intelligence for 5 additional markets available in the complete report: North America, South Asia and Pacific, Latin America, Middle East and Africa, Eastern Europe. Contact sales@marketmindsadvisory.com.
infertility-drugs-market-country-cagr-analysis-1787300400337

Winning Where the Patient Pays

Drugs are 31% of cycle cost, 58% of cycles are self-pay, biosimilars discount near 34%, and roughly 9% of cycles cancel before retrieval. Value comes from selling on cancellation avoided rather than on price, from following coverage decisions early, and from pricing for a second cycle. Payer channel decides which of those arguments actually lands.

Sell On Cancellation Avoided Not On Price

Drugs carry about 31% of cycle cost and considerably more than 31% of outcome risk, since roughly 9% of cycles are cancelled before retrieval on poor stimulation response and a cancelled cycle costs the patient the entire clinic fee for nothing. Evidence that a product or protocol lowers cancellation is worth far more to a clinic than any discount, because the clinic is measured on live birth rates. Commercial arguments built on price alone lose to arguments built on response. Supply reliability sits alongside response, since a stimulation cycle cannot be paused mid-course.
Market Impact: Cancellation runs near 9% of all treatment cycles

Move Early On Every Coverage Decision

Cycle volume responds to reimbursement immediately rather than gradually, as Chinese provincial schemes from 2023 and Japanese national coverage from 2022 both demonstrated. Around 58% of cycles remain self-pay globally, so each new coverage decision converts a rationed population into a treated one within months. Suppliers positioned with formulary listing, clinic relationships, and supply ahead of the decision capture that step change, and those reacting afterward find allocations already settled. Japanese national coverage from 2022 and Chinese provincial schemes both moved volume within months. Formulary listing ahead of the decision is what captures it.
Market Impact: Around 58% of all cycles are still self-pay

Price For The Second Cycle Not The First

Cycles per live birth average around 2.4 and rise sharply with maternal age, so a self-pay patient is nearly always deciding whether they can afford another attempt rather than a first one. Pricing and patient support programmes built around a course of treatment rather than a single cycle change whether that second attempt happens, and biosimilar discounts near 34% work through exactly this mechanism. Suppliers pricing per vial rather than per course miss where the decision is actually made. Patient financing programmes work through the same mechanism as price does.
Market Impact: Treatment averages 2.4 cycles for each live birth

Build Manufacturing Capability Where Entry Is Hard

Concentration sits at 71% long after patent expiry because recombinant gonadotrophin manufacture demands mammalian cell culture and glycosylation control few companies hold, which is why biosimilar discounts near 34% are modest against what simpler biologics deliver. That difficulty is a durable position for anyone who achieves it, and qualification takes years rather than months. Capability being built in India and China will erode the position eventually, and slowly enough that investment now still returns. Glycosylation control and analytical characterisation are where most attempts stall rather than in regulation. Continuous campaign running compounds the cost advantage further.
Market Impact: Concentration holds at 71% well after patent expiry

Who Controls the Margin Pool

Concentration is high at 71% across the top five measured on annual treatment cycles supplied, and it has held there long after originator patents lapsed. That persistence is manufacturing rather than commercial: recombinant gonadotrophins need mammalian cell culture, glycosylation control, and analytical characterisation that very few companies possess. The leader to challenger gap is wide and stable, and challengers arrive through years of capability building rather than through any commercial
Competitive activity concentrates on three fronts. Clinical evidence in defined patient populations is the first, particularly poor responders and advanced maternal age where differentiation is genuinely possible. Injection device usability is the second, since patients self-administer over several days and adherence affects outcome. And supply reliability is the third, which matters enormously because a stimulation cycle interrupted by stockout cannot simply be paused.

Pressure comes from two directions. Indian and Chinese manufacturers are building gonadotrophin capability and will compete on price where prescribing is patient-influenced. And European tendering keeps compressing prices in exactly the markets where volume is most predictable. Employer benefit administrators are also emerging as a distinct buyer asking cost-per-live-birth questions clinics never faced.

Rankings shift on reimbursement decisions rather than on launches.
infertility-drugs-market-company-positioning-matrix-1787300400859

Competitive Moat and Risk Dimensions

MERCK KGAA

Moat: Manufacturing depth and clinical evidence

Decades of recombinant gonadotrophin manufacturing experience combined with the largest clinical evidence base in defined patient populations creates a position that new entrants cannot assemble quickly. Cell culture capability, glycosylation consistency, and regulatory files across dozens of markets each take years. Clinics prescribing on evidence rather than price are the customer this depth serves directly.
MERCK KGAA

Risk: European tendering compresses core markets

Health systems funding defined cycle numbers procure through tender and reference pricing, which erodes price in precisely the markets where volume is most predictable and where the evidence advantage should command most. Biosimilar competitors need only clinical acceptability to win those tenders. Evidence depth defends prescribing choice far better than it defends procurement outcomes.
ORGANON

Moat: Established reproductive health portfolio

A portfolio spanning gonadotrophins, antagonists, and adjacent reproductive health products lets a supplier serve a clinic across a whole stimulation protocol rather than a single product line. Clinics value consistency of supply and single-supplier relationships during protocols where interruption ends a cycle. That breadth also supports evidence generation across combinations that single-product competitors cannot study.
ORGANON

Risk: Portfolio exposure to biosimilar erosion

A broad established portfolio carries broad exposure once biosimilars reach clinical acceptance across multiple product lines at once, and discounts near 34% apply across the range rather than to one product. Defending several positions simultaneously stretches commercial resource. Breadth that helps in clinic relationships works against a company during a pricing transition.

Key Players

Merck KGaA
Organon
Ferring Pharmaceuticals
IBSA Institut Biochimique
Livzon Pharmaceutical

Others

Bharat Serums and Vaccines
Sun Pharmaceutical Industries
Cipla
Intas Pharmaceuticals
LG Chem
Teva Pharmaceutical Industries
Gedeon Richter
Hangzhou Jiuyuan Gene Engineering
GenSci
Finox Biotech
Sanofi
Fresenius Kabi
Zydus Lifesciences
Emcure Pharmaceuticals
Julphar

Recent Developments

JANUARY 2025

Additional Chinese provinces add assisted reproduction to insurance

Further Chinese provincial health insurance schemes added assisted reproduction cycles to covered benefits, extending coverage introduced elsewhere from 2023 and converting self-pay demand into reimbursed volume. The change was a public reimbursement decision rather than any commercial agreement, joint venture, or acquisition involving pharmaceutical suppliers.
Signal: Coverage decisions move cycle volume within months, far faster than any product launch achieves in this market.
APRIL 2025

Biosimilar follitropin secures approval in additional markets

A biosimilar follicle stimulating hormone product received regulatory approval across several additional national markets, extending price competition into territories where only originator products had been available. The approval was a regulatory decision rather than any licensing arrangement, joint venture, or acquisition between the companies concerned.
Signal: Biosimilar geography expands slowly because manufacturing qualification rather than regulation sets the pace for new entrants.
AUGUST 2025

Indian manufacturer commissions gonadotrophin cell culture capacity

An Indian pharmaceutical manufacturer commissioned dedicated mammalian cell culture capacity for recombinant gonadotrophin production, targeting domestic supply and export into price-sensitive markets. The investment was organic capital expenditure rather than any joint venture, acquisition, or technology licensing arrangement with an established producer. Qualification is expected to take several years.
Signal: Capability being built where entry has been hardest will erode concentration over several years rather than months.

Cell Culture, Fill Finish and Cold Chain

Cell culture and upstream biologic production carry roughly 38% of cost of goods sold, with media, single-use bioreactor consumables, and purification resins the dominant inputs, sourced largely from a small set of specialist suppliers in the United States and Western Europe. Fill finish and device assembly add about 24%, cold chain distribution near 15%, quality and analytical release around 12%, and the balance sits in overheads.
Single-use bioreactor consumables and purification resins were subject to severe allocation through 2021 and 2022 as biologic manufacturing capacity was redirected, and several biologic producers disclosed the resulting cost increases and scheduling difficulty in annual filings for those years. Availability has since improved. Cold chain distribution cost rose alongside and has not fully retreated, since air freight capacity for temperature-controlled pharmaceutical shipments remains tight on several routes.

The competitive disadvantage mechanism runs through scale in cell culture rather than through input purchasing. Producers running large continuous campaigns spread fixed bioreactor and release testing cost across far more units than those running intermittently, and the difference is substantial in a product with high quality overhead. Geography compounds it, since European energy and labour cost for biologic manufacture sits persistently above Indian and Chinese equivalents.
infertility-drugs-market-cost-volatility-analysis-1787300401053

Run continuous campaigns rather than intermittent batches

Fixed bioreactor, cleaning, and analytical release cost spreads across whatever volume a campaign produces, so intermittent production carries a per-unit penalty that no purchasing improvement offsets. Producers holding sufficient demand to run continuously hold a cost position competitors cannot match through sourcing. Campaign planning against forecast reimbursement decisions rather than against historical orders is what makes continuity achievable.

Qualify second sources for resins and single-use consumables

Purification resins and single-use bioreactor components sit with a small number of specialist suppliers, and allocation through 2021 and 2022 demonstrated how quickly that concentration becomes a production constraint. Qualifying alternative sources costs time and regulatory work rather than money. Producers who did it during the disruption now carry supply flexibility that those who waited for normalisation simply do not.

Design devices to reduce cold chain shipment volume

Cold chain distribution carries around 15% of cost of goods sold and prices against temperature-controlled air freight capacity that remains tight on several routes. Pen and cartridge formats that concentrate more doses per shipped volume reduce that exposure directly, and they improve patient adherence over a multi-day self-administered course. The device investment returns through both distribution cost and clinical outcome.

Portfolio Architecture for Margin Defence

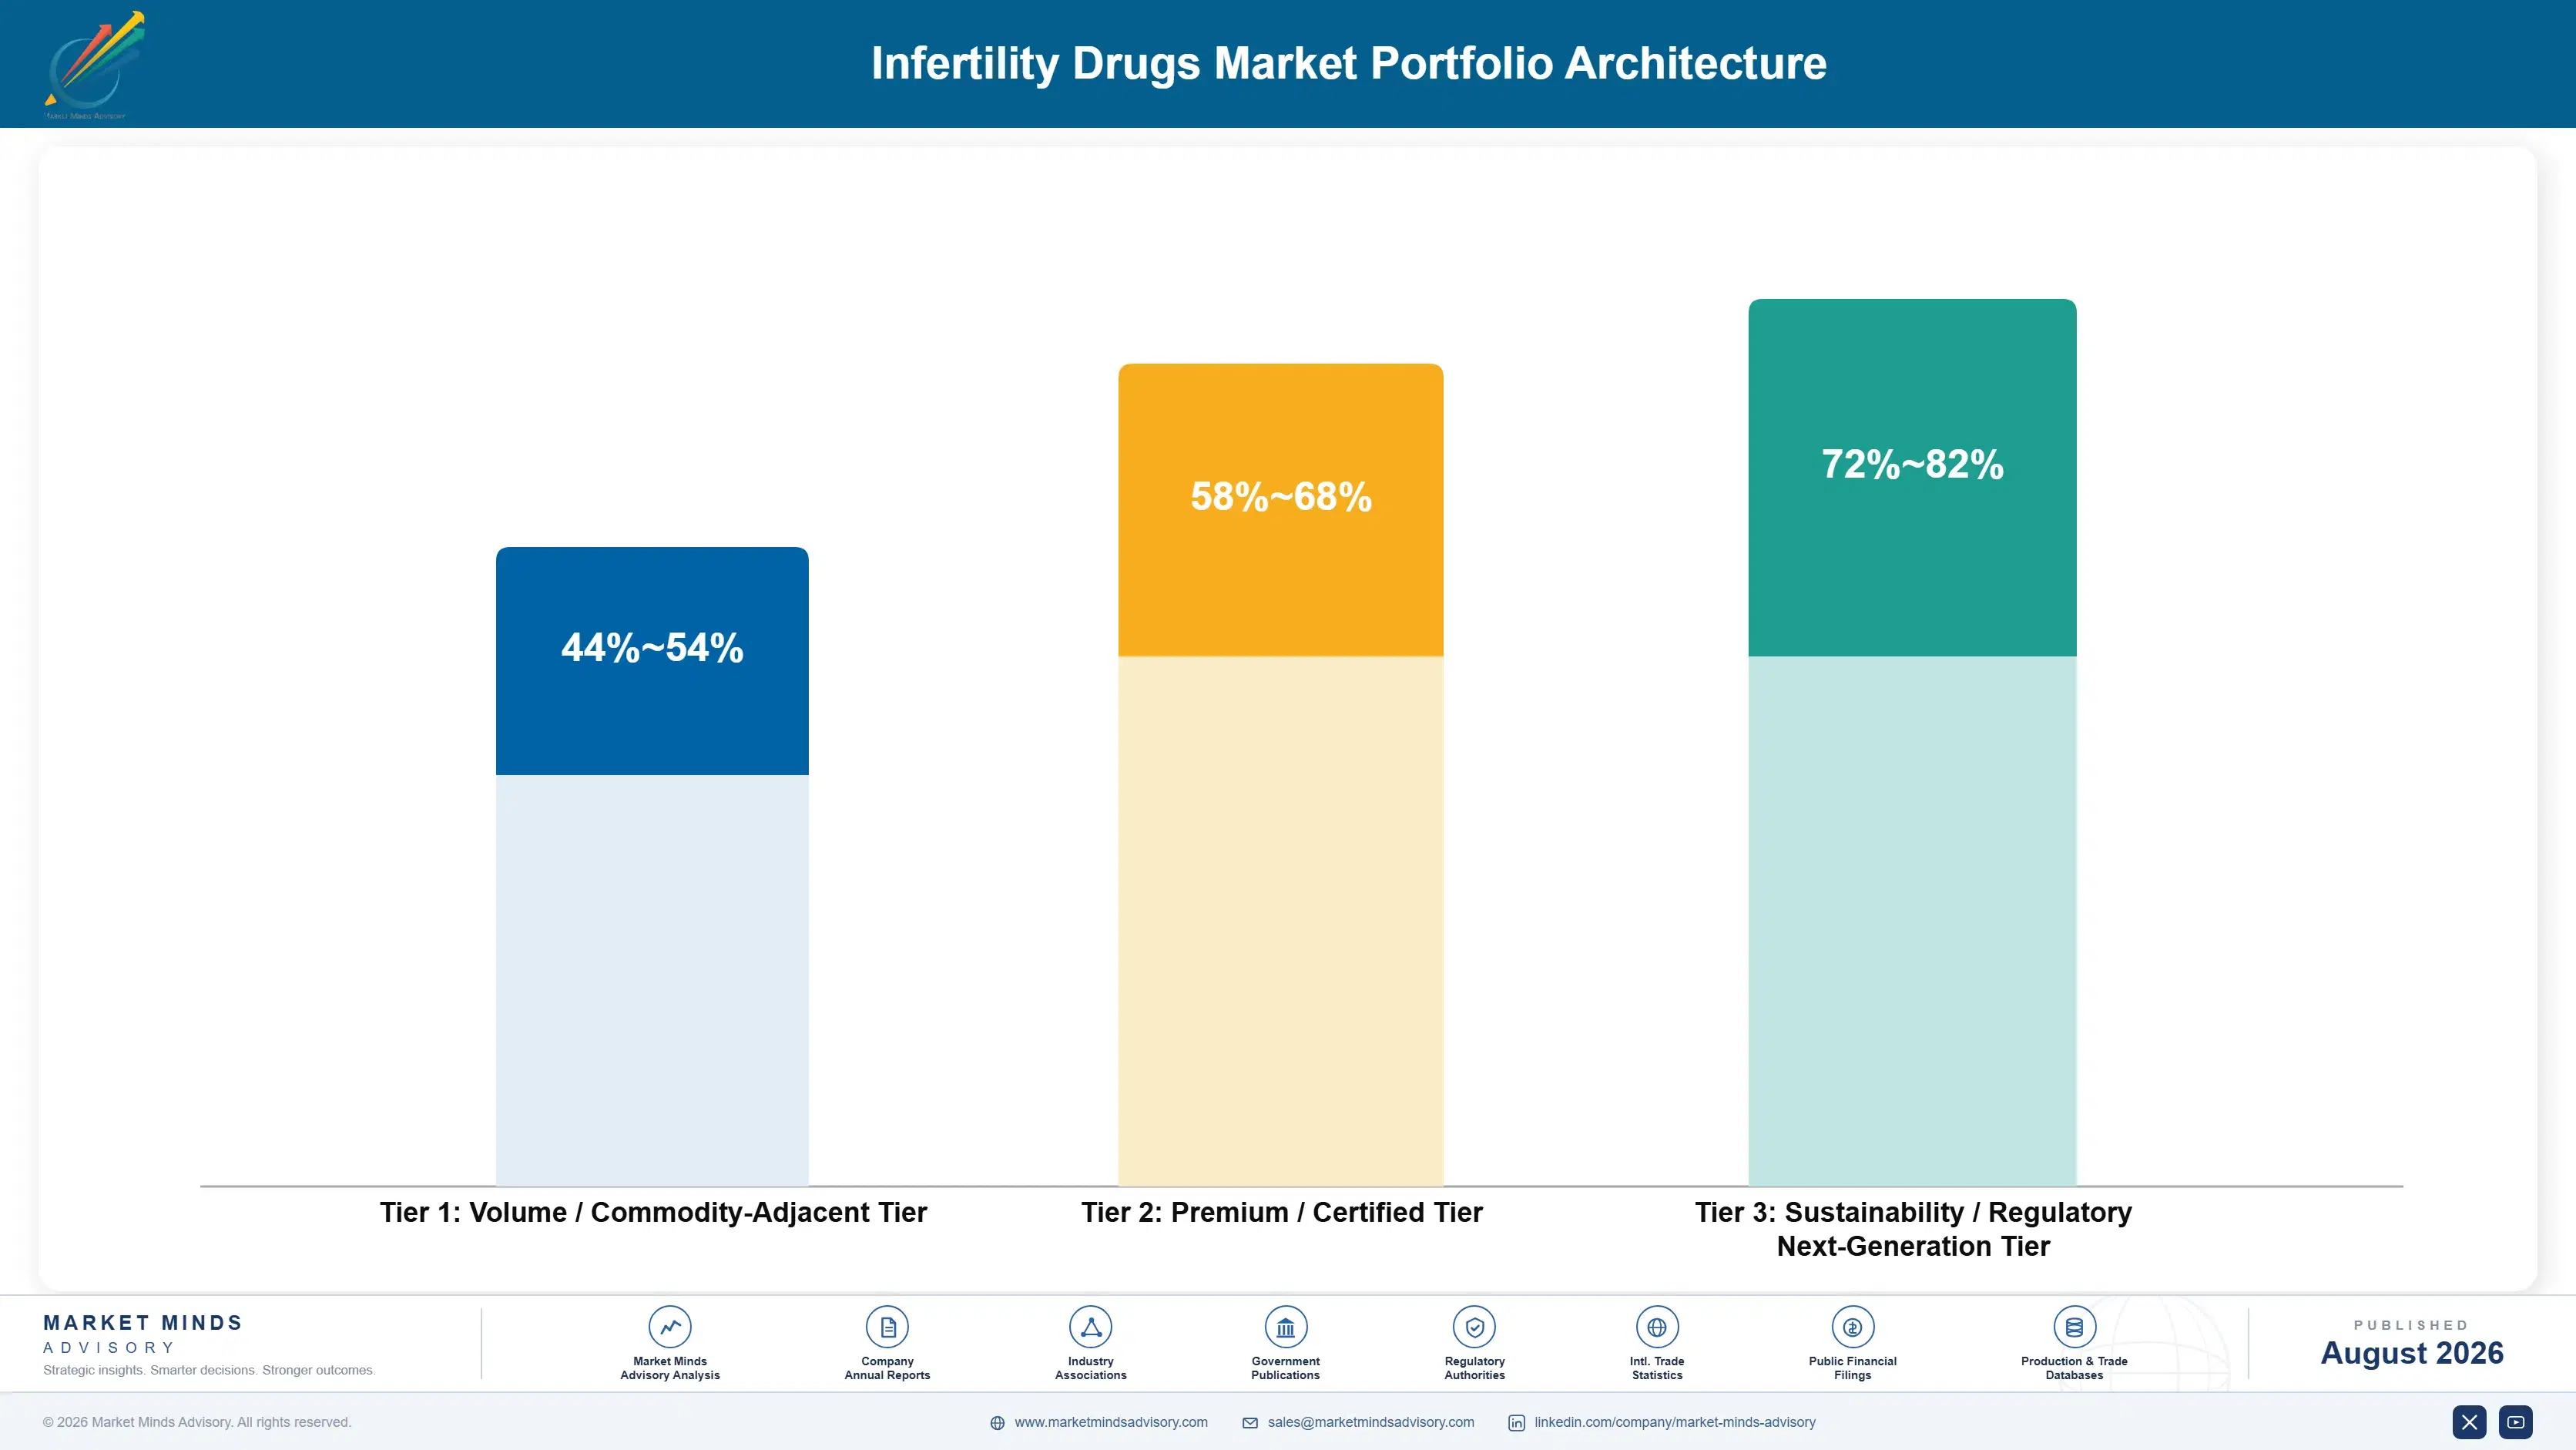
Three tiers describe this business and the spread reflects manufacturing difficulty far more than clinical value. Urinary-derived preparations and oral agents sit at the bottom, cheap to make and priced accordingly, holding volume mainly in price-sensitive self-pay markets. Biosimilar follitropins occupy the middle, discounting near 34% while still requiring cell culture capability. Originator recombinant products and antagonists sit at the top on evidence and manufacturing scarcity together.
The tension is between volume and price in a market where 58% of patients pay directly. A supplier holding originator pricing serves clinics prescribing on evidence and cedes the self-pay patient rationing a second cycle. One competing on biosimilar price reaches that patient and cannot fund the evidence generation that moves clinical practice. Companies holding both positions manage the conflict through geography rather than through segmentation.

High-value pools concentrate where clinical differentiation is genuinely demonstrable. Poor responders and advanced maternal age patients are the clearest case, since stimulation response varies most there and clinics will pay for evidence. Antagonist protocols pool value similarly, since safety in a treatment where an adverse event ends the cycle is not price-compared. Both pools resist tender pressure better than commodity classes.

Volume / Commodity-Adjacent Tier

Urinary-derived gonadotrophin preparations and oral ovulation induction agents, inexpensive to manufacture and priced accordingly. Volume concentrates in price-sensitive self-pay markets where the roughly 58% paying directly cannot reach recombinant pricing at all.
Gross Margin: 44-54%

Premium / Certified Tier

Biosimilar follitropins discounting near 34% against originator products while still requiring mammalian cell culture capability few companies hold. Margin sits well below originator levels and well above urinary preparations, and manufacturing scarcity keeps discounts modest.
Gross Margin: 58-68%

Sustainability / Regulatory / Next-Generation Tier

Originator recombinant products and antagonist protocols priced on clinical evidence and manufacturing scarcity together. Best margin by a clear distance, defended by evidence in poor responder and advanced maternal age populations rather than by any patent position.
Gross Margin: 72-82%
infertility-drugs-market-portfolio-architecture-1787300401702

High-value Sub-segments and Strategic Watch-out

Biosimilar Follitropin Products

Fastest growth at 12.6%, exactly 1.50 times the market rate, driven by price rather than volume expansion. Discounts near 34% change what a self-pay patient can attempt, and manufacturing difficulty keeps entry limited and discounts modest against simpler biologics. Tendered markets convert approval into share fastest.
Gross Margin: 58-68%

Antagonist Protocol Products

Strong growth at 10.2% on protocol duration and hyperstimulation safety rather than on cost. Total gonadotrophin consumption falls under these protocols, so the class grows while reducing volume elsewhere across the same treatment cycle. Clinic protocol standardisation makes the position unusually durable. Nurse device training reinforces it further.
Gross Margin: 72-82%

Urinary-Derived Preparation Volume

The volume core in price-sensitive markets, inexpensive to manufacture and holding share where recombinant pricing is simply unreachable for self-pay patients. Clinical preference favours recombinant products wherever affordability allows, which caps the long-term position. Volume holds wherever self-pay affordability rather than clinical preference governs the choice entirely.
Gross Margin: 44-54%

Tendered European Volume

The strategic watch-out, since health systems funding defined cycle numbers procure on price and biosimilar entrants need only clinical acceptability to win. Evidence depth defends prescribing choice considerably better than it defends any procurement outcome. Biosimilar entrants need only clinical acceptability to win those awards.
Gross Margin: 58-68%

Cycles, Courses and Coverage

Revenue arrives per cycle rather than per patient, and the distinction matters because cycles per live birth average around 2.4 and rise sharply with maternal age. A patient reaching a live birth on the first attempt generates a third of the revenue of one requiring three cycles, which produces the uncomfortable position that commercial performance and clinical success pull in different directions. Coverage decisions rather than demographics govern how many cycles get attempted.
Stickiness runs through clinic protocol rather than through patient preference, since patients rarely select their own stimulation products. A clinic that has standardised a protocol, trained nurses on a device, and accumulated its own outcome data will not switch for a modest discount, because protocol change disrupts the outcome statistics the clinic is judged on. Tendered health systems behave in the opposite way and switch readily on price.

Buyer profiles shifted as employer fertility benefits expanded and public coverage spread. The decision maker was the patient's household budget. It is increasingly a benefit administrator or a health system procurement function, and those buyers ask entirely different questions. Cost per live birth rather than cost per cycle is the metric those buyers apply.
infertility-drugs-market-end-use-penetration-index-1787300402309

What We Would Tell a Board

These are among the four positions where our research anticipates prominent divergence between winners and laggards over the coming forecast period. Each is grounded in the demand model, the regulatory perimeter, and the announced capacity pipeline.
01 / CLINICAL EVIDENCE FOCUS

Compete on cancelled cycles, not on price per vial

Drugs carry about 31% of cycle cost and considerably more than 31% of the outcome risk, since roughly 9% of cycles are cancelled before retrieval on poor stimulation response and a cancellation costs the patient an entire clinic fee for nothing. Evidence that a product or protocol reduces cancellation is worth far more to a clinic than a discount, because clinics are measured on live birth rates. Commercial arguments built on price alone consistently lose to arguments built on response.
02 / REIMBURSEMENT DECISION TIMING

Position before the coverage decision, not after it

Cycle volume responds to reimbursement within months rather than years, as Chinese provincial schemes from 2023 and Japanese national coverage from 2022 both demonstrated clearly enough to settle the point. Around 58% of cycles remain self-pay globally, so every single new coverage decision converts a rationed population into a treated one almost immediately. Suppliers holding formulary listing, clinic relationships, and reliable supply ahead of the decision capture that step change in full, while those reacting afterward find allocations have already been settled.
03 / COURSE LEVEL PRICING

The decision is the second cycle, so price it

Cycles per live birth average around 2.4 and rise sharply with maternal age, which means a self-pay patient is almost always deciding whether they can afford another attempt rather than a first one. Pricing and support programmes built around a course of treatment rather than a single cycle change whether that second attempt happens at all. Biosimilar discounts near 34% work through exactly this mechanism, and suppliers pricing per vial rather than per course miss where the real decision is actually made.
04 / MANUFACTURING CAPABILITY INVESTMENT

Cell culture difficulty is the durable position here

Concentration sits at 71% long after originator patents lapsed, because recombinant gonadotrophin manufacture demands mammalian cell culture and glycosylation control that very few companies anywhere have ever managed to achieve. That manufacturing difficulty is precisely why biosimilar discounts near 34% look modest against what simpler biologic categories routinely deliver to payers elsewhere. Capability now being built in India and China will erode that position over years rather than months, and slowly enough that manufacturing investment made today still returns comfortably.

Engagement Snapshot From the Field

A live engagement with an industry participant carrying material or product regulatory and market exposure ahead of a defining policy shift, showing how our research translates into a defensible multi-year portfolio strategy.
MARKET MINDS ADVISORY · CLIENT ENGAGEMENT SUMMARY
Infertility Drugs Producer Strategic Portfolio Review and Transition Roadmap 2026·Investment Scenario on Infertility Drugs Exposure Evaluation 2025-26
CLIENT PROFILE
A specialty pharmaceutical company with approximately 340 million dollars in annual revenue (client-reported, unverified by MMA), holding an approved biosimilar follitropin and established commercial operations across three emerging market regions. Uptake had been well below internal projections in two of the three regions despite competitive pricing, and management had approved a further discount to correct it.
STRATEGIC CHALLENGE
The board questioned whether price was the obstacle, since the product already sat below originator pricing by a wide margin in every market. They wanted an independent read on why clinics were not converting before approving a discount that would take the product close to variable cost in the largest of the three regions.
MMA APPROACH
We surveyed prescribing clinicians across the three regions on product selection criteria, separating stated reasons from observed switching behaviour. Clinic protocol documentation was reviewed for how deeply products were embedded in standardised regimens. Supply reliability records were examined, and uptake was compared against markets where the product had performed to plan.
KEY FINDINGS
  1. Clinicians ranked stimulation response consistency and supply reliability well ahead of price, and price appeared as a leading criterion only among the most self-pay-exposed clinics.
  2. Two documented supply interruptions in the largest underperforming region had reached clinicians directly, and a stimulation cycle cannot be paused mid-course. Confidence recovered slowly afterward.
  3. Clinics with standardised written protocols showed markedly lower switching, since protocol amendment required internal review that a discount alone did not justify.
  4. The best performing region had no supply interruptions and a locally generated response dataset the other two regions had never commissioned at all.
CLIENT PROFILE
A specialty pharmaceutical company with approximately 340 million dollars in annual revenue (client-reported, unverified by MMA), holding an approved biosimilar follitropin and established commercial operations across three emerging market regions. Uptake had been well below internal projections in two of the three regions despite competitive pricing, and management had approved a further discount to correct it.
STRATEGIC CHALLENGE
The board questioned whether price was the obstacle, since the product already sat below originator pricing by a wide margin in every market. They wanted an independent read on why clinics were not converting before approving a discount that would take the product close to variable cost in the largest of the three regions.
MMA APPROACH
We surveyed prescribing clinicians across the three regions on product selection criteria, separating stated reasons from observed switching behaviour. Clinic protocol documentation was reviewed for how deeply products were embedded in standardised regimens. Supply reliability records were examined, and uptake was compared against markets where the product had performed to plan.
KEY FINDINGS
  1. Clinicians ranked stimulation response consistency and supply reliability well ahead of price, and price appeared as a leading criterion only among the most self-pay-exposed clinics.
  2. Two documented supply interruptions in the largest underperforming region had reached clinicians directly, and a stimulation cycle cannot be paused mid-course. Confidence recovered slowly afterward.
  3. Clinics with standardised written protocols showed markedly lower switching, since protocol amendment required internal review that a discount alone did not justify.
  4. The best performing region had no supply interruptions and a locally generated response dataset the other two regions had never commissioned at all.
RECOMMENDED STRATEGY
Phase 1: Phase 1 (months one to six): suspend the discount, resolve supply reliability in the affected region, and communicate corrected service levels to clinics. Phase 2: Phase 2 (months six to twenty-one): commission local stimulation response data in both underperforming regions to support protocol amendment. and clinic adoption. Phase 3: Phase 3 (months twenty-one to thirty-six): target clinics at protocol review points rather than pursuing broad discount-led conversion campaigns. across all three regions.
OUTCOME
The discount was suspended. Supply reliability was restored within two quarters and clinic uptake in the affected region improved materially once the local response dataset became available, while margin was preserved across all three regions through the period (client-reported, unverified by MMA). Pricing discipline held across the whole portfolio.

Frequently Asked Questions

Foundational context covering the market sizes, CAGR, scope, country, region and competition that inform every finding below. This section is provided to cover basics and most often pre-purchase conversations, answered from the MMA Primary Research Dataset.

What is the current size of the Infertility Drugs Market?

The market is valued at USD 4.9 billion in 2025, rising to USD 5.31 billion in 2026. Scope covers ovulation induction and assisted reproduction pharmaceuticals, not laboratory consumables, diagnostics, or clinic service fees.

How large will the Infertility Drugs Market be by 2036?

MMA forecasts USD 11.89 billion by 2036, an increase of USD 6.58 billion over the 2026 base. That represents an expansion multiple of 2.24 times across the forecast period.

What is the CAGR for the Infertility Drugs Market 2026 to 2036?

The base case CAGR is 8.4%, with a bull case of 9.6% and a bear case of 7.2%. The historical rate from 2020 to 2025 was 7.2%, set by clinic access rather than by product innovation.

Which segment is growing fastest?

Biosimilar follitropin products at 12.6%, exactly 1.50 times the market rate. Discounts near 34% change what a self-pay patient can attempt, and roughly 58% of cycles worldwide are self-pay.

Who are the major companies in the Infertility Drugs Market?

Merck KGaA, Organon, Ferring Pharmaceuticals, IBSA Institut Biochimique, and Livzon Pharmaceutical lead on annual treatment cycles supplied. The top five hold 71%, reflecting manufacturing difficulty rather than commercial position.

Which country is growing fastest?

India at 11.2%, where clinic networks are extending well beyond metropolitan centres and domestic manufacturers supply gonadotrophins at prices a self-pay middle-income population can actually reach.

Report Segmentation Architecture

The full report scope spans multiple orthogonal segmentation dimensions, with cross-tabulated demand data provided for each dimension pair. Coverage extends further to regional breakdowns, trend trajectories, and the competitive detail needed to support segment-level decision-making.

By Product Class And Source

  • Recombinant Follicle Stimulating Hormone Products
  • Urinary-Derived Gonadotrophin Preparations
  • Biosimilar Follitropin Products
  • Gonadotrophin-Releasing Hormone Agonists And Antagonists
  • Oral Ovulation Induction Agents

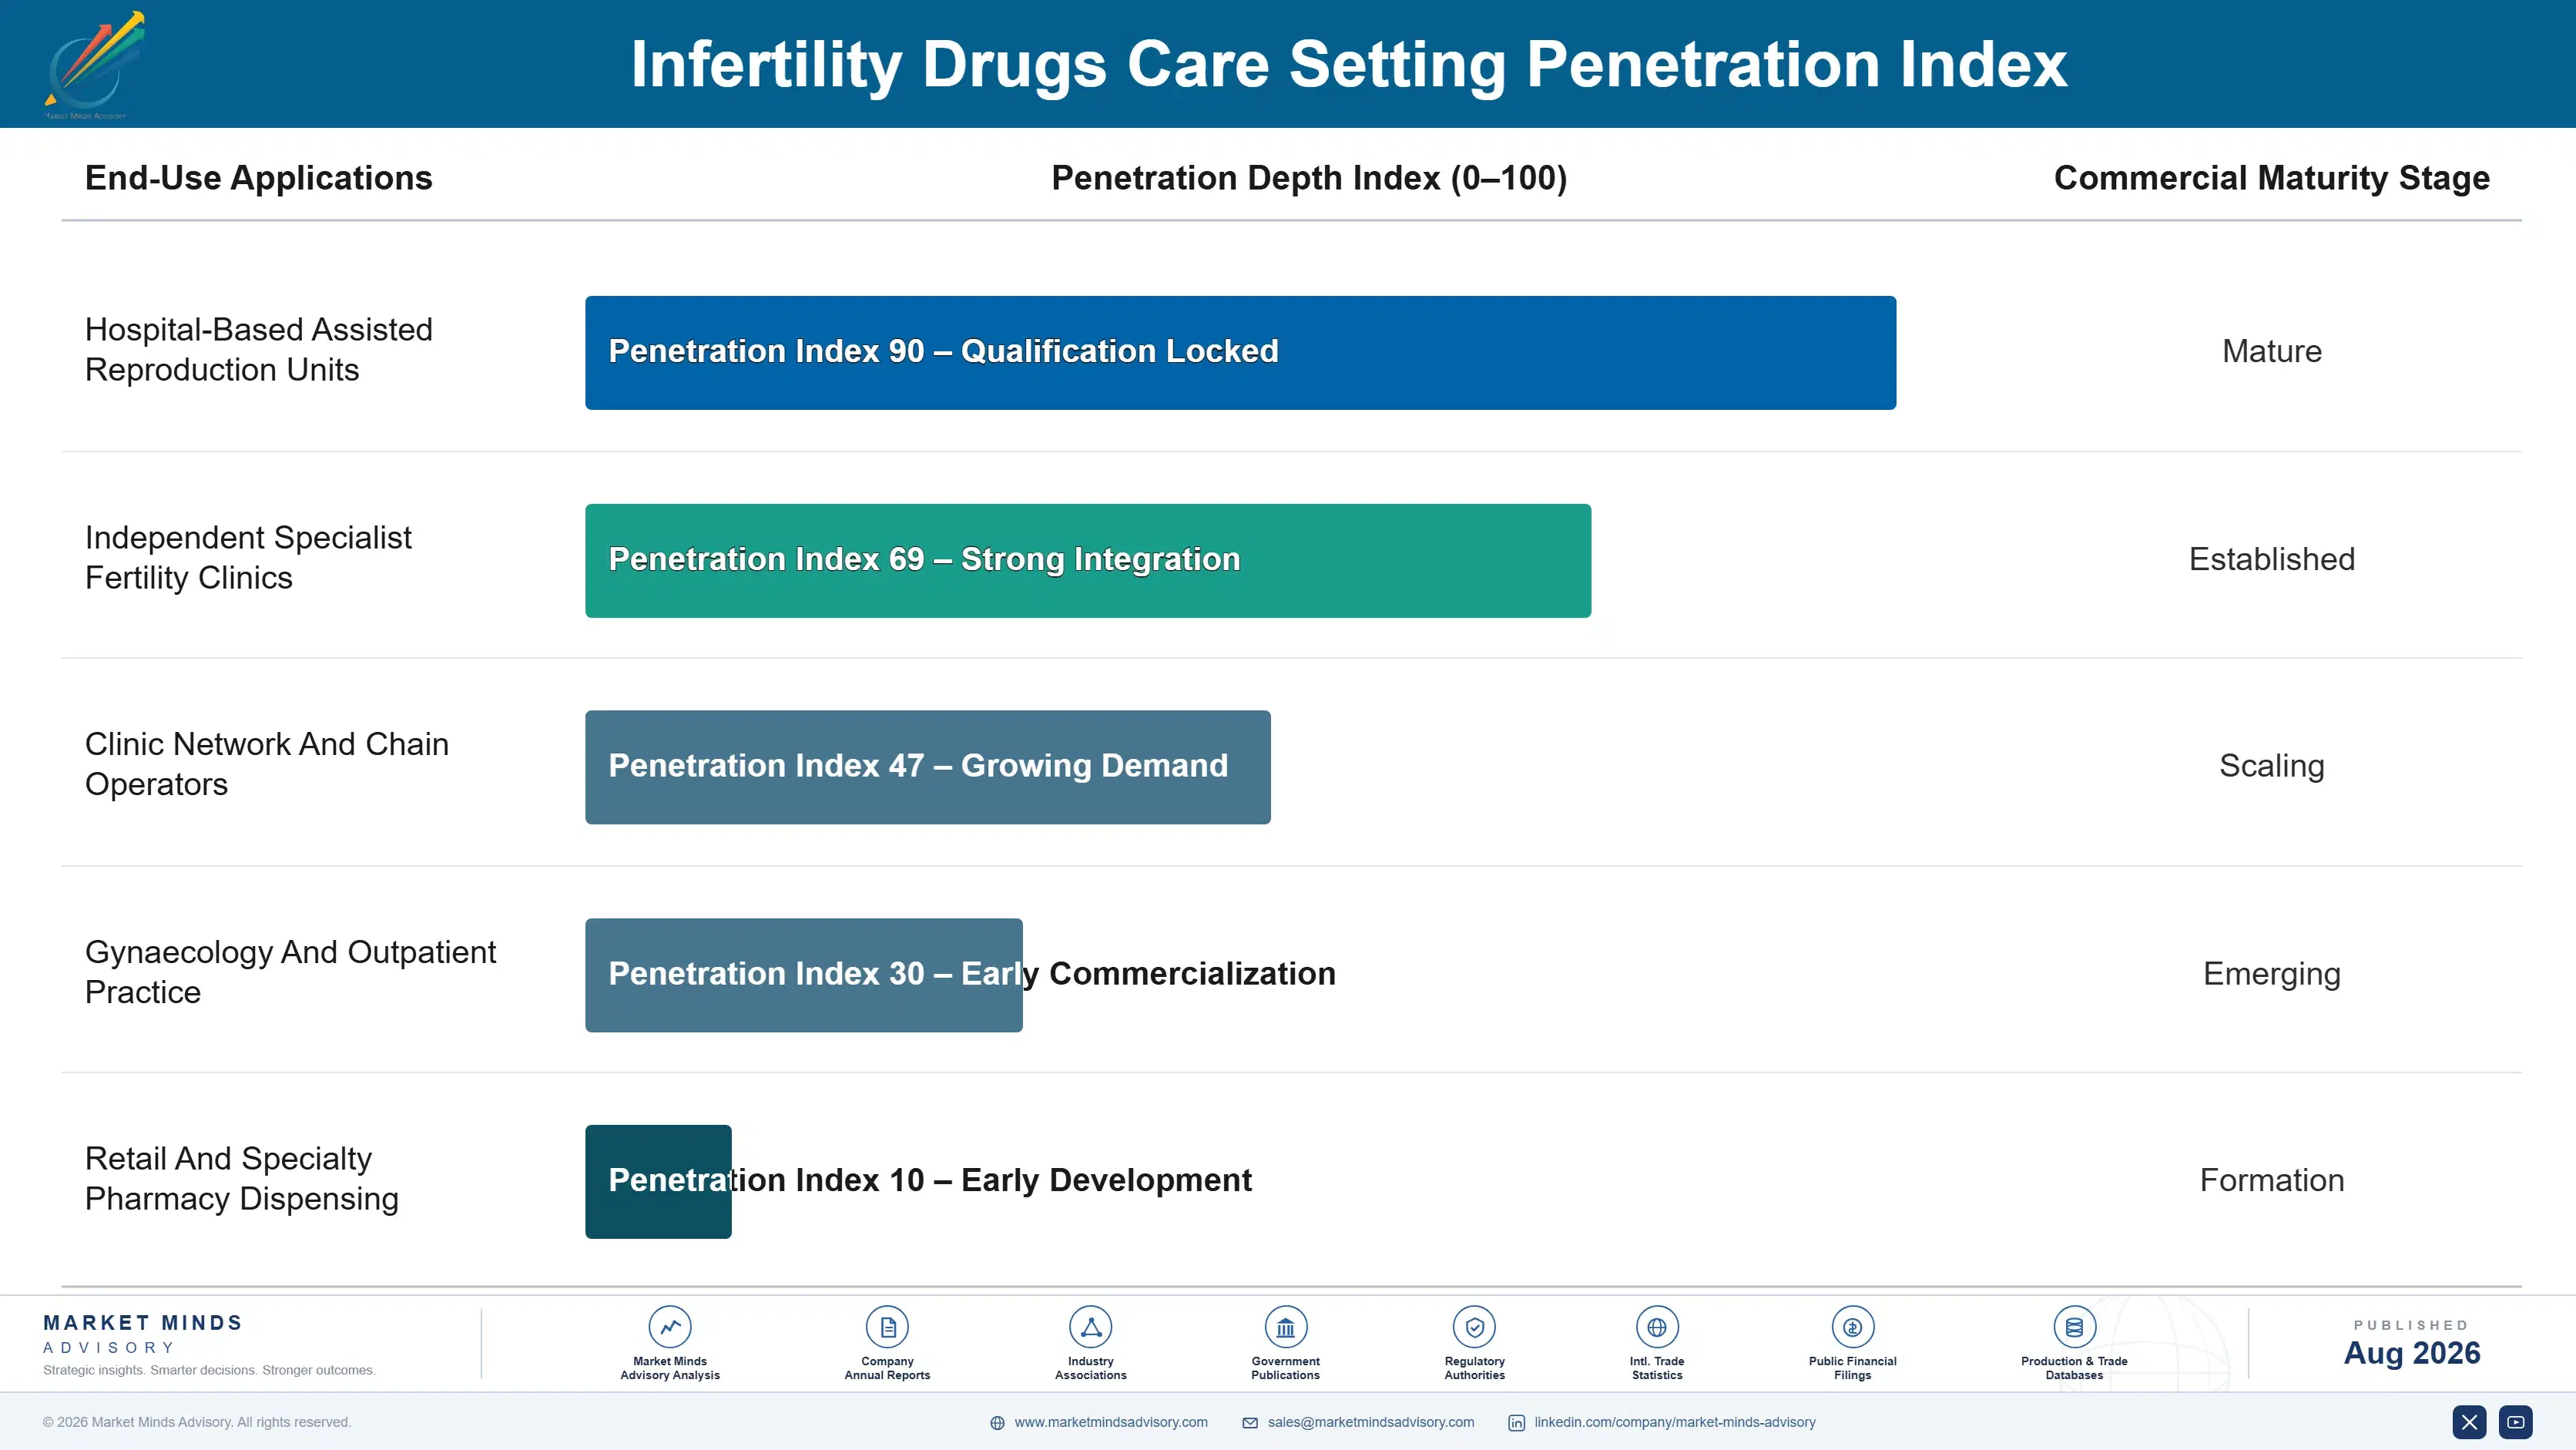
By Care Setting

  • Hospital-Based Assisted Reproduction Units
  • Independent Specialist Fertility Clinics
  • Clinic Network And Chain Operators
  • Gynaecology And Outpatient Practice
  • Retail And Specialty Pharmacy Dispensing

By Payer Channel

  • Patient Self-Pay Direct
  • Public Health System Reimbursement
  • Employer Sponsored Fertility Benefits
  • Private Health Insurance Coverage
  • Tendered National Procurement

By Region

  • East Asia
  • Western Europe
  • North America
  • South Asia and Pacific
  • Latin America
  • Middle East and Africa
  • Eastern Europe

Scope, Methodology, and Coverage

Every figure in this report is reproducible from documented input assumptions. The scope below maps the historical period, the forecast horizon, the segmentation dimensions, and the countries covered, alongside the underlying primary and qualitative methodology.
Historical Period
2020 to 2025
Forecast Period
2026 to 2036
Base Year
2025 (USD billions; MMA Primary Research Dataset, August 2026)
Market Definition
This market comprises pharmaceutical products used to induce ovulation and to support assisted reproduction treatment cycles, measured at manufacturer revenue across all payer channels. Coverage spans recombinant follicle stimulating hormone products, urinary-derived gonadotrophin preparations including human menopausal gonadotrophin, biosimilar follitropin products, gonadotrophin-releasing hormone agonists and antagonists used in stimulation protocols, and oral ovulation induction agents. Assisted reproduction laboratory consumables and culture media, cryopreservation supplies, fertility diagnostics and hormone testing, clinic and laboratory service fees, surgical procedures, and male fertility treatments outside ovulation induction fall outside scope.
Quantitative Units
USD billions (current prices); treatment cycles supplied annually; price per cycle by product class; cycles per live birth by age band
Segmentation Dimensions
By Product Class And Source; By Care Setting; By Payer Channel; By Region
Regions Covered
East Asia, Western Europe, North America, South Asia and Pacific, Latin America, Middle East and Africa, Eastern Europe
Countries Covered
China, Japan, South Korea, Germany, France, Spain, Belgium, Netherlands, United Kingdom, United States, Canada, India, Australia, Thailand, Brazil, Mexico, Argentina, Saudi Arabia, United Arab Emirates, Egypt, Poland, Czechia, and additional markets relevant to this sector
Key Companies Profiled
Merck KGaA, Organon, Ferring Pharmaceuticals, IBSA Institut Biochimique, Livzon Pharmaceutical, Bharat Serums and Vaccines, Sun Pharmaceutical Industries, Cipla, Intas Pharmaceuticals, LG Chem, Teva Pharmaceutical Industries, Gedeon Richter, Hangzhou Jiuyuan Gene Engineering, GenSci, Finox Biotech, Sanofi, Fresenius Kabi, Zydus Lifesciences, Emcure Pharmaceuticals, Julphar
Quantitative Methodology
Primary survey, n=3,800 respondents, Q4 2025, six countries; demand-side model with trade association cross-validation
Qualitative Methodology
47 expert interviews, Q4 2025; applied to validate demand model assumptions, identify emerging dynamics, and assess competitive positioning
Report Format
PDF and XLSX data workbook (Word format preview document)
Publisher
Market Minds Advisory
Report Code
MMA-2026-HLT-581
Published
August 2026
Contact
sales@marketmindsadvisory.com | www.marketmindsadvisory.com

Purchase the full Infertility Drugs Market Report (2026 to 2036).

The full report sizes infertility drugs across five product classes, five care settings, five payer channels, and seven regions, with treatment cycles supplied tracked separately from revenue. Self-pay against reimbursed cycle share is quantified by market, since payer channel governs price sensitivity and biosimilar uptake more than any clinical factor does. Reimbursement decisions are mapped against observed cycle volume response, and cell culture manufacturing capability is mapped across established and emerging producers. Competitive profiling covers twenty companies on annual treatment cycles supplied, with biosimilar discount levels analysed alongside the entry barriers that keep them modest.
Self-pay against reimbursed cycle share quantified by market
Reimbursement decisions mapped against observed cycle volume response
Biosimilar discount levels analysed against manufacturing entry barriers
Cycle cancellation rates assessed by stimulation protocol type
Cycles per live birth modelled across maternal age bands
Tendered against clinic-led prescribing compared on switching behaviour

Built For The People Who Decide

From boardroom strategy to bench-side execution, this report is read cover-to-cover by leaders shaping the next decade of their industry, turning demand scenarios, market dynamics and valuation benchmarks into decisions.
CXOs/ Presidents/ VPs/ Managers
M&A and Corporate Development
Strategy Teams and R&D Heads
Procurement and Product Directors
Regulatory and Compliance Leaders
Investor Relations and Equity Analysts