Market Minds Advisory
Industrial Wastewater Treatment Chemicals Market

Industrial Wastewater Treatment Chemicals Market: Chemistry for a Tighter Discharge Regime

Regulators across China, India, and the European Union are tightening industrial discharge limits faster than plants can upgrade infrastructure, pushing operators toward specialty coagulants and membrane cleaning chemistries that squeeze treatment capacity from existing basins.

Lead Analyst

Bilal Shaikh

Published

September 2026

Make Smarter Decisions with Customized Research Insights

Request a free sample report and evaluate market opportunities, growth trends, and competitive dynamics relevant to your business needs.

2025 MARKET VALUE$5.6BMarket Size 2025
2036 FORECAST VALUE$11.2BBase Case , 2026 to 2036
CAGR 2026 TO 20366.5 %Bull 7.8% / Bear 5.2%
INCREMENTAL OPPORTUNITY$5.2BNet 10- year value creation
EXPANSION MULTIPLE1.88x2036 value over 2026 base
Strategic Levers
M&A Pipeline
Regional Outlook
Country Rankings
Competitive Intelligence
Segmental Deep-dive
Call-Us : 91 93563 13602

Executive Snapshot and Market Trajectory

Zero liquid discharge mandates and tightening effluent limits are forcing industrial operators to treat wastewater to a higher standard within the same physical footprint, and that constraint is what is really driving specialty chemical demand rather than production volume growth alone across most end-use industries today.
Specialty resins and membrane cleaning chemicals are growing fastest at roughly 1.38 times the market average as reverse osmosis and zero liquid discharge systems spread across textile, pharmaceutical, and electronics manufacturing. East Asia holds the largest share of global spending because China's manufacturing base combines the highest industrial water volumes with the strictest recent discharge enforcement under its Ministry of Ecology and Environment standards, forcing rapid chemical treatment upgrades across thousands of facilities.
Five suppliers, Ecolab, Veolia, Kemira, BASF, and Solenis, hold under two-fifths of global revenue in a market too fragmented for any company to dominate, leaving room for regional specialists competing on formulation expertise rather than scale. PFAS remediation requirements and stricter nutrient discharge limits in the European Union are reshaping which chemistries operators specify, favoring suppliers with proven advanced oxidation and specialty polymer capability over legacy commodity coagulant lines.
Market Definition
The industrial wastewater treatment chemicals market covers coagulants and flocculants, biocides and disinfectants, scale and corrosion inhibitors, pH adjusters and neutralizers, defoamers and antifoams, and specialty resins and membrane cleaning chemicals used to treat industrial process and effluent water. It excludes municipal drinking water treatment chemicals, wastewater treatment equipment, and residential water softening products.
Base Year Value
$5.6B in 2025 (MMA Primary Research Dataset, August 2026)
Forecast Period
2026 to 2036, eleven discrete annual values
CAGR
6.5% base case. Bull 7.8%. Bear 5.2%.
Fastest Growth Segment
Specialty Resins and Membrane Cleaning Chemicals: 9.0% CAGR
Fastest Growth Country
India: 11.8% CAGR
Fastest Growth Region
South Asia and Pacific: 8.7% CAGR
Largest Region
East Asia: 29% of 2025 global value
Market Leaders
Ecolab, Veolia, Kemira, BASF, Solenis. Source: MMA Analysis based on company annual reports.
Primary Survey
n=3,800 procurement and R&D decision-makers, Q4 2025, six countries
Methodology
Demand-side build-up, cross-validated against public data, 47 expert interviews

Industrial Wastewater Treatment Chemicals Market Forecast Scenarios

industrial-wastewater-treatment-chemicals-market-size-forecast-scenario-1787300291285
The market grew steadily through the pandemic since industrial water treatment counts as essential operations in most jurisdictions, then accelerated from 2022 as China and the European Union both tightened discharge standards. Textile and electronics manufacturing capacity additions in Asia added further chemical treatment volume. The result was a 5.5 percent historical CAGR, weighted toward regulatory tightening.
The base case rests on three mechanisms. First, zero liquid discharge mandates in China's water-stressed provinces and India's textile clusters are forcing plants to specify advanced chemistries rather than basic coagulation. Second, PFAS remediation obligations across the United States and European Union are creating a new specialty chemical category with limited existing supplier competition. Third, membrane filtration adoption is rising steadily, and every membrane system requires ongoing specialty cleaning purchases that basic filtration never needed.
The bull case turns on accelerating PFAS remediation spending if the United States finalizes stricter drinking water and industrial discharge standards this decade, pulling specialty chemical demand above current forecasts. The bear case centers on a global industrial slowdown that delays capital-intensive membrane and zero liquid discharge installations, pushing plants to defer chemical upgrades and stretch existing treatment infrastructure.

Regulation Redraws the Chemical Specification Playbook

Industrial wastewater treatment chemicals sit at the intersection of two forces: regulators tightening discharge limits faster than plants can rebuild physical infrastructure, and manufacturers adding water-intensive production capacity across Asia even as water stress worsens. Both forces push operators toward specialty chemistry that extracts more treatment performance from the tanks and membranes already installed, rather than new capital projects, which face permitting delays that specialty
CR5 CONCENTRATION38%Fragmented market leaves considerable room for regional specialists
AVERAGE CONTRACT LENGTH3.2 yearsChemical programs run as multi-year service relationships typically
TOP PRODUCING COUNTRY SHARE26%China leads global specialty water treatment chemical manufacturing
MEMBRANE SYSTEM PENETRATION44% of new installsReverse osmosis adoption keeps expanding across manufacturing sectors
TRADE INTENSITY29% of output exportedCross-border specialty chemical shipments rise with new capacity
INPUT COST SHARE42% of COGSPetrochemical feedstocks and specialty polymers dominate production costs
Commercially, the market behaves like a service business wearing a chemical supplier's label. Ecolab and Veolia both increasingly price on outcomes, guaranteeing discharge compliance and treatment performance rather than simply selling drums of coagulant, and that shift is pulling margin away from commodity chemistry into monitoring and dosing optimization services bundled with the chemical itself, a trend most legacy commodity suppliers have been slow to match.
Over the next decade, PFAS remediation will keep expanding as its own specialty category, membrane cleaning chemical demand will keep rising alongside filtration adoption, and suppliers without advanced oxidation or ion exchange capability will increasingly lose specification battles to those that have already built it across their largest accounts, particularly in regulated industries where switching costs run high.
"Discharge chemistry used to be an afterthought behind the treatment plant's concrete and steel. Now the chemistry is often the only lever a plant has left once the physical infrastructure is already built out."
Director, Specialty Chemicals and Water Treatment Practice · MMA Chemicals and M

Market Trends

Zero Liquid Discharge Mandates Force Advanced Chemistry Adoption

China's water-stressed northern provinces and several Indian states have moved to require zero liquid discharge for new textile, dyeing, and chemical manufacturing facilities, eliminating conventional effluent discharge as a compliance option. Meeting ZLD standards requires a chemistry stack beyond basic coagulation, including specialty scale inhibitors that protect evaporators and crystallizers from fouling, along with membrane cleaning chemicals that keep reverse osmosis systems running at design recovery rates. Plants converting to ZLD report specialty chemical spend rising by roughly 45 percent per unit of water treated compared with conventional discharge-based treatment trains, a gap widening as mandates spread to additional provinces.
Market Impact: Lifts chemical intensity 25 percent
PFAS Remediation Creates an Entirely New Chemical Category

Per- and polyfluoroalkyl substance contamination in industrial wastewater has moved from a niche concern to a defined regulatory category as the United States Environmental Protection Agency finalized drinking water limits and several states adopted parallel industrial discharge standards. Treating PFAS-contaminated effluent requires granular activated carbon regeneration chemicals, ion exchange resins, and foam fractionation additives, none of which existing commodity coagulant suppliers previously stocked at scale. Specialty suppliers that moved early into PFAS remediation chemistry are winning multi-year contracts with industrial dischargers facing enforcement deadlines, and the addressable category is expanding faster than almost any other segment.
Market Impact: Expands nutrient removal demand 20 percent

Market Opportunities and Growth Drivers

Industrial Water Reuse Targets Push Treatment Intensity Higher

Manufacturers across semiconductor, pharmaceutical, and textile sectors are adopting internal water reuse targets that require treating process water to a far higher standard than one-time discharge ever demanded, since reused water must meet process-grade specifications rather than regulatory minimums. Taiwan Semiconductor and several Indian textile majors have both published water reuse targets exceeding 80 percent of total process water by 2030, and hitting those targets requires substantially more specialty chemical dosing per liter treated than conventional single-pass systems ever needed. That shift is lifting chemical intensity even at manufacturers whose total water withdrawal volumes are flat or declining.
Market Impact: Feedstock costs rose 25 percent

Tightening Nutrient Discharge Limits Expand Biological Treatment Chemistry

The European Union's revised Urban Wastewater Treatment Directive and expanding nutrient discharge limits in United States states bordering the Chesapeake Bay and Great Lakes are forcing industrial dischargers to remove nitrogen and phosphorus to levels conventional biological treatment alone cannot reliably achieve. Meeting these limits increasingly requires specialty carbon sources to fuel denitrification, along with coagulants engineered specifically for phosphorus precipitation rather than general solids removal. Food processing and agricultural chemical manufacturers, historically light users of specialty nutrient removal chemistry, are now among the fastest-growing customer segments as enforcement accelerates across both regions.
Market Impact: Delays chemistry upgrades 2 years

Market Restraints and Challenges

Petrochemical Feedstock Volatility Squeezes Formulator Margins

Acrylamide, epichlorohydrin, and other petrochemical-derived feedstocks account for a large share of coagulant and flocculant production cost, and their pricing tracks crude oil and natural gas markets that formulators do not control. When feedstock prices spiked during 2022's energy crisis, specialty chemical formulators absorbed much of the increase to remain price-competitive against alternative treatment approaches, compressing margins across commodity coagulant lines specifically. Mid-tier formulators without long-term feedstock supply contracts felt this hardest, while Ecolab and Kemira leaned on scale purchasing agreements and began qualifying bio-based coagulant alternatives to reduce future feedstock exposure.
Market Impact: Lifts ZLD chemical spend 45 percent

Plant Capital Constraints Delay Chemistry Upgrades

Many industrial facilities operate treatment infrastructure engineered decades ago around conventional coagulation and biological treatment, and upgrading to accommodate advanced oxidation or membrane-based chemistries often requires capital investment in new dosing and monitoring equipment beyond the chemical purchase itself. The root cause is that treatment infrastructure has a much longer replacement cycle than chemical formulations do, so plants often cannot adopt newer chemistries even when regulation demands better outcomes. Some operators are addressing this through phased retrofits, upgrading dosing systems incrementally alongside routine maintenance cycles rather than committing to a single disruptive capital project.
Market Impact: Adds 15 percent remediation spend
3 additional market trends, 3 additional growth drivers, and 3 additional restraints and challenges are covered in the full report. Contact sales@marketmindsadvisory.com to access the complete intelligence.

Segment CAGR and Growth Architecture

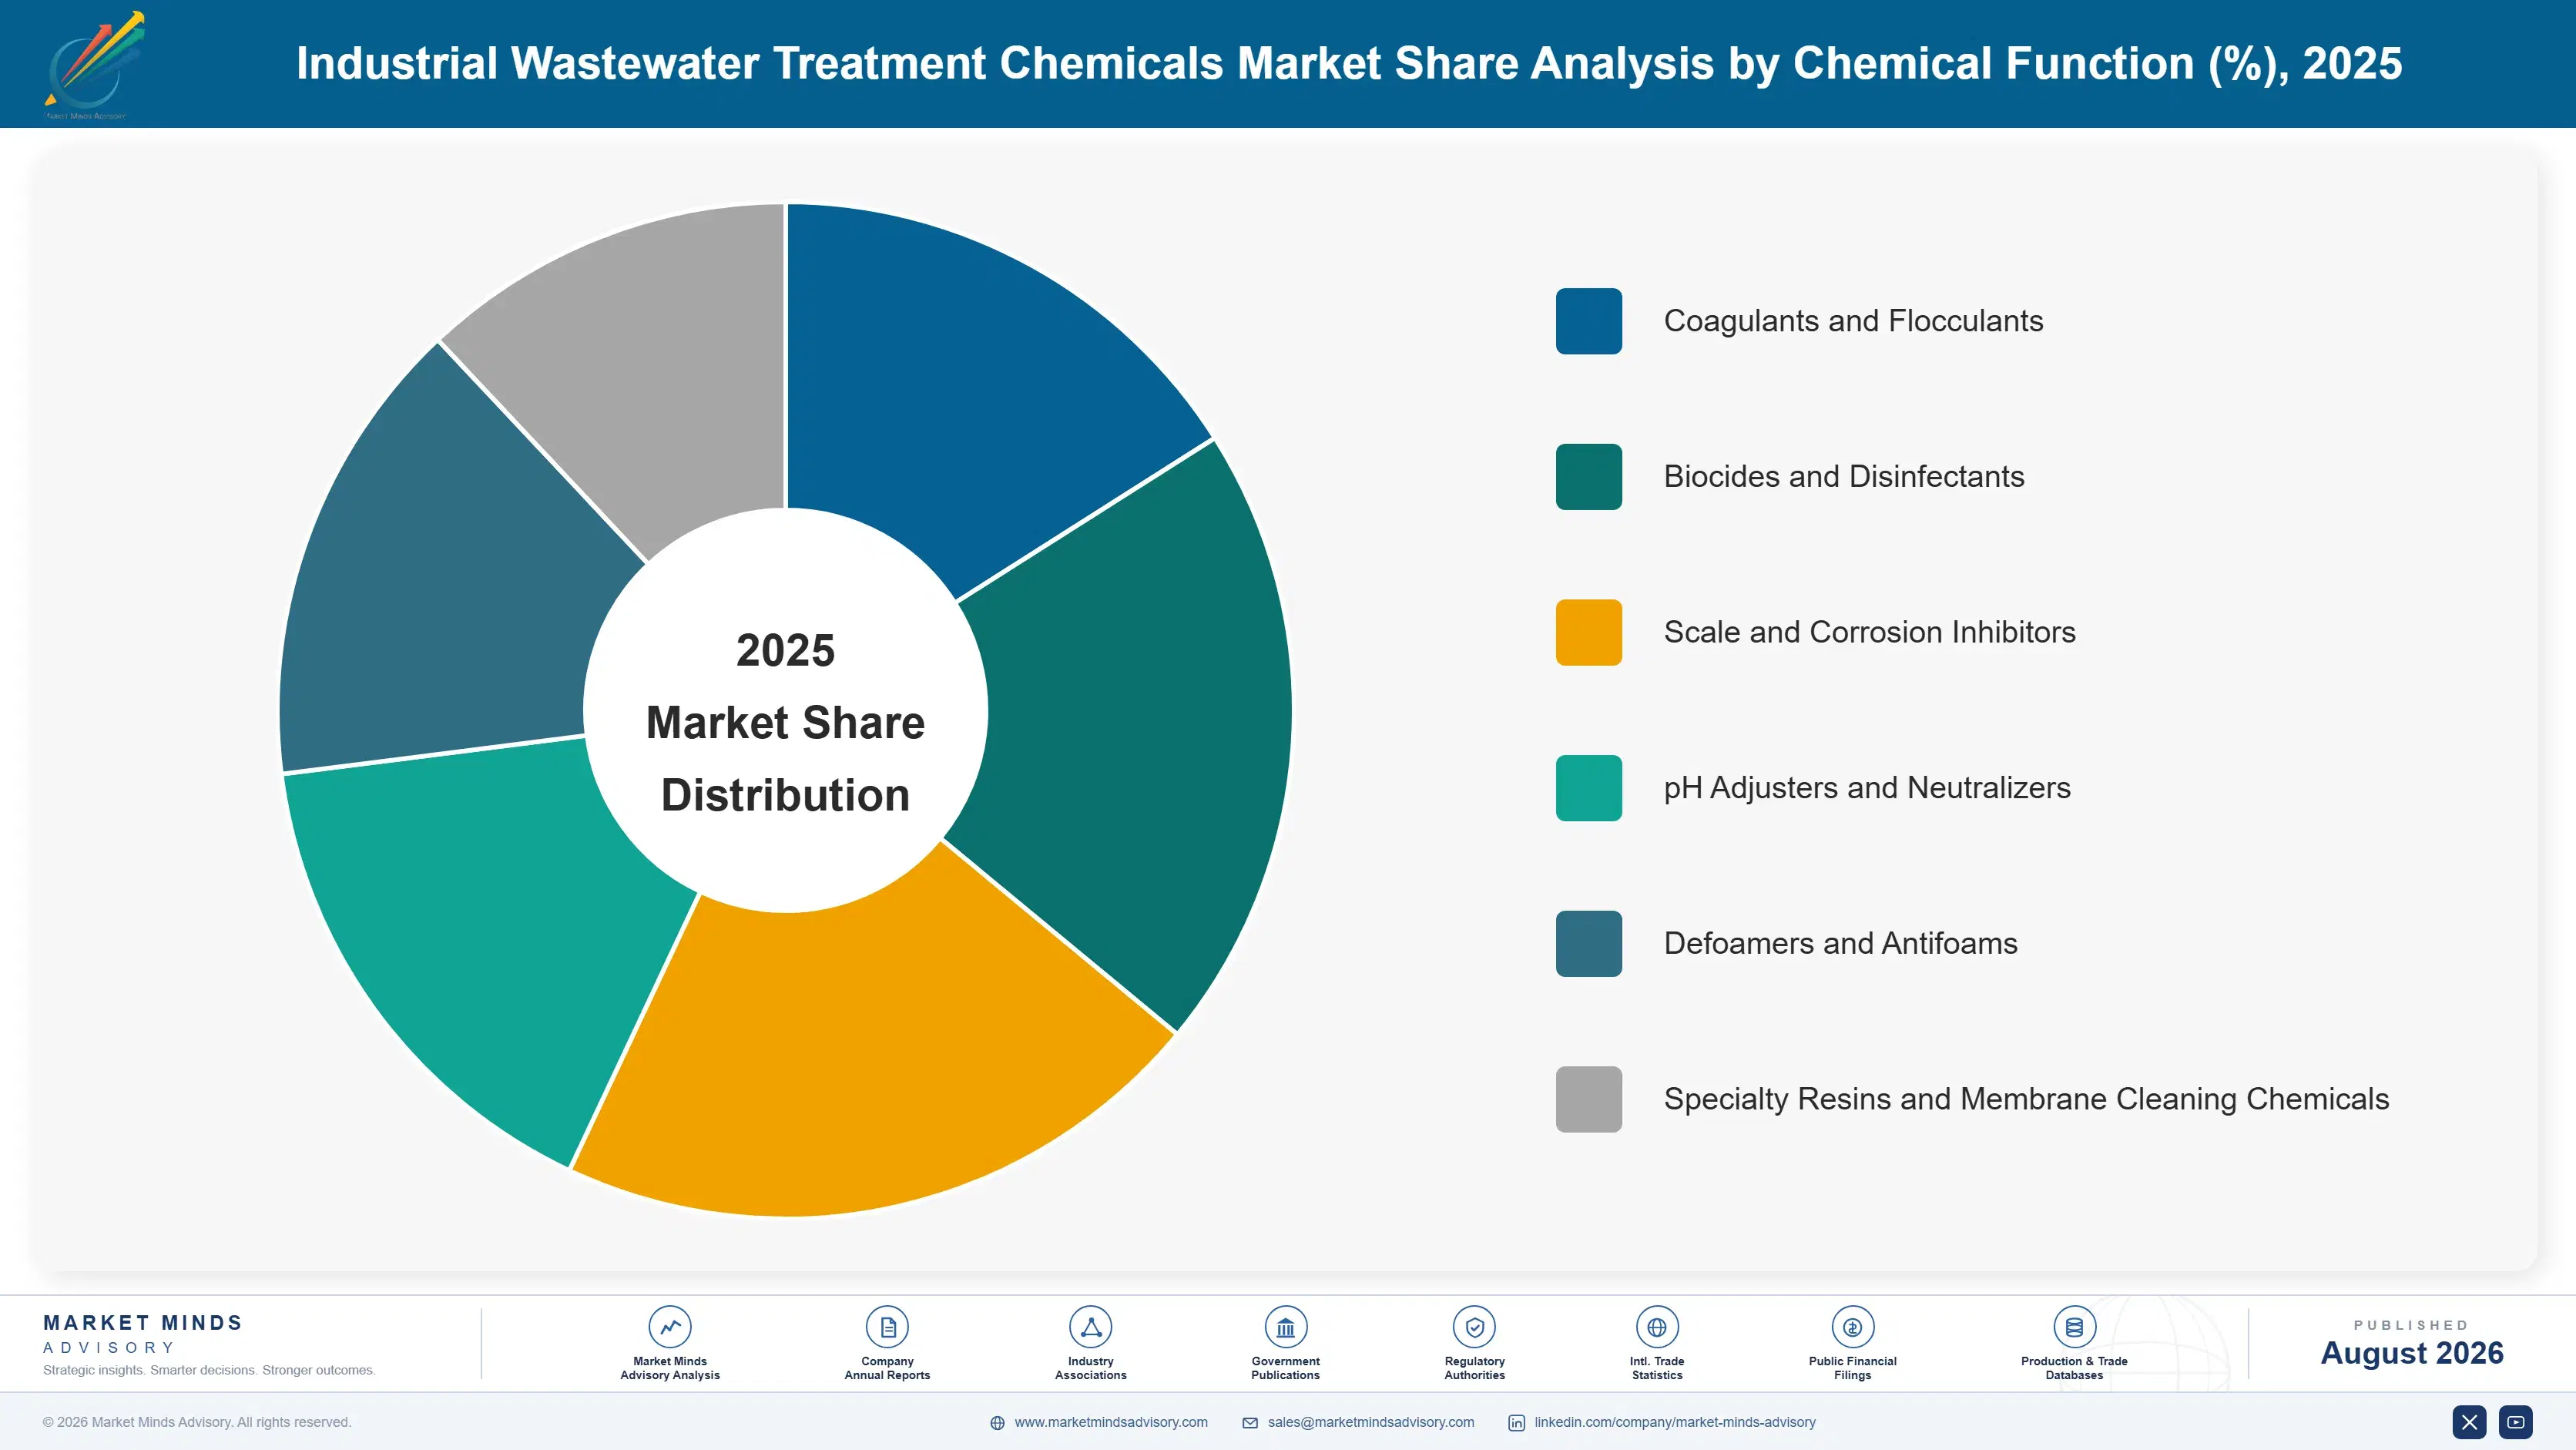
Segmentation follows chemical function rather than end-use industry or treatment stage, since a single treatment train typically uses several chemical categories in sequence. Six categories span the treatment process from initial coagulation through biological support, corrosion protection, and final membrane maintenance, reflecting how plant operators budget and specify each chemistry as a distinct purchasing line.
industrial-wastewater-treatment-chemicals-market-market-share-analysis-1787300291818

Specialty Resins and Membrane Cleaning Chemicals

Specialty resins and membrane cleaning chemicals are growing fastest as reverse osmosis and ultrafiltration systems spread across semiconductor, pharmaceutical, and zero liquid discharge applications that conventional treatment cannot serve. Membrane fouling from organic matter, scale, and biofilm requires regular chemical cleaning cycles, and each installed membrane system generates recurring cleaning chemical demand for its entire operating life, unlike one-time coagulant dosing. Ecolab's Nalco Water division and Kemira both lead unit placements in semiconductor and pharmaceutical applications, while Chinese suppliers are qualifying competing membrane chemistries for domestic textile and electronics manufacturing. Ion exchange resins used in ultrapure water production for semiconductor fabs represent a particularly high-value niche within this category, commanding premium pricing over general industrial membrane chemistry.
CAGR 9.0%

Biocides and Disinfectants

Biocides and disinfectants are growing quickly as industrial operators face tightening biological control requirements across cooling water systems, pulp and paper processing, and oil and gas produced water treatment. Legionella outbreak liability concerns have pushed cooling tower operators toward more rigorous biocide dosing programs following several high-profile incidents, while produced water reuse in shale operations requires biocide treatment to prevent bacterial souring of injected water. Non-oxidizing biocides are gaining share over traditional chlorine-based approaches as regulators tighten disinfection byproduct limits, since chlorination can generate regulated byproducts that biocide alternatives avoid. BASF and Solenis both report double-digit growth in specialty biocide product lines serving oil and gas and food processing customers specifically.
CAGR 7.5%
Full segment breakdown across 6 segments available in the complete report.

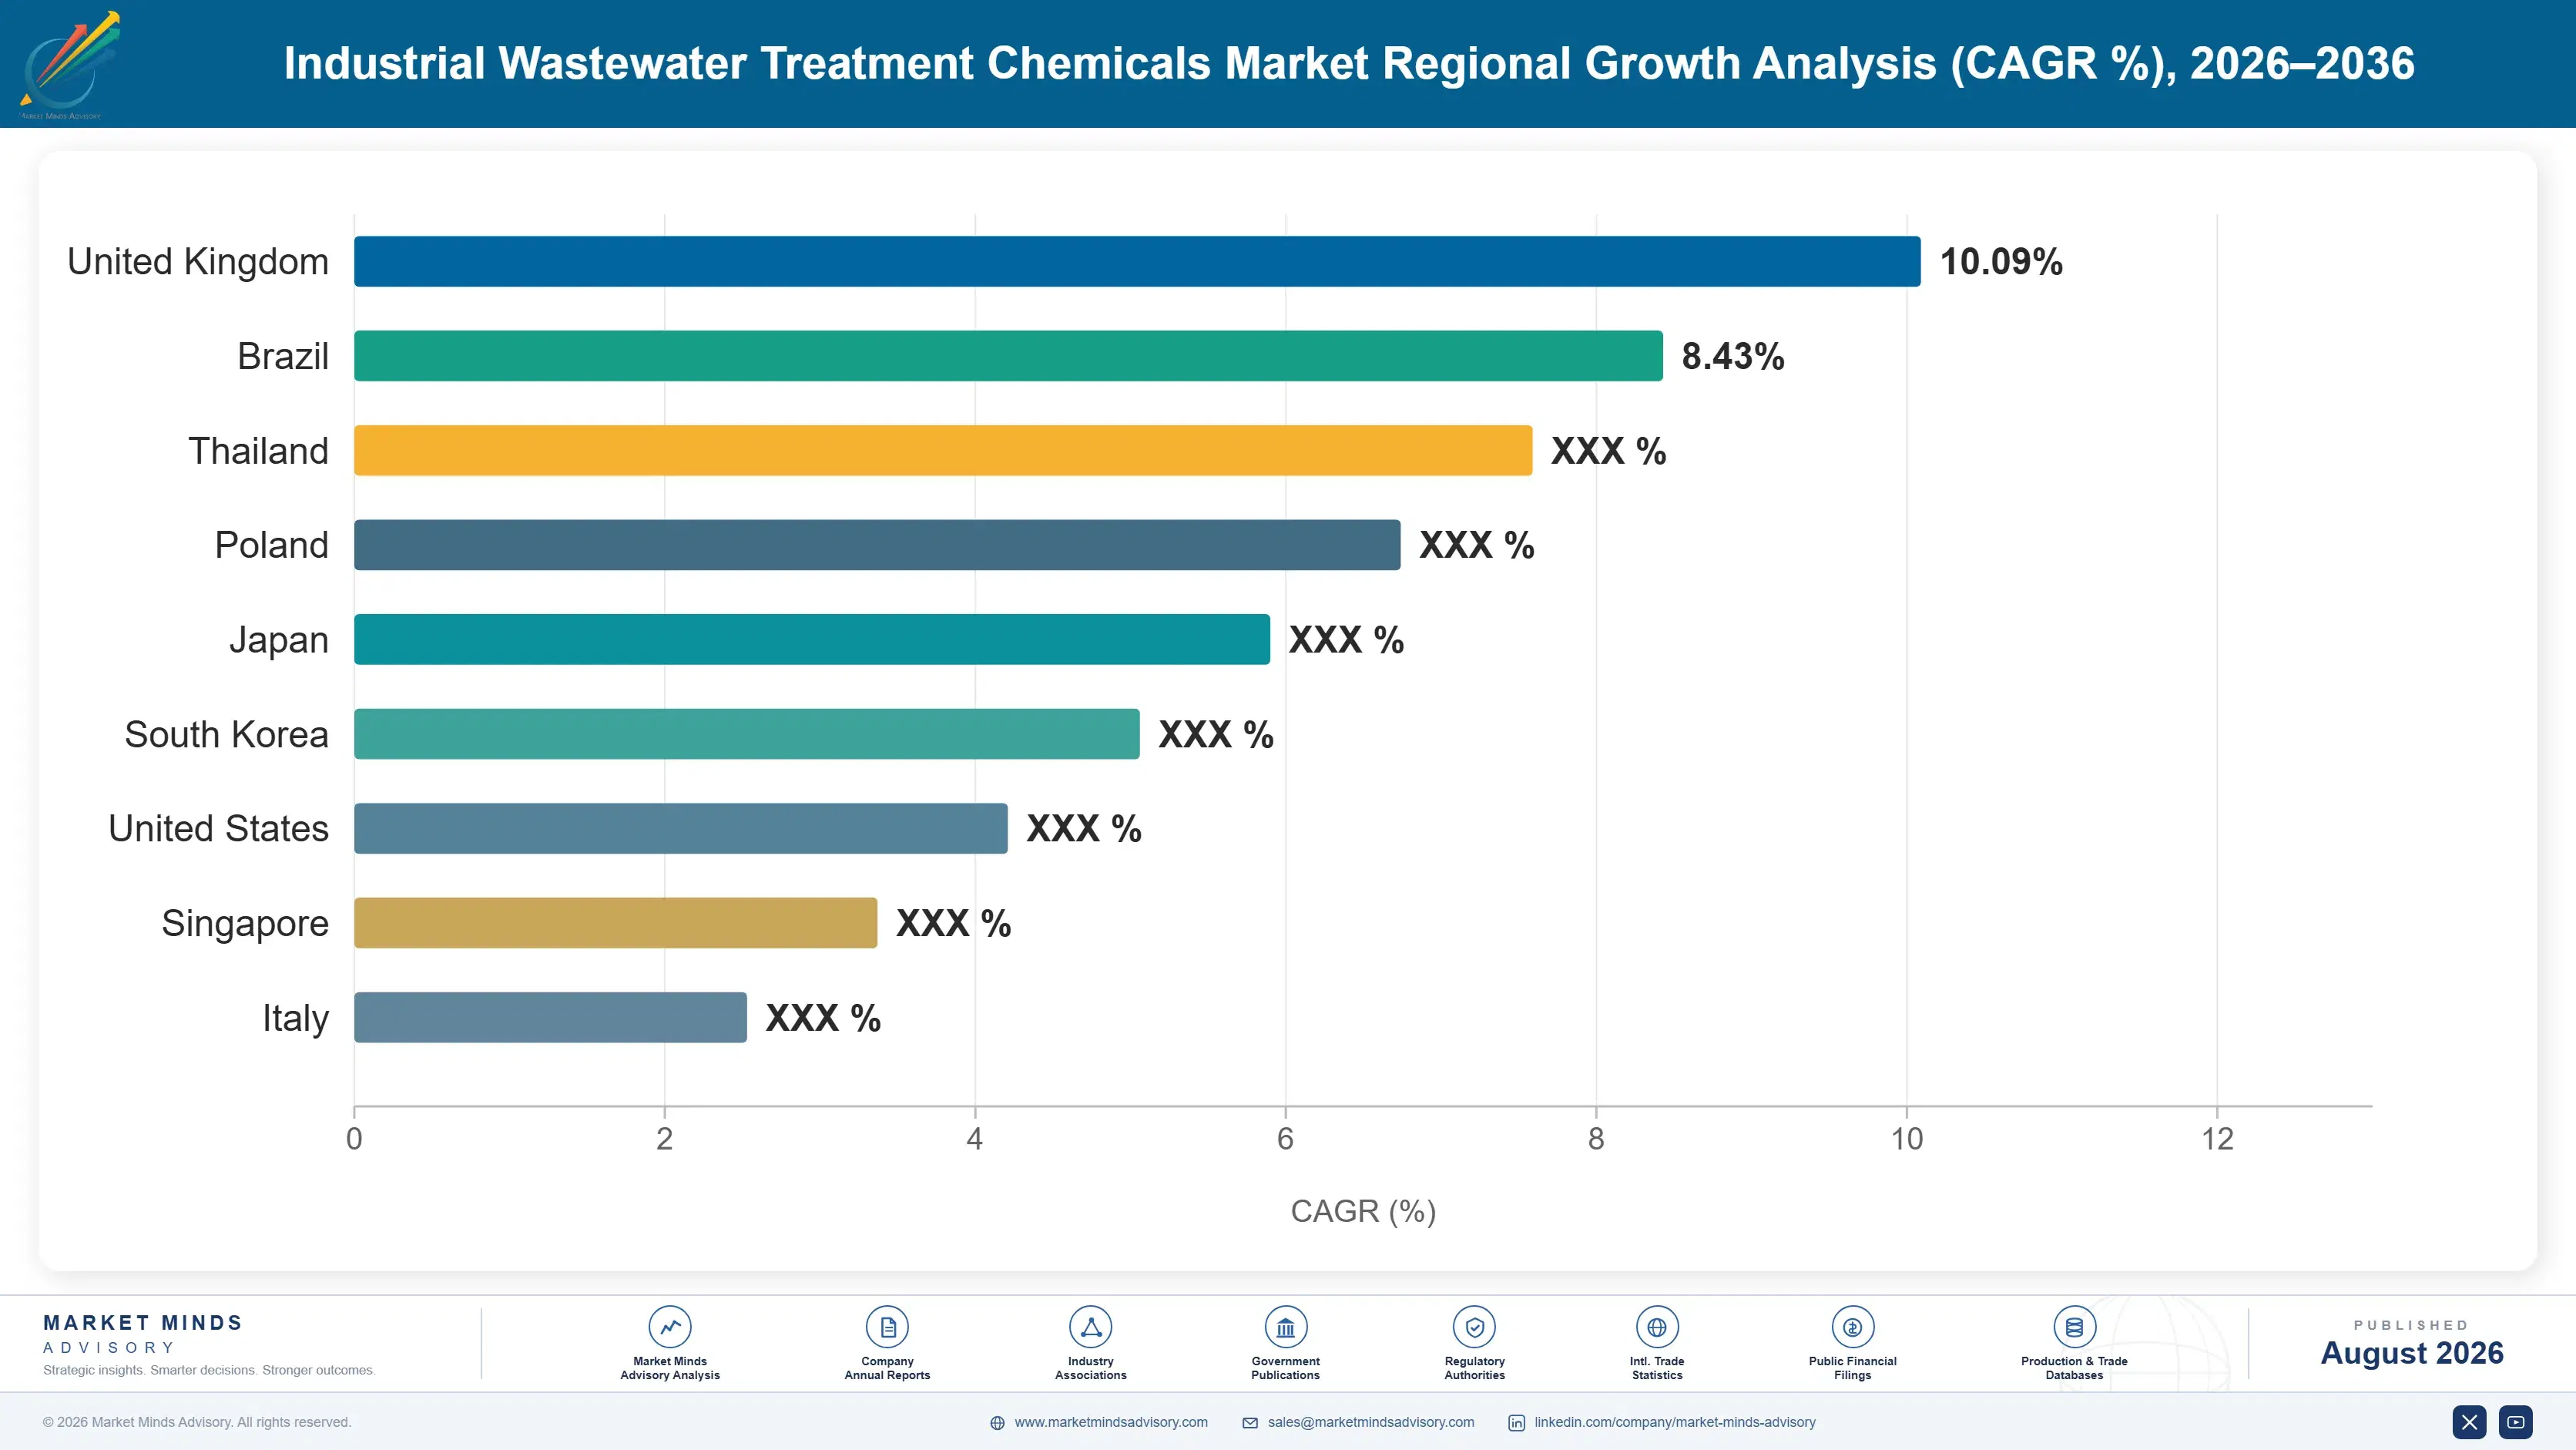
Regional Architecture and Country Demand Map

Demand concentrates where industrial water volumes and regulatory enforcement intensity are both highest. East Asia leads on China's manufacturing scale and tightening discharge standards, North America and Western Europe lead on PFAS remediation spending, while South Asia and Pacific gain share fastest on India's textile sector expansion.

East Asia

China's manufacturing base generates more industrial wastewater volume than any other country, and the Ministry of Ecology and Environment's tightening discharge standards since 2023 have forced thousands of textile, chemical, and electronics facilities to upgrade treatment chemistry simultaneously. Domestic suppliers including Kurita's Chinese joint ventures and local specialty chemical makers have captured a growing share of new contracts as plants prioritize responsive local technical service over imported alternatives. South Korea's semiconductor fabrication expansion is driving demand for ultrapure water treatment resins specifically, a smaller but high-value niche within the region. Japan's mature industrial base sustains steady replacement demand, while Taiwan's semiconductor water reuse targets are pulling membrane cleaning chemical volumes higher across the island's foundry cluster.
Share: 29% | CAGR: 7.5% (2026 to 2036)

North America

United States industrial dischargers are moving fastest on PFAS remediation chemistry as Environmental Protection Agency enforcement deadlines approach, creating an entirely new specialty chemical category concentrated in this region more than anywhere else. Semiconductor fabrication expansion under CHIPS Act incentives is also driving demand for ultrapure water treatment chemistry at new fabs in Arizona, Texas, and Ohio. Canada's pulp and paper and oil sands sectors sustain a steady base of conventional coagulant and biocide demand, though growth there trails the PFAS-driven and semiconductor-linked segments elsewhere in the region. Mexico's growing automotive and electronics manufacturing base adds a smaller, faster-growing layer of conventional treatment chemical demand. Pharmaceutical manufacturers in the Northeast are also emerging as PFAS remediation customers.
Share: 23% | CAGR: 6.8% (2026 to 2036)
Regional intelligence for 5 additional markets available in the complete report: Western Europe, South Asia and Pacific, Latin America, Middle East and Africa, Eastern Europe. Contact sales@marketmindsadvisory.com.
industrial-wastewater-treatment-chemicals-market-country-cagr-analysis-1787300292336

Where Chemical Suppliers Can Grow Margin

Volume growth alone will not sustain margins in a market where commodity coagulants remain intensely price-competitive. The more durable path runs through outcome-based service contracts, PFAS remediation specialization, and digital dosing optimization, each of which carries pricing power that standalone drum sales of commodity chemistry increasingly lack in a market shifting from chemical volume toward compliance outcomes.

Converting Chemical Sales Into Outcome-Based Contracts

Bundling chemical supply with digital dosing optimization and guaranteed discharge compliance turns a commodity chemical sale into a performance contract priced on treatment outcomes rather than volume delivered. Ecolab's outcome-based water contracts now cover a growing share of its industrial accounts, and customers under these contracts report roughly 15 percent lower total chemical spend even as suppliers capture higher margin per dollar of revenue. This model works because digital dosing control reduces chemical waste from over-dosing, letting suppliers share in the efficiency gains they help create rather than simply selling more product.
Market Impact: Cuts customer total chemical spend by 15 percent

Building Dedicated PFAS Remediation Product Lines

PFAS-contaminated effluent treatment requires granular activated carbon regeneration, ion exchange resins, and foam fractionation chemistry that most commodity coagulant suppliers do not currently offer, creating a genuine white space opportunity for early movers. Suppliers that build dedicated PFAS remediation capability can command premium pricing, since enforcement deadlines leave industrial dischargers with limited time to qualify alternative suppliers once a compliance program is underway. Early entrants are winning multi-year remediation contracts worth roughly 30 percent more per site than conventional treatment chemical relationships, and the addressable market is still expanding as more jurisdictions finalize PFAS discharge standards.
Market Impact: PFAS remediation contracts command a 30 percent premium

Expanding Digital Dosing and Monitoring Platforms

Real-time water quality sensors paired with automated dosing control let suppliers monitor treatment performance remotely and adjust chemical delivery without a site visit, turning periodic chemical delivery into a continuously monitored service relationship. Veolia and Kemira have both expanded digital monitoring platforms attached to their chemical programs, and customers on monitored programs report fewer compliance excursions and more predictable chemical consumption than those buying chemistry without monitoring attached. This data layer also gives suppliers early warning of customer plant issues, a genuine service advantage worth roughly 10 percent in contract renewal rates.
Market Impact: Improves contract renewal rates by roughly 10 percent

Building Regional Manufacturing to Serve Local Content Rules

Local content and technical service requirements in China and India are pushing industrial dischargers to specify domestically formulated and manufactured chemistry over imported alternatives on a growing share of new contracts. Suppliers that establish regional manufacturing and technical service centers avoid import cost exposure and respond faster to plant-level dosing issues than suppliers shipping product from distant facilities. Kemira and Solenis have both expanded Asian manufacturing footprints specifically to serve this shift, capturing an estimated 18 percent larger share of new regional contracts since establishing local production, a trend Western suppliers are increasingly forced to match through licensing partnerships.
Market Impact: Local manufacturing wins roughly 18 percent more contracts

Who Controls the Margin Pool

Five suppliers, Ecolab, Veolia, Kemira, BASF, and Solenis, hold under two-fifths of global revenue in a market too fragmented for any single company to dominate, and the gap between the leaders and a tail of regional specialists is narrower than in more concentrated equipment categories. Ecolab and Veolia run the broadest technical service networks, though many formulation specialists compete effectively on niche chemistry.
Current competitive activity centers on three fronts. Suppliers are racing to build PFAS remediation product lines, since enforcement deadlines are creating a white space few competitors currently occupy. They are also bundling chemical supply with digital dosing platforms to shift toward outcome-based pricing, and expanding regional manufacturing in China and India. Chinese and Indian domestic suppliers are qualifying competing formulations to displace Western suppliers inside price-sensitive segments of their home markets.

Emerging pressure comes from two directions. Regional Asian formulators are exporting increasingly credible conventional coagulant and biocide chemistry into Africa and Latin America at prices Western suppliers struggle to match. Specialized PFAS remediation start-ups are also entering by partnering with engineering firms rather than chemical distributors, threatening to capture the highest-margin new category before established suppliers mobilize their own remediation lines.
industrial-wastewater-treatment-chemicals-market-company-positioning-matrix-1787300292855

Competitive Moat and Risk Dimensions

ECOLAB

Moat: Broadest Technical Service Network

Ecolab's Nalco Water division operates the broadest technical service and digital monitoring network in the industry, letting it support industrial accounts across every major manufacturing region with local formulation expertise and on-site dosing optimization. That combination of scale and service depth is difficult for smaller regional formulators to replicate without years of relationship building and capital investment.
ECOLAB

Risk: Regional Formulators Undercutting on Price

Regional Asian and Latin American formulators are qualifying competing conventional chemistry at substantially lower price points, and as their technical capability narrows the gap with Ecolab's offering, premium pricing in price-sensitive emerging markets faces growing pressure from suppliers willing to compete primarily on cost rather than service depth.
VEOLIA

Moat: Integrated Water Services Platform

Veolia's ability to bundle chemical supply with broader water infrastructure operation and engineering services gives it access to accounts that pure-play chemical suppliers cannot reach independently, particularly large industrial clients outsourcing entire water treatment operations rather than just chemical procurement, a bundled relationship that is difficult for smaller competitors to replicate.
VEOLIA

Risk: Complex Structure Slows Response Time

Veolia's scale and integrated service model can slow decision-making and pricing responsiveness compared with nimbler pure-play chemical formulators, particularly on smaller accounts where faster-moving regional specialists increasingly win business through quicker technical response and simpler contracting, a gap likely to widen as digital-native formulators enter the market.

Key Players

Ecolab
Veolia
Kemira
BASF
Solenis

Others

Kurita Water Industries
SNF Group
Buckman Laboratories
ChemTreat
Feralco
Chembond Chemicals
Thermax
Aquafine Corporation
Hydrite Chemical
Ashland Global Holdings
Accepta Ltd
Kemipex
Dow Water Solutions
Evoqua Water Technologies
Xylem Inc.

Recent Developments

APRIL 2025

Ecolab Launches Dedicated PFAS Remediation Product Line

Ecolab launched a dedicated PFAS remediation product line combining granular activated carbon regeneration chemistry with ion exchange resins, targeting industrial dischargers facing new Environmental Protection Agency enforcement deadlines. The launch followed two years of pilot testing with several undisclosed industrial clients across chemical manufacturing and semiconductor sectors.
Signal: Signals major suppliers moving to claim share in the fast-expanding PFAS remediation category before smaller specialists consolidate lead.
SEPTEMBER 2024

Veolia Acquires Regional Membrane Cleaning Chemical Specialist

Veolia acquired a privately held membrane cleaning chemical specialist to strengthen its reverse osmosis and ultrafiltration chemistry portfolio ahead of expanding semiconductor and pharmaceutical client contracts across Asia. The acquisition adds proprietary antiscalant formulations to Veolia's existing water technology division, expanding its addressable specialty chemistry portfolio meaningfully.
Signal: Signals consolidation in membrane cleaning chemistry as suppliers bring specialized formulation capability in-house rather than partnering.
JANUARY 2025

Kemira Expands Chinese Manufacturing Capacity for Coagulants

Kemira opened an expanded coagulant and flocculant manufacturing facility in China dedicated to serving domestic textile and electronics manufacturing customers under tightening discharge standards. The facility increases Kemira's Chinese production capacity and supports faster technical response to local plant-level dosing needs across its growing customer base.
Signal: Signals Western suppliers investing directly in Chinese manufacturing to defend share against domestic formulators gaining ground quickly.

Petrochemical Feedstock Cost Exposure

Acrylamide, epichlorohydrin, and other petrochemical-derived feedstocks account for roughly 42 percent of specialty water treatment chemical cost of goods sold, with pricing tracking crude oil and natural gas markets that formulators do not control directly. Feedstock sourcing is concentrated among a handful of global petrochemical producers, giving formulators limited negotiating leverage during periods of tight feedstock supply.
Feedstock prices spiked sharply during 2022's energy crisis, with acrylamide prices rising more than 40 percent within a single year as natural gas costs surged across Europe, according to IEA energy price tracking. Ecolab's 2022 annual report cited raw material cost inflation as a meaningful drag on water treatment segment margins, and several mid-tier formulators passed a portion of the increase through to customers via surcharges rather than absorbing it fully during the spike.

The disadvantage falls hardest on formulators without long-term feedstock supply contracts or geographic sourcing diversity. Ecolab and Kemira, with scale to negotiate multi-year feedstock agreements, absorb volatility more smoothly than regional formulators buying on the spot market. That gap widens further for European formulators specifically, who face both feedstock exposure and higher regional natural gas costs than United States or Middle Eastern competitors.
industrial-wastewater-treatment-chemicals-market-cost-volatility-analysis-1787300293049

Qualifying Bio-Based Coagulant Alternatives

Several formulators are qualifying bio-based coagulants derived from chitosan and plant starches as alternatives to petrochemical-derived polymers, reducing exposure to crude oil and natural gas price swings. Bio-based alternatives remain a small share of total volume today, but Kemira and BASF both report growing customer interest as feedstock volatility persists and sustainability procurement criteria gain weight.

Hedging Feedstock Purchases Through Forward Contracts

Several formulators have moved to twelve-month forward purchase agreements for acrylamide and epichlorohydrin, locking in pricing ahead of production runs rather than buying on the spot market. This reduces margin volatility quarter to quarter, though it also means formulators occasionally pay above prevailing spot prices when feedstock costs fall unexpectedly during the contract term.

Diversifying Feedstock Sourcing Geographically

Leading formulators are qualifying feedstock suppliers across the United States, Middle East, and Asia rather than relying primarily on European sources exposed to natural gas price swings. This diversification reduces regional supply disruption risk and gives formulators more negotiating leverage during periods of tight feedstock availability in any single geography, a defensive posture growing more common industry-wide.

Portfolio Architecture for Margin Defence

The portfolio splits into three tiers. Commodity coagulants and basic pH adjusters sit at the volume base with thin margins, competing mainly on price and delivery reliability. Premium and certified biocides, corrosion inhibitors, and membrane cleaning chemicals occupy the middle tier, commanding stronger margins through formulation expertise and technical service bundling. PFAS remediation chemistry and outcome-based digital service contracts sit at the top, where margins run richest and compet
The tension between volume and premium runs through how formulators allocate research investment. Commodity coagulant manufacturing requires steady throughput to cover fixed costs, pulling suppliers toward volume even as growth slows, while PFAS and specialty membrane chemistry demand sustained research that only pays off once regulatory categories mature. Formulators that lean too far toward either extreme risk losing either the cash generation volume provides or the margin growth premium chemistry delivers.

High-value margin pools concentrate in PFAS remediation chemistry and digital-enabled service contracts, where formulation barriers and regulatory newness keep competition thin and industrial dischargers pay premium prices for compliance certainty. That concentration is likely to deepen as more jurisdictions finalize PFAS discharge standards over the next several years.

Volume / Commodity-Adjacent Tier

Commodity coagulants, flocculants, and basic pH adjusters sold primarily on price and delivery reliability to a broad base of conventional industrial treatment plants worldwide, where switching suppliers costs little beyond requalification paperwork.
Gross Margin: 10%-16%

Premium / Certified Tier

Specialty biocides, corrosion inhibitors, and membrane cleaning chemicals formulated for specific industrial applications, sold with technical service and dosing optimization support bundled in, priced to reflect the formulation expertise regulated buyers require.
Gross Margin: 24%-32%

Sustainability / Regulatory / Next-Generation Tier

PFAS remediation chemistry, advanced oxidation systems, and digital dosing platforms built for the newest and most stringent discharge and reuse requirements, where qualification barriers keep the competitive field narrow and pricing power strongest.
Gross Margin: 34%-42%
industrial-wastewater-treatment-chemicals-market-portfolio-architecture-1787300293553

High-value Sub-segments and Strategic Watch-out

PFAS Remediation Chemistry for Industrial Dischargers

Enforcement deadlines under United States and European Union PFAS regulation are forcing industrial dischargers to specify granular activated carbon and ion exchange chemistry with limited existing supplier competition. Qualification barriers keep the field narrow, and volume is expanding faster than almost any other category tracked in this report.
Gross Margin: 38%-46%

Digital Dosing and Monitoring Service Contracts

Recurring service revenue attached to digital monitoring platforms grows steadily as industrial customers standardize on outcome-based contracts. Growth is moderate compared with PFAS chemistry but margins are among the richest in the portfolio once the underlying platform investment is made, and renewal rates run consistently high.
Gross Margin: 36%-44%

Commodity Coagulants and Flocculants

The largest revenue base by volume, sold into conventional treatment plants worldwide on price and delivery reliability. Growth tracks industrial output closely and margins stay thin, but the segment funds specialty chemistry development across the broader portfolio, making it strategically indispensable despite its low relative margins.
Gross Margin: 10%-16%

Regional Asian Coagulant Exports

Regional Asian formulators are exporting increasingly credible conventional coagulant chemistry at prices well below Western equivalents, initially into Africa and Latin America. If technical gaps close further, this segment could pressure premium pricing industry-wide within the decade, particularly in commodity categories where differentiation is already thin.
Gross Margin: 16%-24%

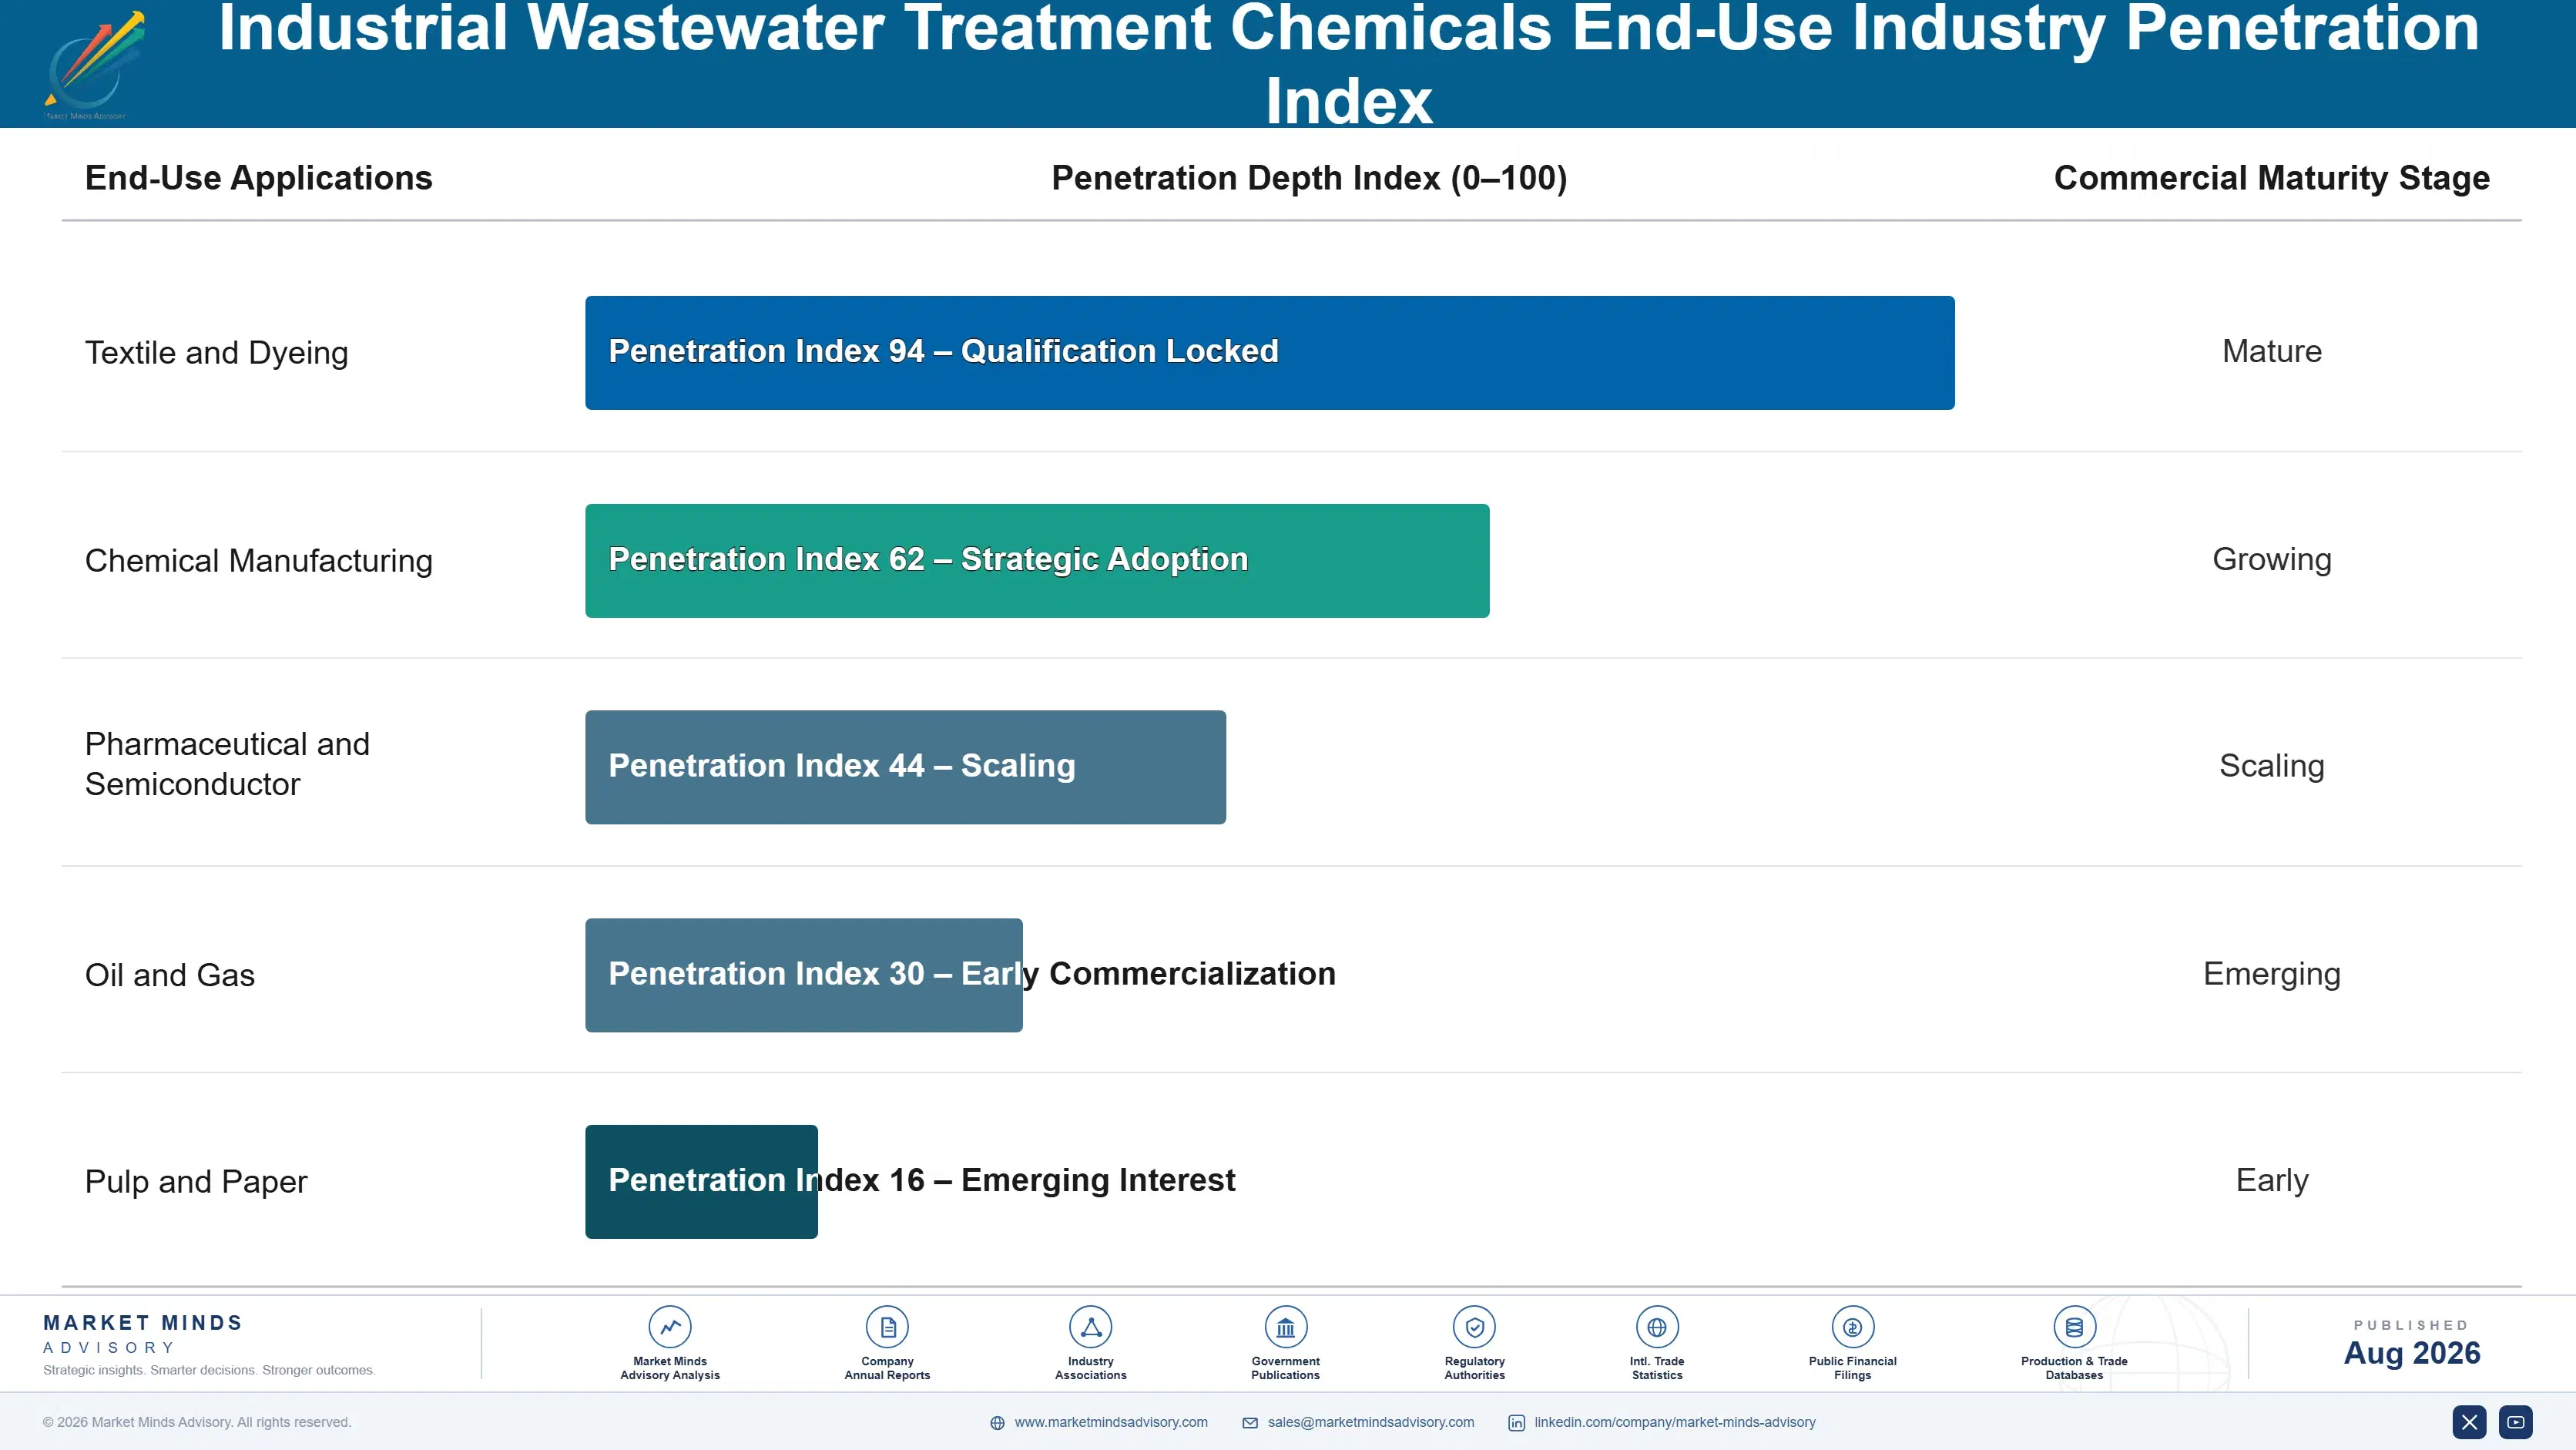
Recurring Chemistry Inside Every Treatment Cycle

Industrial wastewater treatment chemicals generate revenue closer to an annuity than a one-time sale, since every operating plant consumes another dosing cycle of coagulant, biocide, and membrane cleaning chemistry regardless of output swings. That repeat-purchase dynamic gives suppliers more predictable revenue than headline industrial output volatility alone would suggest, provided the formulation stays specified into daily operations.
Adoption depth varies sharply by end-use vertical. Semiconductor and pharmaceutical manufacturers sign multi-year technical service agreements that lock in preferred formulators across their global facility network, creating high switching costs once a chemistry is qualified into a validated process. Conventional manufacturers behave differently, rebidding chemical supply more frequently on a plant-by-plant basis and remaining more price-sensitive, which keeps competition sharper but limits how much recurring revenue any single supplier can count on from that segment.

A generational shift in buyer profiles is underway as environmental, health, and safety officers who trained on digital compliance platforms replace an older generation accustomed to manual sampling and paper compliance logs. That shift favors suppliers with strong digital monitoring and reporting platforms over those competing purely on chemical formulation alone, and it is reshaping which suppliers get invited to bid on new industrial treatment contracts.
industrial-wastewater-treatment-chemicals-market-end-use-penetration-index-1787300294043

Where MMA Sees the Opportunity

These are among the four positions where our research anticipates prominent divergence between winners and laggards over the coming forecast period. Each is grounded in the demand model, the regulatory perimeter, and the announced capacity pipeline.
01 / PFAS CATEGORY LEADERSHIP

Build dedicated PFAS remediation capability ahead of enforcement deadlines

PFAS remediation is emerging as an entirely new specialty chemical category with limited existing supplier competition, and enforcement deadlines under United States and European Union regulation are compressing the window for industrial dischargers to qualify new suppliers. Formulators that have not yet built granular activated carbon, ion exchange, or foam fractionation capability risk missing the highest-margin new category to open in this market in more than a decade. MMA recommends prioritizing PFAS remediation product development over incremental improvements to commodity coagulant lines facing persistent price pressure.
02 / OUTCOME-BASED CONTRACT STRATEGY

Shift toward outcome-based contracts bundling chemistry with digital dosing

Outcome-based contracts that bundle chemical supply with digital dosing optimization let suppliers capture higher margin per dollar of revenue while customers report meaningfully lower total chemical spend, a rare alignment of supplier and customer incentives. Suppliers without digital monitoring capability are increasingly excluded from these higher-margin contract structures as Ecolab and Veolia both expand outcome-based offerings across their largest accounts. MMA recommends building or acquiring digital dosing capability rather than continuing to compete purely on chemical formulation and price alone in an increasingly compliance-driven market.
03 / REGIONAL MANUFACTURING DEFENSE

Defend share against Asian formulators through regional manufacturing

Regional Asian formulators are exporting increasingly credible conventional coagulant and biocide chemistry at prices Western suppliers struggle to match, particularly across Africa and Latin America where price sensitivity runs highest. If that price gap continues widening, Western suppliers risk losing share in commodity categories faster than premium PFAS and digital service growth can offset. MMA recommends accelerating regional manufacturing investment in Asia specifically, rather than continuing to compete on price from higher-cost Western production facilities that cannot match regional cost bases on price alone.
04 / FEEDSTOCK DIVERSIFICATION PRIORITY

Diversify feedstock sourcing to reduce petrochemical price exposure

Petrochemical feedstock volatility compressed formulator margins sharply during 2022's energy crisis, and formulators without long-term supply contracts or geographic sourcing diversity absorbed the largest share of that cost increase. European formulators specifically face compounding exposure from both feedstock costs and regional natural gas prices that remain elevated relative to United States and Middle Eastern competitors. MMA recommends diversifying feedstock sourcing geographically and accelerating bio-based coagulant qualification ahead of the next volatility cycle, which historical patterns suggest is unlikely to be far off.

Engagement Snapshot From the Field

A live engagement with an industry participant carrying material or product regulatory and market exposure ahead of a defining policy shift, showing how our research translates into a defensible multi-year portfolio strategy.
MARKET MINDS ADVISORY · CLIENT ENGAGEMENT SUMMARY
Industrial Wastewater Treatment Chemicals Producer Strategic Portfolio Review and Transition Roadmap 2026·Investment Scenario on Industrial Wastewater Treatment Chemicals Exposure Evaluation 2025-26
CLIENT PROFILE
The client is a multinational textile and dyeing manufacturer operating four facilities across India and Vietnam, reporting approximately 180 million dollars in annual water treatment and compliance capital expenditure (client-reported, unverified by MMA). The company faced new zero liquid discharge mandates at its Tamil Nadu facility and was evaluating whether to convert proactively at its other three facilities or wait for mandates to expand.
STRATEGIC CHALLENGE
Leadership needed to determine whether proactive zero liquid discharge conversion across all four facilities would be more cost-effective than facility-by-facility conversion as mandates expanded, and whether specialty chemistry costs at scale would offset the capital savings of a phased rather than simultaneous approach, given the company's constrained annual capital budget for compliance projects.
MMA APPROACH
MMA benchmarked specialty chemistry and capital costs across comparable zero liquid discharge conversions in India's textile sector, modeling total cost of ownership under phased versus simultaneous conversion scenarios. The engagement combined primary interviews with three chemical supplier technical teams and secondary analysis of regulatory expansion timelines to project when mandates would likely reach the client's remaining facilities.
KEY FINDINGS
  1. Specialty chemistry costs for zero liquid discharge conversion ran approximately 45 percent higher per unit of water treated than conventional discharge-based treatment at the Tamil Nadu facility (client-reported, unverified by MMA).
  2. Simultaneous conversion across all four facilities would have required an estimated 60 million dollars in upfront capital, compared with 38 million dollars for phased conversion over three years (client-reported, unverified by MMA).
  3. Regulatory timeline analysis indicated mandates were likely to reach the client's Vietnam facilities within two to three years, narrowing the cost advantage of delaying conversion there.
  4. Chemical suppliers offered meaningfully better technical service and dosing optimization pricing when contracted across multiple facilities simultaneously rather than facility by facility (client-reported, unverified by MMA).
CLIENT PROFILE
The client is a multinational textile and dyeing manufacturer operating four facilities across India and Vietnam, reporting approximately 180 million dollars in annual water treatment and compliance capital expenditure (client-reported, unverified by MMA). The company faced new zero liquid discharge mandates at its Tamil Nadu facility and was evaluating whether to convert proactively at its other three facilities or wait for mandates to expand.
STRATEGIC CHALLENGE
Leadership needed to determine whether proactive zero liquid discharge conversion across all four facilities would be more cost-effective than facility-by-facility conversion as mandates expanded, and whether specialty chemistry costs at scale would offset the capital savings of a phased rather than simultaneous approach, given the company's constrained annual capital budget for compliance projects.
MMA APPROACH
MMA benchmarked specialty chemistry and capital costs across comparable zero liquid discharge conversions in India's textile sector, modeling total cost of ownership under phased versus simultaneous conversion scenarios. The engagement combined primary interviews with three chemical supplier technical teams and secondary analysis of regulatory expansion timelines to project when mandates would likely reach the client's remaining facilities.
KEY FINDINGS
  1. Specialty chemistry costs for zero liquid discharge conversion ran approximately 45 percent higher per unit of water treated than conventional discharge-based treatment at the Tamil Nadu facility (client-reported, unverified by MMA).
  2. Simultaneous conversion across all four facilities would have required an estimated 60 million dollars in upfront capital, compared with 38 million dollars for phased conversion over three years (client-reported, unverified by MMA).
  3. Regulatory timeline analysis indicated mandates were likely to reach the client's Vietnam facilities within two to three years, narrowing the cost advantage of delaying conversion there.
  4. Chemical suppliers offered meaningfully better technical service and dosing optimization pricing when contracted across multiple facilities simultaneously rather than facility by facility (client-reported, unverified by MMA).
RECOMMENDED STRATEGY
Phase 1: Phase 1 (Months 1 to 6): Complete zero liquid discharge conversion at the Tamil Nadu facility and negotiate a multi-facility technical service contract covering all four sites. Phase 2: Phase 2 (Months 7 to 24): Convert the two Vietnam facilities ahead of anticipated regulatory expansion, capturing early-mover technical service pricing. Phase 3: Phase 3 (Months 25 to 36): Complete conversion at the remaining Indian facility, standardizing chemistry and dosing platforms across the full four-site network.
OUTCOME
Within two years of beginning phased conversion, the client reported specialty chemistry and capital costs running approximately 22 percent below the simultaneous conversion scenario, while achieving compliance ahead of regulatory deadlines at three of four facilities (client-reported, unverified by MMA). The company has since adopted phased conversion as its standard approach for future regulatory compliance projects.

Frequently Asked Questions

Foundational context covering the market sizes, CAGR, scope, country, region and competition that inform every finding below. This section is provided to cover basics and most often pre-purchase conversations, answered from the MMA Primary Research Dataset.

What is the current size of the Industrial Wastewater Treatment Chemicals Market?

The global industrial wastewater treatment chemicals market was valued at approximately 5.6 billion dollars in 2025. Growth is driven primarily by tightening discharge regulation and zero liquid discharge adoption.

How large will the Industrial Wastewater Treatment Chemicals Market be by 2036?

MMA forecasts the market reaching approximately 11.2 billion dollars by 2036, roughly 1.88 times its 2026 value. PFAS remediation and specialty membrane chemistry account for much of that growth.

What is the CAGR for the Industrial Wastewater Treatment Chemicals Market 2026 to 2036?

The market is projected to grow at a 6.5 percent compound annual rate over the forecast period. Bull and bear scenarios range from 5.2 to 7.8 percent depending on PFAS regulatory timelines.

Which segment is growing fastest?

Specialty resins and membrane cleaning chemicals are the fastest-growing segment, expanding at roughly 1.38 times the overall market rate. Reverse osmosis and zero liquid discharge adoption is the primary driver.

Who are the major companies in the Industrial Wastewater Treatment Chemicals Market?

Ecolab, Veolia, Kemira, BASF, and Solenis lead the market on a revenue basis. Together they hold under two-fifths of global revenue in a fragmented field.

Which country is growing fastest?

India is the fastest-growing country, driven by rapid zero liquid discharge conversion across its textile and dyeing sector. Regulatory mandates are leaving manufacturers with limited compliance alternatives.

Report Segmentation Architecture

The full report scope spans multiple orthogonal segmentation dimensions, with cross-tabulated demand data provided for each dimension pair. Coverage extends further to regional breakdowns, trend trajectories, and the competitive detail needed to support segment-level decision-making.

By Chemical Function

  • Coagulants and Flocculants
  • Biocides and Disinfectants
  • Scale and Corrosion Inhibitors
  • pH Adjusters and Neutralizers
  • Defoamers and Antifoams
  • Specialty Resins and Membrane Cleaning Chemicals

By End-Use Industry

  • Textile and Dyeing
  • Chemical Manufacturing
  • Pharmaceutical and Semiconductor
  • Oil and Gas
  • Pulp and Paper

By Commercial Model

  • Direct Chemical Sale
  • Outcome-Based Service Contract
  • Digital Dosing Subscription
  • Technical Service Bundle

By Region

  • North America
  • Western Europe
  • East Asia
  • South Asia and Pacific
  • Latin America
  • Middle East and Africa
  • Eastern Europe

Scope, Methodology, and Coverage

Every figure in this report is reproducible from documented input assumptions. The scope below maps the historical period, the forecast horizon, the segmentation dimensions, and the countries covered, alongside the underlying primary and qualitative methodology.
Historical Period
2020 to 2025
Forecast Period
2026 to 2036
Base Year
2025 (USD billions; MMA Primary Research Dataset, August 2026)
Market Definition
The industrial wastewater treatment chemicals market covers coagulants and flocculants, biocides and disinfectants, scale and corrosion inhibitors, pH adjusters and neutralizers, defoamers and antifoams, and specialty resins and membrane cleaning chemicals used to treat industrial process and effluent water. It excludes municipal drinking water treatment chemicals, wastewater treatment equipment, and residential water softening products.
Quantitative Units
USD billions (current prices); volume shipments in metric tons where applicable
Segmentation Dimensions
By Chemical Function; By End-Use Industry; By Commercial Model; By Region
Regions Covered
North America, Western Europe, East Asia, South Asia and Pacific, Latin America, Middle East and Africa, Eastern Europe
Countries Covered
USA, China, Germany, France, UK, Japan, South Korea, India, Australia, Canada, Brazil, Mexico, Indonesia, Vietnam, Thailand, Malaysia, UAE, Saudi Arabia, South Africa, Nigeria, Turkey, Poland, Netherlands, Italy, Spain, Sweden, Switzerland, Argentina, Colombia, Singapore, and additional markets relevant to this sector
Key Companies Profiled
Ecolab, Veolia, Kemira, BASF, Solenis, Kurita Water Industries, SNF Group, Buckman Laboratories, ChemTreat, Feralco, Chembond Chemicals, Thermax, Aquafine Corporation, Hydrite Chemical, Ashland Global Holdings, Accepta Ltd, Kemipex, Dow Water Solutions, Evoqua Water Technologies, Xylem Inc.
Quantitative Methodology
Primary survey, n=3,800 respondents, Q4 2025, six countries; demand-side model with trade association cross-validation
Qualitative Methodology
47 expert interviews, Q4 2025; applied to validate demand model assumptions, identify emerging dynamics, and assess competitive positioning
Report Format
PDF and XLSX data workbook (Word format preview document)
Publisher
Market Minds Advisory
Report Code
MMA-2026-CHM-103
Published
August 2026
Contact
sales@marketmindsadvisory.com | www.marketmindsadvisory.com

Purchase the full Industrial Wastewater Treatment Chemicals Market Report (2026 to 2036).

The full report provides detailed sizing and ten-year forecasts for each of the six chemical categories tracked in this analysis, alongside country-level detail across thirty markets. It includes a complete competitive benchmarking of the top twenty suppliers on a revenue basis, with moat and risk analysis for the two market leaders. The report also contains a dedicated feedstock cost and supply chain risk assessment, plus scenario modeling across bull, base, and bear cases through 2036. Buyers receive access to the underlying primary survey and expert interview datasets referenced throughout the analysis.
Ten-year forecasts across all six chemical categories
Competitive benchmarking of twenty profiled chemical suppliers
Petrochemical feedstock and supply chain risk analysis
Bull, base, and bear scenario modeling through 2036
Country-level sizing across thirty tracked national markets
Access to underlying primary survey and interview data

Built For The People Who Decide

From boardroom strategy to bench-side execution, this report is read cover-to-cover by leaders shaping the next decade of their industry, turning demand scenarios, market dynamics and valuation benchmarks into decisions.
CXOs/ Presidents/ VPs/ Managers
M&A and Corporate Development
Strategy Teams and R&D Heads
Procurement and Product Directors
Regulatory and Compliance Leaders
Investor Relations and Equity Analysts