Market Minds Advisory
Industrial Salt Market

Industrial Salt Market: delivered cost geography, demand volatility and byproduct brine supply to 2036

Freight is 47% of what industrial salt costs delivered, which means nobody in this business competes with anybody more than four hundred kilometres away and everybody prices as though they might.

Lead Analyst

Bilal Shaikh

Published

September 2026

Make Smarter Decisions with Customized Research Insights

Request a free sample report and evaluate market opportunities, growth trends, and competitive dynamics relevant to your business needs.

2025 MARKET VALUE$14.8BMarket Size 2025
2036 FORECAST VALUE$21.8BBase Case , 2026 to 2036
CAGR 2026 TO 20363.6 %Bull 4.8% / Bear 2.4%
INCREMENTAL OPPORTUNITY$6.5BNet 10- year value creation
EXPANSION MULTIPLE1.42x2036 value over 2026 base
Strategic Levers
M&A Pipeline
Regional Outlook
Country Rankings
Competitive Intelligence
Segmental Deep-dive
Call-Us : 91 93563 13602

Executive Snapshot and Market Trajectory

Industrial salt is a geography business wearing a commodity costume. Freight accounts for 47% of delivered cost and the economic haul radius runs about 400 kilometres, which means every producer competes inside a circle and nobody competes globally at all despite how the market gets described. That distinction governs everything.
Solution mining grows at 5.4%, half again the market rate of 3.6%, and the reason has nothing to do with salt: hydrogen and gas storage caverns are being created across Europe and North America and the brine comes out as a byproduct. East Asia holds 30% of value on chlor-alkali capacity that keeps expanding while European capacity closes. Nobody planned that supply at all.
Five producers hold 41% of tonnage and the number means considerably less than it would in most industries, since concentration inside any given haul radius is far higher than the global figure suggests. Chlor-alkali takes 44% of demand and ties this market to construction activity through PVC. De-icing takes most of the rest and swings 34% between a mild winter and a severe one, which makes annual forecasting close to meaningless.
Market Definition
This report covers salt produced for industrial, chemical and de-icing use, spanning rock salt, solar evaporated salt, vacuum evaporated salt, solution mined brine, recovered brine from industrial streams and byproduct salt from potash and soda ash operations. Value is measured at producer level across all end-use channels. Excluded are table and culinary salt sold in retail packaging, potassium and magnesium salts, nitrate salts for thermal storage, and salt substitutes of any kind.
Base Year Value
$14.8B in 2025 (MMA Primary Research Dataset, August 2026)
Forecast Period
2026 to 2036, eleven discrete annual values
CAGR
3.6% base case. Bull 4.8%. Bear 2.4%.
Fastest Growth Segment
Solution Mining: 5.4% CAGR
Fastest Growth Country
India: 6.2% CAGR
Fastest Growth Region
South Asia and Pacific: 5.6% CAGR
Largest Region
East Asia: 30% of 2025 global value
Market Leaders
K+S, Compass Minerals, Cargill, Tata Chemicals and China National Salt Industry Group lead the market. Source: MMA Primary Research Dataset, July 2026.
Primary Survey
n=3,800 procurement and R&D decision-makers, Q4 2025, six countries
Methodology
Demand-side build-up, cross-validated against public data, 47 expert interviews

Industrial Salt Market Forecast Scenarios

industrial-salt-market-size-forecast-scenario-1787553392966
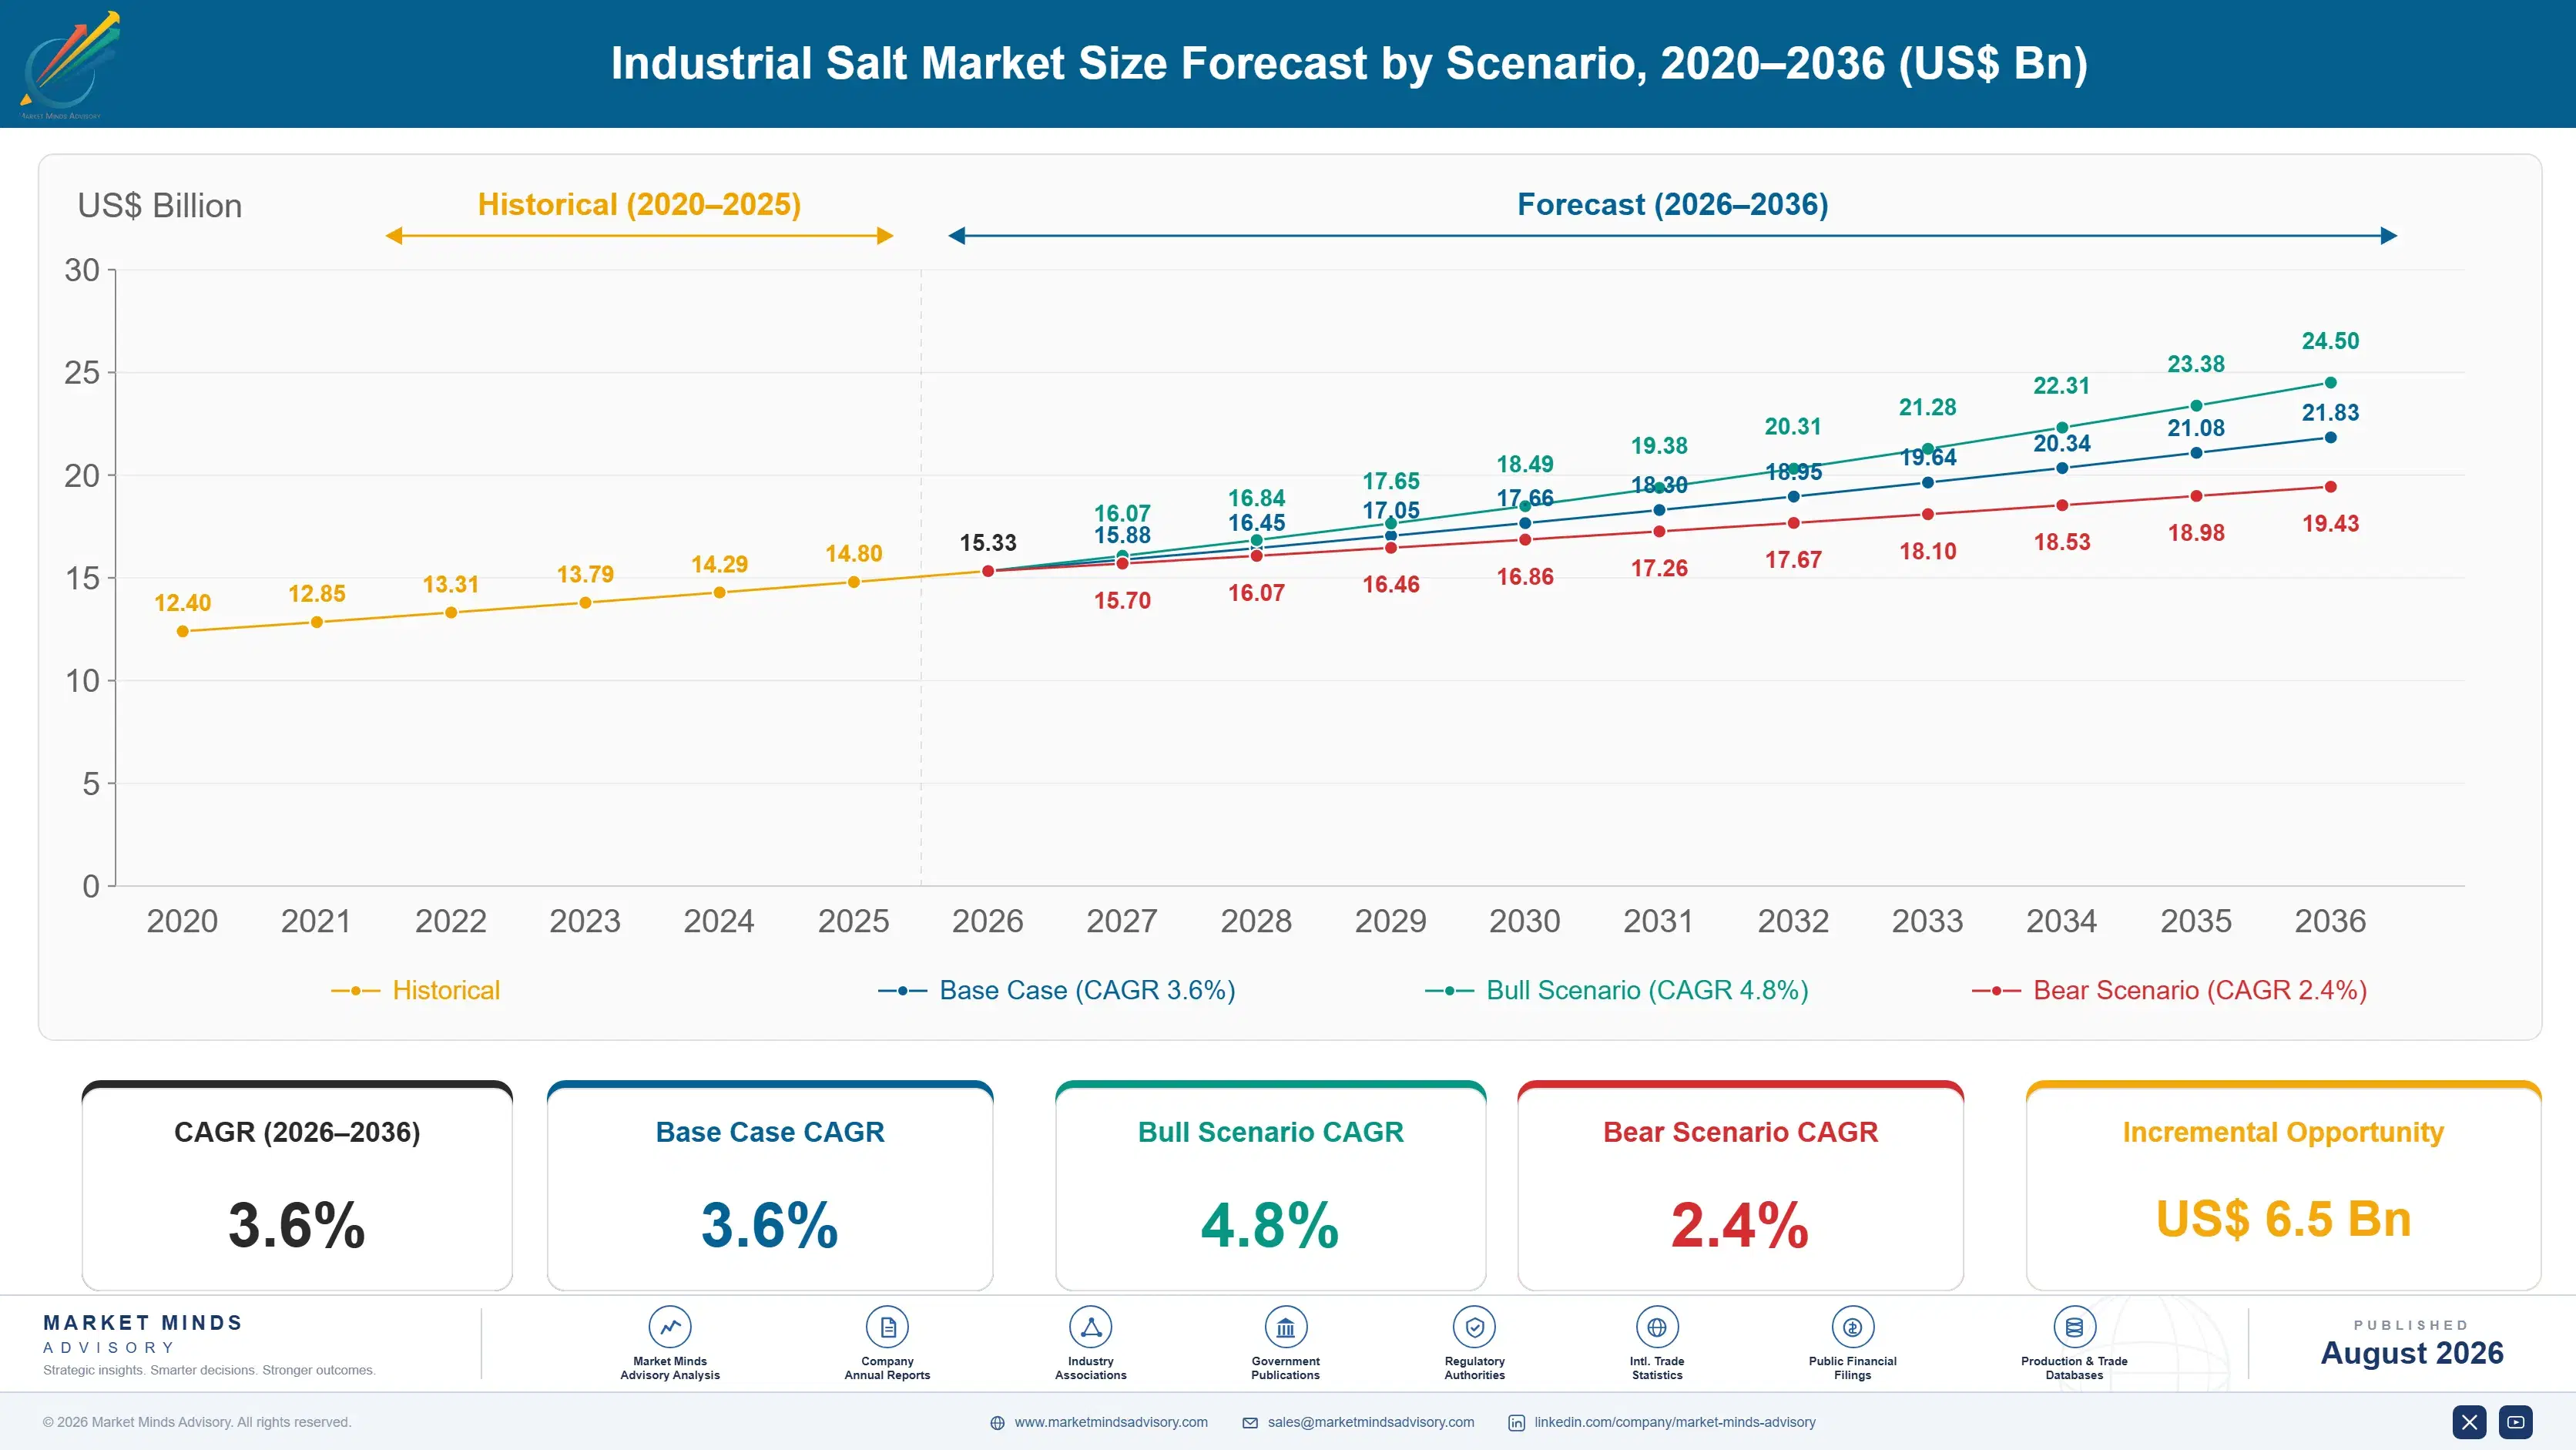
Growth ran at 2.8% between 2020 and 2025 and weather explained more of the variation than economics did. Two mild North American and European winters removed de-icing tonnage that nobody replaced, while chlor-alkali demand recovered with construction after 2020 and then flattened again in Europe. Water treatment salt grew steadily throughout on residential softener installation. Nothing about that pattern was forecastable.
The 3.6% base case rests on three mechanisms. Asian chlor-alkali capacity keeps expanding on PVC demand from construction that has years left in it, which pulls 44% of this market along with it. Salt cavern creation for hydrogen and natural gas storage keeps producing solution mined brine as a byproduct across Europe and North America. And industrial water treatment keeps growing everywhere, driven by discharge requirements rather than by any commercial preference.
The 4.8% bull case is a run of severe winters, which sounds unserious and moves this market more than anything else on the list. The 2.4% bear case is chloride discharge regulation spreading: several jurisdictions already restrict self-regenerating water softeners and road salt application, and freshwater chloride contamination is becoming a genuine regulatory issue rather than an environmental complaint.

Why Geography Decides Everything

Salt sells for around USD 61 a tonne at the mine gate and costs more than that to move four hundred kilometres, which is the single fact that explains this industry. Nobody competes globally because nobody can afford to. A producer competes with whoever else sits inside the same haul radius, and outside that circle the market may as well be on another continent. Concentration measured globally at 41% therefore says almost nothing about the competitive intensity any particular customer actually faces.
TOP-FIVE CONCENTRATION41%Combined position across industrial salt supply held by leaders
CHLOR-ALKALI DEMAND SHARE44%Portion of tonnage consumed producing chlorine and caustic soda
FREIGHT COST SHARE47%Portion of delivered cost attributable to transport rather than product
ECONOMIC HAUL RADIUS400 kmDistance beyond which delivered product stops competing on price
AVERAGE PRODUCER PRICEUSD 61Mean price per tonne at the production site gate
WINTER DEMAND VARIANCE34%Swing between mild and severe de-icing seasons in tonnage
Demand splits between two customers who have nothing in common. Chlor-alkali plants take 44% of tonnage on annual contracts, consume continuously and care about consistency and price. De-icing authorities take most of the balance, order against weather nobody can forecast, and swing 34% between a mild season and a severe one. Serving both means holding inventory for a customer who may not call and running a plant for one who never stops.
Freight at 47% of delivered cost also decides who wins a tender. A producer three hundred kilometres from a customer beats one six hundred kilometres away regardless of production cost, which makes terminal location and rail access more valuable than any efficiency in the plant itself.
"Every producer in this industry talks about cost per tonne and the number that decides tenders is cost per tonne delivered, which is a different figure entirely. The companies doing well bought terminals and rail sidings while everybody else was optimising evaporators."
Director, Industrial Minerals and Bulk Chemicals Practice · MMA Chemicals and Materials Practice · August 2026

Market Trends

Energy storage caverns produce brine nobody ordered

Creating an underground cavern for hydrogen or natural gas storage means dissolving salt with water and pumping the brine out, and Europe and North America are creating caverns at a pace the energy transition has driven rather than the salt industry. The brine has to go somewhere. Where a chlor-alkali plant or evaporation facility sits nearby it becomes saleable product at very low marginal cost, and where one does not it becomes a disposal problem. Growth at 5.4% in solution mining reflects that. The commercial effect is supply arriving in specific locations for reasons entirely unrelated to salt demand.
Market Impact: Consumes 44% of total tonnage
Chloride discharge regulation reaches de-icing and water softening

Freshwater chloride concentrations have risen measurably across northern American and European catchments, and chloride does not degrade or precipitate out the way most contaminants do. Several American states now restrict self-regenerating water softeners and municipalities are cutting road salt application rates through brine pre-wetting, which uses considerably less material for the same result. Neither change is dramatic on its own and together they remove tonnage permanently. Producers have generally treated this as an environmental complaint rather than a demand forecast, which is a mistake the water treatment industry made about phosphates. Nobody enjoys being reminded of that.
Market Impact: Grows at 5.6% across Asia

Market Opportunities and Growth Drivers

Chlor-alkali capacity expansion pulls the largest demand block

Chlorine and caustic soda production consumes 44% of industrial salt tonnage and does so continuously, which makes it the only genuinely predictable demand in this market. Chlorine goes overwhelmingly into PVC and PVC goes into construction, so the demand ultimately tracks building activity with a lag. Asian capacity keeps expanding on regional construction while European capacity has been closing on energy cost, which relocates salt demand rather than removing it. A chlor-alkali plant sited next to a salt deposit is the classic arrangement and remains the cheapest way to make chlorine anywhere.
Market Impact: Caps competition at 400 km

Industrial water treatment expands under discharge requirements

Salt regenerates ion exchange resin and that is how a great deal of industrial water gets softened and demineralised, which ties this demand to water discharge regulation rather than to any commercial decision. Tightening effluent standards across India, China and Southeast Asia are pushing treatment onto plants that previously discharged untreated. Boiler feedwater, cooling tower makeup and process water all consume regenerant salt continuously. This demand is small per site and enormous in aggregate, and unlike de-icing it does not vary with weather or unlike chlor-alkali with construction cycles. That predictability is worth a great deal.
Market Impact: Swings 34% between seasons

Market Restraints and Challenges

Freight cost caps every producer inside a haul radius

Freight accounts for 47% of delivered cost and the economic haul radius runs about 400 kilometres, beyond which a producer simply cannot compete on price regardless of how efficient the plant is. The root cause is that salt is heavy and cheap, and no logistics improvement changes that ratio meaningfully. Commercially this means growth requires new production sites rather than new customers, which is capital intensive and geographically constrained by where salt deposits actually are. Producers have responded by acquiring terminals and rail infrastructure to extend the effective radius, and by buying competitors inside adjacent circles.
Market Impact: Segment growing at 5.4%

Winter demand variance makes capacity planning nearly impossible

De-icing tonnage swings around 34% between a mild season and a severe one, and nobody can forecast which is coming. The root problem is that the customer is a highway authority buying insurance against weather rather than a manufacturer consuming to a production plan. Commercially this forces producers to carry inventory through summer for demand that may not arrive, or to disappoint customers when it does. Some now sell against multi-year requirements contracts with minimum volumes, and several have deliberately rebalanced toward chemical and water treatment customers whose demand behaves predictably. That rebalancing costs margin and buys sleep.
Market Impact: Cuts application rates by 30%
3 additional market trends, 4 additional growth drivers, and 2 additional restraints and challenges are covered in the full report. Contact sales@marketmindsadvisory.com to access the complete intelligence.

Segment CAGR and Growth Architecture

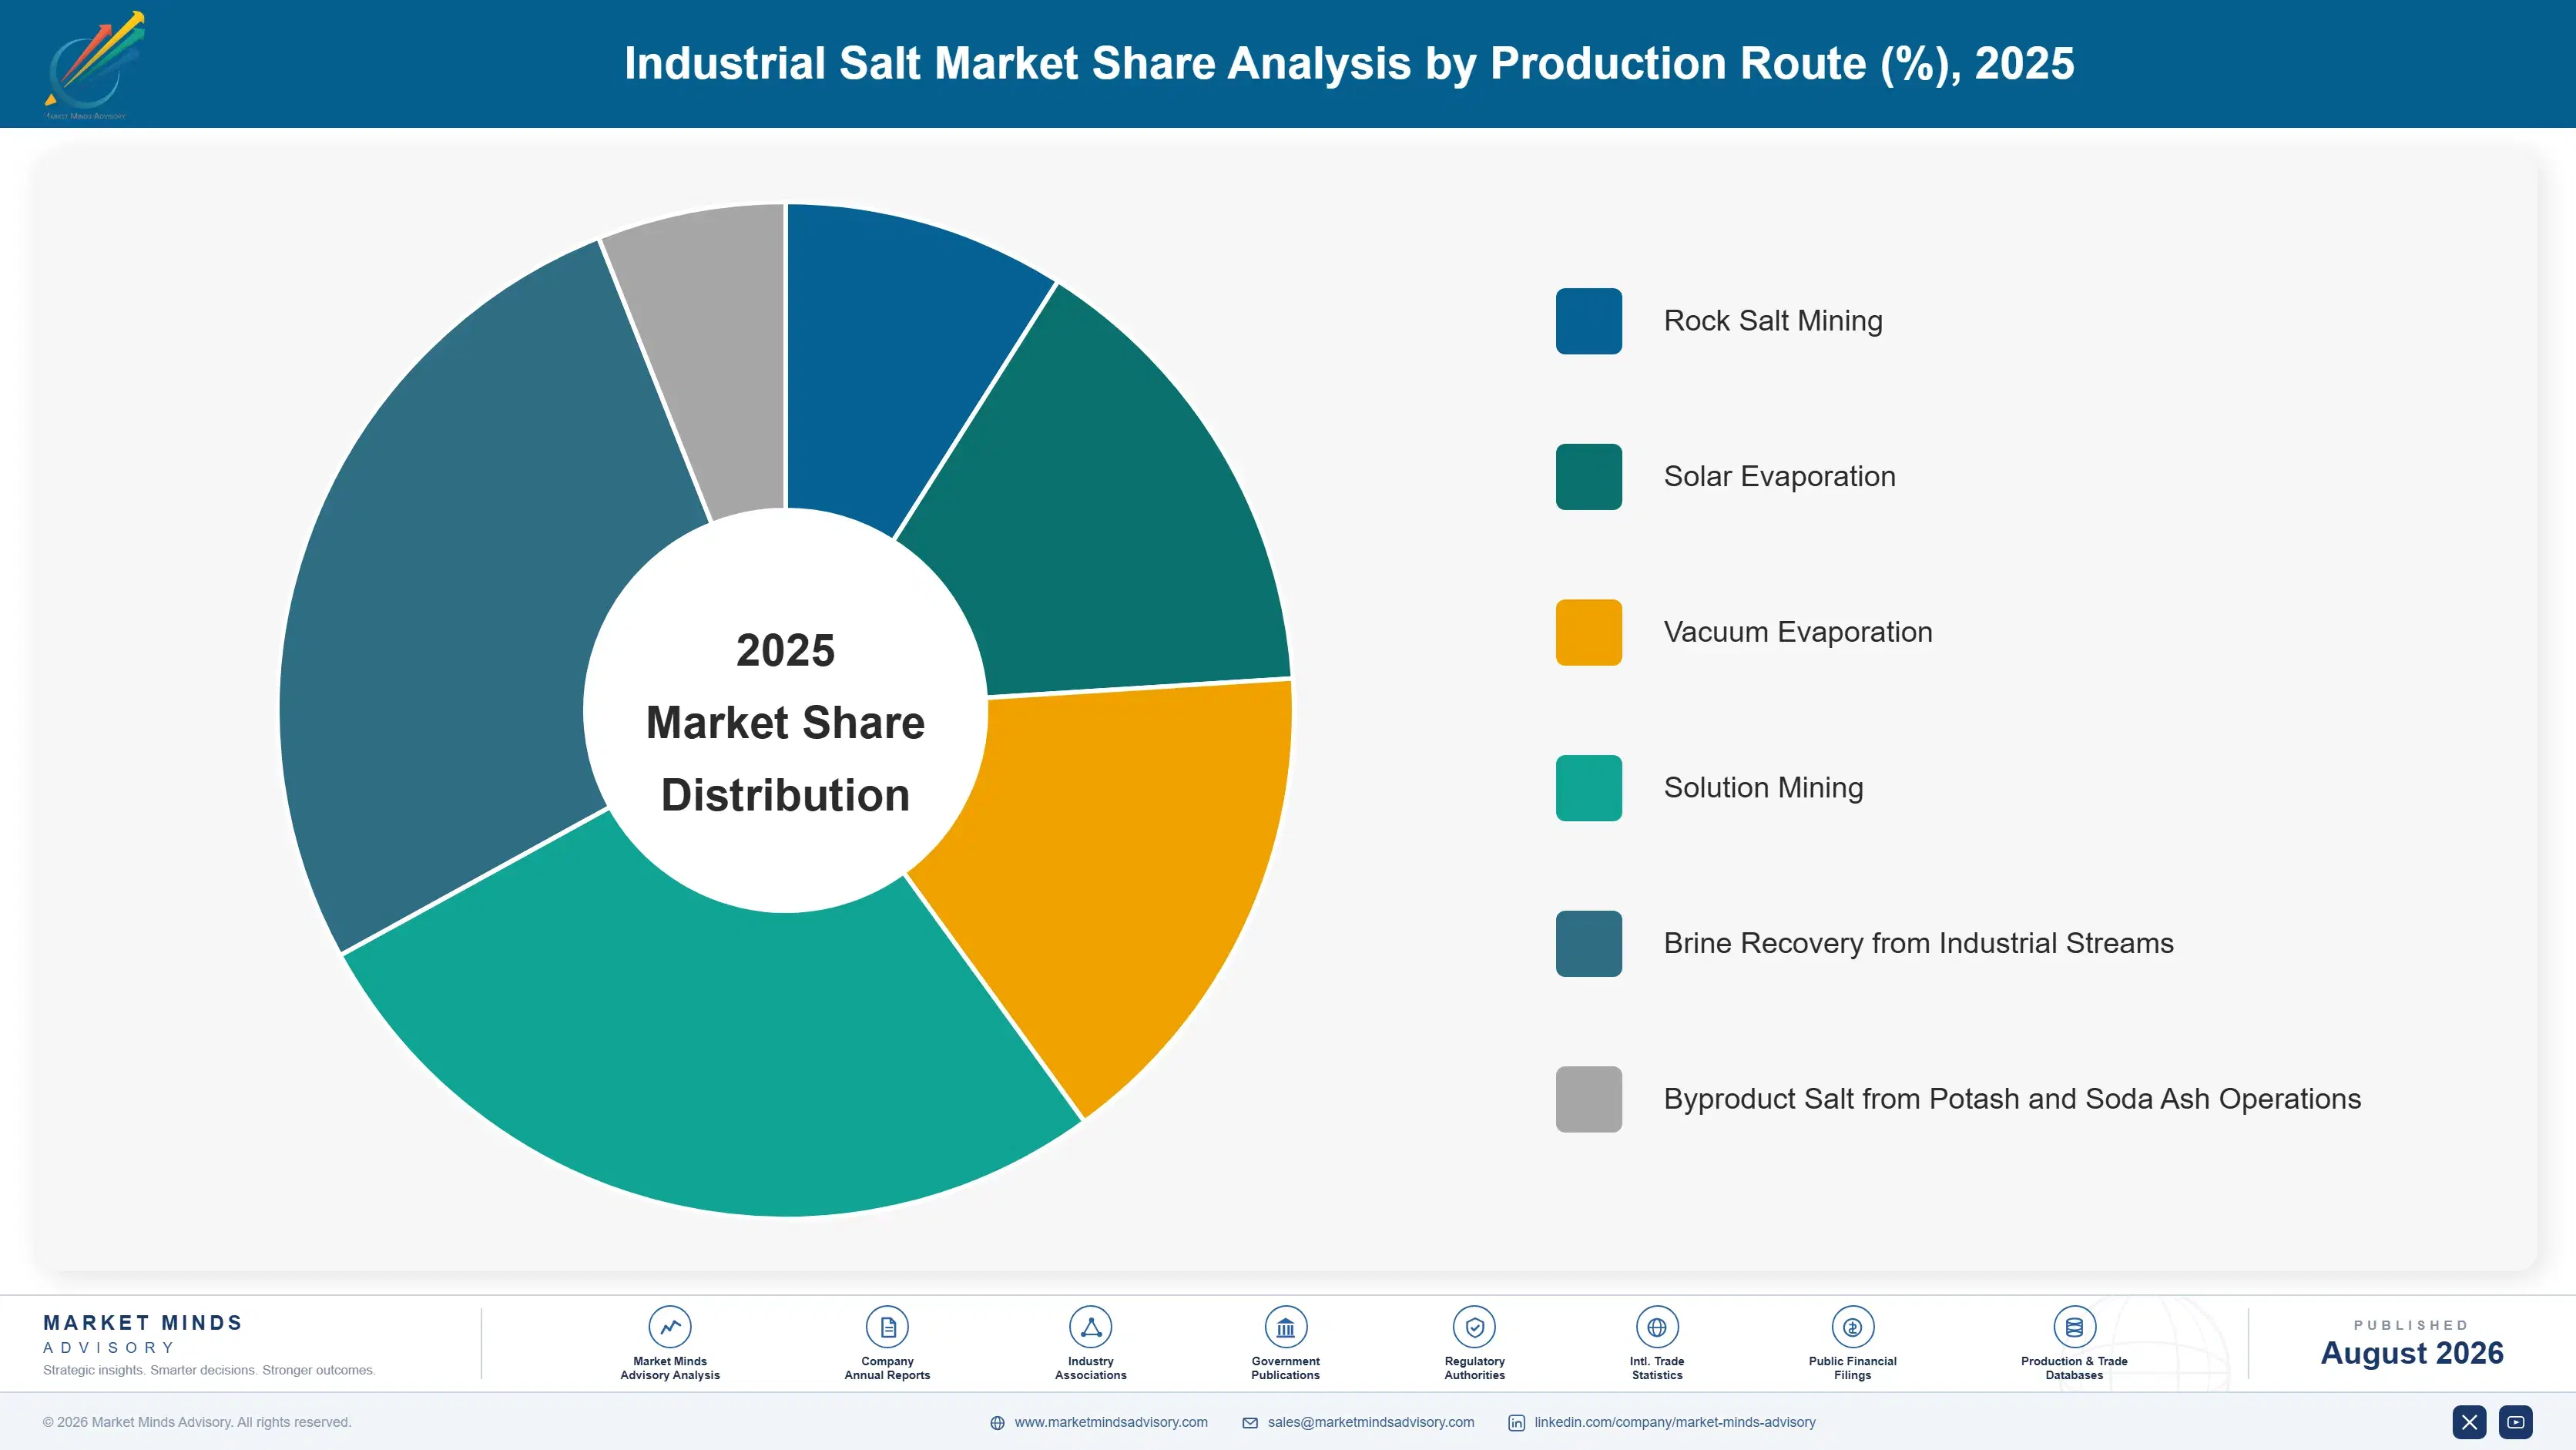
Salt is classified here by production route, because the method determines purity, cost structure, capital intensity and where a producer can physically operate. End-use industry, product form and sales channel are handled separately in the framework, since a single production route supplies chemical, de-icing and water treatment customers from the same site without alteration.
industrial-salt-market-market-share-analysis-1787553393496

Solution Mining

Growing at 5.4%, half again the market rate, and growing for reasons that have very little to do with salt demand. Dissolving underground salt and pumping brine to surface is the cheapest way to produce chemical-grade feedstock, which is why chlor-alkali plants sit on top of salt formations wherever geology permits. What has accelerated it is cavern creation for hydrogen and natural gas storage: the energy transition needs those caverns and dissolving them produces brine as an unavoidable byproduct. Where a consumer sits nearby that brine is nearly free product. Where none does it is a disposal cost, which makes location the entire commercial question in this segment. Geology decided that a very long time ago.
CAGR 5.4%

Brine Recovery from Industrial Streams

This segment barely existed as a commercial category ten years ago and it exists now because discharge regulation created it. Zero liquid discharge requirements across Indian and Chinese industrial zones force plants to recover salt from effluent rather than discharging it, which produces material that displaces purchased salt at the same site. Growth at 5.1% therefore represents demand destruction wearing a supply growth costume, which is an uncomfortable thing for a producer to look at. Recovered salt quality varies enormously and the higher grades reach chlor-alkali specification. Textile, tannery and pharmaceutical effluent are the principal streams, and the volumes involved are rising faster than anybody in the salt industry has modelled.
CAGR 5.1%
Full segment breakdown across 6 segments available in the complete report.

Regional Architecture and Country Demand Map

East Asia holds 30% of value on chlor-alkali capacity that keeps expanding while European capacity closes. North America follows at 26% on de-icing demand no other region approaches. Chemistry and weather between them explain almost this entire map. Geology explains where the producers actually are.

North America

De-icing demand here has no equivalent anywhere and it is what makes this region the second largest. Highway authorities across the northern states and Canadian provinces buy against winters nobody can forecast, and tonnage swings 34% between a mild season and a severe one. Chlor-alkali demand along the Gulf Coast consumes salt from Louisiana and Texas domes at costs that reflect how close the two sit. Compass Minerals and Cargill dominate through deposit position and terminal networks rather than through anything technical. Growth at 3.0% is modest and chloride discharge regulation is the risk nobody in the industry takes seriously enough yet. That complacency will change within a few years.
Share: 26% | CAGR: 3.0% (2026 to 2036)

Western Europe

European chlor-alkali capacity has been closing on energy cost for a decade and every closure removes salt demand permanently, which is why growth at 2.0% is the weakest of the seven regions by a clear margin. German and Dutch producers hold deposit positions and solution mining operations serving what remains. De-icing demand across the Alpine and Nordic markets is substantial and increasingly constrained by environmental pressure on chloride runoff into lakes and groundwater. Salt cavern creation for hydrogen storage is the one genuinely expanding activity, and it produces brine as a byproduct rather than as a product anybody planned to sell. That byproduct is quietly becoming a real commercial question.
Share: 20% | CAGR: 2.0% (2026 to 2036)
Regional intelligence for 5 additional markets available in the complete report: East Asia, South Asia and Pacific, Latin America, Middle East and Africa, Eastern Europe. Contact sales@marketmindsadvisory.com.
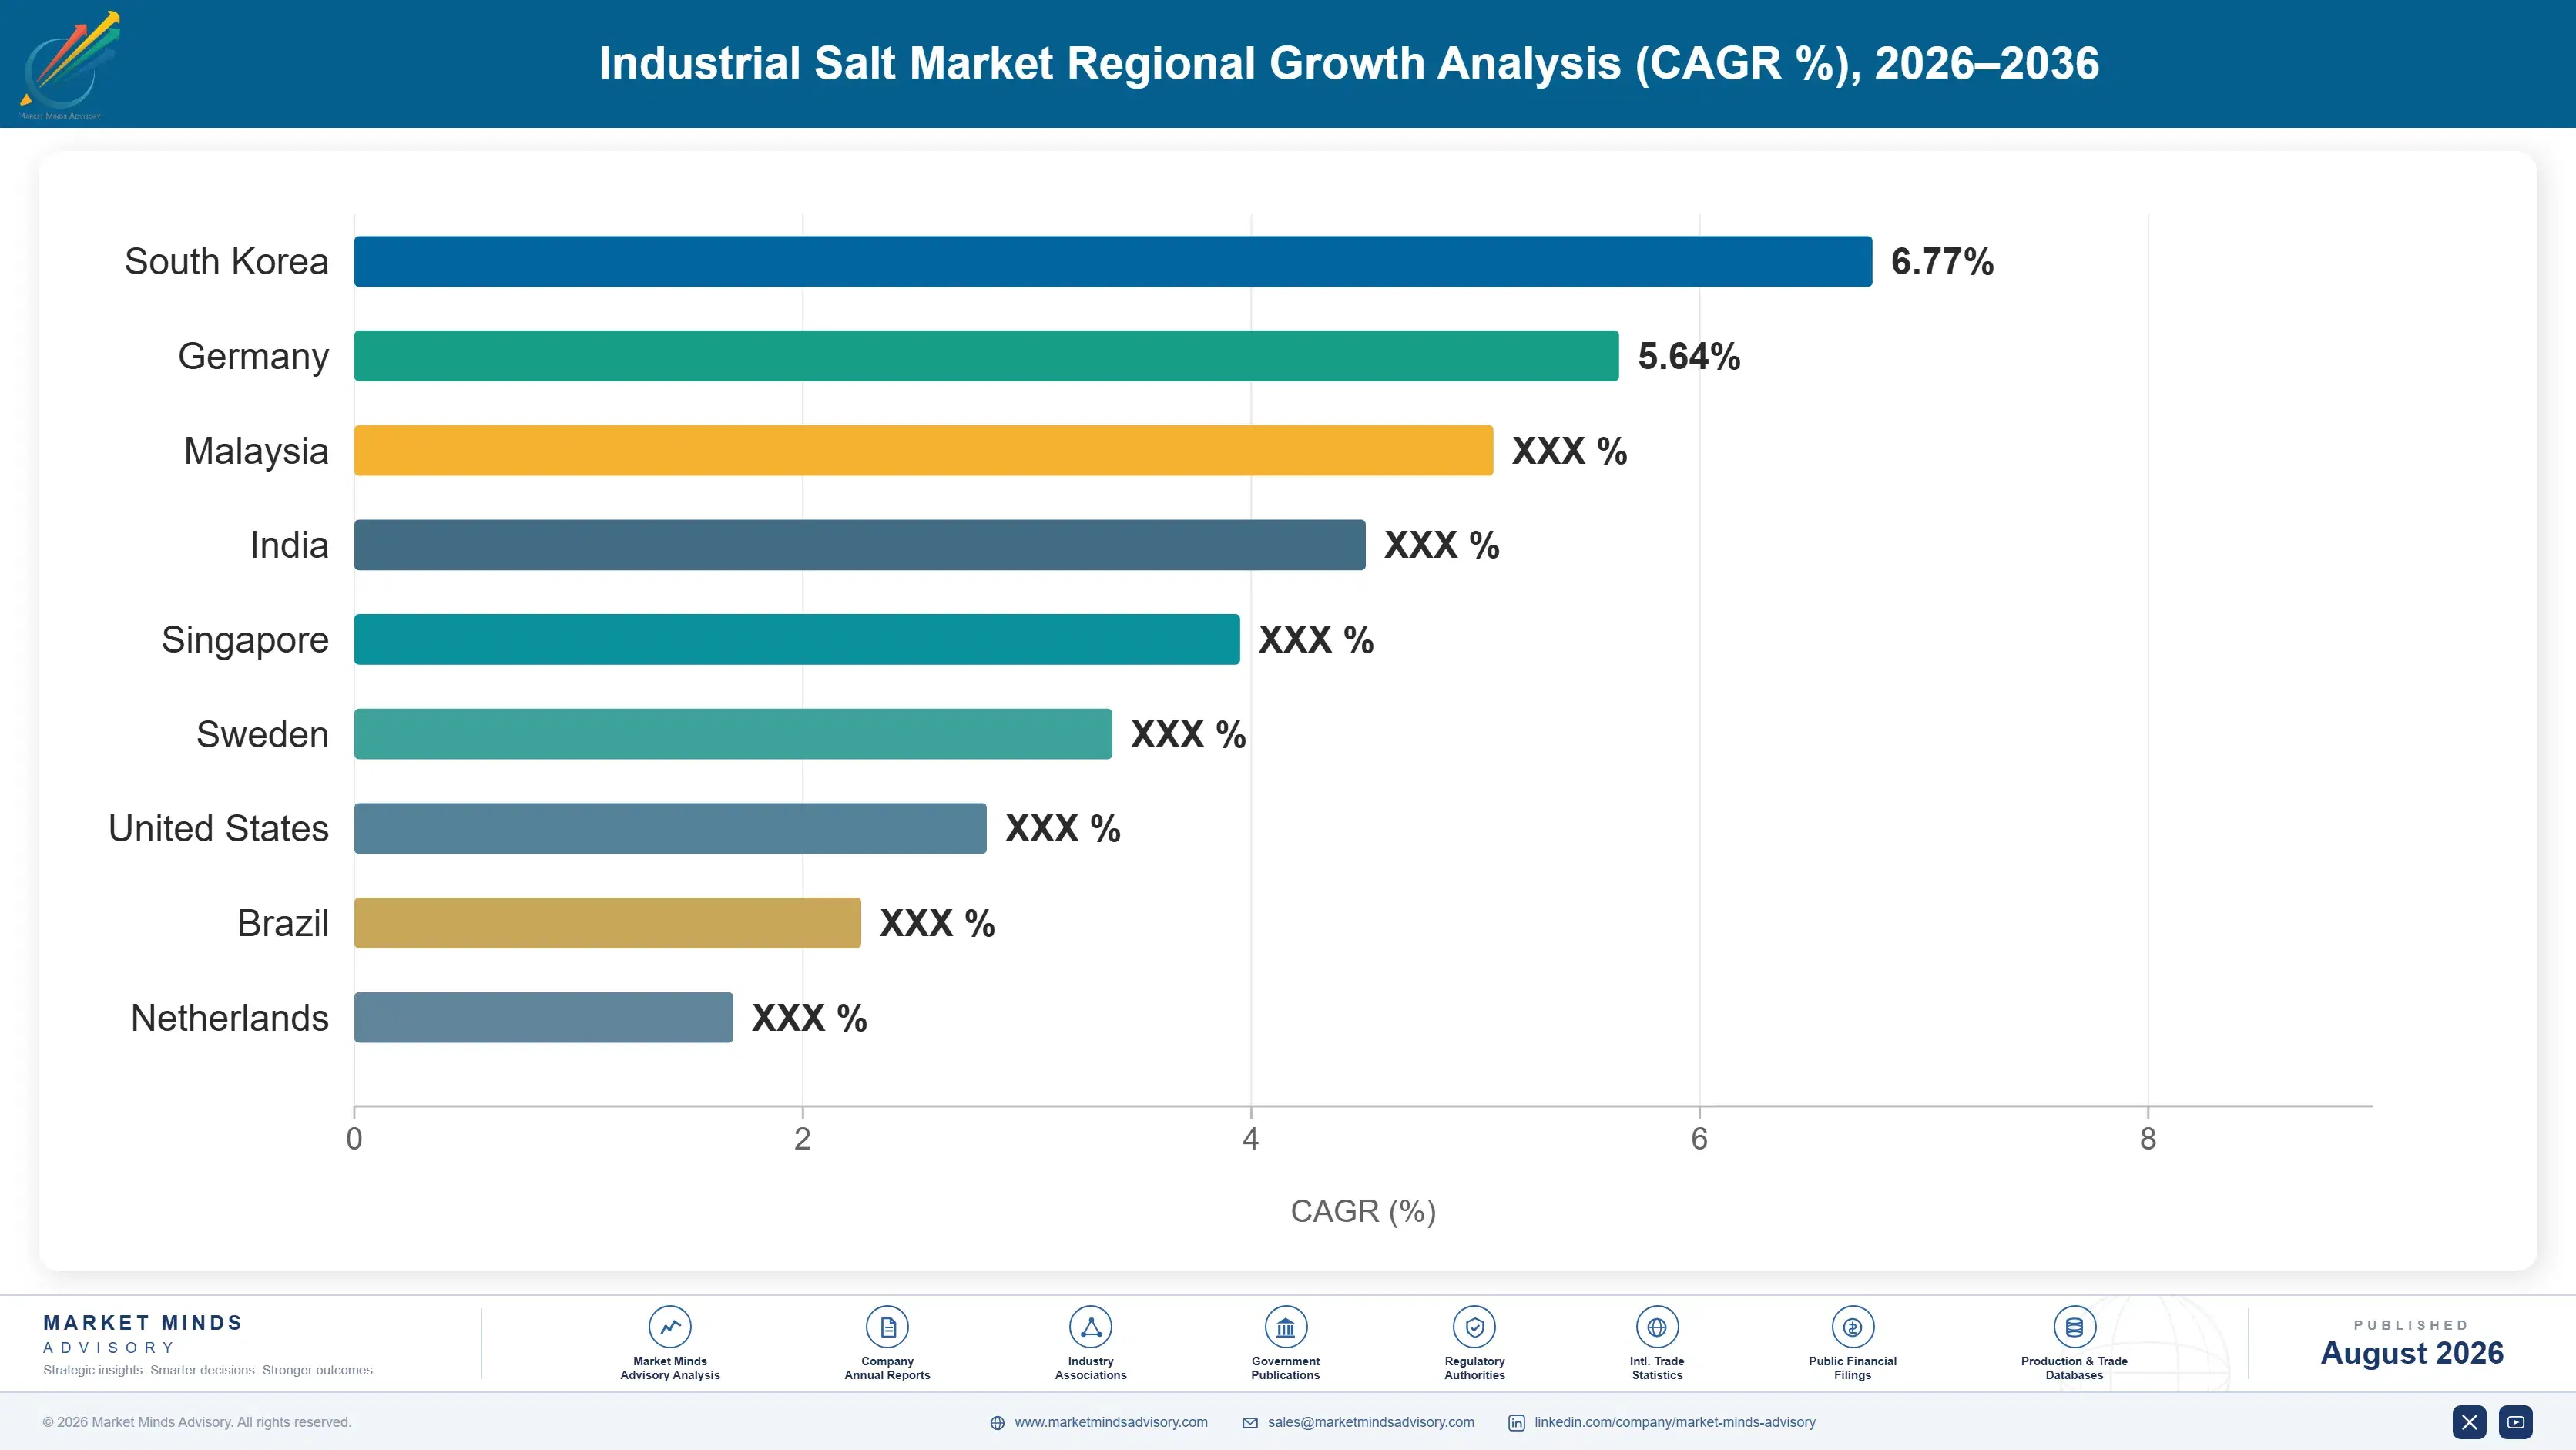
industrial-salt-market-country-cagr-analysis-1787553394006

Where Salt Margin Actually Sits

Four moves matter in a business where freight decides who wins and weather decides how much. Two are about extending the circle a producer can serve, and two are about replacing volatile demand with predictable demand. Improving plant efficiency is not among them, because production cost is barely half the number that decides a tender.

Buy terminals and rail access, not evaporators

Freight is 47% of delivered cost and the economic haul radius runs about 400 kilometres, which means a terminal or rail siding extends the addressable market further than any production improvement ever will. A producer with a river terminal three hundred kilometres from a customer beats a more efficient competitor six hundred kilometres away every single time. Logistics assets also cost less than production capacity and carry across every product the plant makes. Producers who spent a decade optimising evaporator efficiency were solving the smaller half of their cost problem the whole time.
Market Impact: Extends the effective 400 km haul radius outward

Rebalance the book toward predictable industrial demand

De-icing tonnage swings 34% between a mild season and a severe one, which makes capacity planning guesswork and working capital a permanent argument. Chemical and water treatment customers consume continuously and forecast reliably, and water treatment in particular grows on discharge regulation rather than on weather or construction. Shifting the customer mix costs margin per tonne and buys a business that can actually be planned. Several producers have done this deliberately over a decade and their capital efficiency shows it clearly against competitors still riding the winter. That trade is worth making almost everywhere.
Market Impact: Removes most of a 34% seasonal volume swing

Take the brine from storage cavern developers

Hydrogen and gas storage cavern creation is producing solution mined brine across Europe and North America at a pace the energy transition set rather than the salt industry, and growth at 5.4% reflects it. For the developer that brine is a disposal cost. For a producer with an evaporation plant or a chlor-alkali customer within reach it is nearly free feedstock. Contracting that offtake early costs almost nothing and secures a low-cost supply position for the life of the cavern programme. Very few salt producers are talking to cavern developers at all.
Market Impact: Secures cheap feedstock behind a 5.4% growth segment

Sell recovery technology to the customers destroying demand

Zero liquid discharge enforcement is pushing industrial plants across India and China to recover salt from their own effluent, which grows at 5.1% and displaces purchased tonnage at the same sites. A producer watching that happen has two options and only one of them is any good. Supplying the recovery process, the crystallisation equipment or the offtake for surplus recovered material converts a demand loss into a revenue line. It also puts the producer inside a customer relationship that would otherwise simply end. Nobody in this industry has moved on it yet.
Market Impact: Converts a 5.1% annual demand loss into revenue

Who Controls the Margin Pool

Five producers hold 41% of industrial salt tonnage, measured at producer level across all end-use channels, the basis used throughout this section. That figure describes almost nothing useful, because freight at 47% of delivered cost means concentration inside any given haul radius runs far higher and a customer typically chooses between two or three suppliers rather than twenty. The gap between leaders and everybody else is deposit position and logistics infrastructure.
Competition runs on three dimensions and none is the product. Delivered cost, which is deposit location plus terminal network plus rail access. Supply reliability through a severe winter, which highway authorities weight heavily after being let down once. And chemical grade consistency for chlor-alkali customers who cannot tolerate variation in feedstock. Price competes where two producers overlap geographically and barely at all where they do not.

Rankings shift through acquisition rather than through competition, because buying a producer in an adjacent circle is the only way to grow beyond a haul radius. Recovered salt from industrial effluent is the genuinely new competitive force and it arrives from customers rather than from rivals. Deposit positions hold longest, since geology is not something a competitor can build.
industrial-salt-market-company-positioning-matrix-1787553394525

Competitive Moat and Risk Dimensions

K+S

Moat: European deposit position

K+S holds rock salt and solution mining positions across Germany and North America that sit close to chemical and de-icing demand, and deposit location is the only genuinely durable advantage in a business where freight decides tenders. Those positions took a century to assemble and cannot be replicated, because the geology is where it is and nobody can move it.
K+S

Risk: European chemical demand decline

A meaningful part of the demand around the German deposits comes from European chlor-alkali capacity that has been closing on energy cost for a decade, and every closure removes tonnage inside the haul radius permanently. Deposit position is worth nothing without demand nearby. Competitors positioned near growing Asian chemical capacity face the opposite arithmetic entirely.
COMPASS MINERALS

Moat: Terminal and rail network

Compass Minerals runs terminal and rail infrastructure across the North American de-icing markets that extends its effective haul radius well beyond what the mine location alone permits. That network is expensive to build, occupies sites that are largely taken, and matters more than production cost in a business where freight is nearly half of delivered price.
COMPASS MINERALS

Risk: Winter weather concentration

De-icing represents a large share of the business and tonnage swings 34% between a mild season and a severe one, which makes earnings genuinely difficult to forecast and working capital a recurring problem. Competitors weighted toward chemical and water treatment customers run a duller business that plans considerably better than this one does.

Players Tracked

Prominent Players

K+S
Compass Minerals
Cargill
Tata Chemicals
China National Salt Industry Group

Other Key Players

Salins Group
Nouryon
Ciech
Dampier Salt
Exportadora de Sal
Dominion Salt
Mitsui & Co
Swiss Saltworks
Zoutman
Israel Chemicals
Cheetham Salt
Kutch Brine Chem Industries
Archean Chemical Industries
INEOS Enterprises
Detroit Salt Company

Recent Developments

APRIL 2025

K+S expanded solution mining capacity linked to a German storage cavern programme

K+S increased brine handling and evaporation capacity at a German site connected to cavern creation for underground gas and hydrogen storage. The investment was organic and funded internally, with no partner or acquisition involved, and it converts brine that would otherwise require disposal into saleable product.
Signal: Salt producers are following the energy transition into cavern brine, which is a supply source nobody planned for
SEPTEMBER 2025

Compass Minerals acquired a regional salt terminal network

Compass Minerals completed the acquisition of a terminal and distribution network extending its de-icing coverage into markets previously outside its economic haul radius. The transaction was an acquisition rather than a joint venture, with full ownership transferring at completion, and it adds logistics rather than production capacity.
Signal: Growth in this industry comes from buying logistics reach rather than from producing salt more cheaply anywhere
JANUARY 2026

Tata Chemicals expanded brine recovery capability at an Indian industrial site

Tata Chemicals commissioned brine recovery and crystallisation capacity aimed at industrial effluent streams under Indian zero liquid discharge requirements. This was an organic capacity expansion funded internally rather than an acquisition, and it positions the company as a supplier of recovery capability rather than only of salt.
Signal: A producer is selling the technology that destroys its own tonnage, which is the correct response to an unavoidable change

What Moves Delivered Cost

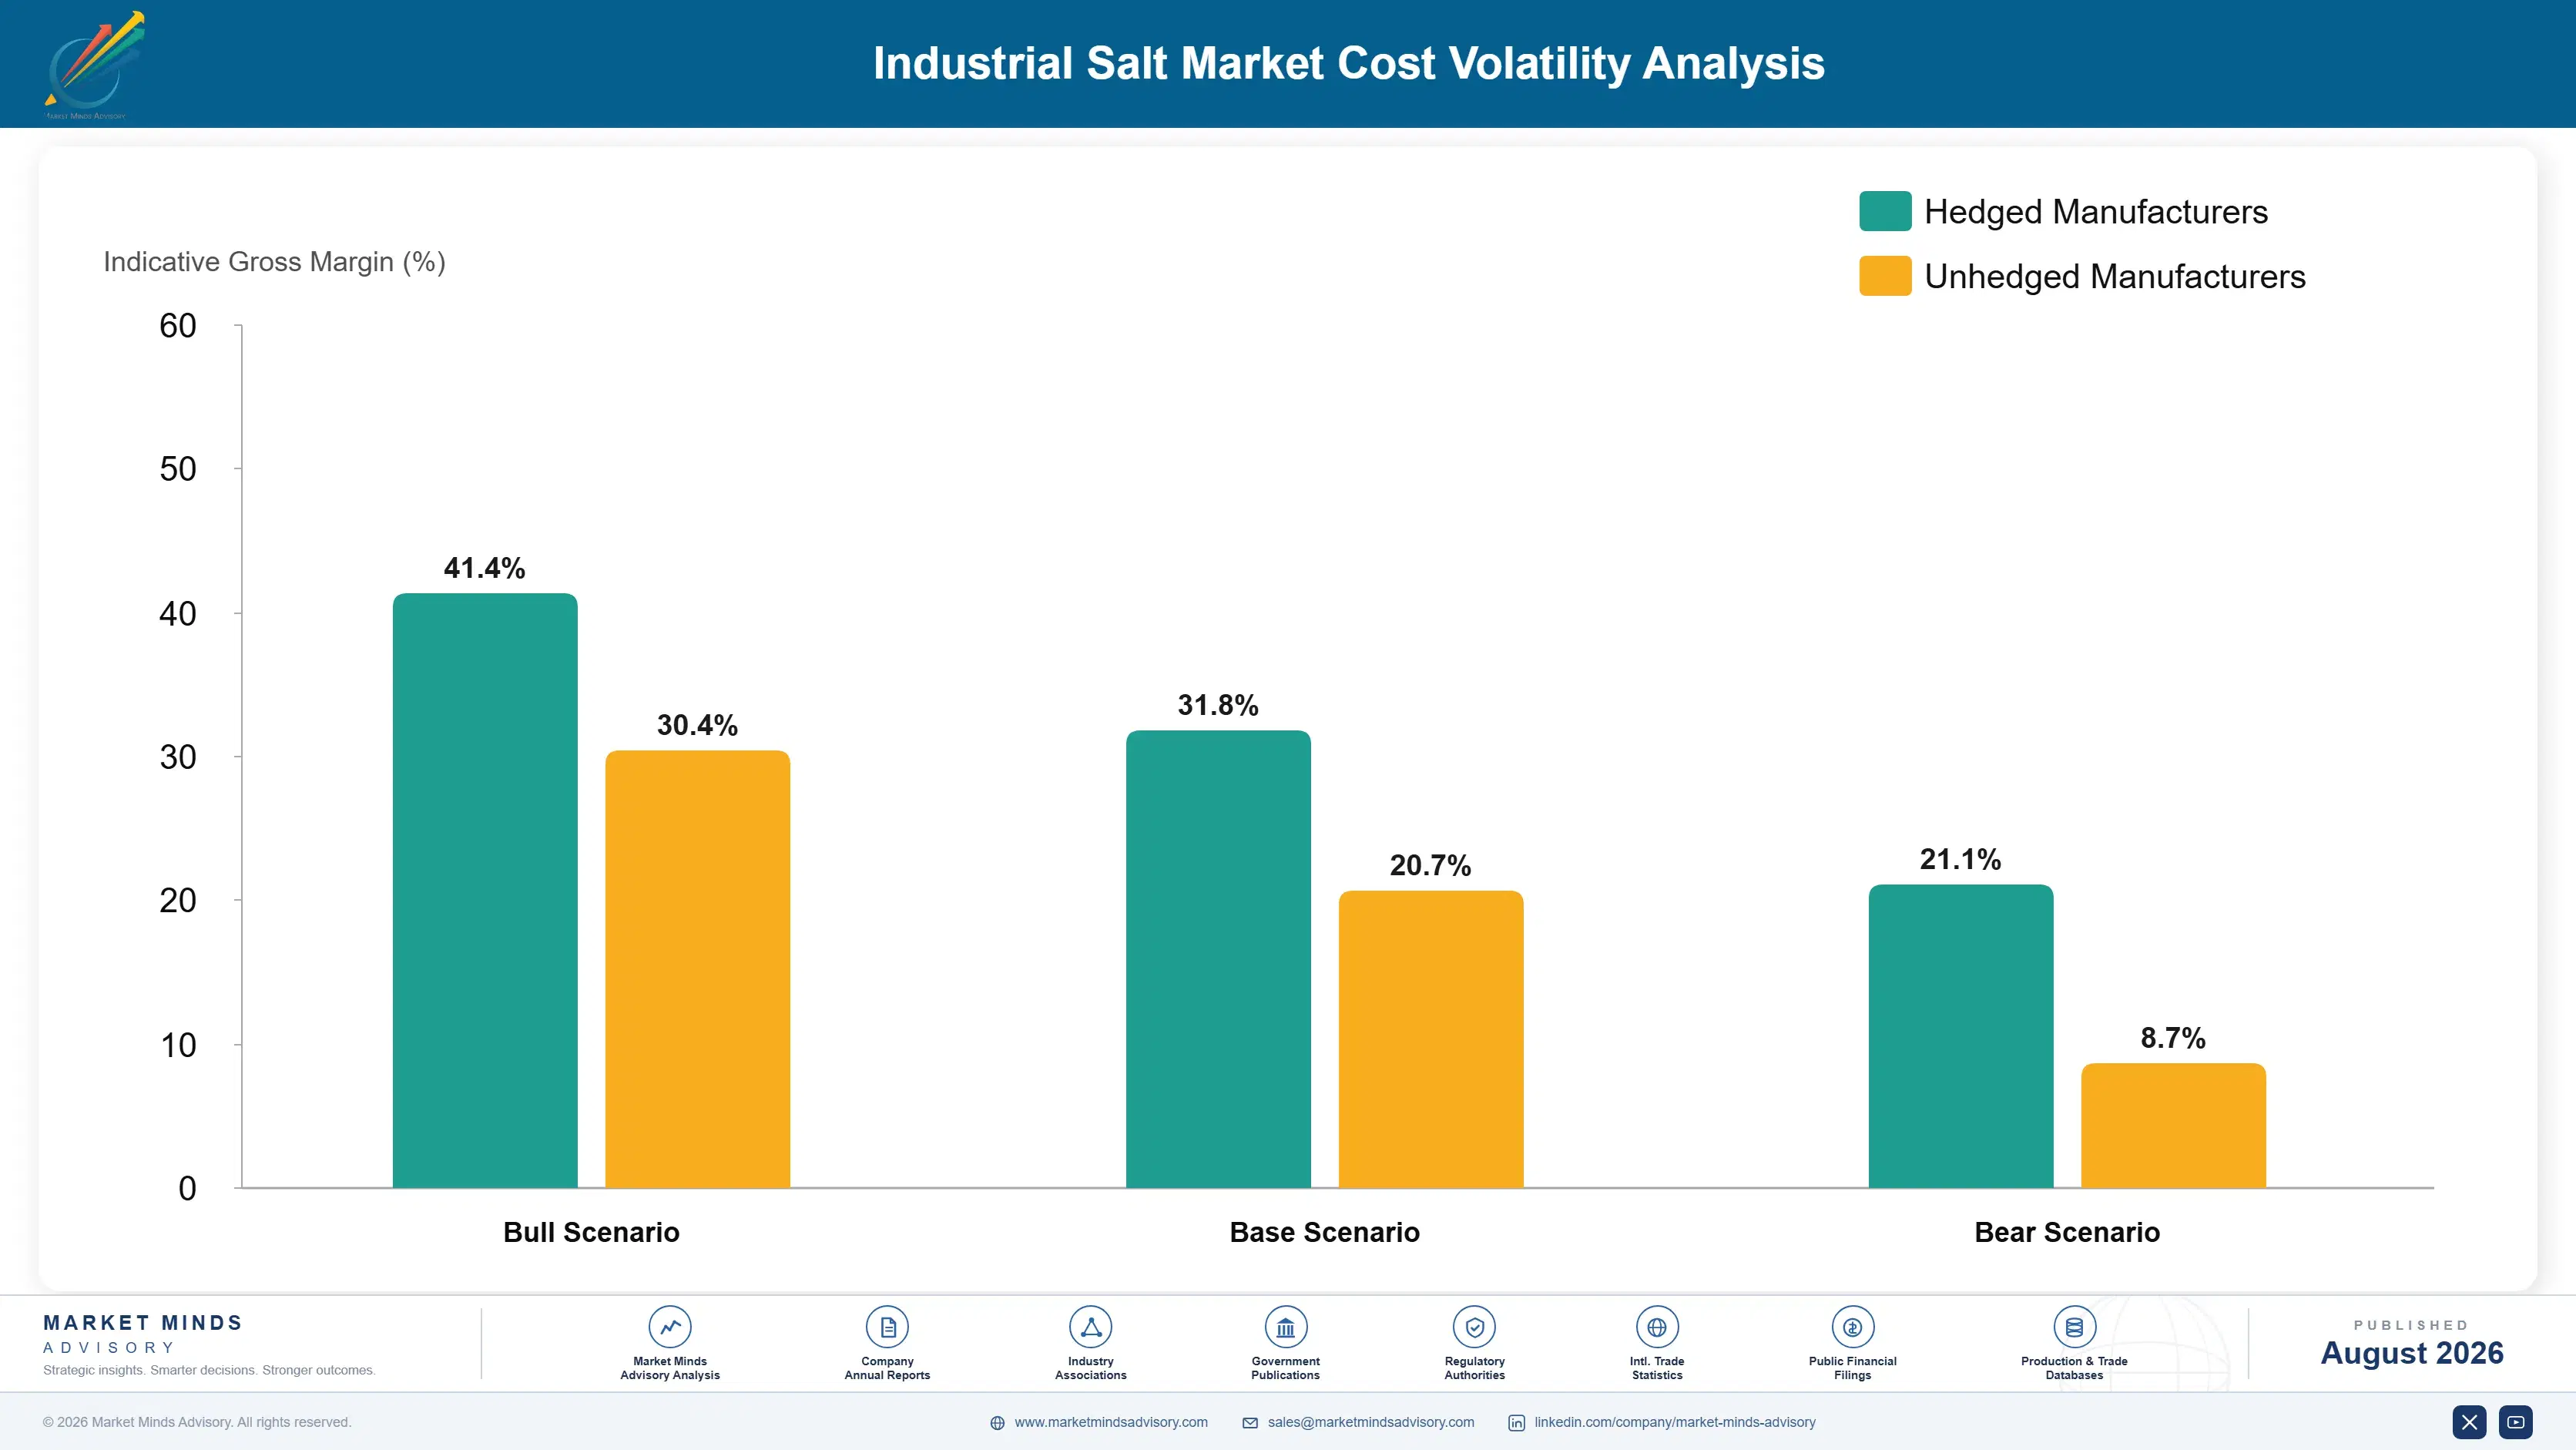
Freight accounts for around 47% of delivered cost, which makes it larger than everything else combined and unusual among industrial minerals. Energy for evaporation and mining takes a further 21%, with labour, maintenance and royalties making up the balance. Diesel and rail tariffs therefore matter more to this industry than any input a chemist would recognise.
European gas prices through 2022 hit vacuum evaporation particularly hard, since boiling brine is energy intensive and the process cannot be paused. IEA data show European industrial gas running several times American levels. K+S recorded energy cost pressure across its salt operations in its Annual Report 2022. Producers on annual de-icing contracts absorbed most of it, because a highway authority tender is priced in spring for a winter nobody can predict.

The seasonal tender cycle is what makes this exposure asymmetric. A producer prices de-icing supply in spring and delivers through a winter whose volume and cost base remain unknown. Chemical customers on quarterly contracts move faster. Solar evaporation producers carry almost no energy exposure, since the sun is free, which gives coastal operations in India, Mexico and the Gulf a cost position that European vacuum plants cannot approach.
industrial-salt-market-cost-volatility-analysis-1787553394720

Index de-icing tenders to published diesel and rail tariffs

Pricing a winter tender in spring against unknown volume and unknown freight cost transfers every risk to the producer for a season nobody forecasts. Indexing the freight component to published diesel and rail tariff benchmarks removes the largest uncertainty, and highway authorities accept it once the alternative is a padded tender. Resistance comes from procurement rules rather than from judgement.

Site evaporation capacity where energy is cheapest

Vacuum evaporation consumes energy continuously and cannot be paused, which makes energy price a permanent characteristic of the site rather than a cost anybody manages. Solar evaporation carries no energy cost at all where climate permits it. Producers with a choice about where to build capacity have generally not treated energy price as the thirty-year decision it actually is.

Contract rail capacity ahead of the winter season

Rail capacity tightens exactly when de-icing demand peaks, which means a producer competing for wagons in January pays whatever the market asks and delivers late anyway. Contracting capacity in summer costs a commitment fee against volume that may not materialise. Against the alternative of failing a highway authority in a severe winter, that fee looks small.

Portfolio Architecture for Margin Defence

Margin in salt tracks purity and proximity rather than production skill, since making salt is not difficult and the difficulty is getting it somewhere useful. Bulk de-icing rock salt runs at gross margins in the low twenties, priced against whoever else can reach the same tender. Chemical grade brine and vacuum salt run higher, because consistency requirements narrow the field and chlor-alkali customers cannot tolerate variation. Water treatment and specialty grades run higher again on packaging and distribution value.
The tension is between a volatile business that fills capacity and a steady one that pays for it. De-icing tonnage arrives in bursts, and a producer sized for a severe winter runs badly through a mild one. Chemical and water treatment demand is duller, steadier and lower margin per tonne, and it keeps the plant loaded. Producers who rebalanced deliberately over a decade plan their capital considerably better than those still betting on weather every year.

High-value pools sit in chemical grade brine near a consumer, cavern byproduct offtake and water treatment packaging. None of the three is where the tonnage is. Production capacity by itself defends nothing at all without a deposit and a terminal behind it.

Volume / Commodity-Adjacent

Bulk rock salt and coarse solar salt for de-icing and industrial use, priced against whoever else can deliver into the same tender at acceptable cost. The seven-point range separates producers with terminal and rail networks from those shipping by road from the mine gate.
Gross Margin: 18%-25%

Premium / Certified

Chemical grade brine and vacuum evaporated salt supplied to chlor-alkali and process customers who require consistency the bulk grades cannot deliver. The eight-point spread reflects proximity, since a producer adjacent to a consumer earns what a distant one cannot.
Gross Margin: 28%-36%

Sustainability / Regulatory / Next-Generation

Cavern byproduct brine offtake, recovered salt from industrial effluent and packaged water treatment grades. The twelve-point range is wide because these positions depend on location, contract structure and regulation rather than on any cost basis a buyer could benchmark.
Gross Margin: 34%-46%
industrial-salt-market-portfolio-architecture-1787553395213

High-value Sub-segments and Strategic Watch-out

Cavern Byproduct Brine Offtake

Solution mining compounds at 5.4% because hydrogen and gas storage caverns are being dissolved across Europe and North America, and the brine is a disposal cost to the developer. For a producer within reach it is nearly free feedstock. Very few are even talking to developers.
Gross Margin: 36%-46%

Recovered Salt From Effluent

Growing at 5.1% and representing demand destruction rather than opportunity, since zero liquid discharge rules push customers to make their own salt from effluent. Selling the recovery process converts a loss into revenue. Nobody in the industry has moved on that yet. That will look obvious later.
Gross Margin: 30%-44%

Bulk De-Icing Rock Salt

The tonnage that fills capacity and swings 34% between a mild season and a severe one, which makes it the least plannable volume in industrial minerals. Chloride discharge regulation is the risk the industry keeps treating as an environmental complaint. Manage it for cash. It is not a complaint.
Gross Margin: 18%-25%

Terminal And Rail Position

Freight is 47% of delivered cost and a terminal extends the addressable circle further than any production improvement can. Logistics assets cost less than plant capacity and decide tenders. Producers who spent a decade optimising evaporators solved the smaller half of the problem. Most of them still are.
Gross Margin: 24%-38%

How Salt Demand Renews

Salt demand is consumption revenue with two completely different renewal patterns underneath it. Chemical and water treatment customers consume continuously against production and discharge requirements, which produces steady tonnage on annual contracts that renew almost automatically. De-icing demand renews against weather, arriving in bursts nobody can forecast and swinging 34% between seasons. Serving both from one asset base is the central operating problem in this industry.
Stickiness runs through geography rather than through relationship. A chlor-alkali plant adjacent to a salt deposit will never buy from anybody else because nobody else can reach it economically, which is the stickiest position available anywhere. Highway authorities tender competitively and switch on price where two producers overlap. Water treatment distributors change supplier readily, since packaged salt is genuinely interchangeable and delivery reliability is the only differentiator anybody notices.

The buyer has changed in one segment and nowhere else. Chemical and de-icing purchasing sits where it always did, with procurement people comparing delivered prices. Water treatment increasingly sits with environmental compliance functions asking about chloride discharge rather than about salt supply, and in industrial effluent applications the buyer has become somebody trying to stop buying salt altogether.
industrial-salt-market-end-use-penetration-index-1787553395698

Where To Place The Bet

These are among the four positions where our research anticipates prominent divergence between winners and laggards over the coming forecast period. Each is grounded in the demand model, the regulatory perimeter, and the announced capacity pipeline.
01 / LOGISTICS ASSET INVESTMENT

Buy terminals rather than production capacity

Freight accounts for 47% of delivered cost and the economic haul radius runs about 400 kilometres, which means a terminal or rail siding extends the addressable market further than any improvement inside the plant ever will manage. A producer three hundred kilometres from a customer beats a more efficient competitor six hundred kilometres away on every tender they both bid for. Logistics assets also cost considerably less than production capacity and they carry across every single grade the site produces.
02 / DEMAND MIX REBALANCING

Trade margin per tonne for a plannable business

De-icing tonnage swings 34% between a mild season and a severe one and nobody can forecast which is coming, which makes capacity sizing guesswork and working capital a permanent internal argument. Chemical and water treatment customers consume continuously against production schedules and discharge requirements, forecasting reliably and renewing almost automatically each year. Shifting the customer mix costs margin per tonne and buys a business a board can actually plan, and the producers who did it deliberately show it in capital efficiency.
03 / CAVERN BRINE OFFTAKE

Contract the brine before the developer buries it

Hydrogen and natural gas storage cavern creation is producing solution mined brine across Europe and North America at a pace the energy transition set rather than anybody in salt, and that segment compounds at 5.4% as a result. For the cavern developer the brine is a disposal cost with a permit attached to it. For a producer with an evaporation plant or a chlor-alkali customer inside the haul radius it is nearly free feedstock for the whole life of the programme.
04 / RECOVERY TECHNOLOGY POSITION

Sell the process that destroys your tonnage

Zero liquid discharge enforcement across India and China is pushing industrial plants to recover salt from their own effluent, a segment growing at 5.1% that displaces purchased tonnage at the same sites it appears in. A producer watching that happen has two options and only one of them is any good at all. Supplying the recovery process, crystallisation equipment or offtake for surplus material converts a demand loss into a revenue line and keeps a customer relationship that would otherwise simply end.

Engagement Snapshot From the Field

A live engagement with an industry participant carrying material or product regulatory and market exposure ahead of a defining policy shift, showing how our research translates into a defensible multi-year portfolio strategy.
MARKET MINDS ADVISORY · CLIENT ENGAGEMENT SUMMARY
Industrial Salt Producer Strategic Portfolio Review and Transition Roadmap 2026·Investment Scenario on Industrial Salt Exposure Evaluation 2025-26
CLIENT PROFILE
A North American salt producer with annual revenue around USD 640 million (client-reported, unverified by MMA), operating two rock salt mines and one vacuum evaporation plant. De-icing accounted for roughly 68% of tonnage and the balance went to chemical and water treatment customers. The company owned no terminals and shipped almost entirely by road and third-party rail arrangements.
STRATEGIC CHALLENGE
Two consecutive mild winters had left earnings roughly 40% below plan (client-reported, unverified by MMA) with inventory carried through a second summer, and the board had approved a mine efficiency programme in response. Nobody had examined whether production cost was the problem. Separately, three de-icing tenders had been lost to competitors on delivered price despite lower mine gate costs.
MMA APPROACH
MMA rebuilt the client's delivered cost position tender by tender against competitors, separating mine gate cost from freight to establish where the losses actually came from. Chemical and water treatment demand inside the client's economic haul radius was sized through the expert interview programme. Available terminal and rail siding assets in the region were screened, and earnings volatility was modelled against alternative customer mixes.
KEY FINDINGS
  1. All three lost tenders came down to freight rather than production cost, since competitors held terminal positions closer to the delivery points than the client's mines were.
  2. The mine efficiency programme would improve a cost line representing under a third of delivered price, which could not close the gap on any of the lost tenders.
  3. Chemical and water treatment demand inside the haul radius was considerably larger than the client served, and most of it went to competitors nobody had targeted.
  4. Two rail siding assets were available in the region at a fraction of the approved efficiency programme cost, and either would have won all three lost tenders.
CLIENT PROFILE
A North American salt producer with annual revenue around USD 640 million (client-reported, unverified by MMA), operating two rock salt mines and one vacuum evaporation plant. De-icing accounted for roughly 68% of tonnage and the balance went to chemical and water treatment customers. The company owned no terminals and shipped almost entirely by road and third-party rail arrangements.
STRATEGIC CHALLENGE
Two consecutive mild winters had left earnings roughly 40% below plan (client-reported, unverified by MMA) with inventory carried through a second summer, and the board had approved a mine efficiency programme in response. Nobody had examined whether production cost was the problem. Separately, three de-icing tenders had been lost to competitors on delivered price despite lower mine gate costs.
MMA APPROACH
MMA rebuilt the client's delivered cost position tender by tender against competitors, separating mine gate cost from freight to establish where the losses actually came from. Chemical and water treatment demand inside the client's economic haul radius was sized through the expert interview programme. Available terminal and rail siding assets in the region were screened, and earnings volatility was modelled against alternative customer mixes.
KEY FINDINGS
  1. All three lost tenders came down to freight rather than production cost, since competitors held terminal positions closer to the delivery points than the client's mines were.
  2. The mine efficiency programme would improve a cost line representing under a third of delivered price, which could not close the gap on any of the lost tenders.
  3. Chemical and water treatment demand inside the haul radius was considerably larger than the client served, and most of it went to competitors nobody had targeted.
  4. Two rail siding assets were available in the region at a fraction of the approved efficiency programme cost, and either would have won all three lost tenders.
RECOMMENDED STRATEGY
Phase 1: Phase one: redirect the approved efficiency capital toward acquiring the two available rail siding assets, which addresses the actual cause of the tender losses. Phase 2: Phase two: build a chemical and water treatment sales effort inside the existing haul radius, targeting the demand competitors currently serve unopposed. Phase 3: Phase three: index the freight component of de-icing tenders to published diesel and rail benchmarks rather than absorbing that risk across a whole season.
OUTCOME
The efficiency programme was deferred and both rail siding assets were acquired in 2025 for roughly USD 42 million (client-reported, unverified by MMA). The client won two of the three contested tenders at the following round. Chemical and water treatment tonnage has risen and the client reports earnings volatility narrowing measurably against the previous three years.

Frequently Asked Questions

Foundational context covering the market sizes, CAGR, scope, country, region and competition that inform every finding below. This section is provided to cover basics and most often pre-purchase conversations, answered from the MMA Primary Research Dataset.

What is the current size of the Industrial Salt Market?

The market was valued at USD 14.8 billion in 2025, rising to an estimated USD 15.33 billion in 2026. East Asia holds the largest regional share at 30% of value.

How large will the Industrial Salt Market be by 2036?

MMA forecasts USD 21.84 billion by 2036 under the base case, an expansion multiple of 1.42 times the 2026 value. That represents USD 6.51 billion of incremental value.

What is the CAGR for the Industrial Salt Market 2026 to 2036?

The base case runs at 3.6% compound annual growth between 2026 and 2036, with a bull case at 4.8% and a bear case at 2.4%. Historical growth from 2020 to 2025 was 2.8%.

Which segment is growing fastest?

Solution mining leads at 5.4%, half again the market rate, driven by hydrogen and gas storage cavern creation producing brine as a byproduct. Brine recovery from industrial streams follows at 5.1%.

Who are the major companies in the Industrial Salt Market?

K+S, Compass Minerals, Cargill, Tata Chemicals and China National Salt Industry Group hold 41% between them. Deposit position and logistics infrastructure sustain those positions rather than production efficiency.

Which country is growing fastest?

India leads at 6.2%, driven by Gujarat coastal solar production and chlor-alkali capacity expansion arriving together. Zero liquid discharge enforcement complicates that picture considerably from here.

Report Segmentation Architecture

The full report scope spans multiple orthogonal segmentation dimensions, with cross-tabulated demand data provided for each dimension pair. Coverage extends further to regional breakdowns, trend trajectories, and the competitive detail needed to support segment-level decision-making.

By Production Route

  • Rock Salt Mining
  • Solar Evaporation
  • Vacuum Evaporation
  • Solution Mining
  • Brine Recovery from Industrial Streams
  • Byproduct Salt from Potash and Soda Ash Operations

By End-Use Industry

  • Chlor-Alkali and Chemical Processing
  • Road De-Icing
  • Water Treatment and Softening
  • Food and Beverage Processing
  • Oil and Gas Drilling
  • Agriculture and Animal Feed

By Sales Channel

  • Direct Contract Supply
  • Bulk Terminal Distribution
  • Public Tender Supply
  • Packaged Distributor Channel
  • Brine Pipeline Supply

By Region

  • North America
  • Western Europe
  • East Asia
  • South Asia and Pacific
  • Latin America
  • Middle East and Africa
  • Eastern Europe

Scope, Methodology, and Coverage

Every figure in this report is reproducible from documented input assumptions. The scope below maps the historical period, the forecast horizon, the segmentation dimensions, and the countries covered, alongside the underlying primary and qualitative methodology.
Historical Period
2020 to 2025
Forecast Period
2026 to 2036
Base Year
2025 (USD billions; MMA Primary Research Dataset, August 2026)
Market Definition
The market comprises salt produced for industrial, chemical, de-icing and water treatment use, covering rock salt mining, solar evaporation, vacuum evaporation, solution mining, brine recovery from industrial effluent streams and byproduct salt from potash and soda ash operations. Value is measured at producer level across bulk, packaged and brine pipeline supply channels. Table and culinary salt sold in retail packaging, potassium and magnesium salts, nitrate salts for thermal energy storage, salt substitutes, and downstream chlorine or caustic soda products fall outside scope.
Quantitative Units
USD billions (current prices); million tonnes of salt supplied annually; USD per tonne delivered by production route
Segmentation Dimensions
By Production Route; By End-Use Industry; By Sales Channel; By Region
Regions Covered
North America, Western Europe, East Asia, South Asia and Pacific, Latin America, Middle East and Africa, Eastern Europe
Countries Covered
China, Japan, South Korea, India, Australia, Thailand, Indonesia, Vietnam, United States, Canada, Mexico, Germany, Netherlands, France, United Kingdom, Spain, Italy, Sweden, Denmark, Poland, Romania, Czechia, Hungary, Brazil, Chile, Peru, Saudi Arabia, United Arab Emirates, Egypt, South Africa
Key Companies Profiled
K+S, Compass Minerals, Cargill, Tata Chemicals, China National Salt Industry Group, Salins Group, Nouryon, Ciech, Dampier Salt, Exportadora de Sal, Dominion Salt, Mitsui & Co, Swiss Saltworks, Zoutman, Israel Chemicals, Cheetham Salt, Kutch Brine Chem Industries, Archean Chemical Industries, INEOS Enterprises, Detroit Salt Company
Quantitative Methodology
Primary survey, n=3,800 respondents, Q4 2025, six countries; demand-side model with trade association cross-validation
Qualitative Methodology
47 expert interviews, Q4 2025; applied to validate demand model assumptions, identify emerging dynamics, and assess competitive positioning
Report Format
PDF and XLSX data workbook (Word format preview document)
Publisher
Market Minds Advisory
Report Code
MMA-2026-CHM-558
Published
August 2026
Contact
sales@marketmindsadvisory.com | www.marketmindsadvisory.com

Purchase the full Industrial Salt Market Report (2026 to 2036).

The full report sizes the global industrial salt market to 2036 across six production routes and seven regions, measured at producer level across all end-use channels. It models delivered cost rather than production cost throughout, since freight at 47% of the total is what actually decides tenders inside a haul radius of about 400 kilometres. Competitive analysis covers 20 participants evaluated on tonnage supplied, with moat and risk assessment for the two leaders. Demand volatility is separated between weather-driven de-icing and continuous chemical consumption, and input cost exposure runs from diesel and rail tariffs through to seasonal tender pricing. Four quantified revenue levers close the analysis.
Six-route production sizing with segment-level growth rates
Seven-region share and growth breakdown to 2036
Twenty-participant competitive map on one tonnage basis
Delivered cost modelled against haul radius by region
Input cost exposure traced to freight and evaporation energy
Four quantified revenue levers with commercial impact ranges

Built For The People Who Decide

From boardroom strategy to bench-side execution, this report is read cover-to-cover by leaders shaping the next decade of their industry, turning demand scenarios, market dynamics and valuation benchmarks into decisions.
CXOs/ Presidents/ VPs/ Managers
M&A and Corporate Development
Strategy Teams and R&D Heads
Procurement and Product Directors
Regulatory and Compliance Leaders
Investor Relations and Equity Analysts