Market Minds Advisory
Industrial Power Monitoring System Market

Industrial Power Monitoring System Market: Evidence Rather Than Output, And An Audience That Changed

This is the only equipment in a plant that produces evidence rather than product. Nothing about the instrument changed. What changed is that three separate parties now demand the readings.

Lead Analyst

David Horsley

Published

September 2026

Make Smarter Decisions with Customized Research Insights

Request a free sample report and evaluate market opportunities, growth trends, and competitive dynamics relevant to your business needs.

2025 MARKET VALUE$4.1BMarket Size 2025
2036 FORECAST VALUE$10.4BBase Case , 2026 to 2036
CAGR 2026 TO 20368.8 %Bull 10.1% / Bear 7.5%
INCREMENTAL OPPORTUNITY$5.9BNet 10- year value creation
EXPANSION MULTIPLE2.33x2036 value over 2026 base
Strategic Levers
M&A Pipeline
Regional Outlook
Country Rankings
Competitive Intelligence
Segmental Deep-dive
Call-Us : 91 93563 13602

Executive Snapshot and Market Trajectory

A power monitoring system produces evidence rather than output, which makes it easy to install and hard to justify. Nobody's throughput improves. The market reaches USD 4.1 billion in 2025 and grows at 8.8%, entirely because the people demanding the evidence changed. The instrument did not change at all.
Emissions and carbon reporting systems grow fastest at 15.4%, about 1.75 times the market rate, because mandatory sustainability disclosure requires measured electricity data rather than estimated figures from an invoice. East Asia holds 32% of value on Chinese manufacturing and industrial electricity consumption together, more than any other region. North America takes 23% and Western Europe 19%. Policy rather than commercial argument drives Chinese installation entirely. Regional weight follows industrial electricity use closely.
Concentration runs at 44%, held there by control system integration rather than by measurement capability, since accurate metering is not difficult. Competition turns on whether the data reaches a system anybody acts on, which is where most installations quietly fail. A great many facilities already own monitoring hardware nobody has looked at since commissioning day. Facilities already own hardware nobody has looked at since commissioning.
Market Definition
The industrial power monitoring system market covers hardware and software measuring electrical consumption, power quality, and supply reliability inside industrial facilities, together with the sensors, gateways, and analysis platforms supplied with them. It spans power quality analysers, energy monitoring meters, condition monitoring devices, and reporting systems. Utility revenue metering, tenant billing sub-metering, protection relays, process control systems, and electrical switchgear are excluded.
Base Year Value
$4.1B in 2025 (MMA Primary Research Dataset, August 2026)
Forecast Period
2026 to 2036, eleven discrete annual values
CAGR
8.8% base case. Bull 10.1%. Bear 7.5%.
Fastest Growth Segment
Emissions and Carbon Reporting Systems: 15.4% CAGR
Fastest Growth Country
India: 11.8% CAGR
Fastest Growth Region
South Asia and Pacific: 11.0% CAGR
Largest Region
East Asia: 32% of 2025 global value
Market Leaders
Schneider Electric, Siemens, ABB, Eaton, Rockwell Automation. Source: MMA Primary Research Dataset, July 2026.
Primary Survey
n=3,800 procurement and R&D decision-makers, Q4 2025, six countries
Methodology
Demand-side build-up, cross-validated against public data, 47 expert interviews

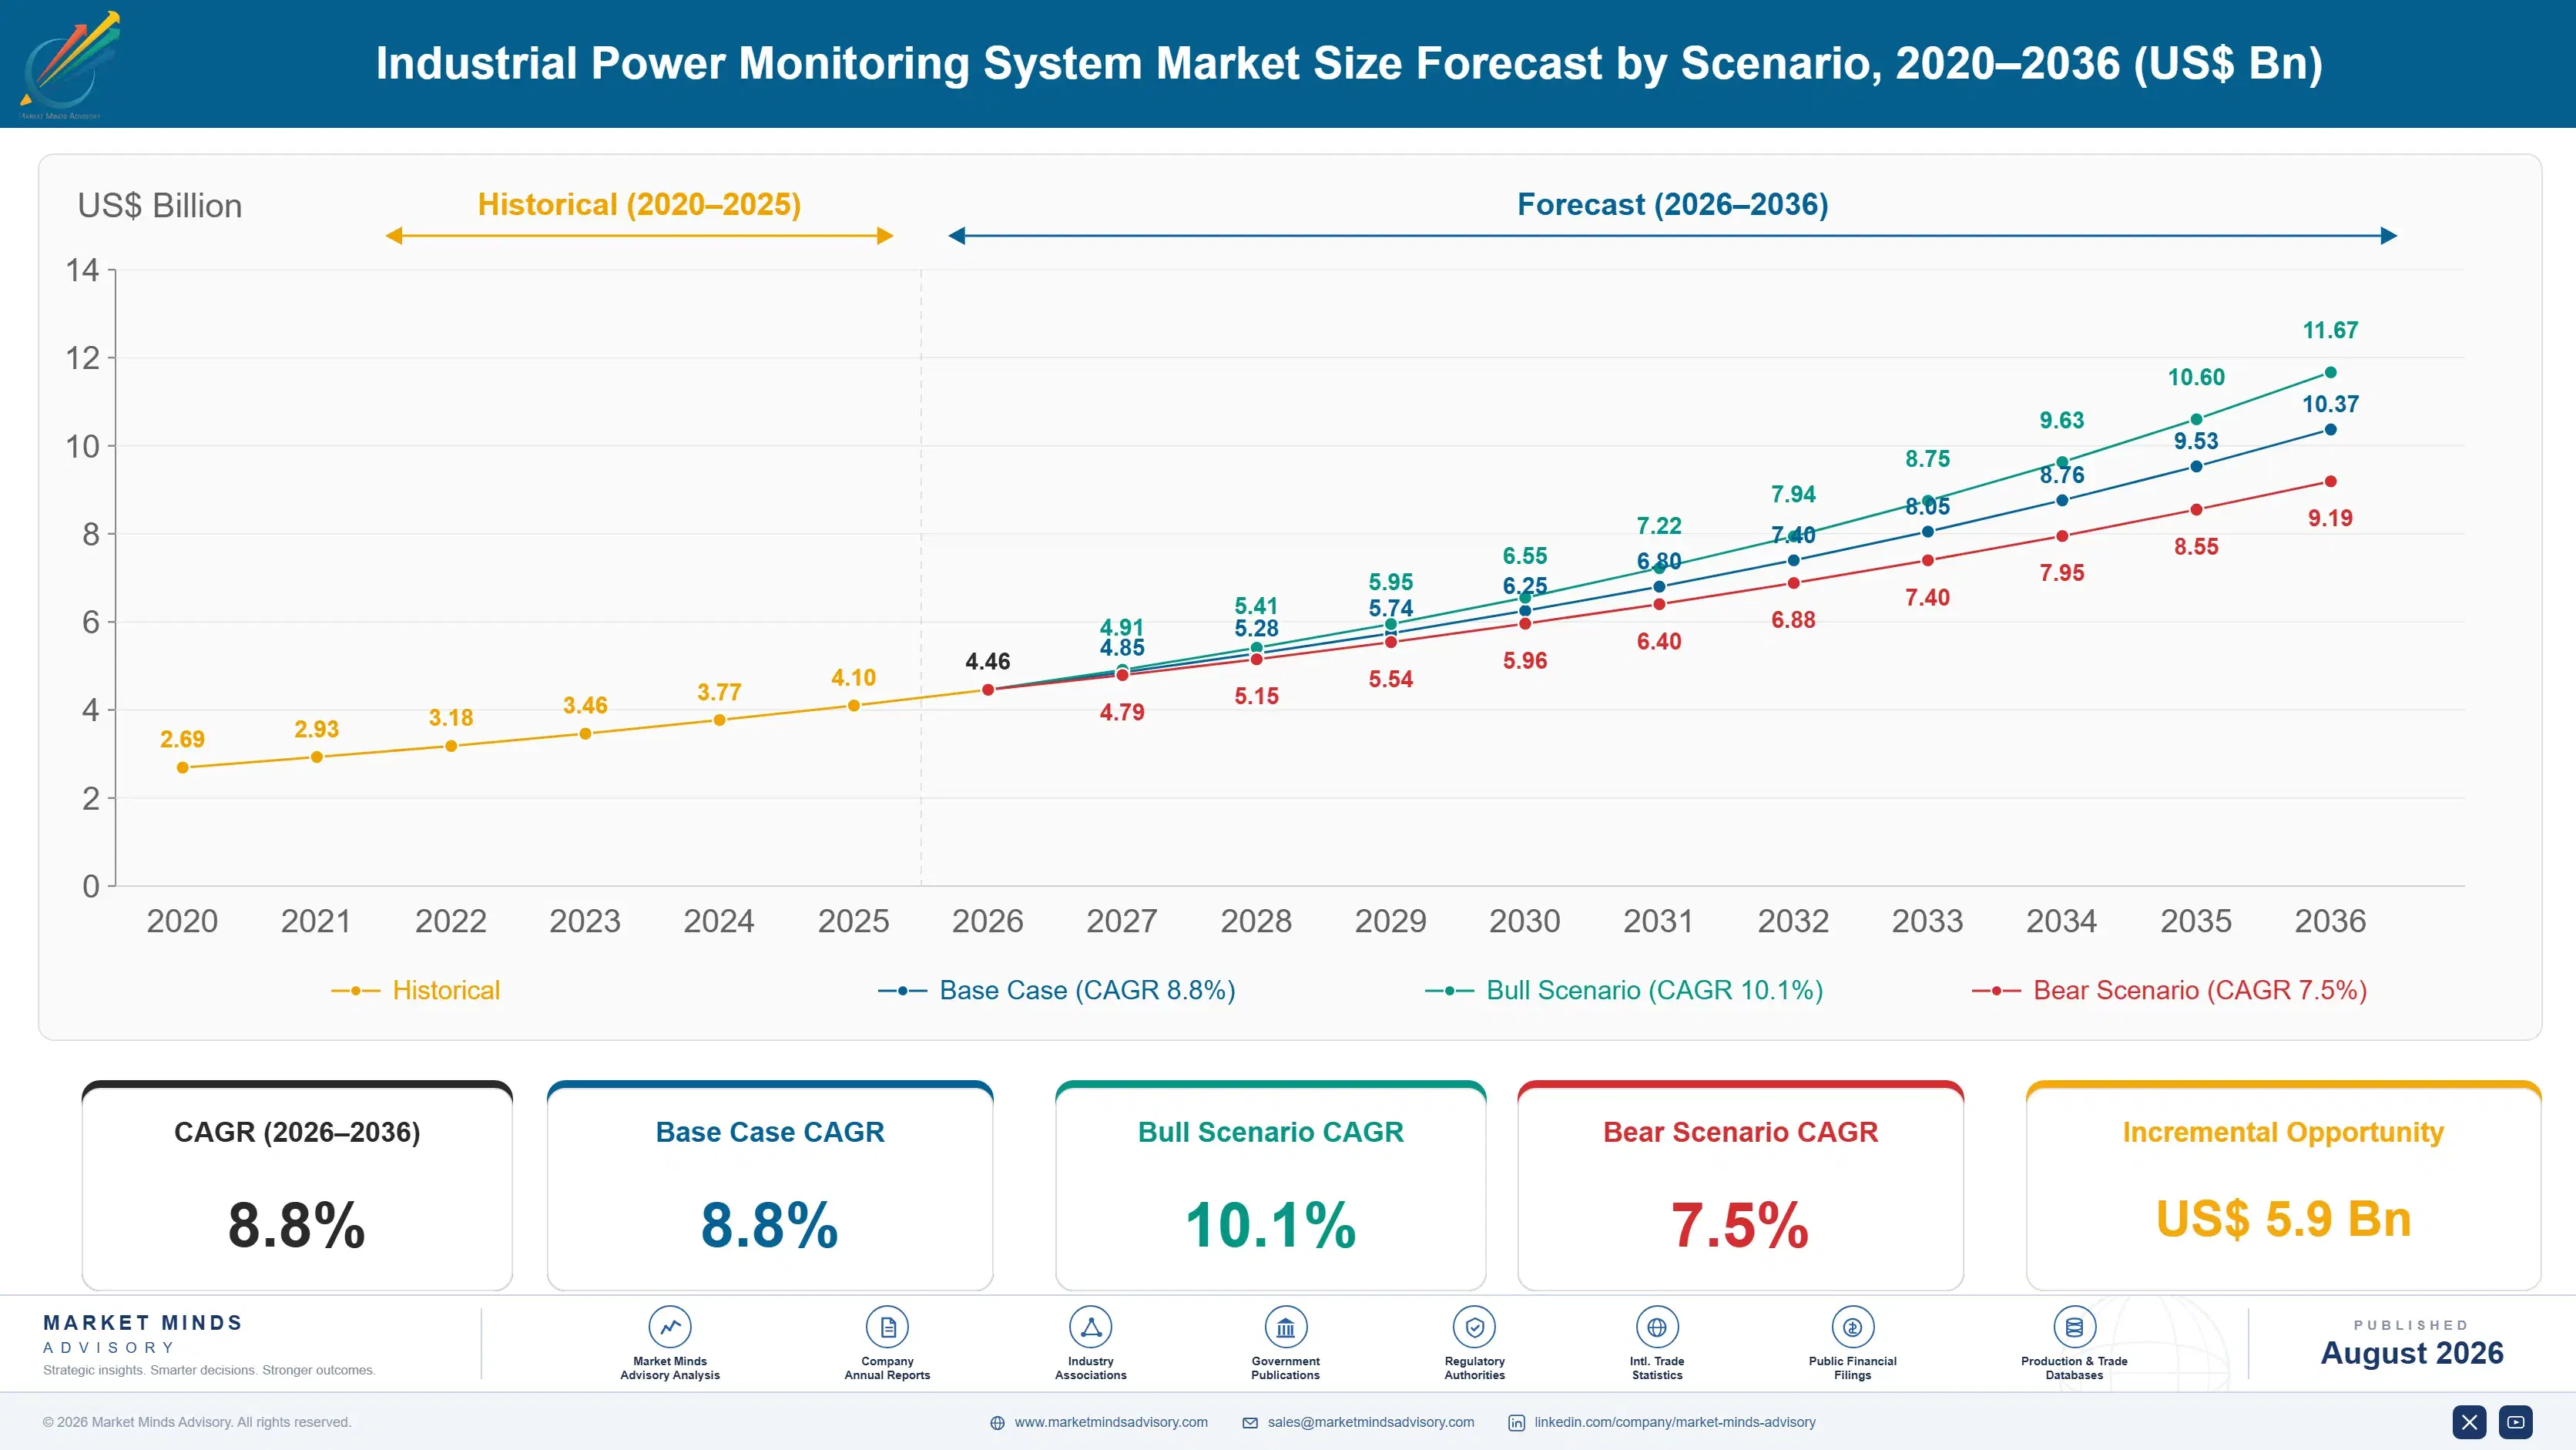
Industrial Power Monitoring System Market Forecast Scenarios

industrial-power-monitoring-system-market-size-forecast-scenario-1787334118548
Between 2020 and 2025 the reasons to install monitoring multiplied while the equipment barely changed. Energy prices made consumption visible in a way three decades of efficiency campaigns never had, sustainability reporting requirements began demanding measured rather than estimated data, and grid operators started paying industrial sites for flexibility they could evidence. A 7.6% historical CAGR reflects new audiences rather than any new capability.
Three mechanisms carry the 8.8% base case. Mandatory sustainability disclosure is the largest, because an auditor will not accept an estimate derived from an invoice and a facility without measured data cannot report. Power quality cost recognition is the second, since a voltage sag stopping a semiconductor line costs more than the entire monitoring installation. And grid flexibility payments require metered evidence of load reduction, which turns monitoring into a revenue asset.
The 10.1% bull case turns on disclosure requirements extending down the supply chain to smaller manufacturers, which would multiply the number of facilities needing measured data. The 7.5% bear case is industrial capital deferral, since monitoring competes against production investment and rarely wins on internal return. Both scenarios turn on who is asking for the evidence rather than on anything technical.

Instruments That Produce Evidence, Not Product

Every other system in a plant contributes to what leaves the gate. This one contributes information about what happened, which is genuinely valuable and impossible to put in a return on investment calculation that a production director will approve. That has always been the commercial problem and it has not changed at all. No production director has ever approved one on its own merits.
TOP FIVE CONCENTRATION44%Control system integration narrows the field more than measurement does
AVERAGE SYSTEM VALUEUSD 68,000Typical installed monitoring scope across a mid-size industrial facility
UNREVIEWED DATA SHAREOver 60 percentInstallations whose readings nobody examines between commissioning and incident
SAG EVENT COSTUSD 340,000Typical production loss from one voltage disturbance in continuous manufacturing
SOFTWARE REVENUE SHARE29%Analysis platforms and subscriptions beyond the measurement hardware itself
LEADING PRODUCER SHARE37%Manufacturing concentrates where electrical equipment supply chains already sit
What changed is the audience. A sustainability auditor now requires measured electricity data rather than an estimate from an invoice. An insurer asks what caused the unexplained stop. A grid operator pays for flexibility a site can evidence. None of those parties existed as buyers a decade ago, and all three now sign for equipment production never would have. Three new signatories appeared where there had been none.
The uncomfortable truth is that most of the data goes unread. Over 60% of installations produce readings nobody examines between commissioning and the next incident, because deployment is easy and analysis requires somebody whose job it is. Suppliers keep selling hardware into facilities that already own unwatched hardware, which is a strange way to grow a market.
"I have walked round plants with beautiful monitoring installations logging faithfully into a database nobody has opened in four years. The hardware works perfectly. The system does not exist, because a system requires somebody to be responsible for looking, and nobody was ever given that job."
Director, Industrial Energy Systems Practice · MMA Technology Practice &mi

Market Trends

Mandatory Disclosure Requires Measured Rather Than Estimated Data

Sustainability reporting regimes across Europe and increasingly elsewhere require reported energy and emissions figures to be assured, and an auditor will not accept a number derived by allocating a utility invoice across production. That converts monitoring from a management preference into a reporting prerequisite with a filing deadline behind it. Reporting obligations also reach down supply chains, because a customer reporting its own emissions needs figures from suppliers who were never in scope themselves. The requirement is administrative rather than technical, which is exactly why it moves faster than efficiency arguments ever did.
Market Impact: Flexibility pays 60 thousand annual
Power Quality Cost Finally Gets Attributed Correctly

A voltage sag lasting under a second stops a semiconductor line, spoils a batch, or trips a continuous process, and the loss from one event in demanding manufacturing runs to hundreds of thousands of dollars. Without monitoring the stop appears in a log as unexplained and nobody attributes it to anything. With monitoring it becomes a documented supply event that can be raised with the utility, claimed against, or engineered out. That attribution is what converts power quality from an electrical curiosity into a manufacturing cost line somebody owns. Attribution changes who owns the cost.
Market Impact: Claims require 30 days of data

Market Opportunities and Growth Drivers

Grid Flexibility Payments Turn Monitoring Into Revenue

System operators across Europe, North America, and increasingly Asia pay industrial sites for demand reduction delivered on request, and settlement requires metered evidence at intervals the site must provide. A facility without that measurement cannot participate however flexible its load actually is. That converts monitoring from an overhead into the entry ticket to a revenue stream, which is a materially easier internal argument than any efficiency case. Payments are large enough in some markets to fund the installation within a single season of participation, and the equipment then keeps earning.
Market Impact: Over 60% of data goes unread

Insurers Ask What Caused The Unexplained Stoppage

Business interruption claims and premium negotiations increasingly turn on whether a manufacturer can demonstrate what happened electrically during an incident, and a site without monitoring simply cannot. Insurers have begun treating power quality measurement as a risk control in the same way they treat suppression and detection. That reaches facilities through underwriting rather than through any engineering conversation, which means the request arrives at a finance director rather than a plant engineer. Requirements attached to policy renewal move considerably faster than any capital planning cycle does. Renewal dates move faster than capital planning cycles do.
Market Impact: Payback exceeds 4 years typically

Market Restraints and Challenges

Nobody Owns The Job Of Looking At The Output

Over 60% of monitoring installations produce data nobody reviews between commissioning and the next incident, because installing hardware is a project and analysing output is a permanent responsibility somebody has to be given. The root cause is organisational rather than technical, since the systems work exactly as sold. Commercially this suppresses repeat purchasing, because a facility that saw no benefit from the first installation is unlikely to fund a second. Suppliers are mitigating with automated exception reporting, managed analysis services, and configurations that push findings out rather than waiting to be queried.
Market Impact: Disclosure covers 50 thousand compa

Monitoring Competes Against Production Investment And Loses

A capital committee comparing a monitoring system against a machine that increases output will approve the machine every time, because one produces revenue and the other produces information. The root cause is that the benefit is avoided cost and improved decisions, neither of which appears in a production forecast. Commercially this means monitoring is bought when somebody external requires it rather than when it makes sense. Suppliers are mitigating by attaching purchases to compliance deadlines, insurance conditions, and flexibility revenue rather than presenting an efficiency business case nobody approves. Information rarely beats output at a committee.
Market Impact: One sag event costs USD 340,000
3 additional market trends, 2 additional growth drivers, and 4 additional restraints and challenges are covered in the full report. Contact sales@marketmindsadvisory.com to access the complete intelligence.

Segment CAGR and Growth Architecture

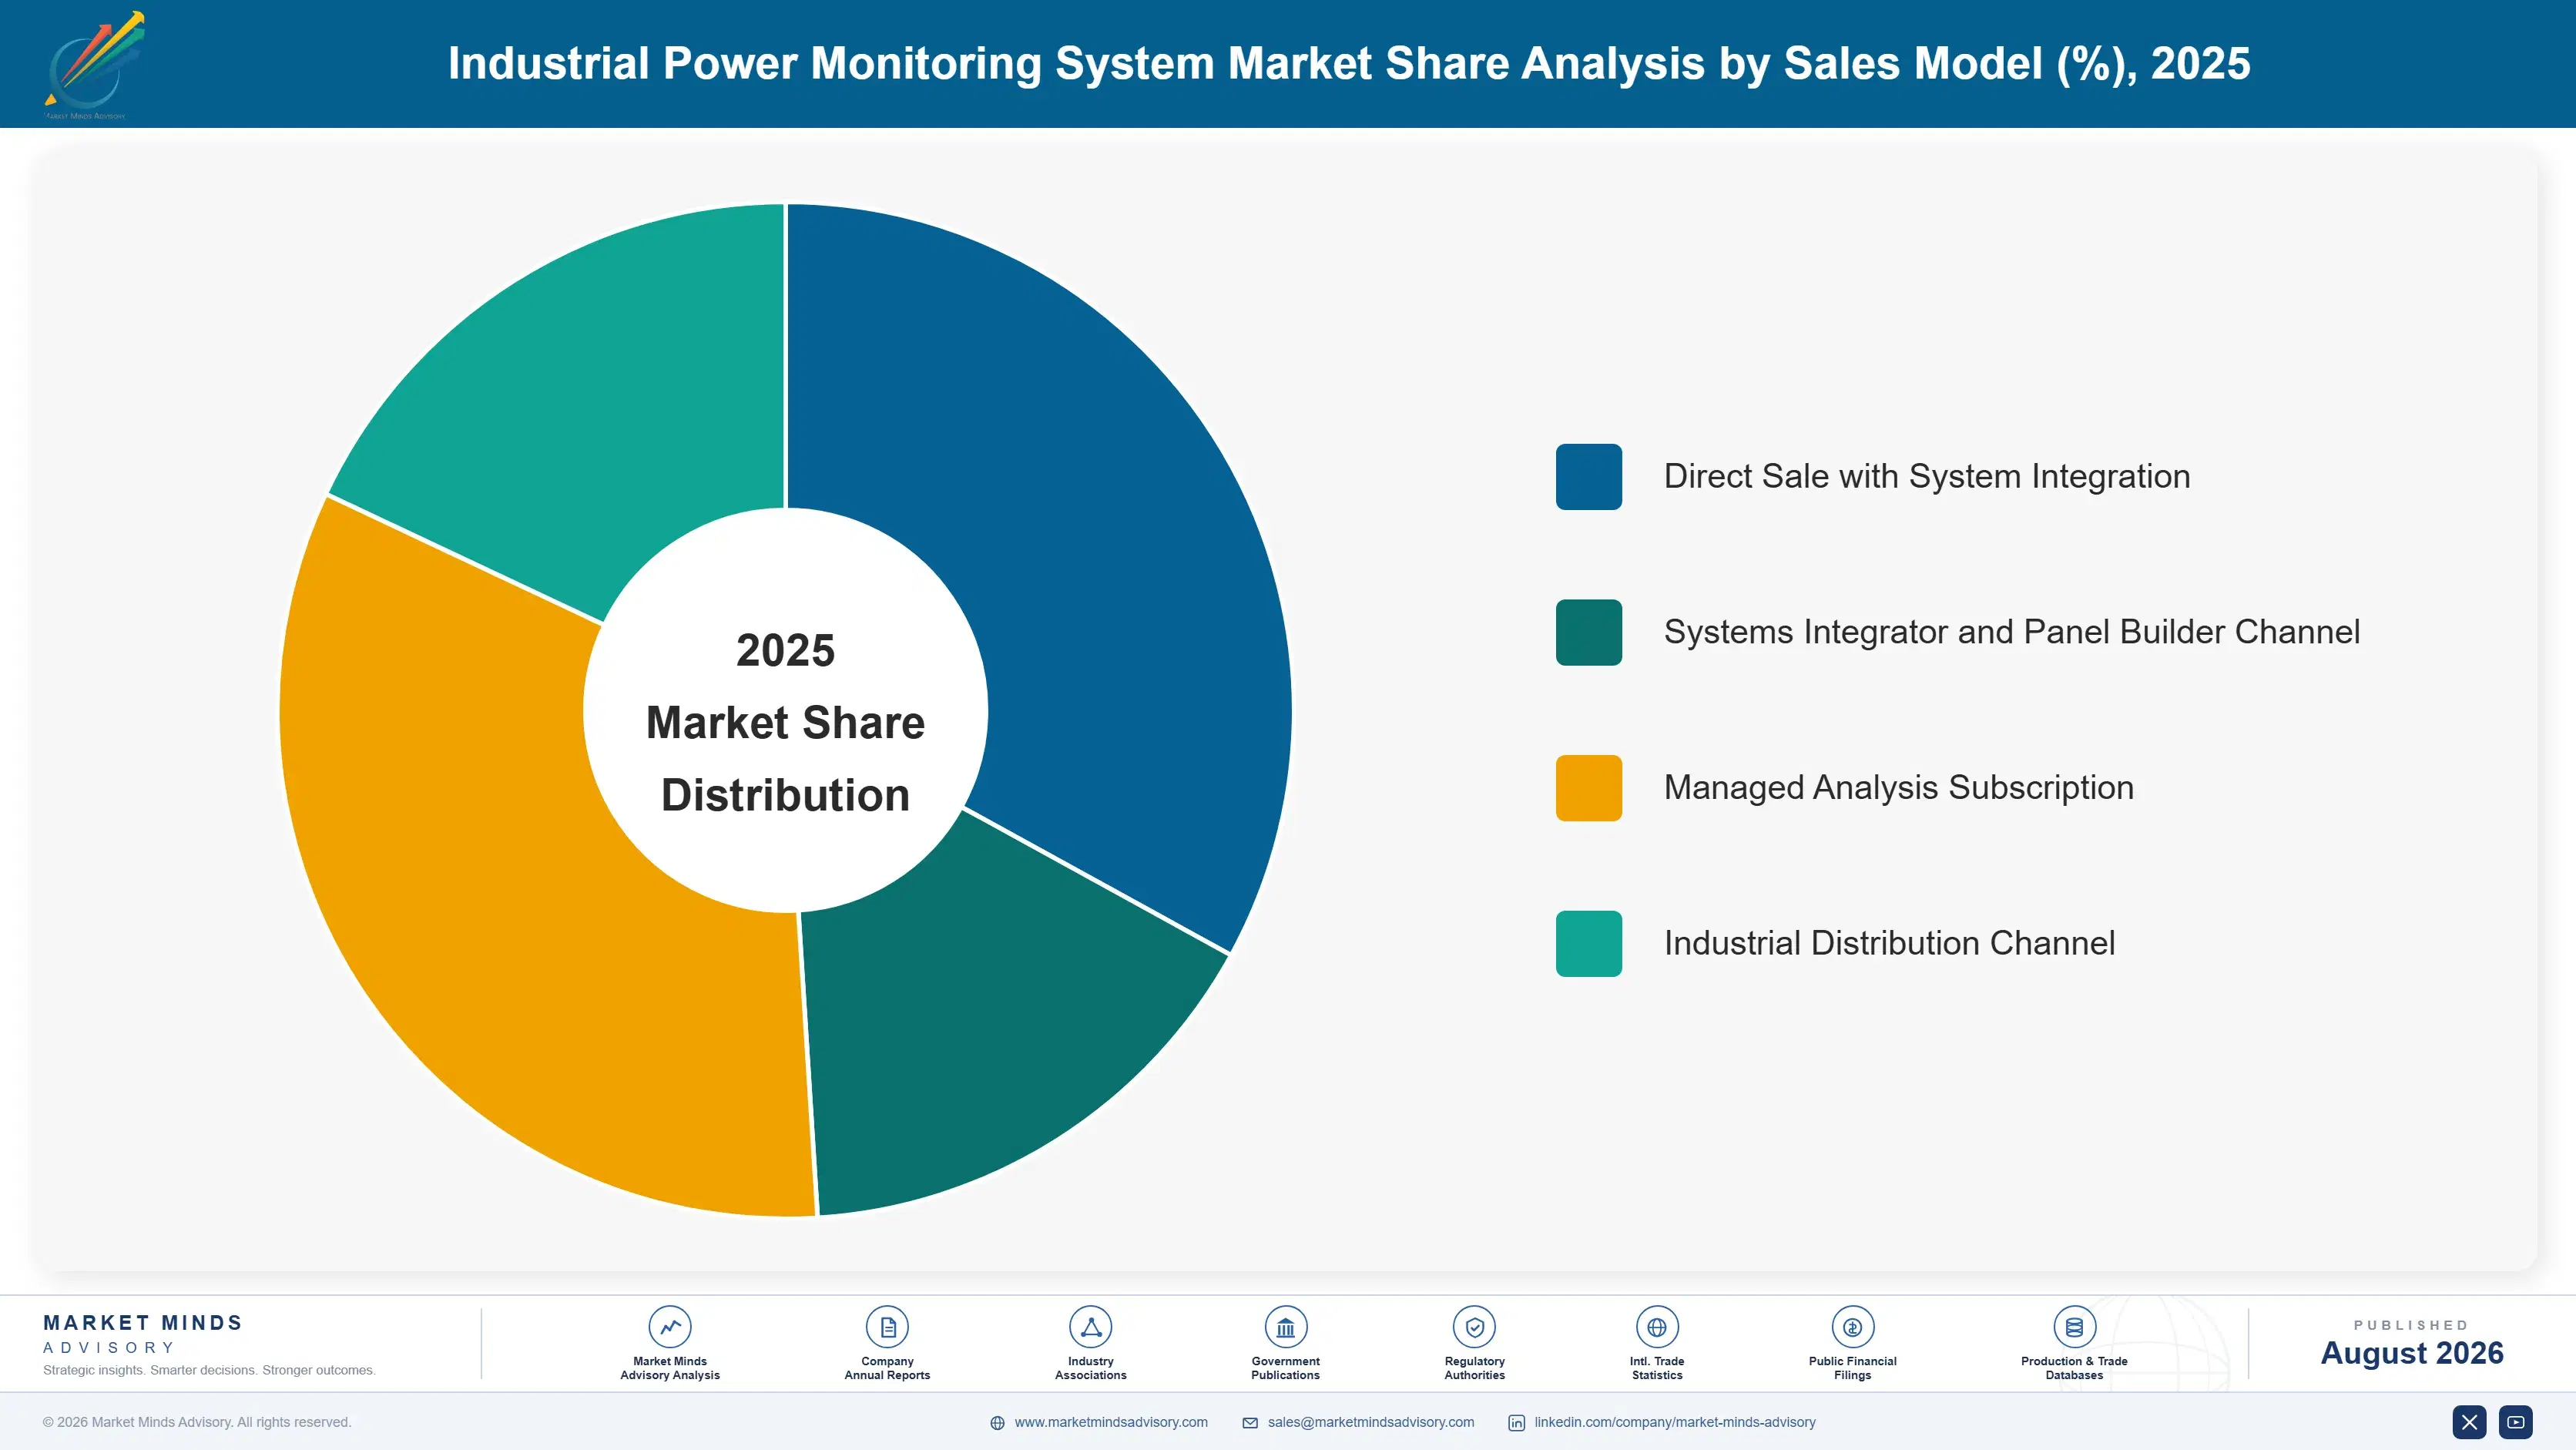
Segmentation follows the parameter class a system is bought to measure, because that determines who signs for it, what accuracy and sampling rate it needs, what it must integrate with, and which budget it comes from. Hardware format, communication protocol, and end-use industry are handled in the framework and commentary instead of here. Who signs decides everything else.
industrial-power-monitoring-system-market-market-share-analysis-1787334119094

Emissions and Carbon Reporting Systems

Emissions and carbon reporting grows fastest at 15.4%, about 1.75 times the market rate, and an auditor rather than an engineer drives every purchase. Sustainability disclosure regimes require assured figures, and a number produced by allocating a utility invoice across production lines does not survive assurance. That forces measured data at the level the report claims, which for most manufacturers means metering they never installed. Reporting obligations also travel down supply chains, reaching companies never directly in scope because a customer needs figures from them. The technical requirement is modest and the deadline is fixed, which is an unusually favourable combination for anybody selling into it. Deadlines rather than business cases carry this segment entirely.
CAGR 15.4%

Power Quality and Disturbance Monitoring

Power quality monitoring grows at 11.2% because the cost of not having it finally became attributable. A voltage sag lasting well under a second stops a semiconductor line or spoils a continuous process batch, and without measurement that stop appears in a log as unexplained and gets blamed on the equipment. With measurement it becomes a documented supply event a manufacturer can raise with the utility, claim against, or engineer out with mitigation. Semiconductor, automotive, pharmaceutical, and data centre operators buy on that basis rather than on any energy argument. Sampling rate and event capture capability separate credible instruments from meters that merely average. Averaging meters do not qualify for this work at all.
CAGR 11.2%
Full segment breakdown across 7 segments available in the complete report.

Regional Architecture and Country Demand Map

Regional shares track industrial electricity consumption and disclosure obligation together, which is why the map looks unlike general technology spending. Growth depends on which of those two forces each region is running on rather than on any difference in the instruments being installed. Each out-of-band figure is explained below.

East Asia

East Asia holds 32% of value, above the 30% ceiling this framework applies, because Chinese industry consumes more electricity than any other economy and the manufacturing base needing measurement is correspondingly enormous. Provincial energy consumption targets and dual control policy push metering into facilities regardless of any commercial argument, which is a demand mechanism no other region has. Domestic suppliers hold most of the hardware volume at prices international vendors cannot approach, while integration and analysis software still favours imported platforms. Japanese and Korean demand is weighted toward semiconductor and precision manufacturing where power quality monitoring matters more than consumption tracking. Growth at 9.6% exceeds the global rate on policy-driven installation and on continued industrial capacity additions across the region.
Share: 32% | CAGR: 9.6% (2026 to 2036)

North America

North America holds 23% of value on a large industrial base with growing exposure to power quality problems rather than to disclosure obligations. Grid reliability has deteriorated measurably in several regions, and manufacturers experiencing more frequent disturbances are installing monitoring to attribute losses they previously wrote off as unexplained. Demand response and flexibility programmes are more developed here than almost anywhere, which makes metered evidence directly revenue-generating for participating sites. Federal disclosure requirements remain limited compared with Europe, so the compliance driver is weaker and the operational one stronger. Growth at 8.6% sits close to the global rate, carried by power quality attribution and flexibility participation rather than by any reporting mandate.
Share: 23% | CAGR: 8.6% (2026 to 2036)
Regional intelligence for 5 additional markets available in the complete report: Western Europe, South Asia and Pacific, Latin America, Middle East and Africa, Eastern Europe. Contact sales@marketmindsadvisory.com.
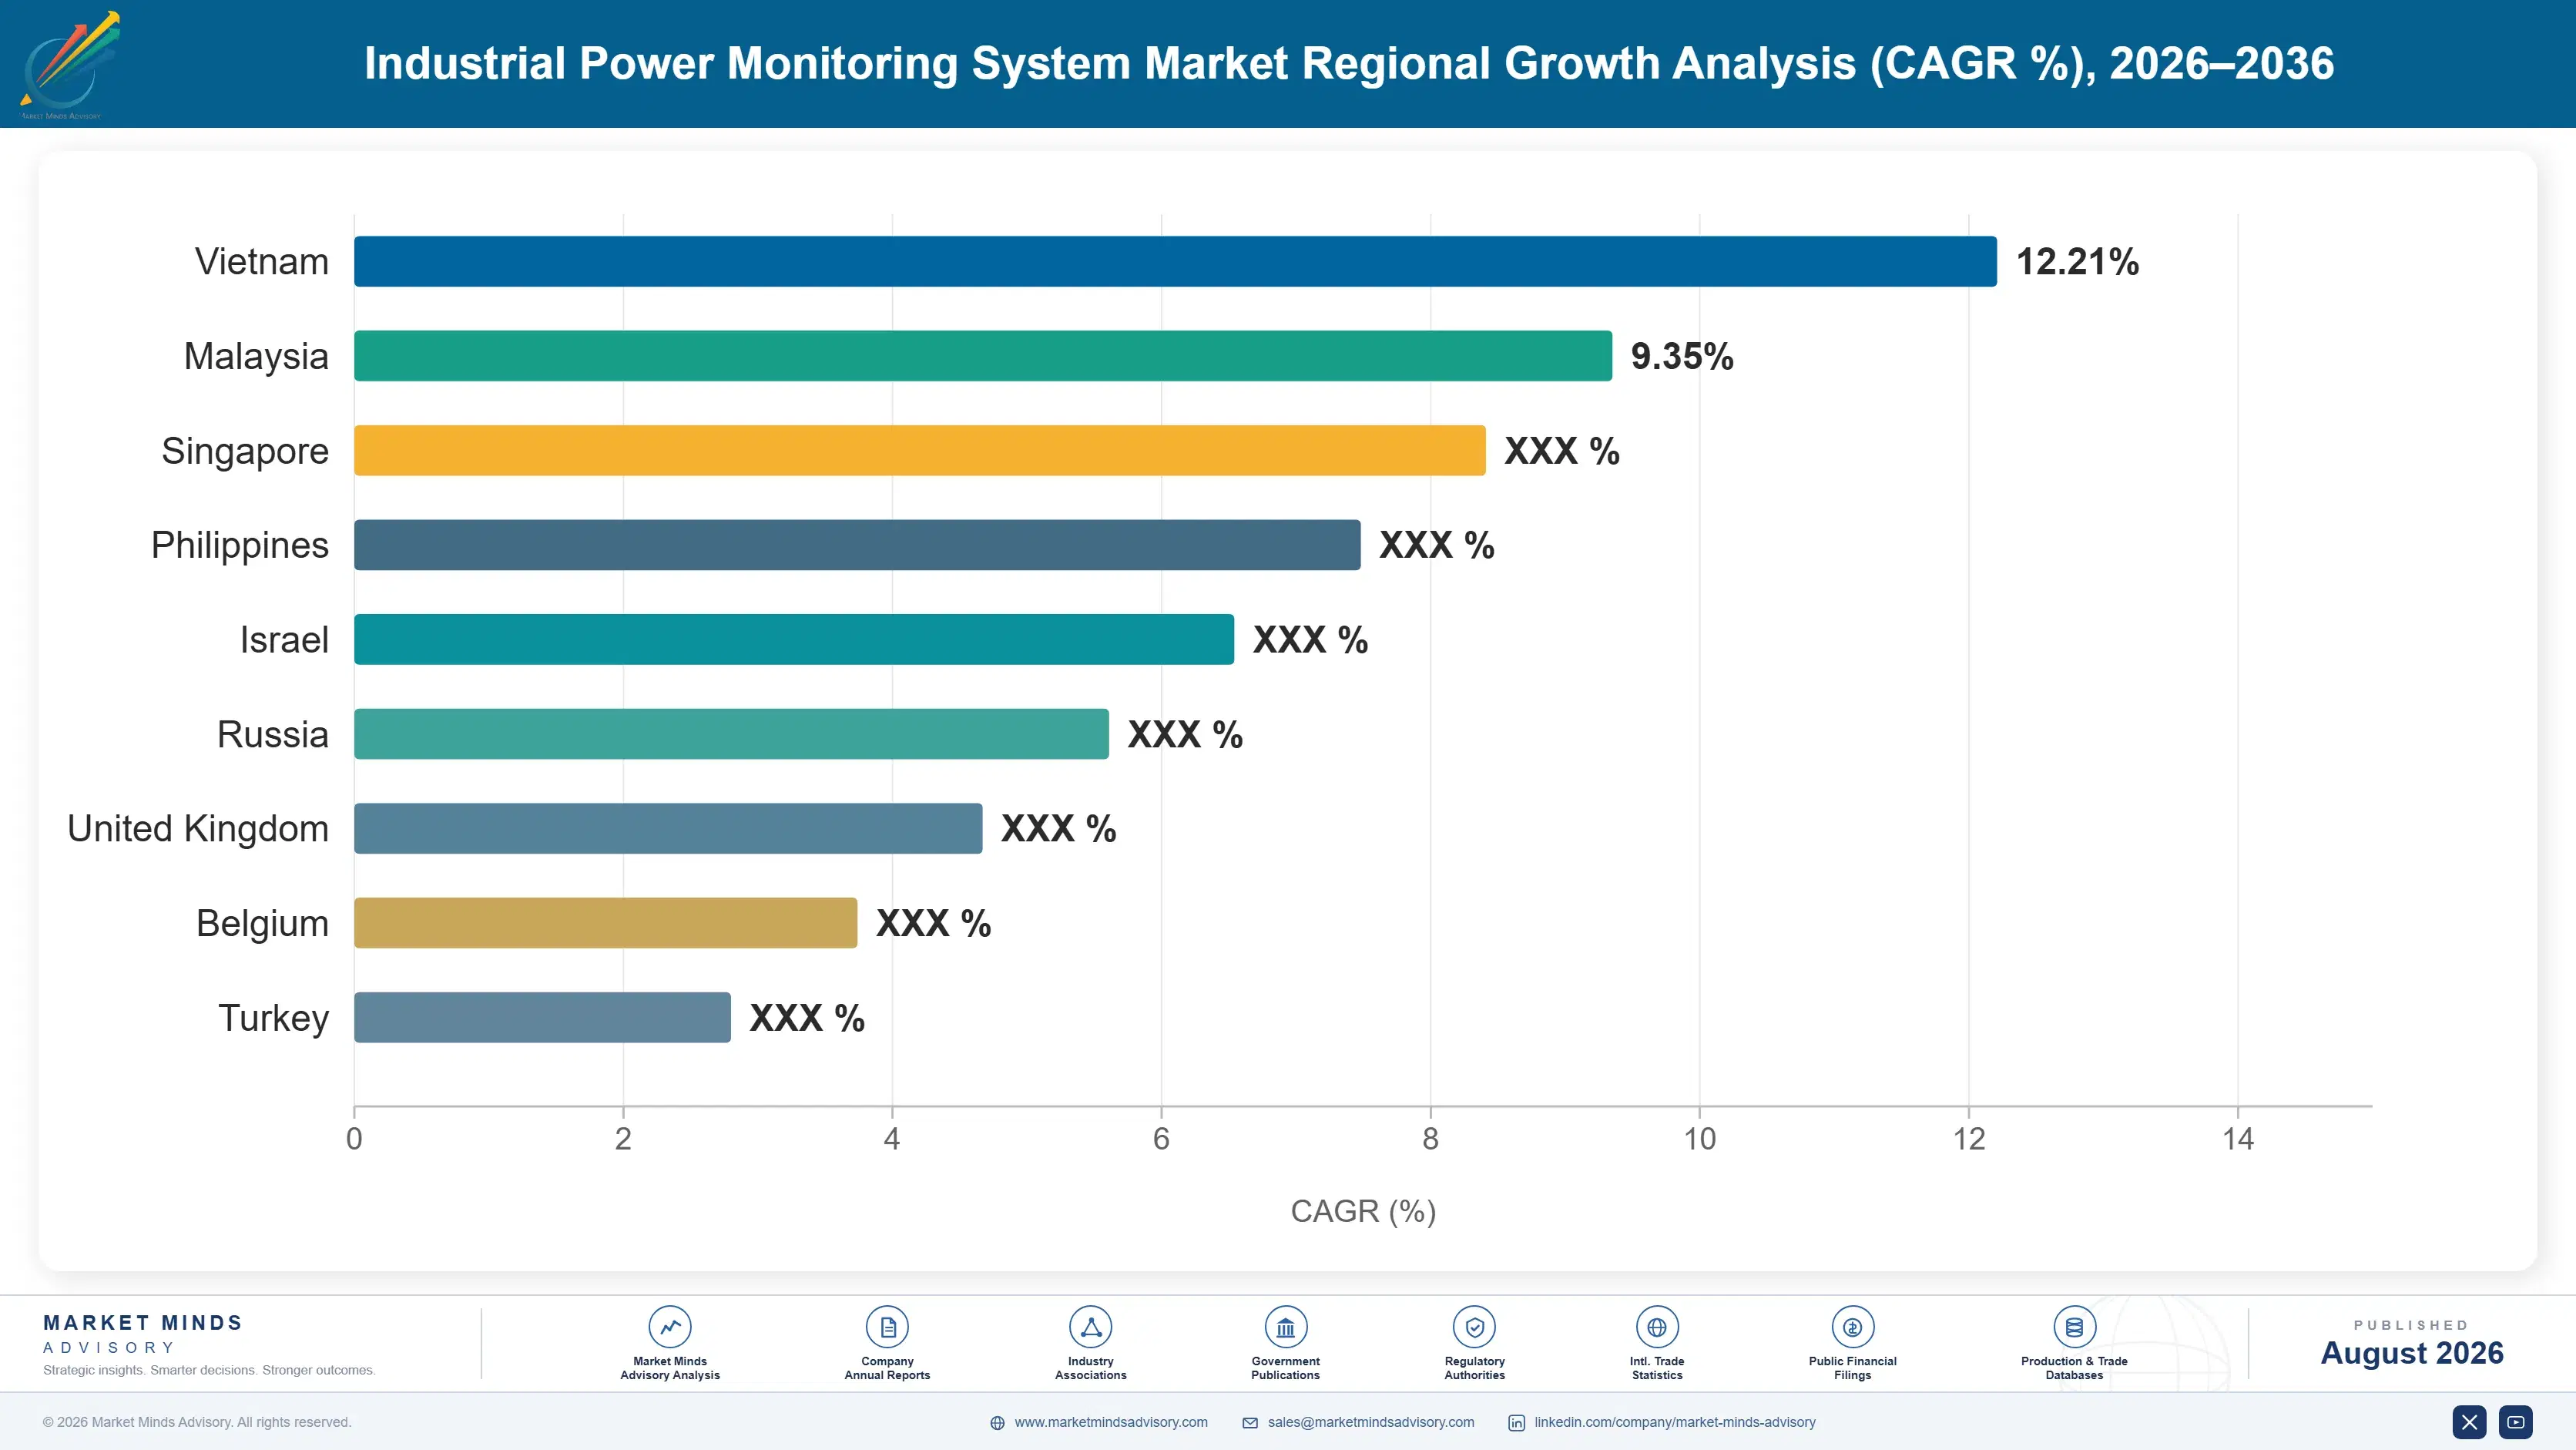
industrial-power-monitoring-system-market-country-cagr-analysis-1787334119609

Where Monitoring Value Actually Accrues

Four levers matter here, and measurement accuracy is not among them, because every credible instrument measures accurately enough. Deadline attachment, managed analysis, flexibility enablement, and platform integration decide outcomes instead. A supplier competing on sampling rate against another accurate instrument is discussing what no buyer weighs. Each reaches a different person inside the plant.

Attach The Purchase To A Deadline Somebody Else Set

A capital committee comparing monitoring against a production machine approves the machine every time, because one generates revenue and the other generates information. A disclosure filing deadline, an insurance renewal condition, or a flexibility programme registration date removes that comparison entirely, because the question becomes when rather than whether. Suppliers who track reporting obligations, underwriting requirements, and grid programme timetables reach buyers already committed to acting. Those presenting an efficiency payback calculation are asking a committee to choose them over output, which is a contest they will keep losing. Payback beyond 4 years never wins a capital committee.
Market Impact: Efficiency payback exceeds 4 years

Sell The Analysis, Not Only The Instruments

Over 60% of installations produce data nobody reviews, because deploying hardware is a project and analysing output is a permanent job nobody was given. A managed service that reviews the data and reports exceptions converts an unwatched installation into a delivered outcome, and it recurs rather than arriving once. It also generates the evidence that justifies the next expansion, which unwatched hardware never does. Most suppliers treat software and service as an attachment to a hardware sale rather than as the thing being bought, which is the wrong way round entirely.
Market Impact: Over 60% of all installations curre

Make The Site Eligible For Flexibility Revenue

Grid operators pay industrial sites for demand reduction they can evidence at settlement intervals, and payments in developed markets reach around sixty thousand dollars annually for a substantial load. A facility without qualifying measurement cannot participate however flexible it actually is. Framing monitoring as the entry ticket to a revenue stream rather than as an overhead changes which budget it comes from and how fast it gets approved. Suppliers who understand programme requirements in each market can size and specify for eligibility rather than for measurement. Payments near 60 thousand dollars change which budget approves it.
Market Impact: Flexibility pays about 60 thousand

Integrate With What The Plant Already Runs

Monitoring data that lands in a separate platform gets looked at once and then forgotten, while data appearing inside the control system or maintenance platform an operator already uses becomes part of the working day. Integration is what determines whether a system is used, and use is what determines whether anybody buys more. Supporting the protocols and data models a plant already runs costs engineering effort against no visible product feature. Suppliers who skip it sell one installation per site and never understand why there is no second. Integration decides roughly 70% of repeat purchasing here.
Market Impact: Integration decides 70% of all repe

Who Controls the Margin Pool

Concentration sits at 44% for the top five, held there by control system integration and installed electrical equipment position rather than by measurement capability, which is widely available. The gap between leaders and challengers is whether monitoring data reaches a platform the plant already uses rather than any instrument specification. All participants here are assessed on one basis, revenue from industrial power monitoring hardware, software, and associated services. Integration capabil
Competition runs on four lines. Control platform integration decides whether anybody uses the output. Compliance capability decides whether the data survives an audit. Flexibility programme knowledge decides access to a revenue-funded purchase. Price decides standalone instruments, where specialist manufacturers and Asian suppliers set the level. Those four contests reach four different buyers inside one plant.

Two pressures will shift positions. Software and managed analysis are becoming the product while hardware commoditises underneath, which favours suppliers with platform capability over instrument makers. Meanwhile disclosure requirements reach manufacturers who never bought monitoring before and have no integrator relationship. Positions favour whoever combines audit-grade data handling with genuine control system integration. Very few suppliers hold both of those capabilities together today.
industrial-power-monitoring-system-market-company-positioning-matrix-1787334120183

Competitive Moat and Risk Dimensions

SCHNEIDER ELECTRIC

Moat: Electrical position and platform reach

Schneider sits inside the electrical distribution equipment across an enormous industrial installed base, which means monitoring is an addition to hardware already present rather than a separate project requiring its own justification. Software platforms integrate measurement with the switchgear, drives, and controls the same customer already operates. That combination reaches buyers a pure instrument maker never meets.
SCHNEIDER ELECTRIC

Risk: Breadth against focused specialists

Power quality analysis at the sampling rates demanding manufacturers require is served better by specialists whose entire business is disturbance capture. Software and analysis competes against dedicated energy management platforms with no hardware to defend. Portfolio breadth also means monitoring competes internally for engineering resource against product lines with clearer near-term returns.
SIEMENS

Moat: Automation integration and industrial depth

Siemens reaches monitoring through the automation platform a plant already runs, which resolves the integration problem that decides whether anybody ever looks at the data. Industrial customer relationships extend across drives, controls, and electrical distribution simultaneously. Digital platform capability handles the audit trail and data governance that disclosure reporting now demands from measurement systems.
SIEMENS

Risk: Premium cost in commodity metering

Standalone metering hardware faces price competition from Asian manufacturers that an integrated automation cost base cannot match, and much of the unit volume sits there. Smaller manufacturers newly caught by supply chain disclosure requirements are not automation customers and have no reason to start. Platform complexity also raises the barrier for facilities wanting simple measurement quickly.

Players Tracked

Prominent Players

Schneider Electric
Siemens
ABB
Eaton
Rockwell Automation

Other Key Players

Honeywell
Emerson
Yokogawa
Mitsubishi Electric
Hitachi
Fluke
Janitza electronics
Socomec
Accuenergy
Dranetz
Elspec
Powerside
Carlo Gavazzi
Phoenix Contact
Legrand

Recent Developments

JANUARY 2025

Sustainability disclosure requirements reach supply chain manufacturers

Reporting obligations under European sustainability rules began reaching suppliers of in-scope companies, requiring measured energy data from manufacturers never directly covered by the regulation themselves. These were reporting effects rather than commercial events, and they create demand among facilities with no prior monitoring installation at all.
Signal: An obligation travelling down a supply cha
SEPTEMBER 2024

Grid operators expand industrial flexibility programme participation

System operators across several markets widened industrial demand response and flexibility programmes, requiring settlement-grade metering evidence from every participating industrial site. These were grid programme changes rather than commercial transactions, and they convert monitoring from an operating overhead into the entry requirement for a revenue stream.
Signal: Equipment that earns revenue gets approved
JUNE 2024

Insurers treat power quality measurement as a risk control

Property and business interruption underwriters began treating industrial power quality monitoring as a recognised risk control when assessing manufacturers running processes sensitive to supply disturbance. These were insurer underwriting decisions rather than any commercial transaction, and they reach a finance director rather than a plant engineer.
Signal: An underwriting condition arrives on a ren

Semiconductors, Sensors, Enclosures, Software

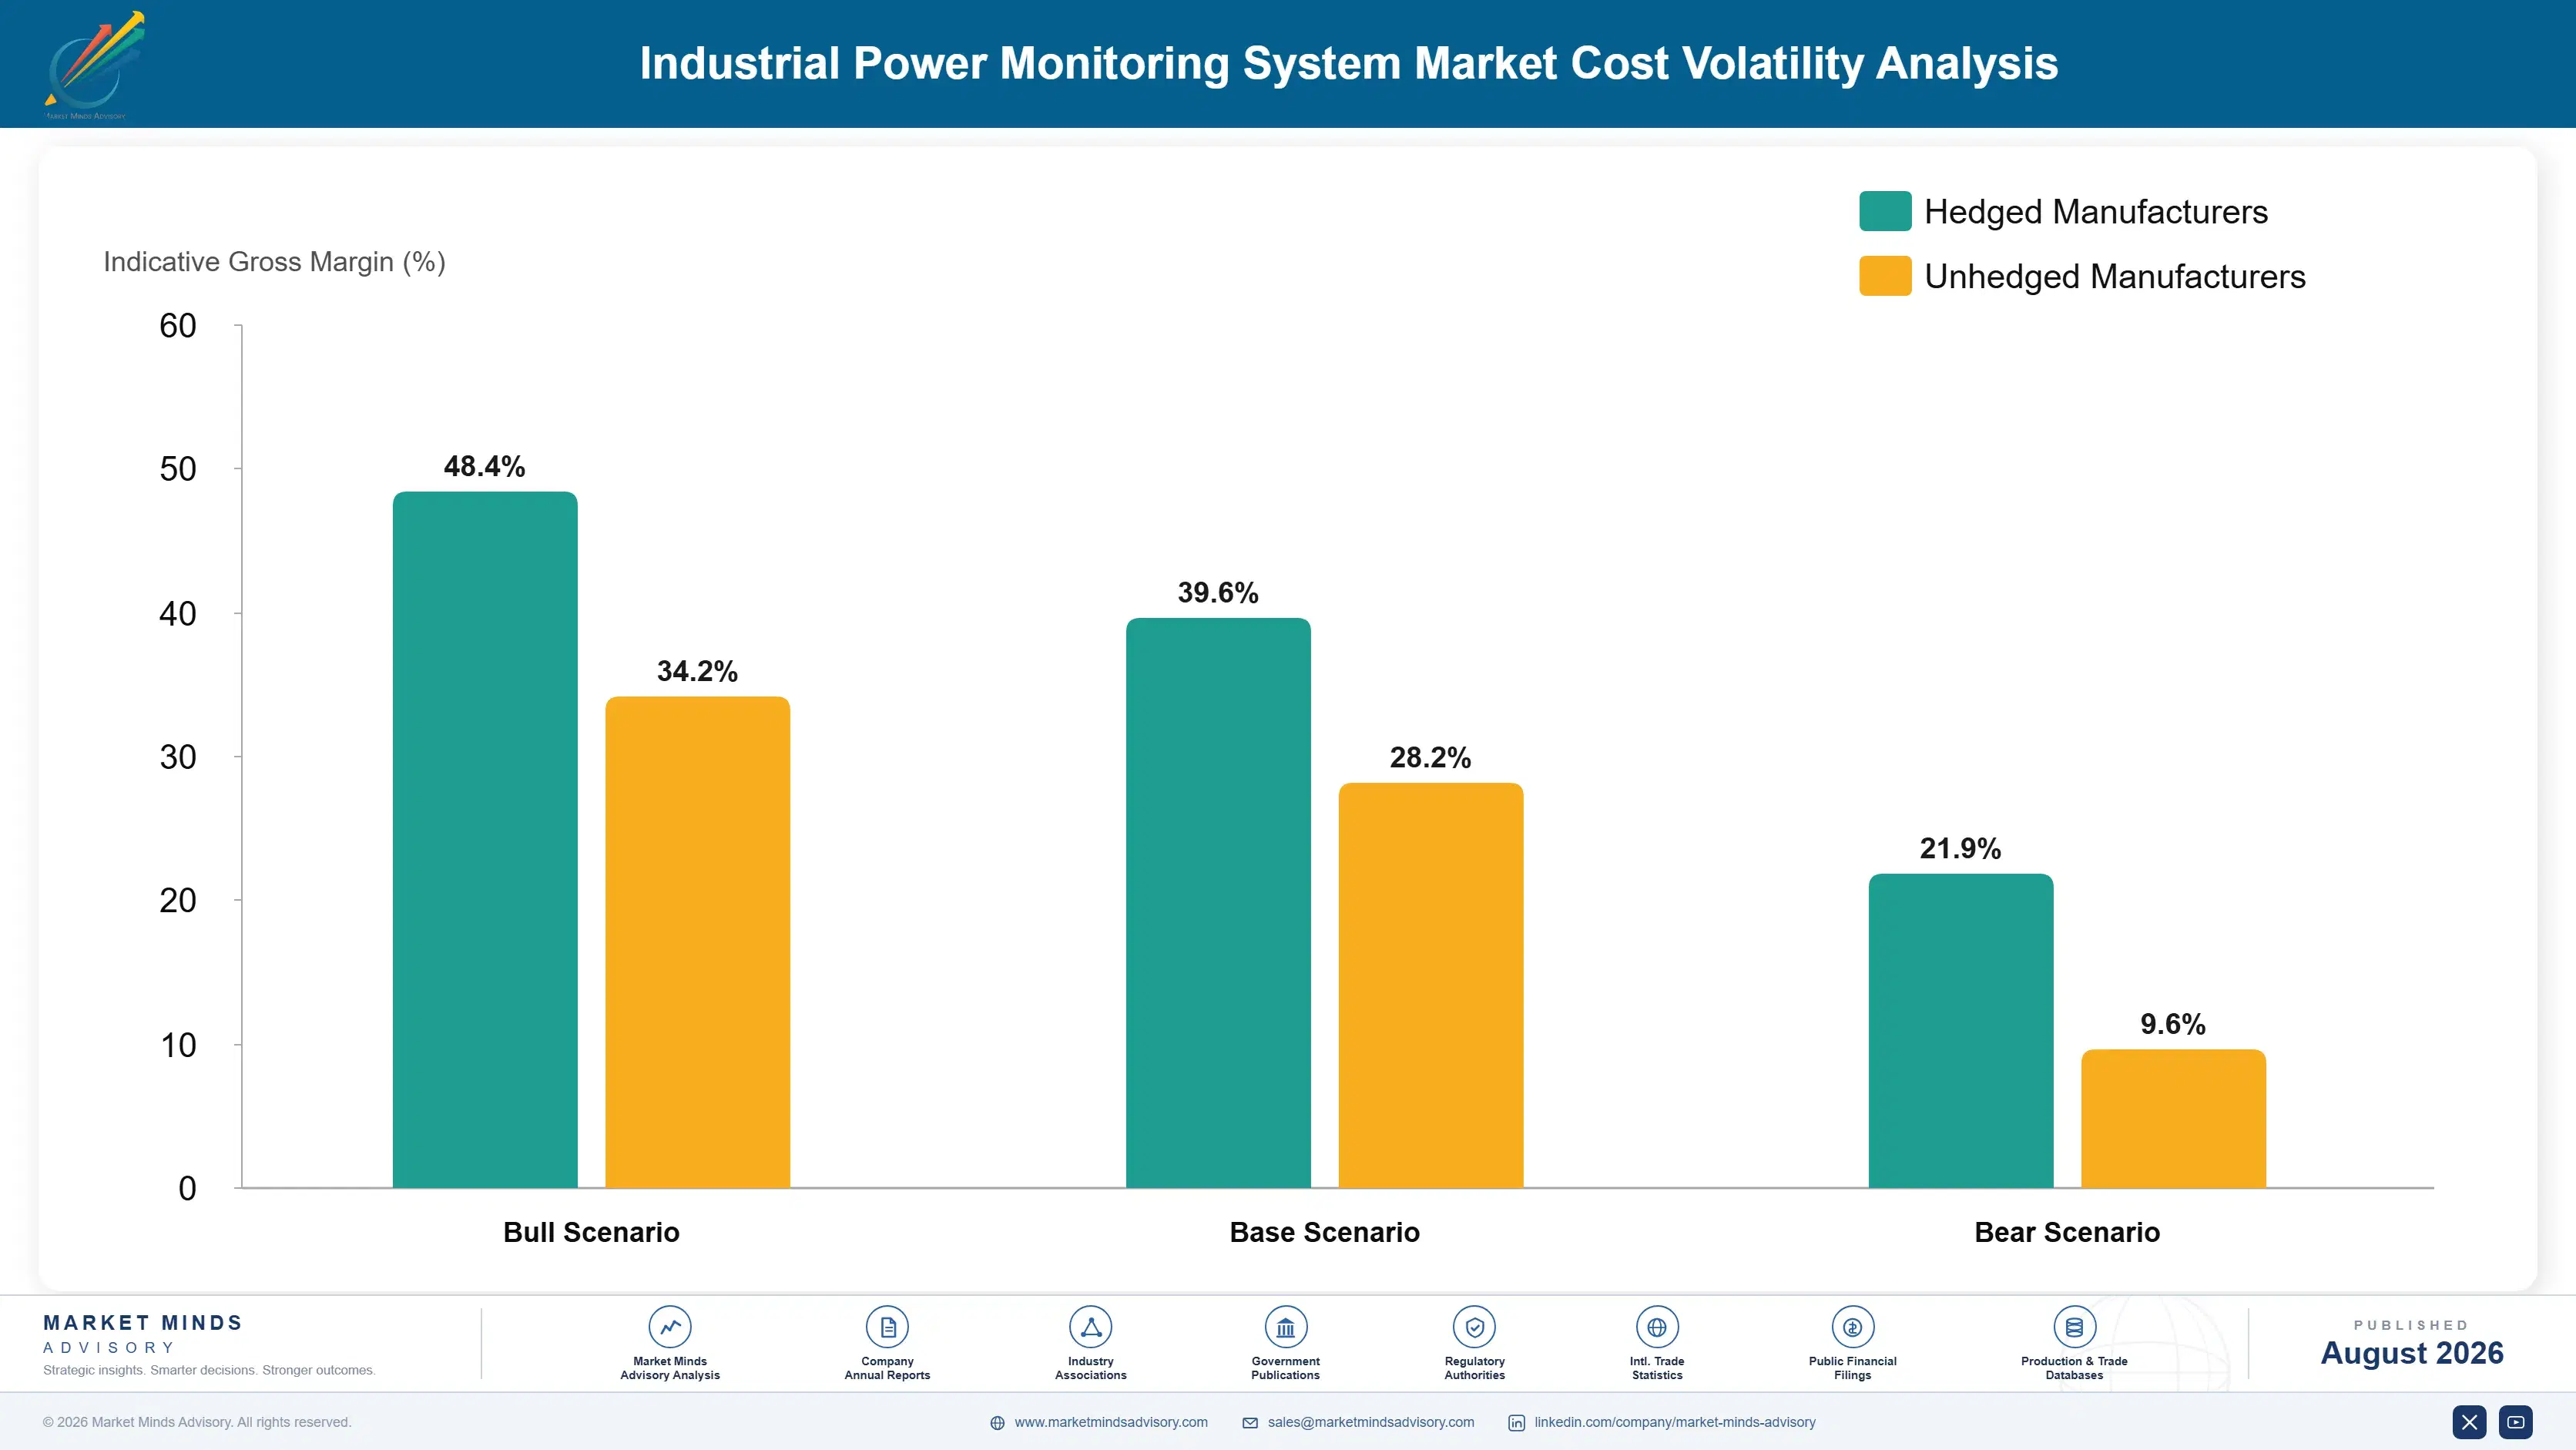
Cost structure divides between hardware that is commoditising and software that is not. Metering and processing semiconductors carry 28% to 40% of hardware cost, from suppliers serving far larger industries. Current transformers, sensors, and enclosures add 22% to 32%. Software development, hosting, and cybersecurity certification account for 16% to 26%, behaving as fixed cost recovered across volume.
The 2021 and 2022 semiconductor shortage reached monitoring hardware harder than most electrical products, because metering and signal processing parts sit on mature nodes reallocated to higher-volume customers. Lead times on some components ran past 50 weeks. Schneider Electric and Eaton both disclosed component supply and cost pressure across that period. Suppliers redesigning around available parts had to repeat electromagnetic compatibility and accuracy verification, which several judged slower than waiting.

Each range above exceeds three points because a standalone power quality analyser and an integrated monitoring platform share components but not economics. Exposure separates by software content. A hardware-weighted supplier carries semiconductor and sensor risk with limited substitution. A platform supplier carries development and hosting cost that scales with customers rather than with units. Asian manufacturers reach hardware on cost and the software layer barely at all.
industrial-power-monitoring-system-market-cost-volatility-analysis-1787334120390

Design metering hardware around dual-sourced components

Metering and signal processing semiconductors use mature-node capacity reallocated whenever larger customers need it, and substituting one means repeating accuracy verification and electromagnetic compatibility testing. Qualifying alternatives at design stage costs testing time once, while discovering the dependency during a shortage costs a product line most of a year. Very few suppliers here design for dual sourcing from the outset.

Price software separately from the hardware it runs on

Software and platform costs behave as fixed development and hosting expense recovered across a customer base, not as a component cost inside a meter. Bundling them into hardware pricing hides the economics from the supplier and gives the value away to the buyer. Separating the two makes recurring revenue visible and prices what customers keep paying for.

Certify one hardware platform across the product range

Accuracy class verification, electromagnetic compatibility, and increasingly cybersecurity certification behave as fixed costs per platform rather than per product. Approving one hardware design across many variants spreads that burden considerably further than certifying models individually does. Most suppliers certify reactively as markets demand, which fragments the spend and leaves gaps that close markets nobody realised were closed.

Portfolio Architecture for Margin Defence

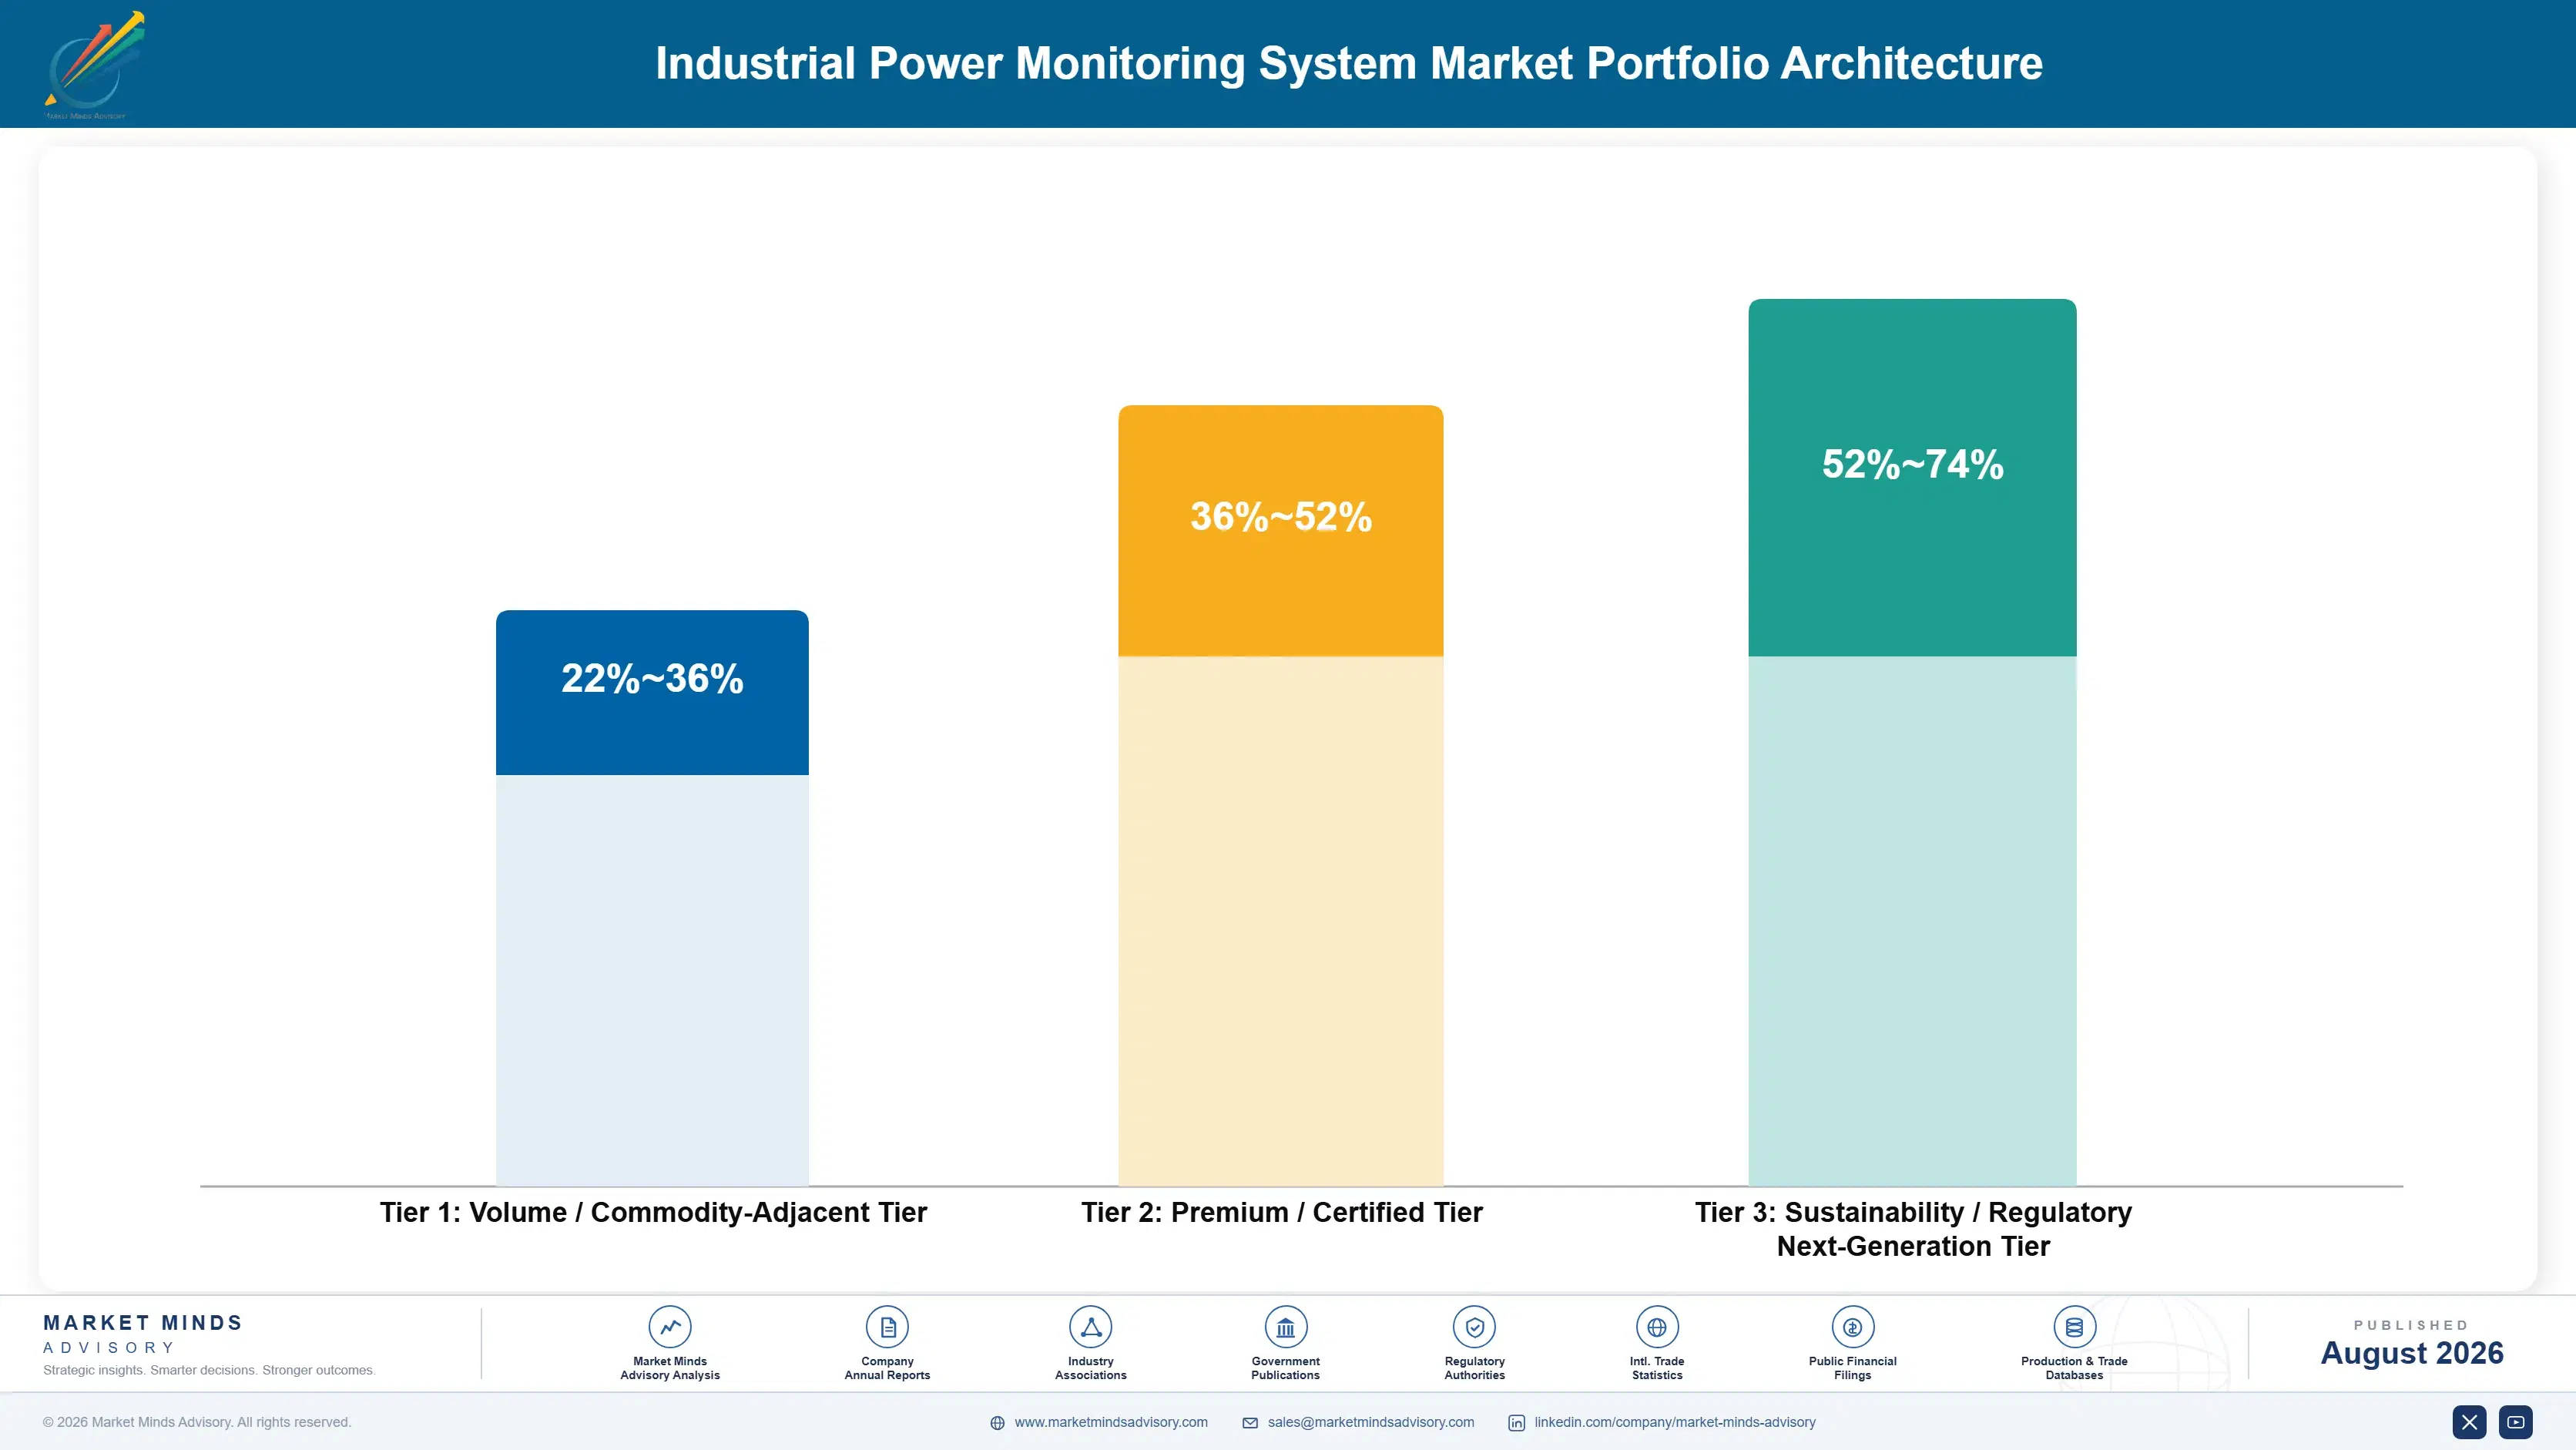
Three tiers sit inside this category and who signs for the purchase draws the lines. Standalone metering hardware forms the volume tier, sold on price where Asian manufacturers and specialists compete freely. Integrated monitoring with control platform connection earns more, because integration decides whether the data gets used. Compliance-grade reporting, managed analysis, and flexibility enablement price highest, since each attaches to a budget production spending never reaches.
The tension is between hardware volume that is commoditising and software revenue that recurs. Instruments ship in quantity and the measurement is not difficult, so pricing erodes steadily against Asian competition. Software and managed analysis recur, defend the account, and carry margin hardware cannot approach, but require development spending in years when nothing ships. Suppliers funding only hardware find the account renewing on price forever.

High-value pools concentrate where somebody external requires the output: audit-grade emissions data under disclosure obligation, settlement-grade metering for flexibility revenue, power quality evidence for insurance and utility claims, and managed analysis that converts unread data into acted-upon findings. The commodity end is standalone panel meters, where accuracy is table stakes and price is the whole conversation.

Volume / Commodity-Adjacent Tier

Standalone panel meters and basic monitoring hardware sold on specification and price. The range is wide because Asian manufacturing cost positions and Western engineering overheads produce entirely different economics on comparable instruments.
Gross Margin: 22-36%

Premium / Certified Tier

Integrated monitoring connected into control and maintenance platforms with accuracy class verification and cybersecurity certification. The range is wide because integration capability commands pricing that a comparable instrument sold standalone never achieves.
Gross Margin: 36-52%

Sustainability / Regulatory / Next-Generation Tier

Audit-grade emissions reporting, settlement-grade flexibility metering, and managed analysis subscriptions. The range is wide because software carries almost no marginal cost while managed service delivery carries analyst labour that does not scale.
Gross Margin: 52-74%
industrial-power-monitoring-system-market-portfolio-architecture-1787334120899

High-value Sub-segments and Strategic Watch-out

Emissions and Carbon Reporting Systems

High value and high growth at 15.4%, the fastest segment, because assured disclosure requires measured rather than estimated data and an auditor rejects invoice allocation. Deadlines rather than business cases drive the purchase, and obligations reaching down supply chains widen the buyer population continuously. Fixed deadlines help.
Gross Margin: 52-74%

Power Quality and Disturbance Monitoring

High value with strong growth at 11.2%, because a single voltage sag costs a demanding manufacturer far more than the whole installation. Sampling rate and event capture separate credible instruments from meters that merely average, which narrows the field considerably. One event pays for everything installed.
Gross Margin: 36-52%

Energy Consumption and Cost Monitoring

The volume core by units at 6.2%, the original application and now the most commoditised one, since measuring kilowatt hours accurately is not difficult for anybody. Growth depends on tariff volatility rather than on any capability nobody else can supply. Accuracy is table stakes and price is everything.
Gross Margin: 22-36%

Load and Capacity Monitoring

The strategic watch-out at 8.1%, growing steadily as electrification pushes facilities toward their connection limits and capacity headroom becomes a live constraint. It sells to the same electrical engineer already buying, which limits how far it widens the customer base. It widens the order rather than the customer base.
Gross Margin: 36-52%

How Monitoring Demand Gets Approved

Demand commits when somebody outside the plant requires evidence, and then repeats as the requirement widens. A facility installing monitoring for a disclosure deadline discovers the next reporting cycle asks for more granularity, and the flexibility programme wants settlement intervals, and the insurer wants disturbance records. Each requirement extends the installation rather than replacing it. That produces expansion revenue from one entry point, the most reliable pattern here.
Stickiness varies with how deeply the data is embedded. Compliance reporting sticks hardest, since a change of system means restating a baseline an auditor already accepted. Flexibility participation sticks nearly as hard through settlement approval tied to specific meters. Control platform integration sticks through the integration work itself. Standalone instruments stick least, because nothing depends on them and the buyer compares prices at replacement.

The buyer has multiplied rather than changed. Twenty years ago an electrical engineer specified a meter. Now a sustainability officer, a risk manager, an energy trader, and a plant engineer each want something from the same measurement, and none of them alone would fund the installation. Suppliers still selling to the electrical engineer are addressing one of four people who now have to agree.
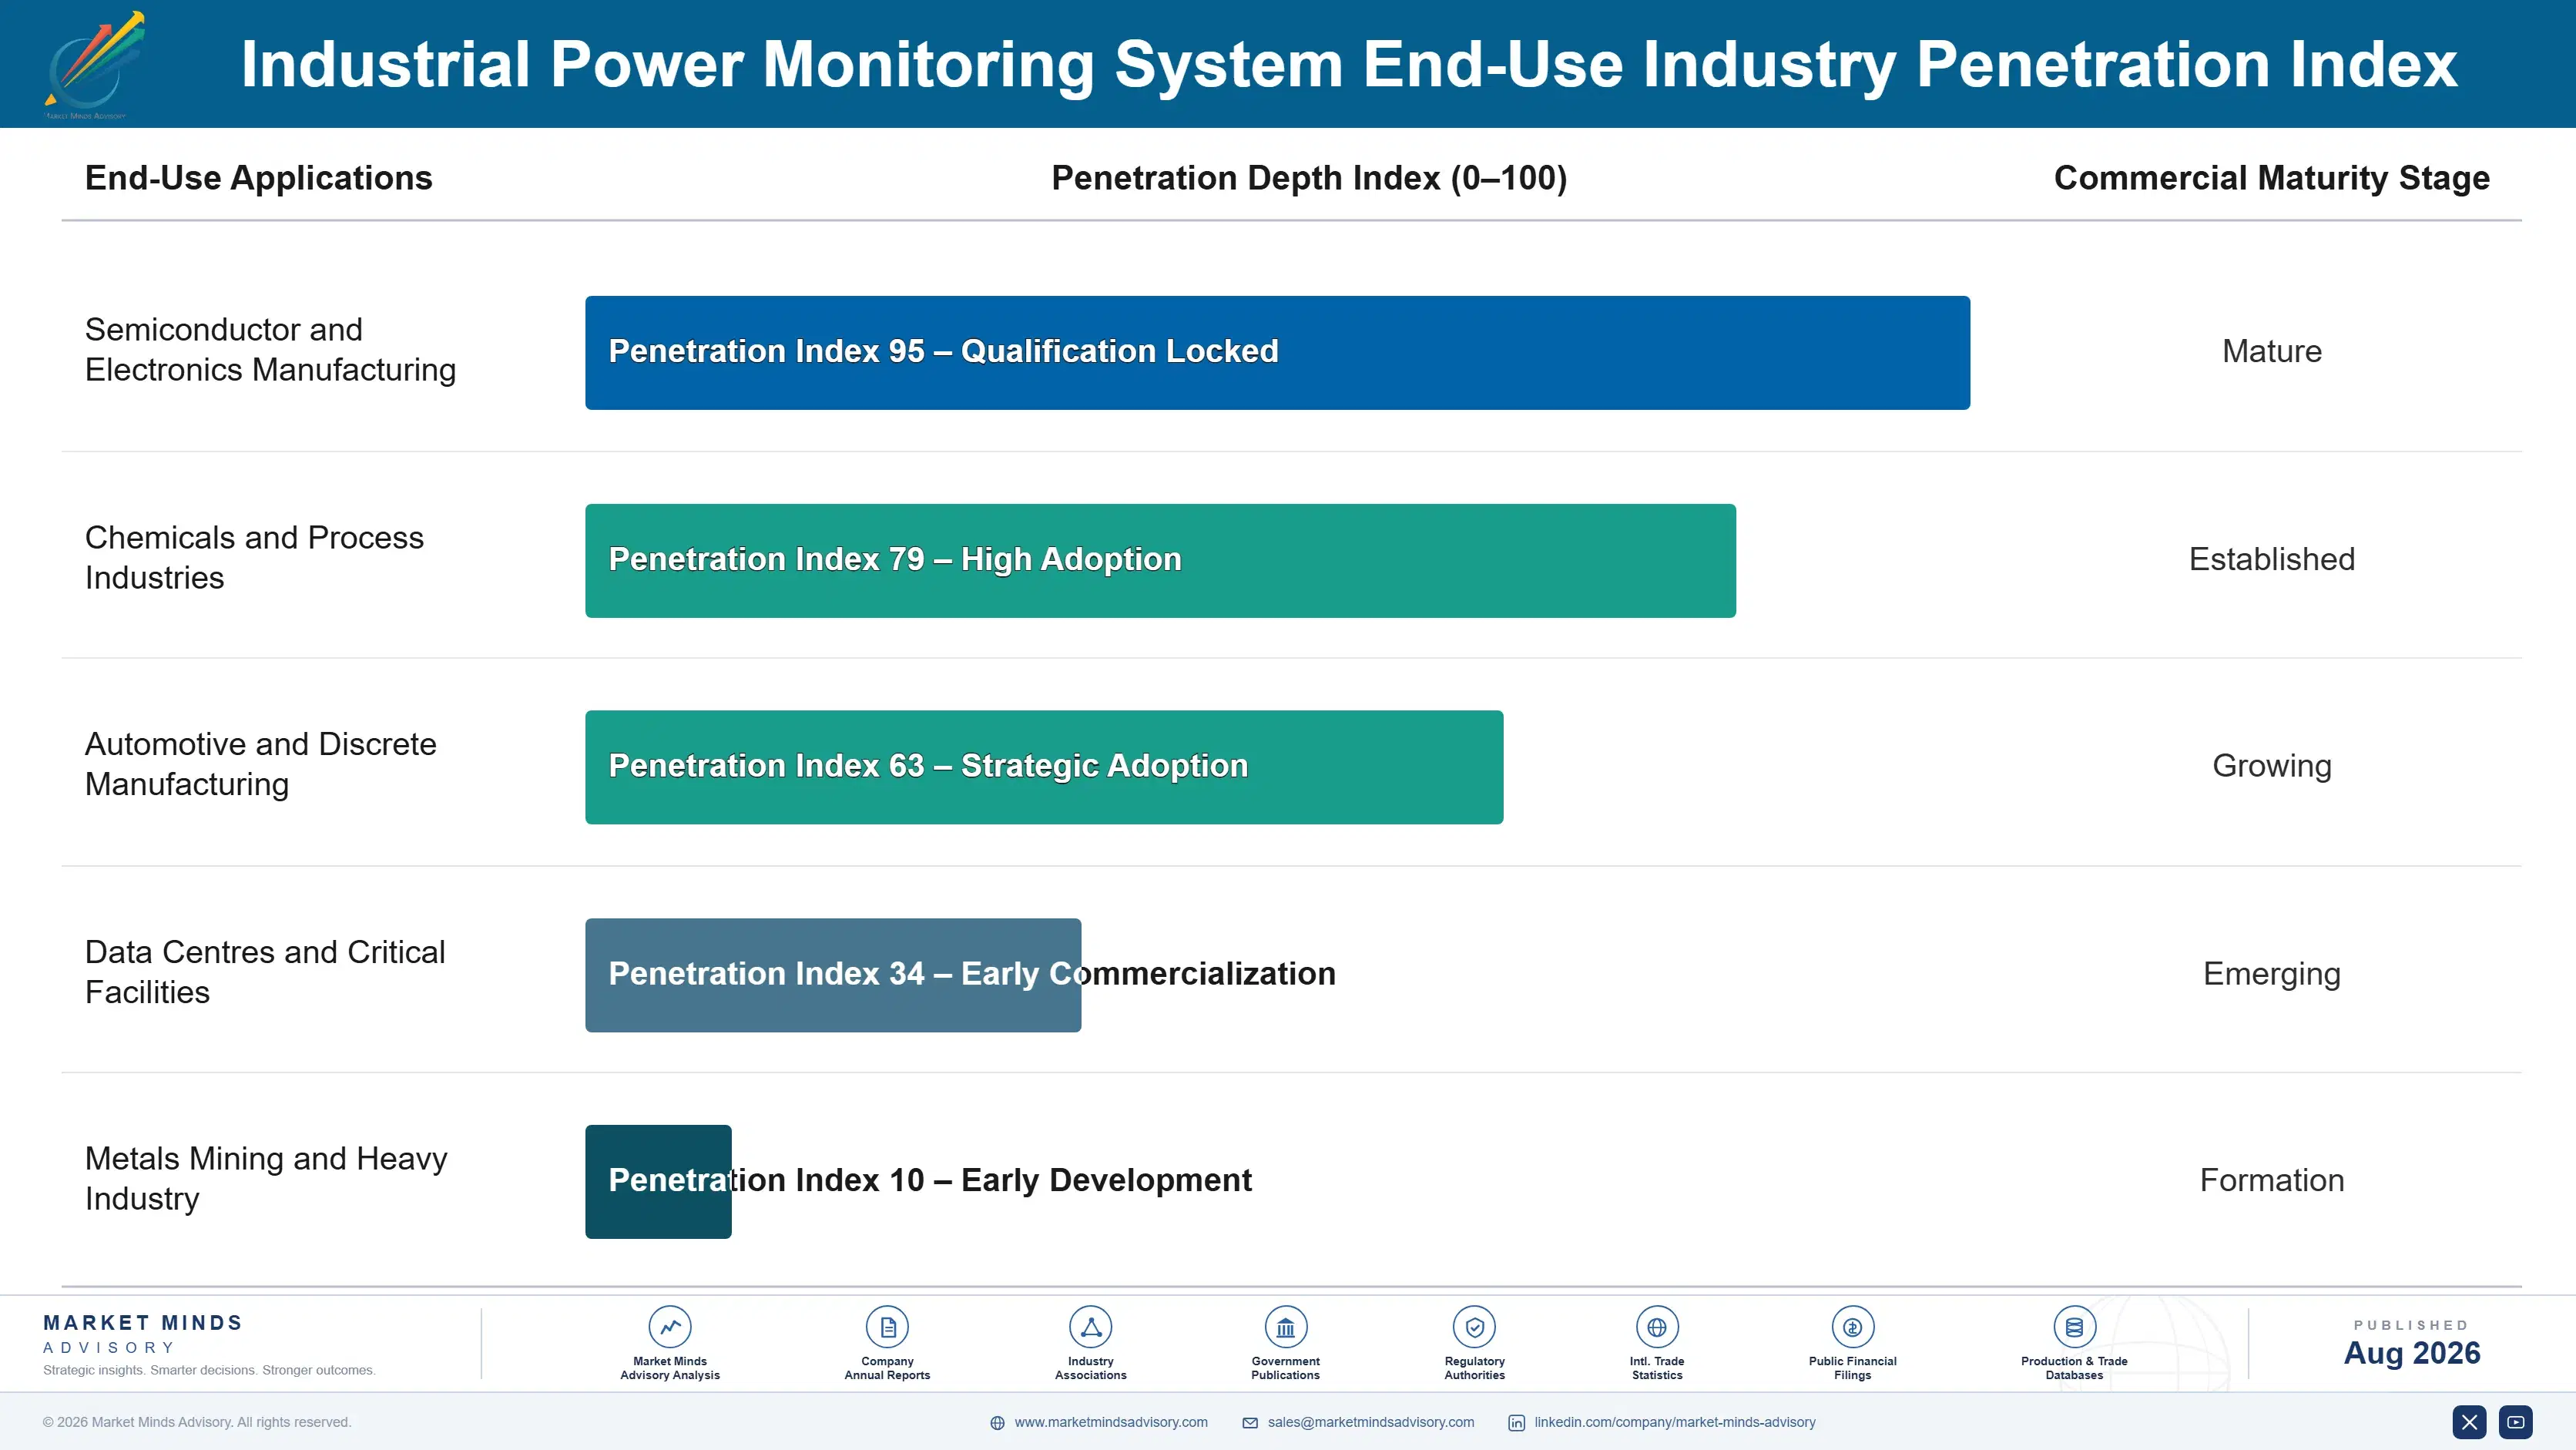
industrial-power-monitoring-system-market-end-use-penetration-index-1787334121434

Our Call On Power Monitoring

These are among the four positions where our research anticipates prominent divergence between winners and laggards over the coming forecast period. Each is grounded in the demand model, the regulatory perimeter, and the announced capacity pipeline.
01 / DEADLINE ATTACHMENT SELLING

Never present an efficiency payback again

A capital committee comparing a monitoring system against a production machine approves the machine every time, because one generates revenue and the other generates information, and typical efficiency payback here exceeds four years anyway. A disclosure filing deadline, an insurance renewal condition, or a flexibility programme registration date removes that comparison entirely and changes the question from whether to when. Suppliers tracking reporting obligations and underwriting requirements reach buyers already committed to acting rather than asking a committee to prefer them over output.
02 / ANALYSIS AS THE PRODUCT

Unwatched data is a failed installation

More than 60% of monitoring installations produce readings nobody examines between commissioning and the next incident, because deploying hardware is a project while analysing output is a permanent responsibility no facility ever assigned to anybody. A managed service reviewing the data and reporting exceptions converts an unwatched installation into a delivered outcome that recurs and generates the evidence justifying expansion. Suppliers treating software and service as an attachment to a hardware sale have the relationship precisely the wrong way round.
03 / FLEXIBILITY REVENUE ENABLEMENT

Make the meter earn rather than save

Grid operators pay industrial sites for demand reduction they can evidence at settlement intervals, and payments in developed markets reach around sixty thousand dollars a year for a substantial load, which funds the installation inside a single season. A facility without qualifying measurement cannot participate however flexible its process genuinely is. Framing monitoring as the entry requirement for a revenue stream rather than as an operating overhead changes which budget approves it and how quickly, which is worth more than any product improvement.
04 / PLATFORM INTEGRATION DISCIPLINE

Data outside the working system gets ignored

Measurement landing in a separate platform gets opened once and then forgotten, while the same data appearing inside the control or maintenance system an operator already uses becomes part of the working day and drives roughly 70% of repeat purchasing. Integration determines whether a system is used, and use determines whether anybody ever buys more of it. Supporting the protocols and data models a plant already runs costs engineering effort against no visible product feature, which is exactly why so many suppliers skip it.

Engagement Snapshot From the Field

A live engagement with an industry participant carrying material or product regulatory and market exposure ahead of a defining policy shift, showing how our research translates into a defensible multi-year portfolio strategy.
MARKET MINDS ADVISORY · CLIENT ENGAGEMENT SUMMARY
Industrial Power Monitoring System Producer Strategic Portfolio Review and Transition Roadmap 2026·Investment Scenario on Industrial Power Monitoring System Exposure Evaluation 2025-26
CLIENT PROFILE
A European industrial monitoring manufacturer with roughly USD 62 million in annual revenue engaged MMA after installed base growth failed to produce any repeat revenue (client-reported, unverified by MMA). The company had shipped monitoring hardware into several thousand facilities across a decade, and fewer than one in six had ever placed a second order of any kind.
STRATEGIC CHALLENGE
Sales wanted broader distribution to reach more first installations. Product management wanted higher sampling rates to compete on specification. Nobody had contacted the installed base to find out whether the systems were being used at all. The board needed a position before committing the next development budget, which could only be spent once.
MMA APPROACH
MMA contacted 150 facilities running the client's monitoring hardware and asked who looks at the output, how often, and what happens as a result. We compared repeat purchase rates against whether the data was integrated into an existing plant platform. We then modelled three routes: distribution expansion, a higher specification hardware programme, and a managed analysis service built on the installed base.
KEY FINDINGS
  1. At 71% of contacted sites nobody could name a person responsible for reviewing the monitoring output, and most had not opened it in over a year (client-reported, unverified by MMA).
  2. Sites where data was integrated into an existing control or maintenance platform placed repeat orders at several times the rate of those running it standalone.
  3. Higher sampling rates ranked last among the attributes customers said would make them buy again, ranking well behind reporting capability and platform integration.
  4. Distribution expansion modelled worst of the three routes, because it would only add more first installations into exactly the same pattern of non-use.
CLIENT PROFILE
A European industrial monitoring manufacturer with roughly USD 62 million in annual revenue engaged MMA after installed base growth failed to produce any repeat revenue (client-reported, unverified by MMA). The company had shipped monitoring hardware into several thousand facilities across a decade, and fewer than one in six had ever placed a second order of any kind.
STRATEGIC CHALLENGE
Sales wanted broader distribution to reach more first installations. Product management wanted higher sampling rates to compete on specification. Nobody had contacted the installed base to find out whether the systems were being used at all. The board needed a position before committing the next development budget, which could only be spent once.
MMA APPROACH
MMA contacted 150 facilities running the client's monitoring hardware and asked who looks at the output, how often, and what happens as a result. We compared repeat purchase rates against whether the data was integrated into an existing plant platform. We then modelled three routes: distribution expansion, a higher specification hardware programme, and a managed analysis service built on the installed base.
KEY FINDINGS
  1. At 71% of contacted sites nobody could name a person responsible for reviewing the monitoring output, and most had not opened it in over a year (client-reported, unverified by MMA).
  2. Sites where data was integrated into an existing control or maintenance platform placed repeat orders at several times the rate of those running it standalone.
  3. Higher sampling rates ranked last among the attributes customers said would make them buy again, ranking well behind reporting capability and platform integration.
  4. Distribution expansion modelled worst of the three routes, because it would only add more first installations into exactly the same pattern of non-use.
RECOMMENDED STRATEGY
Phase 1: Phase 1 (0 to 9 months): Halt the hardware specification programme and build integration connectors for the three most common plant platforms. Phase 2: Phase 2 (9 to 24 months): Launch a managed analysis subscription targeted at the existing installed base rather than at new sites. Phase 3: Phase 3 (24 to 40 months): Expand distribution only once repeat purchase rates confirm the retention problem is solved. Not before that.
OUTCOME
The board cancelled the sampling rate programme and funded integration work, which product management resisted and later conceded. Repeat order rates rose materially at sites where connectors were deployed, and the first managed analysis subscriptions have been signed (client-reported, unverified by MMA). Distribution expansion remains deferred behind the retention work.

Frequently Asked Questions

Foundational context covering the market sizes, CAGR, scope, country, region and competition that inform every finding below. This section is provided to cover basics and most often pre-purchase conversations, answered from the MMA Primary Research Dataset.

What is the current size of the Industrial Power Monitoring System Market?

The global market is valued at USD 4.1 billion in 2025, covering power quality, energy, condition, load, and emissions monitoring hardware and software in industrial facilities. Utility revenue metering and tenant billing are excluded.

How large will the Industrial Power Monitoring System Market be by 2036?

The market is forecast to reach USD 10.37 billion by 2036 in the base case, about 2.33 times the 2026 level. That represents incremental value of roughly USD 5.91 billion.

What is the CAGR for the Industrial Power Monitoring System Market 2026 to 2036?

The market grows at an 8.8% CAGR in the base case, with bull and bear scenarios at 10.1% and 7.5%. The spread turns on disclosure scope and on industrial capital spending.

Which segment is growing fastest?

Emissions and carbon reporting systems grow fastest at 15.4%, about 1.75 times the overall rate, because assured disclosure requires measured rather than estimated data. Power quality monitoring follows at 11.2%.

Who are the major companies in the Industrial Power Monitoring System Market?

Leading participants include Schneider Electric, Siemens, ABB, Eaton, and Rockwell Automation. Concentration sits at roughly 44%, held there by control system integration rather than by measurement capability.

Which country is growing fastest?

India grows fastest at an 11.8% CAGR, driven by manufacturing expansion, variable supply quality, and disclosure requirements imposed by export customers. China follows on policy-driven metering obligations.

Report Segmentation Architecture

The full report scope spans multiple orthogonal segmentation dimensions, with cross-tabulated demand data provided for each dimension pair. Coverage extends further to regional breakdowns, trend trajectories, and the competitive detail needed to support segment-level decision-making.

By Monitored Parameter Class

  • Emissions and Carbon Reporting Systems
  • Power Quality and Disturbance Monitoring
  • Asset Condition and Reliability Monitoring
  • Load and Capacity Monitoring
  • Energy Consumption and Cost Monitoring

By End-Use Industry

  • Semiconductor and Electronics Manufacturing
  • Chemicals and Process Industries
  • Automotive and Discrete Manufacturing
  • Data Centres and Critical Facilities
  • Metals Mining and Heavy Industry

By Sales Model

  • Direct Sale with System Integration
  • Systems Integrator and Panel Builder Channel
  • Managed Analysis Subscription
  • Industrial Distribution Channel

By Region

  • East Asia
  • North America
  • Western Europe
  • South Asia and Pacific
  • Latin America
  • Middle East and Africa
  • Eastern Europe

Scope, Methodology, and Coverage

Every figure in this report is reproducible from documented input assumptions. The scope below maps the historical period, the forecast horizon, the segmentation dimensions, and the countries covered, alongside the underlying primary and qualitative methodology.
Historical Period
2020 to 2025
Forecast Period
2026 to 2036
Base Year
2025 (USD billions; MMA Primary Research Dataset, August 2026)
Market Definition
The industrial power monitoring system market comprises the supply of hardware, software, and associated services measuring electrical consumption, power quality, supply reliability, and electrical asset condition within industrial and critical facilities, valued at supplier selling prices to end users, systems integrators, panel builders, and engineering contractors. It spans power quality analysers and disturbance recorders, energy monitoring meters and submetering panels deployed for operational rather than billing purposes, current and voltage sensing devices, protection and switchgear condition monitoring, communication gateways and data concentrators, and the analysis platforms, reporting software, and managed analysis subscriptions built on them. Utility revenue metering and national smart meter programmes, tenant billing submetering where the reading forms the basis of a charge between private parties, protective relays performing a protection function, process control and distributed control systems, electrical switchgear and distribution equipment itself, and general enterprise energy management software sold without measurement hardware are excluded. Electrical testing, thermographic survey, and power quality consultancy sold independently sit outside scope.
Quantitative Units
USD billions (current prices); volume in millions of monitoring points deployed
Segmentation Dimensions
By Monitored Parameter Class; By End-Use Industry; By Sales Model; By Region
Regions Covered
East Asia, North America, Western Europe, South Asia and Pacific, Latin America, Middle East and Africa, Eastern Europe
Countries Covered
China, Japan, South Korea, Taiwan, India, USA, Canada, Mexico, Germany, France, Italy, Spain, Netherlands, Sweden, Switzerland, UK, Australia, Singapore, Vietnam, Thailand, Indonesia, Malaysia, Brazil, Chile, Colombia, Argentina, Saudi Arabia, United Arab Emirates, Qatar, Egypt, South Africa, Turkey, Poland, Czechia, Slovakia, Hungary, Romania, and additional markets relevant to this sector
Key Companies Profiled
Schneider Electric, Siemens, ABB, Eaton, Rockwell Automation, Honeywell, Emerson, Yokogawa, Mitsubishi Electric, Hitachi, Fluke, Janitza electronics, Socomec, Accuenergy, Dranetz, Elspec, Powerside, Carlo Gavazzi, Phoenix Contact, Legrand
Quantitative Methodology
Primary survey, n=3,800 respondents, Q4 2025, six countries; demand-side model with trade association cross-validation
Qualitative Methodology
47 expert interviews, Q4 2025; applied to validate demand model assumptions, identify emerging dynamics, and assess competitive positioning
Report Format
PDF and XLSX data workbook (Word format preview document)
Publisher
Market Minds Advisory
Report Code
MMA-2026-TEC-540
Published
August 2026
Contact
sales@marketmindsadvisory.com | www.marketmindsadvisory.com

Purchase the full Industrial Power Monitoring System Market Report (2026 to 2036).

The full MMA Industrial Power Monitoring System report sizes the market across five monitored parameter classes, five end-use industries, four sales models, and seven regions through 2036. It profiles 20 participants on a consistent basis of monitoring hardware, software, and service revenue, scoring each on control platform integration, compliance data handling, flexibility programme capability, and managed analysis depth. Scenario models quantify how disclosure obligations, grid reliability, and flexibility payments move both volume and achievable margin. The report also includes disclosure obligation mapping by jurisdiction and company size, flexibility programme requirements by market, installation utilisation assessment, and integration coverage benchmarking by supplier.
Five-parameter and four-channel market sizing to 2036
Twenty-participant benchmark on monitoring hardware and software revenue
Disclosure obligation mapping by jurisdiction and company size
Flexibility programme requirements and payment levels by market
Installation utilisation assessment across the deployed base
Control platform integration coverage benchmarking by supplier

Built For The People Who Decide

From boardroom strategy to bench-side execution, this report is read cover-to-cover by leaders shaping the next decade of their industry, turning demand scenarios, market dynamics and valuation benchmarks into decisions.
CXOs/ Presidents/ VPs/ Managers
M&A and Corporate Development
Strategy Teams and R&D Heads
Procurement and Product Directors
Regulatory and Compliance Leaders
Investor Relations and Equity Analysts