Market Minds Advisory
Industrial Marking Equipment Market

Industrial Marking Equipment Market: Compliance Marks, Laser Substitution, And A Consumables Annuity Being Engineered Away

A coding printer earns four thousand dollars of ink a year forever. A fiber laser earns nothing after the sale. The industry is engineering away its own annuity and calling it progress.

Lead Analyst

David Horsley

Published

September 2026

Make Smarter Decisions with Customized Research Insights

Request a free sample report and evaluate market opportunities, growth trends, and competitive dynamics relevant to your business needs.

2025 MARKET VALUE$5.4BMarket Size 2025
2036 FORECAST VALUE$10.7BBase Case , 2026 to 2036
CAGR 2026 TO 20366.4 %Bull 7.6% / Bear 5.1%
INCREMENTAL OPPORTUNITY$4.9BNet 10- year value creation
EXPANSION MULTIPLE1.86x2036 value over 2026 base
Strategic Levers
M&A Pipeline
Regional Outlook
Country Rankings
Competitive Intelligence
Segmental Deep-dive
Call-Us : 91 93563 13602

Executive Snapshot and Market Trajectory

Marking used to be a cost line and is now a compliance obligation, which changed who signs the order and how much they will pay. Serialisation rules put a permanent unique mark on the item itself. The market reaches USD 5.4 billion in 2025 and grows at 6.4%.
UV and green laser systems grow fastest at 12.6%, about 1.97 times the market rate, because they mark heat-sensitive plastics, glass, and medical polymers that fiber lasers scorch. East Asia and North America each hold 27% of value, the first as manufacturing base and the second as the strictest regulatory market. Western Europe follows at 24% on pharmaceutical and medical device serialisation. Regional weight follows regulation rather more than manufacturing output does.
Concentration sits at 47%, lower than it was a decade ago, because laser entrants reached the market without needing the service network that inkjet demands. Consumables carry 39% of revenue, and that is the number under threat: every laser placement removes an ink stream permanently. The suppliers handling this well are selling laser and taking the margin hit deliberately. Those defending ink are losing the installed base instead.
Market Definition
The industrial marking equipment market covers systems that apply permanent or durable identification directly onto a product, component, or its primary packaging, together with the inks, fluids, ribbons, and consumables those systems require. It spans laser, inkjet, thermal transfer, mechanical, and electrochemical marking. Label printing and print-and-apply labelling machines, barcode readers, vision inspection, and RFID equipment are excluded.
Base Year Value
$5.4B in 2025 (MMA Primary Research Dataset, August 2026)
Forecast Period
2026 to 2036, eleven discrete annual values
CAGR
6.4% base case. Bull 7.6%. Bear 5.1%.
Fastest Growth Segment
UV and Green Laser Marking Systems: 12.6% CAGR
Fastest Growth Country
India: 9.2% CAGR
Fastest Growth Region
South Asia and Pacific: 8.5% CAGR
Largest Region
North America: 27% of 2025 global value
Market Leaders
Danaher, Dover, Domino Printing Sciences, Brady Corporation, Han's Laser. Source: MMA Primary Research Dataset, July 2026.
Primary Survey
n=3,800 procurement and R&D decision-makers, Q4 2025, six countries
Methodology
Demand-side build-up, cross-validated against public data, 47 expert interviews

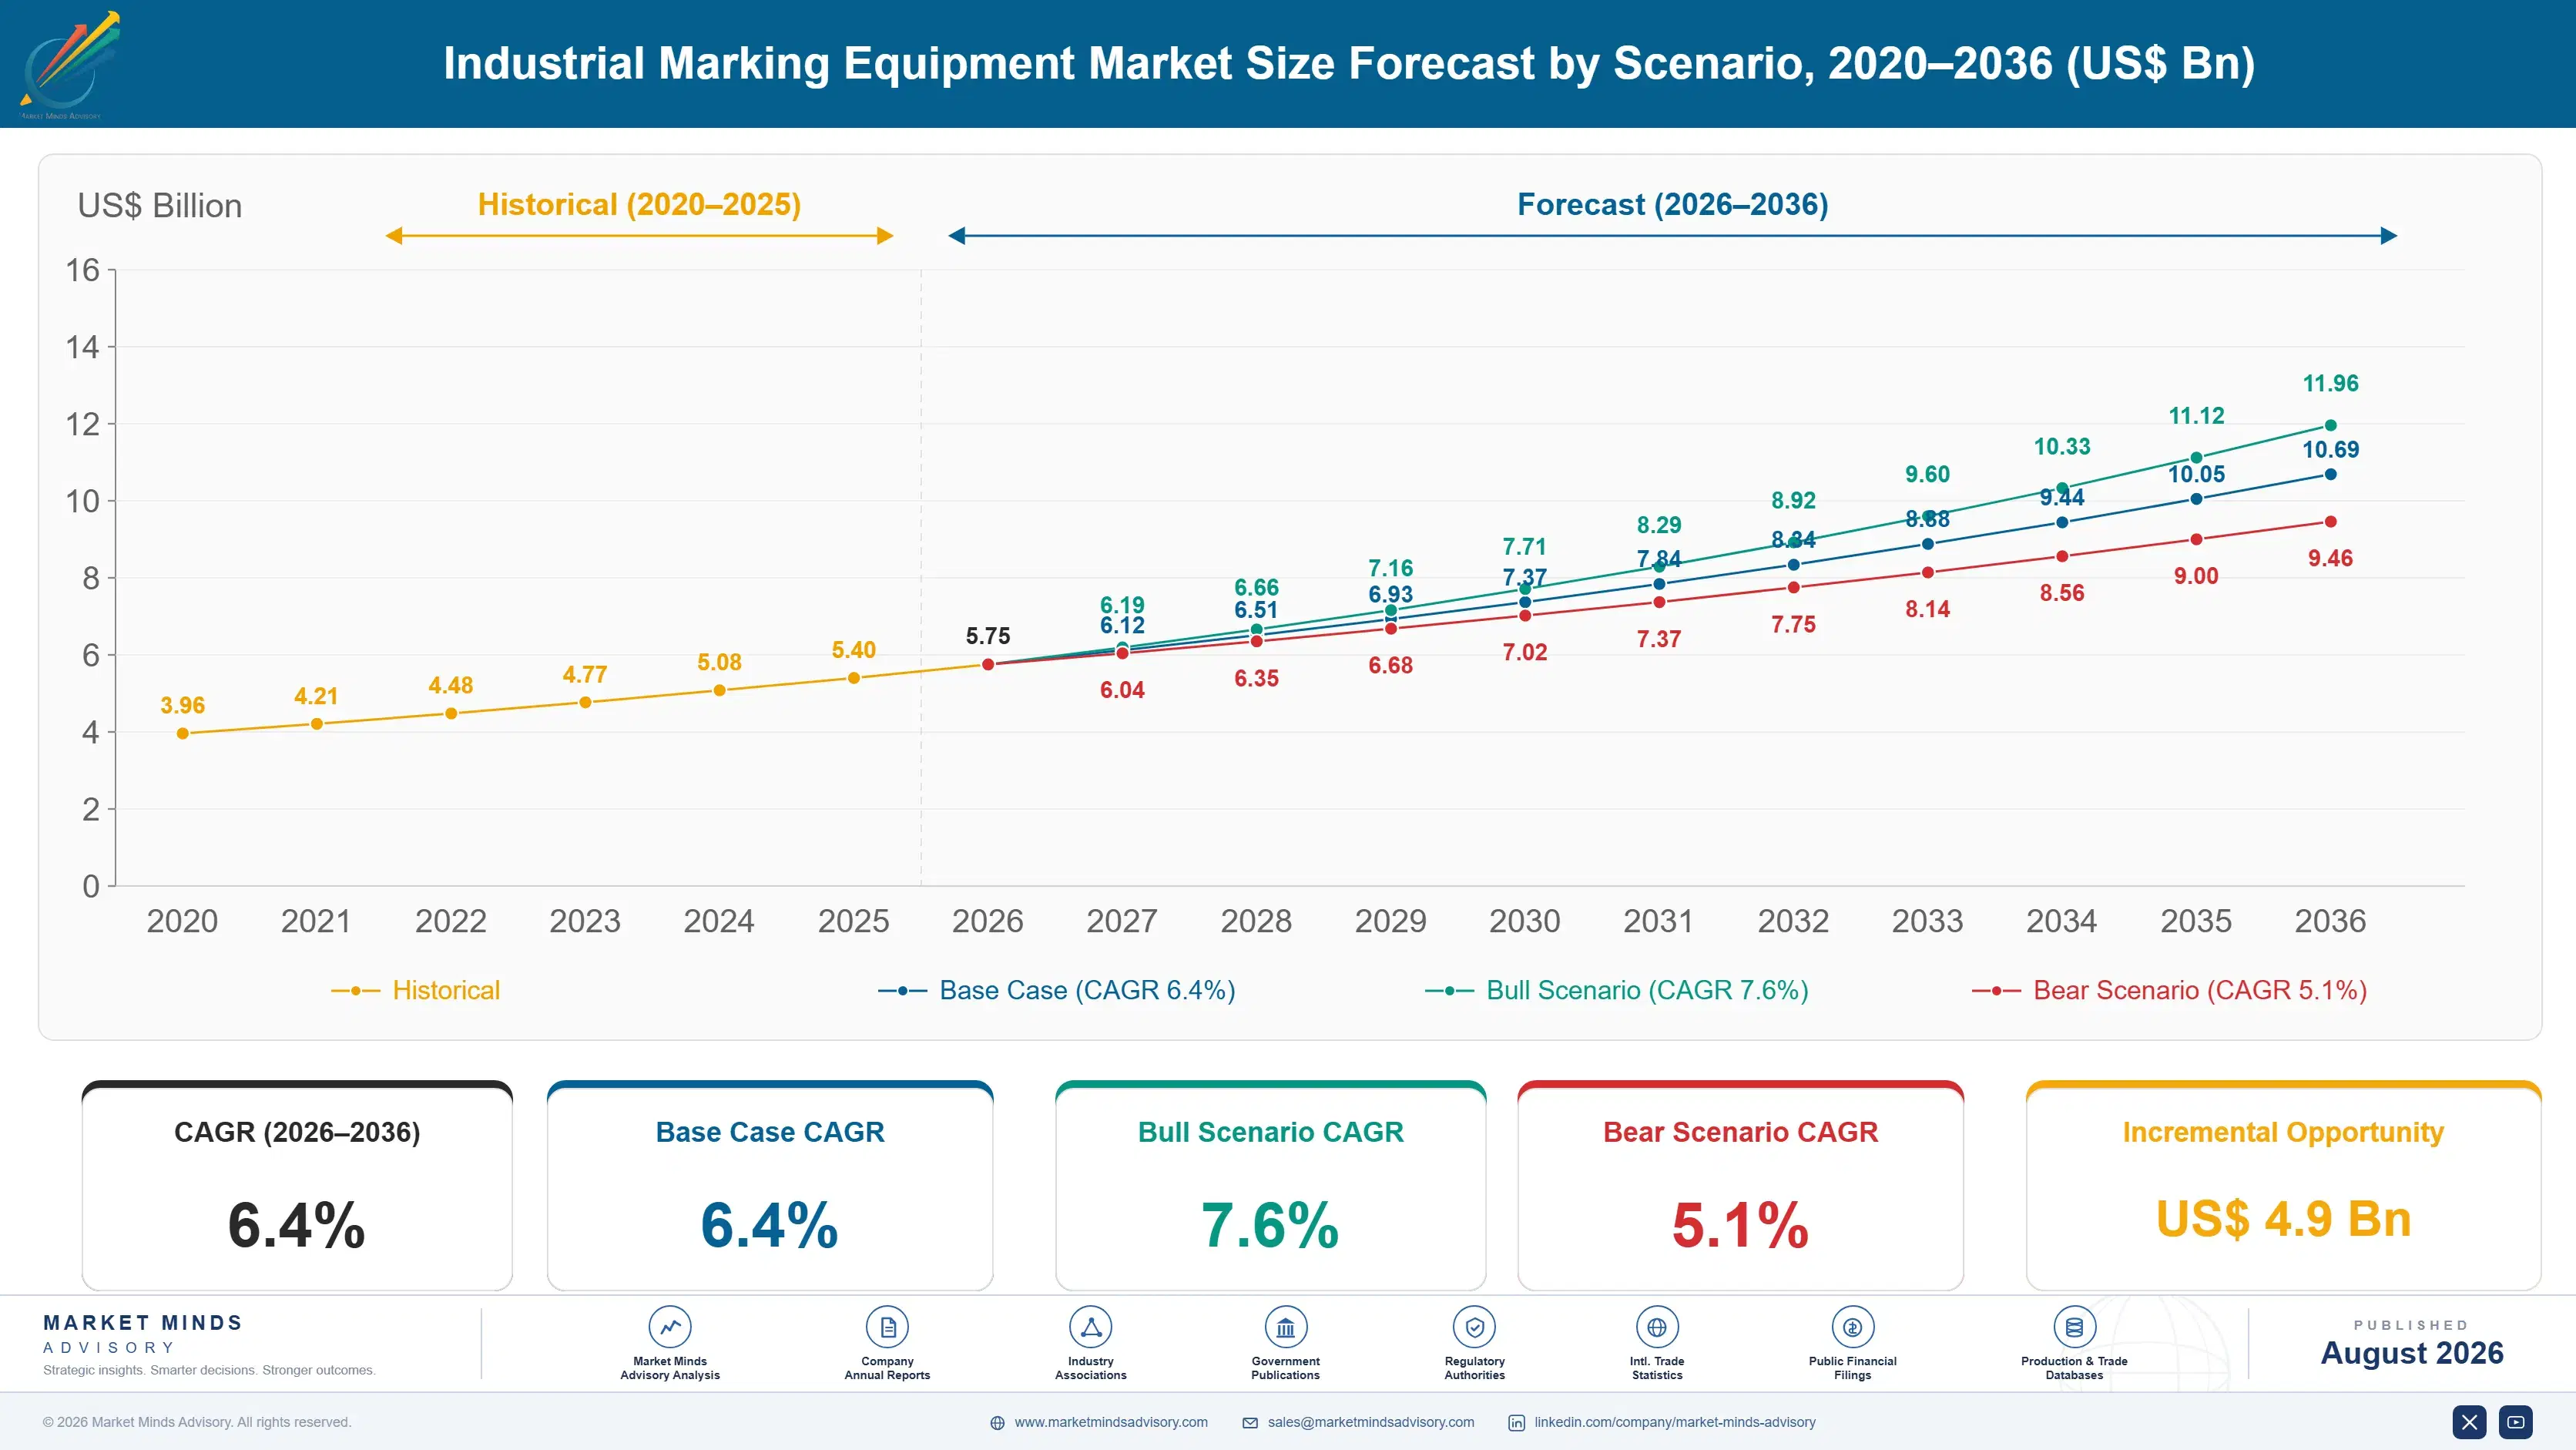
Industrial Marking Equipment Market Forecast Scenarios

industrial-marking-equipment-market-size-forecast-scenario-1787332592458
Two things happened between 2020 and 2025 and they pulled in opposite directions. Serialisation mandates in pharmaceuticals, medical devices, and food traceability drove installations upward across every developed market. At the same time fiber laser prices fell far enough that the technology reached applications inkjet had held for thirty years. A 5.3% historical CAGR nets those movements out and conceals both of them completely.
Three mechanisms carry the 6.4% base case. The EU Digital Product Passport requires a unique machine-readable identifier on batteries from 2027 and on textiles and electronics through 2030, which puts a marking system on lines that never had one. Medical device UDI enforcement keeps widening, and a UDI must survive sterilisation, which rules out most inks. And laser price decline keeps opening applications where the mark was previously applied by label or not applied at all.
The 7.6% bull case turns on Digital Product Passport scope extending faster than the current timetable, which would put marking equipment onto entire industries at once. The 5.1% bear case is laser substitution running ahead of new demand, since a laser placement adds equipment revenue once and destroys consumables revenue forever. Suppliers can lose money growing units in this market.

The Mark Became A Legal Requirement

Ten years ago a production manager bought a coder because the customer wanted a date on the box. Now a regulatory affairs team specifies a unique identifier that must survive autoclaving, remain readable for a decade, and resolve to a database entry. That is a different purchase with a different buyer, and it explains why blended selling price sits at USD 16,400 in a category that used to sell twelve thousand dollar printers.
TOP FIVE CONCENTRATION47%Laser entrants have broadened participation beyond the coding majors
AVERAGE SELLING PRICEUSD 16,400Blended across laser, inkjet, and mechanical marking systems
CONSUMABLES REVENUE SHARE39%Inks, fluids, and ribbons sold across an installed printer base
LASER INSTALL SHARE44%Portion of new system placements using a laser source
REPLACEMENT CYCLE LENGTH7 to 10 yearsInterval between system installation and economic replacement decision
LEADING PRODUCER SHARE38%Manufacturing concentrates where laser source supply is cheapest
Consumables carry 39% of category revenue, which for three decades was the whole commercial model: place the printer near cost, sell ink and makeup fluid forever. Laser breaks it. A fiber system now takes 44% of new placements and consumes nothing but electricity, so every laser sold is an ink stream that ends. Suppliers built around consumables margin are cannibalising themselves with their own fastest-growing product line.
Replacement runs on a seven to ten year cycle, though the driver has changed. Inkjet printers were replaced when the printhead wore out. Laser systems get replaced when a regulation changes the required mark, which is a schedule set in Brussels rather than on the shop floor. That shift makes demand more predictable and less controllable at the same time.
"Every laser this industry sells kills an ink contract that would have run for a decade. The sales teams are compensated on the laser and the profit line is carried by the ink. Nobody has resolved that argument yet, and the ones who do first will own the next ten years."
Principal Analyst, Industrial Identification Practice · MMA Construction and Ind

Market Trends

Digital Product Passport Puts Marks On New Industries

The EU Digital Product Passport requires a unique machine-readable identifier carrying product data, starting with batteries in 2027 and extending to textiles, electronics, and construction products through 2030. Each of those industries contains manufacturers who have never installed marking equipment because nothing required it. A battery cell, a garment, or a window frame now needs a durable identifier applied in production and resolvable to a database years later. That is a first-time installation rather than a replacement, and it is the largest source of genuinely new demand this category has seen in twenty years.
Market Impact: Marks survive 134 degree autoclavin

Fiber Laser Pricing Collapsed The Inkjet Cost Advantage

A fiber laser marker that cost sixty thousand dollars in 2012 costs a fraction of that now, because Chinese source manufacturers took the price of the laser module down by an order of magnitude. Total cost of ownership crossed over some years ago: a continuous inkjet printer consumes roughly four thousand dollars of ink and makeup fluid annually, where a laser consumes electricity. Lasers now take 44% of new placements and the share climbs each year. The switch is permanent, since nobody who removed a solvent from their plant ever puts it back.
Market Impact: Item-level codes carry 4 data field

Market Opportunities and Growth Drivers

Medical Device UDI Enforcement Rules Out Inkjet Marking

A unique device identifier must remain legible through the product's life, which for a reusable surgical instrument means hundreds of autoclave cycles at 134 degrees Celsius. No ink survives that. Regulators across the United States, European Union, and increasingly Asia require direct part marking on reusable devices, which forces laser or electrochemical etching and eliminates the cheaper option entirely. The compliance deadline rather than any production benefit drives the purchase, so price sensitivity is unusually low. Manufacturers who delayed are now buying under time pressure at whatever the supplier quotes. Deadline buying carries the best margin here.
Market Impact: Removes 39% consumables revenue str

Food Traceability Rules Widen Required Coding Detail

Lot-level date coding satisfied food regulation for decades. Recall traceability requirements now push toward item-level codes carrying batch, line, and time data, so a recall can be scoped to one shift rather than one week of production. The commercial argument is straightforward: a narrower recall costs a fraction of a broad one, and processors who have lived through a broad recall need no persuading at all. That converts coding from a labelling formality into a risk control the quality director owns and funds. One avoided recall pays for an entire coding line.
Market Impact: Source cost down 80% since 2012

Market Restraints and Challenges

Laser Adoption Destroys The Consumables Annuity Permanently

Consumables carry 39% of category revenue and considerably more of its profit, because ink and makeup fluid sell at margins hardware never approaches. Every fiber laser placed removes that stream for the seven to ten year life of the installation. The root cause is that the industry's own product development solved a customer problem the business model depended on. Commercially it means unit growth and profit growth have decoupled. Suppliers are mitigating with service contracts, software subscriptions, and marking-as-a-service pricing, none of which yet replaces what ink delivered. That gap is the central problem in this industry.
Market Impact: Battery passports required from 202

Chinese Laser Sources Compress Hardware Margin Everywhere

Fiber laser sources from Chinese manufacturers now cost a fraction of what Western modules did a decade ago, and the marking head around them is a mechanical assembly with limited protectable content. The root cause is that laser source manufacturing scaled enormously for cutting and welding applications, and marking inherited the cost curve. Commercially this puts hardware margin under permanent pressure while the consumables offset disappears at the same time. Suppliers are mitigating by selling application engineering, validation documentation, and regulatory support rather than the machine itself. Two margin pools shrinking at once is unusual.
Market Impact: Lasers take 44% of placements
4 additional market trends, 3 additional growth drivers, and 2 additional restraints and challenges are covered in the full report. Contact sales@marketmindsadvisory.com to access the complete intelligence.

Segment CAGR and Growth Architecture

Segmentation follows marking technology, meaning the physical mechanism that creates the mark, because that determines substrate compatibility, permanence, consumables requirement, and the regulatory approvals a mark can satisfy. Application industry, code content, and integration format are handled in the framework and commentary, since each cuts across every technology rather than defining one. Nothing else divides the market so usefully.
industrial-marking-equipment-market-market-share-analysis-1787332592988

UV and Green Laser Marking Systems

UV and green lasers grow fastest at 12.6%, about 1.97 times the market rate, because they mark materials that fiber lasers damage. A shorter wavelength couples into the material through a cold process rather than by melting it, which lets a system mark clear plastic, glass, silicon wafers, and medical polymers without heat distortion or discolouration. Medical device housings, pharmaceutical primary packaging, and electronic components are the three applications driving volume. Source cost remains several times a fiber laser's, and that gap is the only thing keeping the technology out of general industrial work. It closes a little every year. Substrate compatibility rather than price is what actually sells these systems.
CAGR 12.6%

Fiber Laser Marking Systems

Fiber lasers grow at 9.8% and now take the largest share of new placements, having displaced inkjet across metal parts, coated surfaces, and most rigid packaging. The economics settled the argument: no ink, no makeup fluid, no solvent handling, no printhead service, against a purchase price that fell by roughly an order of magnitude over a decade as Chinese source manufacturing scaled. Direct part marking for medical device and aerospace traceability sits almost entirely here, since a laser mark survives sterilisation and paint. The constraint is substrate, because fiber wavelengths scorch clear plastics and glass rather than marking them cleanly. Every placement here is also an ink contract that quietly ends.
CAGR 9.8%
Full segment breakdown across 7 segments available in the complete report.

Regional Architecture and Country Demand Map

Regional shares track two different things at once: where products are manufactured, and where the regulator requires them to be marked. East Asia supplies the first, North America and Western Europe the second, and the two rarely coincide on the same production line. Growth follows regulation.

North America

North America holds 27% of value, and the driver is regulatory rather than industrial. FDA unique device identification enforcement covers a very large medical device manufacturing base, and direct part marking on reusable instruments is now routine rather than exceptional. Food traceability rules push item-level coding through processing plants that previously date-coded by lot. Aerospace and defence part marking adds a smaller but high-specification stream where traceability requirements run to decades. Growth at 6.2% sits slightly below the global rate because the installed base is already large and much of the demand is replacement rather than first installation. Mexican contract manufacturing adds a steadily growing share on the same regulatory rules.
Share: 27% | CAGR: 6.2% (2026 to 2036)

Western Europe

Regulation writes the demand curve in Western Europe more explicitly than anywhere. Falsified Medicines Directive serialisation already put unique codes on every pharmaceutical pack, and the Digital Product Passport now extends the same logic to batteries, textiles, electronics, and construction products on a published timetable. German industrial manufacturing and Swiss and Irish pharmaceutical production carry most of the installed base. Growth at 5.2% trails the global rate because the pharmaceutical installations are already made and the new passport demand has not yet converted to orders. It will, and the timetable is public. Suppliers who read the legislation carefully already know roughly where those orders will land and when they arrive.
Share: 24% | CAGR: 5.2% (2026 to 2036)
Regional intelligence for 5 additional markets available in the complete report: East Asia, South Asia and Pacific, Latin America, Middle East and Africa, Eastern Europe. Contact sales@marketmindsadvisory.com.
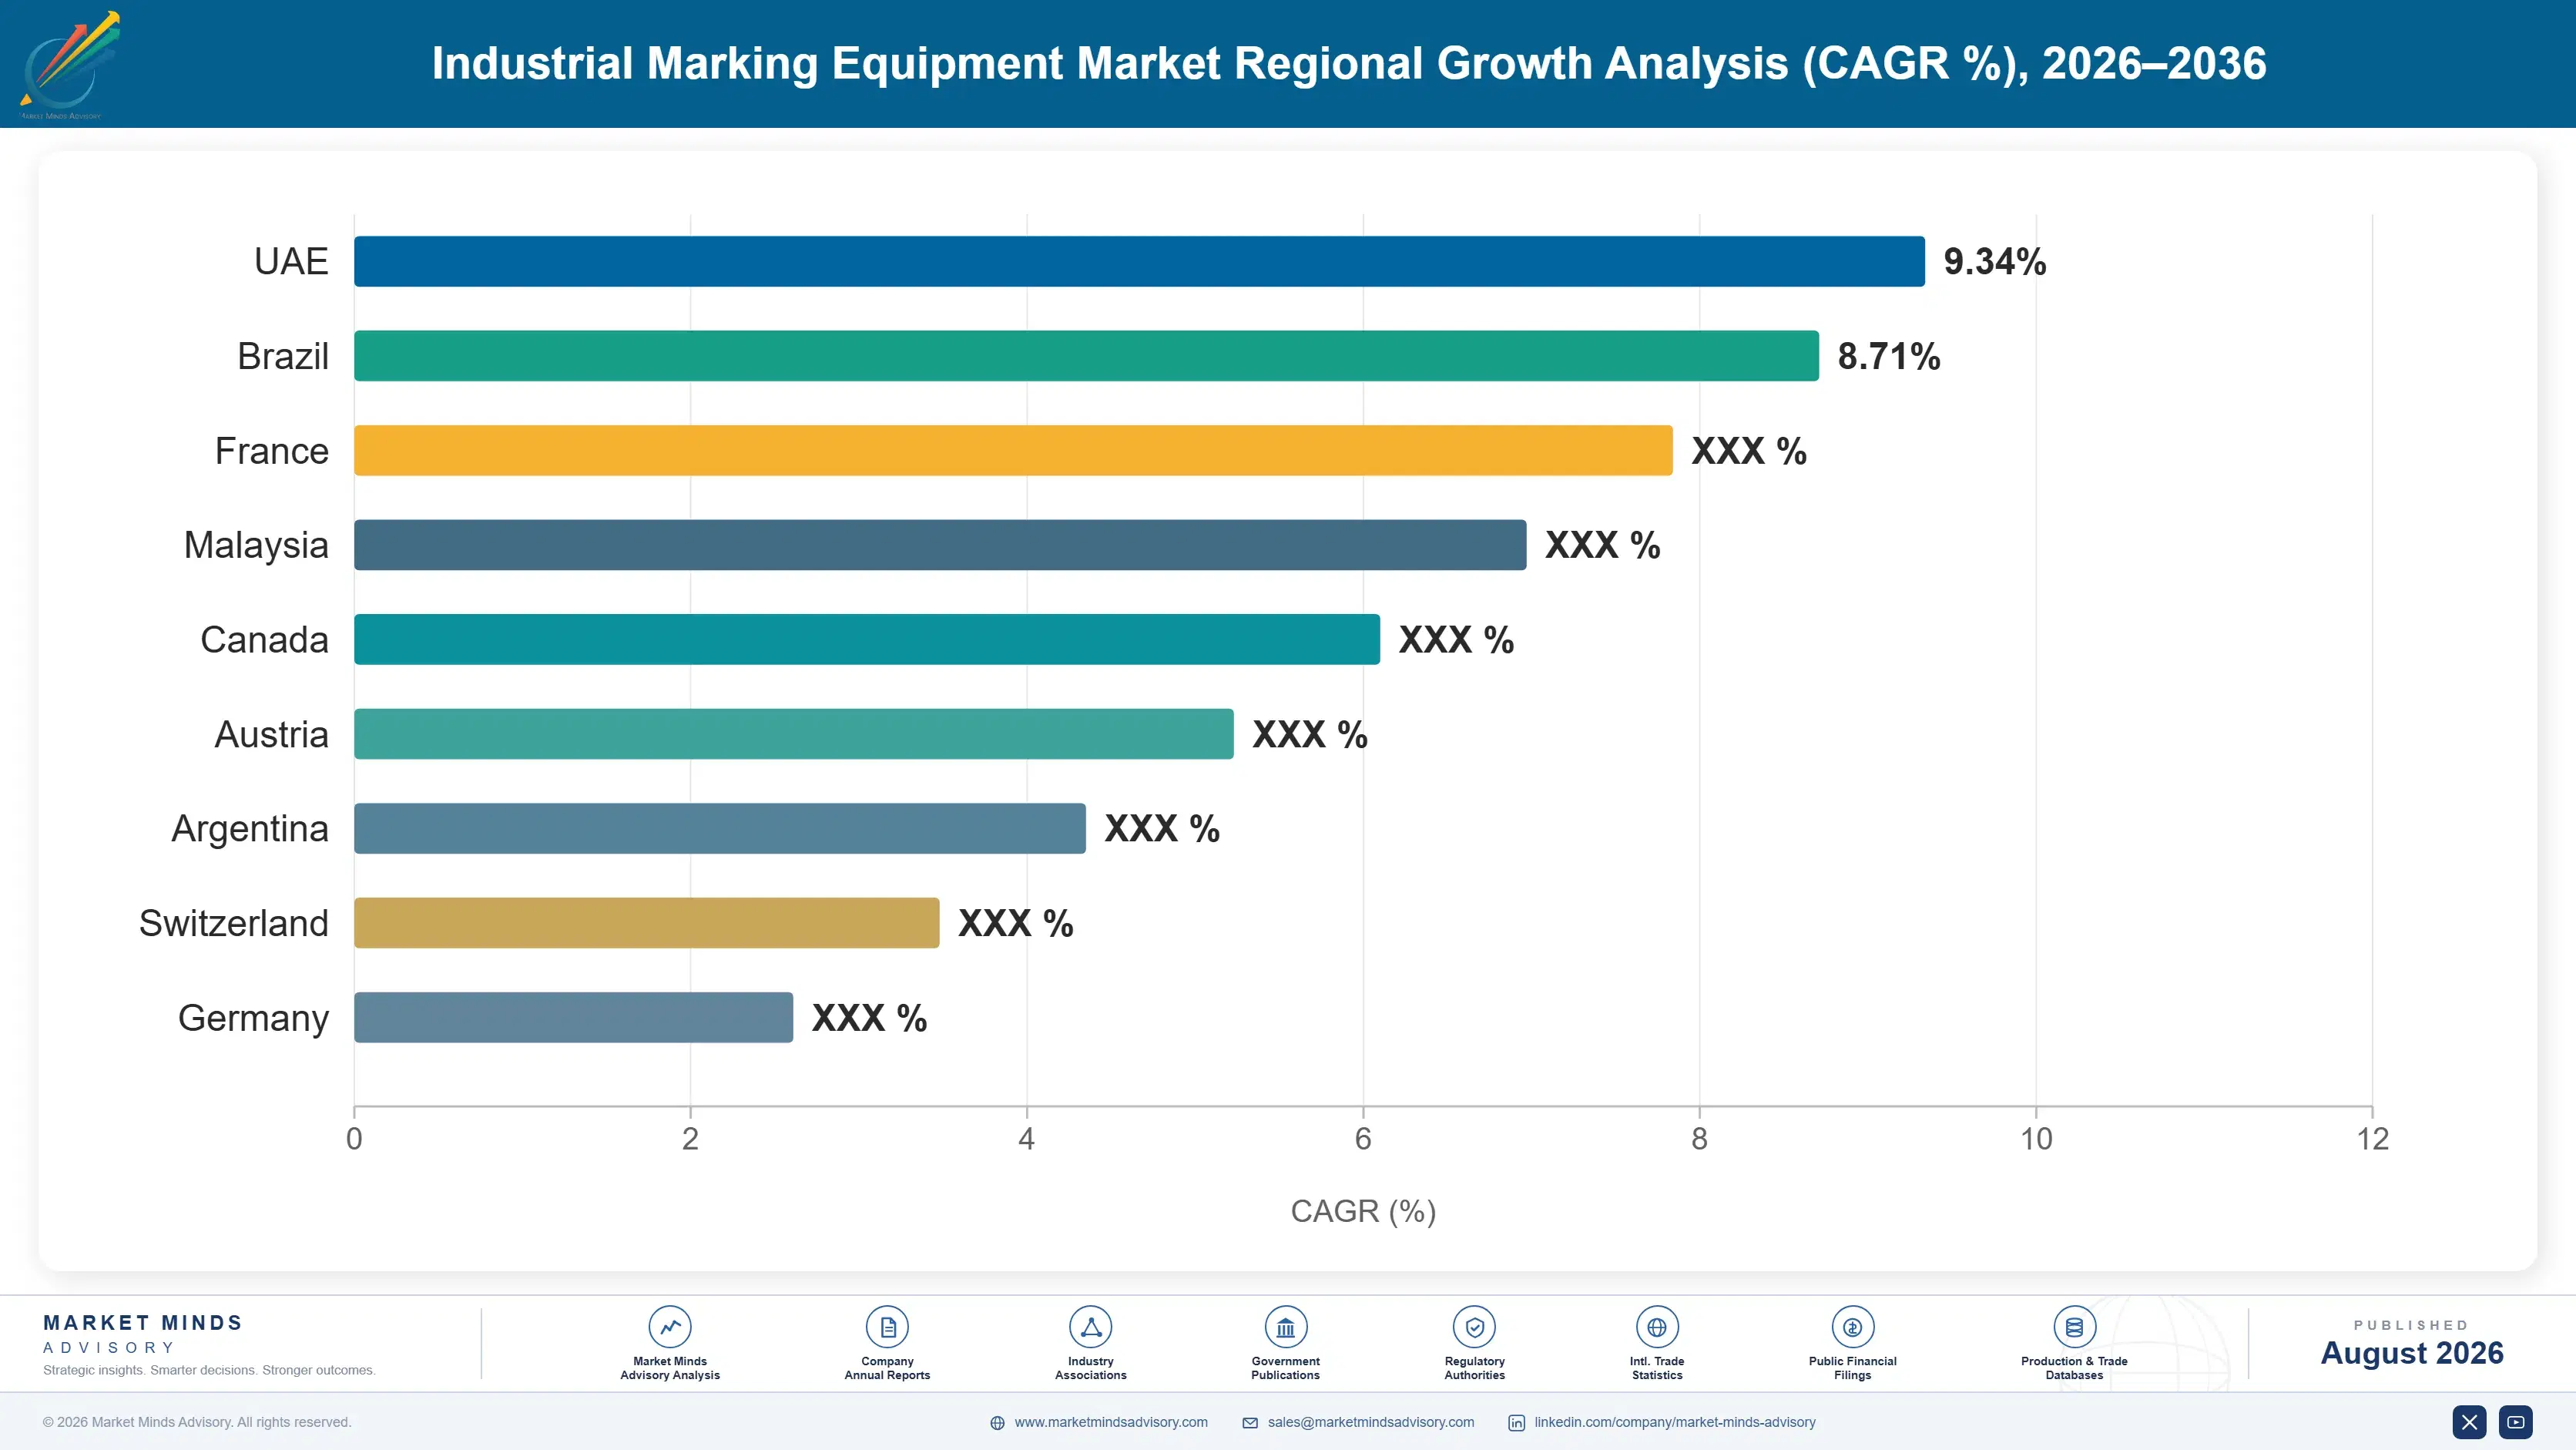
industrial-marking-equipment-market-country-cagr-analysis-1787332593499

Where Marking Margin Now Comes From

Four levers matter, and pricing the machine is not among them. Replacing the consumables annuity, selling regulatory validation, reaching first-time industries early, and holding application engineering depth decide who survives the laser transition. A supplier defending ink volume while its own laser range grows is running two strategies that cancel each other out. Somebody has to choose.

Rebuild The Annuity Around Software, Not Ink

Consumables deliver 39% of category revenue and disappear with every laser placed, so the annuity has to be rebuilt somewhere else or the business shrinks while units grow. Code management software, serialisation databases, and regulatory validation support all recur, all attach to the installation, and all carry software margin rather than fluid margin. A subscription at eight hundred dollars a year across a large installed base replaces a meaningful share of what ink delivered. Suppliers who started this five years ago are comfortable. Those who have not started are running out of time.
Market Impact: Subscription recovers part of the l

Sell Validation Documentation, Not Marking Specifications

A pharmaceutical or medical device manufacturer buying a marking system is buying an audit trail, and the machine is the least difficult part of it. Installation qualification, operational qualification, performance qualification, and the documentation package behind them take 3 to 6 weeks of specialist work the customer cannot do alone. Suppliers who provide it charge for it and win accounts on it, because a validated system that passes inspection is worth several times a cheaper one that stalls an audit for a month. Competitors quoting hardware against that are not in the same conversation.
Market Impact: Validation packages take 3 to 6 spe

Reach Passport Industries Before They Know They Need Marking

Battery, textile, and construction product manufacturers face Digital Product Passport requirements between 2027 and 2030, and most of them have never installed a marking system because nothing required one. They will not run a competitive tender, because they do not yet know what to specify. A supplier arriving early with an application study and a compliance timeline becomes the default rather than one of three quotes. The window closes once the first installations are made and a standard practice emerges, which happens quickly in every industry. Being first is worth more than being cheapest here.
Market Impact: Passport rules land across 2027 to

Price Laser On The Ink It Replaces

A customer comparing a twelve thousand dollar inkjet printer against an eighteen thousand dollar fiber laser is looking at the wrong number, and it is the supplier's job to say so. Four thousand dollars of annual ink and makeup fluid across a seven year life is USD 28,000 the laser does not consume. Presenting that arithmetic converts a price objection into an obvious decision and lets the supplier hold laser pricing rather than discounting into the comparison. Most sales teams still lead with the machine price because that is the number on the quote.
Market Impact: Saves about USD 28,000 in fluid acr

Who Controls the Margin Pool

Concentration sits at 47% for the top five, lower than a decade ago because laser entrants reached this market without building the service network that inkjet always demanded. The gap between leaders and challengers is validation capability and regulatory support rather than marking performance, which converged years ago. All participants here are assessed on one basis, revenue from industrial marking equipment and the dedicated consumables sold against it.
Competition runs on four dimensions. Validation and regulatory documentation decides regulated-industry accounts, where the machine matters least. Substrate capability decides technology selection, since a fiber laser cannot mark clear plastic and a UV system costs several times more. Consumables position decides profitability rather than share. Price decides general industrial work, and Chinese laser manufacturers set that level for everybody else.

Two pressures will move rankings. The coding majors carry large consumables businesses that laser adoption is dismantling, which makes an aggressive laser push a decision to shrink their own profit deliberately. Chinese laser manufacturers carry no such constraint and no validation capability either. Positions favour whoever combines laser breadth with regulatory documentation depth, and the firms holding both are also the ones with the most ink revenue to lose.
industrial-marking-equipment-market-company-positioning-matrix-1787332594018

Competitive Moat and Risk Dimensions

DANAHER

Moat: Videojet installed base and service

Danaher's Videojet, Linx, and Foba lines hold one of the largest installed bases in coding and marking, and the service organisation behind it reaches production sites in territories most competitors do not staff. That reach matters because a stopped line costs more per hour than the printer did. Validation capability for regulated industries is a further edge few can match.
DANAHER

Risk: Consumables exposure to laser

A very large share of Danaher's marking profit comes from ink and makeup fluid sold against an inkjet installed base that laser is steadily replacing. Every fiber laser the company sells removes one of its own consumables streams for a decade. Managing that transition without losing share to laser competitors or destroying margin early is the hardest problem here.
DOVER

Moat: Markem-Imaje regulated industry depth

Markem-Imaje holds unusually deep positions in pharmaceutical and medical device marking, where validation documentation and regulatory support decide accounts rather than machine specification. That work takes years to build credibility in and cannot be bought. Serialisation software and code management capability sit alongside the hardware, which makes displacement expensive for a customer whose audit trail runs through the system.
DOVER

Risk: Narrow exposure to laser price

Regulated industry depth protects the pharmaceutical and medical device accounts but does nothing in general industrial marking, where Chinese laser manufacturers set pricing and validation counts for nothing. That leaves a large part of the addressable market effectively closed. Consumables exposure runs the same way it does for every coding incumbent, and offsetting software revenue is not yet large enough.

Players Tracked

Prominent Players

Danaher
Dover
Domino Printing Sciences
Brady Corporation
Han's Laser

Other Key Players

Matthews International
Keyence
Trotec Laser
Gravotech
SIC Marking
Pryor Marking Technology
Telesis Technologies
Hitachi Industrial Equipment Systems
Paul Leibinger
KBA-Metronic
REA Elektronik
Kortho
Illinois Tool Works
Universal Laser Systems
Epilog Laser

Recent Developments

FEBRUARY 2025

Battery passport requirements confirmed ahead of 2027 application

Implementing detail for the EU battery passport was confirmed ahead of its 2027 application date, requiring a machine-readable identifier on each battery sold in Europe. This was a regulatory confirmation rather than a commercial event, and it obliges cell makers to install marking equipment on lines that never carried any.
Signal: A first-time installation across an entire
SEPTEMBER 2024

Fiber laser marking prices fall further on source cost

Fiber laser marking system prices declined again across the year as source module costs fell with Chinese manufacturing scale in cutting and welding. These were competitive price movements rather than any corporate transaction, and they widened the set of applications where laser displaces inkjet on total cost alone.
Signal: Marking inherits a cost curve set by cutti
NOVEMBER 2024

Medical device direct part marking enforcement widened

Regulators in additional jurisdictions moved to enforce direct part marking of unique device identifiers on reusable medical instruments, following practice already established in the United States and European Union. These were enforcement decisions rather than new legislation, and they eliminate ink-based options because the mark must survive repeated autoclaving.
Signal: Enforcement of an existing rule moves more

Laser Sources, Solvents, Optics, Electronics

Cost structure differs by technology. Laser source modules carry 34% to 48% of a laser marker's cost, now sourced mostly from Chinese manufacturers who also supply cutting. Optics, galvanometer scanners, and control electronics add 18% to 26%. On the inkjet side, printhead assemblies run 22% to 32%, and the solvents and dyes behind the consumables business come from specialist chemical producers.
Solvent and specialty dye pricing rose sharply through 2022 as European chemical production absorbed gas-linked energy costs, and the IEA documented that constraint. For coding suppliers the effect landed on consumables specifically, where the margin lives, and passing it through risked pushing customers toward laser alternatives that consume nothing. Dover and Danaher both disclosed input cost pressure across those years. Several suppliers absorbed the increase rather than hand competitors an argument.

Every range above spans more than three points because a UV laser, a fiber laser, and a continuous inkjet printer share almost no components. Exposure separates by technology mix. A laser-weighted supplier carries source module dependence on Chinese manufacturers it cannot substitute quickly. An inkjet-weighted supplier carries solvent exposure on the product line that generates its profit. Chinese manufacturers hold source proximity and assembly cost together.
industrial-marking-equipment-market-cost-volatility-analysis-1787332594212

Qualify a second laser source before you need one

Source modules carry 34% to 48% of a laser marker's cost and come predominantly from a small set of Chinese manufacturers, a concentration risk few Western suppliers have addressed. Qualification takes months of beam characterisation and lifetime testing. Doing it while supply is comfortable costs engineering time only, and the alternative is discovering the dependency during an export restriction.

Absorb solvent increases rather than trigger laser conversion

Passing a solvent cost increase through to an inkjet customer invites them to price a laser alternative that consumes nothing, and once that comparison is made the account is usually lost for a decade. Absorbing the increase costs margin in the current year. Handing a competitor the total cost argument costs the entire consumables stream attached to that installation.

Standardise optics and controls across the laser range

Optics, scanners, and control electronics run 18% to 26% of cost and are largely common across fiber, UV, and CO2 platforms if a supplier designs them that way. Most do not, because each product line was developed separately by teams with no reason to co-ordinate. Consolidating the platform costs a redesign cycle and permanently improves purchasing scale on every unit.

Portfolio Architecture for Margin Defence

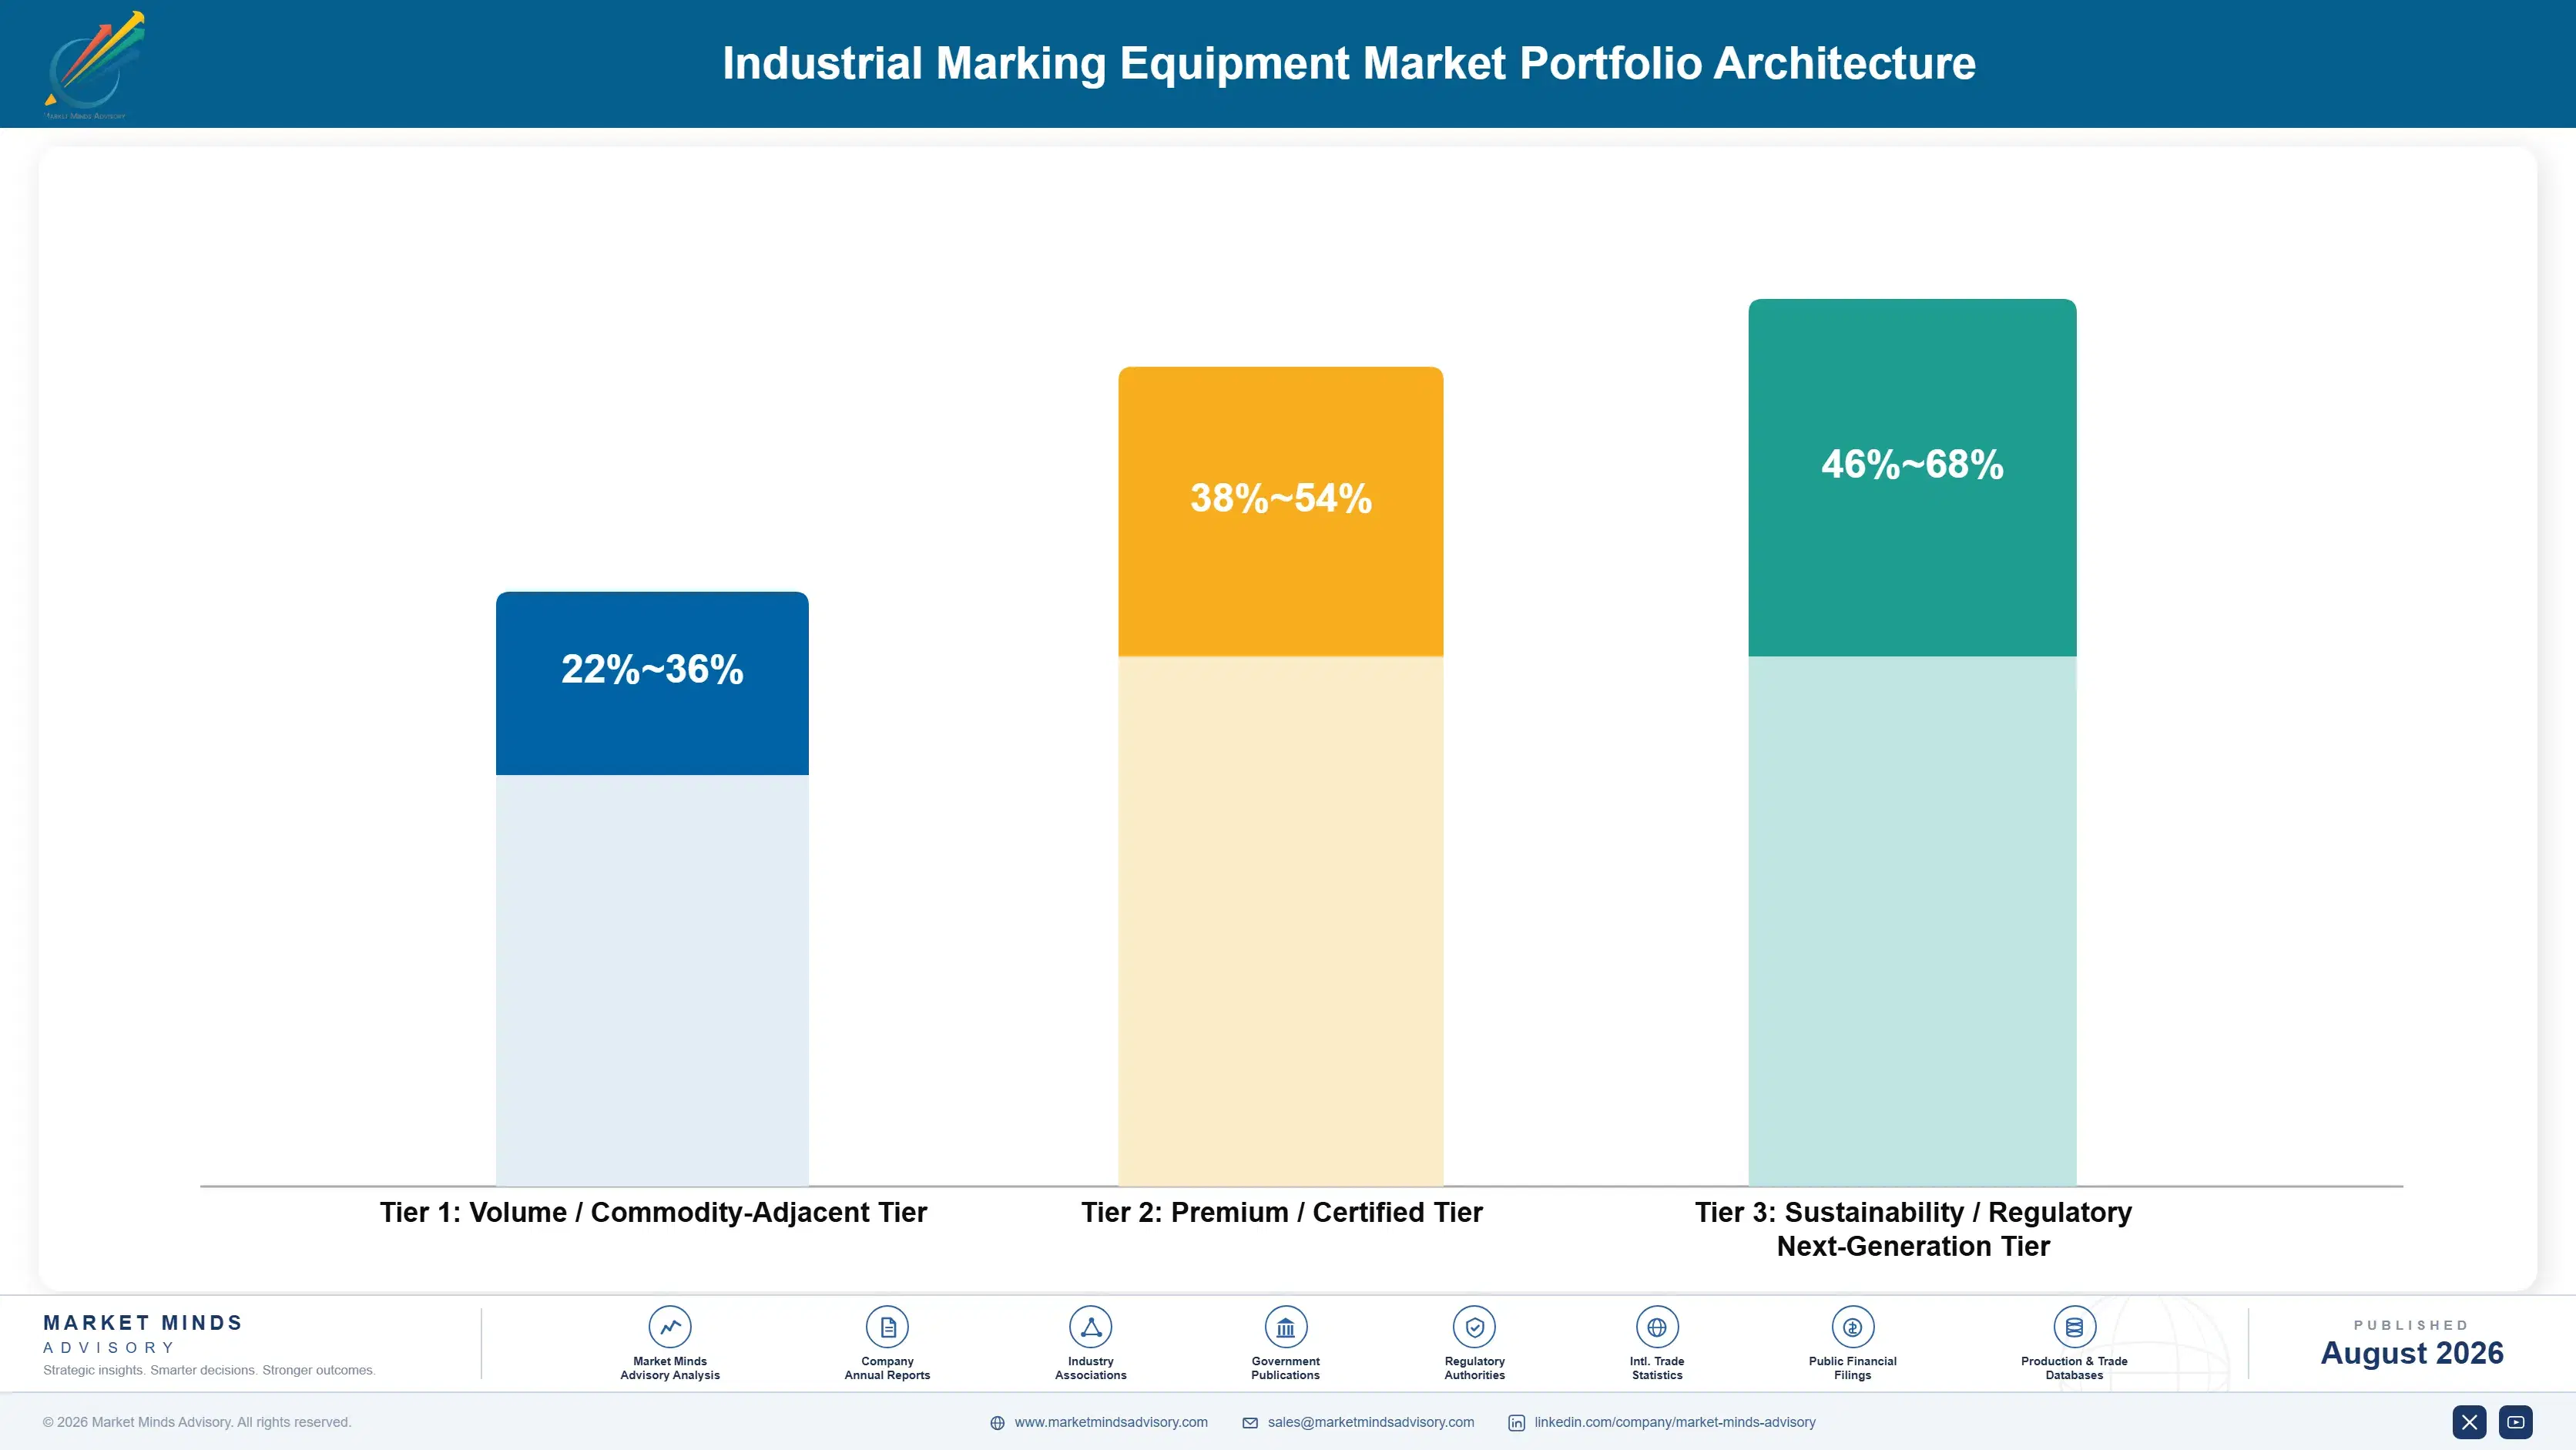
Three tiers sit inside this category and the margin logic differs between them. General industrial laser and inkjet hardware forms the volume tier, where Chinese manufacturers set pricing and product differentiation is minimal. Regulated industry systems carrying validation documentation earn considerably more, because the customer is buying an audit trail. Consumables and software recur, and between them they carry the profit hardware no longer generates on its own.
The tension in this market is unusual, because the growth product destroys the profit product. Selling a fiber laser wins the unit and removes an ink stream worth more over the installation's life than the machine was. Selling inkjet protects the annuity and loses the account to whoever offers laser. No version of this exists where a coding incumbent keeps both, and those pretending otherwise are losing more slowly.

High-value pools concentrate where documentation or substrate rather than hardware decides the sale: validated pharmaceutical and medical device installations, UV laser applications no fiber system can serve, serialisation software attached to an installed base, and first-time passport industry placements. The commodity end is general industrial fiber laser marking sold on price, where Chinese manufacturers set the level and Western suppliers add distribution cost.

Volume / Commodity-Adjacent Tier

General industrial laser and inkjet hardware sold on price into manufacturing without regulatory marking requirements. The range is wide because Chinese source proximity and Western distribution overheads produce entirely different economics at the same selling price.
Gross Margin: 22-36%

Premium / Certified Tier

Validated systems for pharmaceutical, medical device, and aerospace customers, supplied with qualification documentation and regulatory support. The range is wide because validation work is priced as a service by some suppliers and given away by others chasing the hardware order.
Gross Margin: 38-54%

Sustainability / Regulatory / Next-Generation Tier

Consumables, code management software, serialisation databases, and UV laser systems serving substrates fiber cannot mark. The range is wide because software and ink carry entirely different marginal cost while both sit inside the same recurring revenue line.
Gross Margin: 46-68%
industrial-marking-equipment-market-portfolio-architecture-1787332594713

High-value Sub-segments and Strategic Watch-out

UV and Green Laser Marking Systems

High value and high growth at 12.6%, the fastest segment, because a cold marking process handles clear plastics, glass, and medical polymers that fiber lasers scorch. Source cost several times a fiber module keeps it out of general industrial work, and that gap narrows annually. Substrate decides this segment.
Gross Margin: 46-68%

Fiber Laser Marking Systems

High value with strong growth at 9.8% and the largest share of new placements, having taken metal parts and rigid packaging from inkjet on total cost of ownership. Every placement permanently removes a consumables stream, which makes unit growth and profit growth pull apart. Growth and margin move opposite ways.
Gross Margin: 22-36%

Thermal and Continuous Inkjet Coding Systems

The volume core by installed base at 4.2%, still carrying most consumables revenue and most of the category's profit despite losing placements to laser every year. Flexible film, porous substrates, and very high line speeds keep it in place where laser cannot yet follow. Declining, profitable, and quietly essential.
Gross Margin: 46-68%

Mechanical and Electrochemical Marking Systems

The strategic watch-out at 2.4%, holding heavy metal part marking and deep engraving where laser depth is insufficient or capital budgets are minimal. Volume erodes each year as laser power rises, and no supplier should be investing engineering effort here now. Harvest it and move the engineers.
Gross Margin: 18-32%

How A Mark Gets Specified

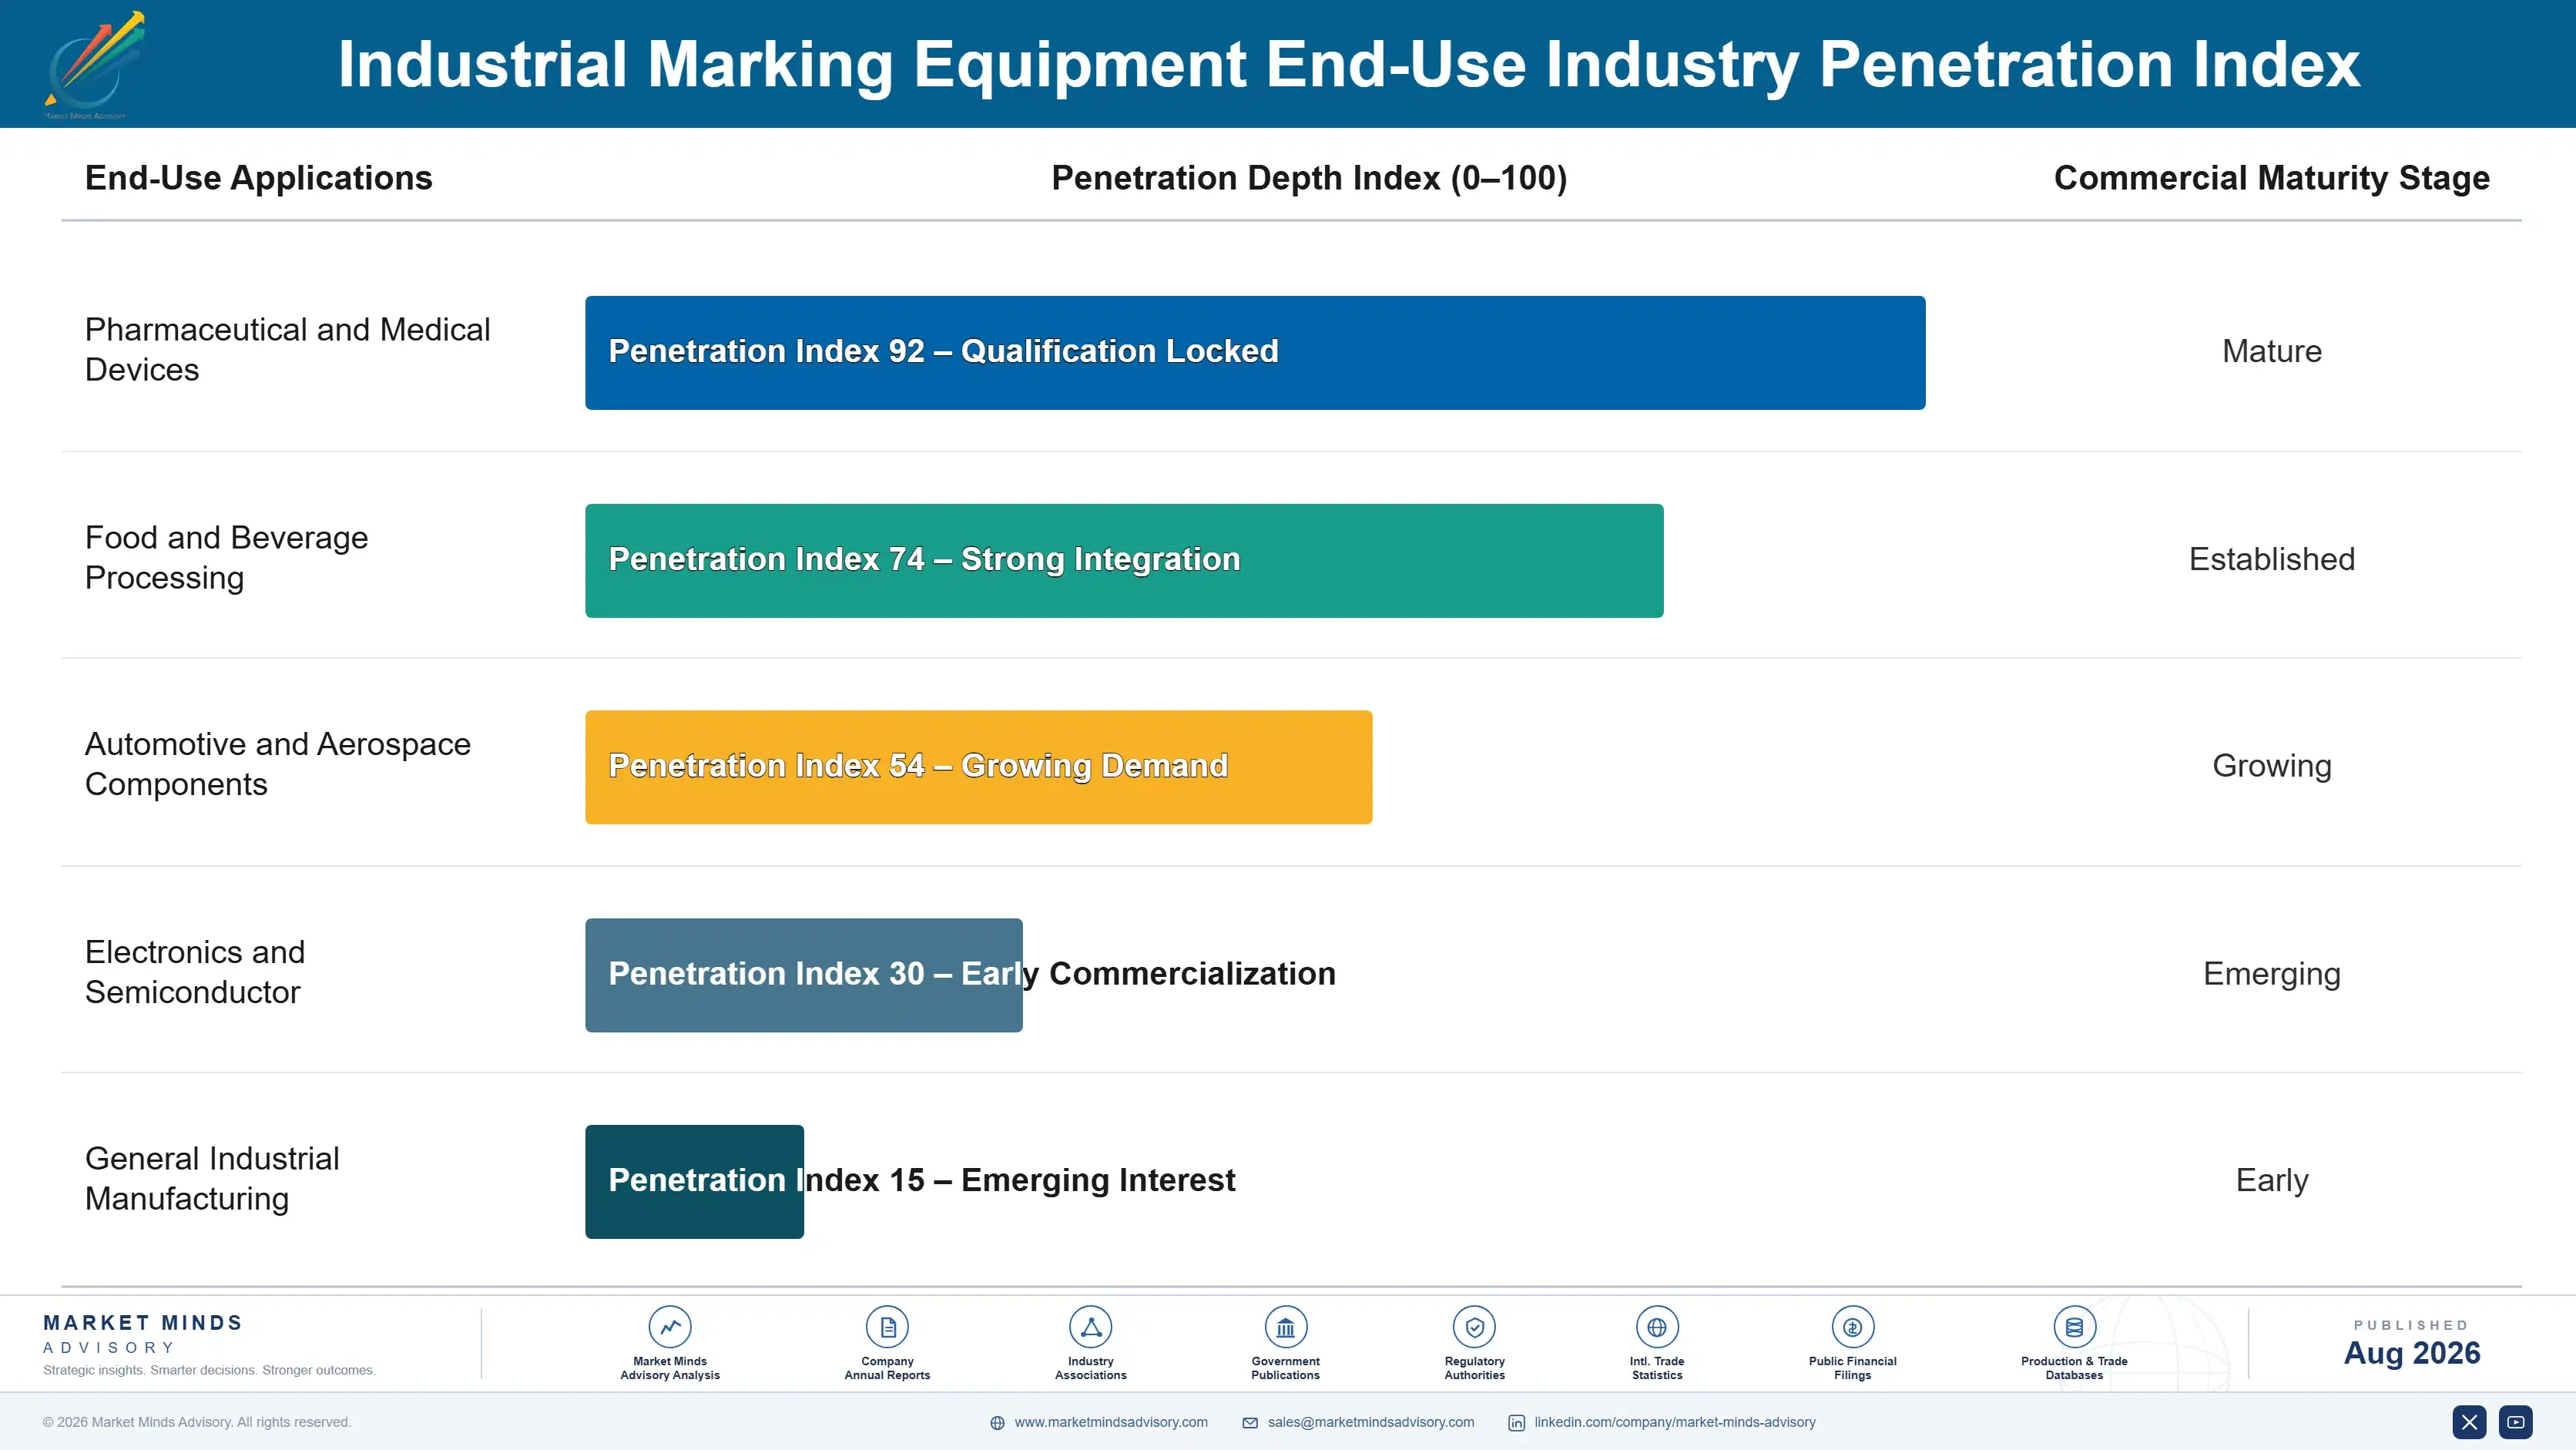
Demand commits at line qualification and then repeats for seven to ten years, because a system validated into a production process is not changed casually. In a regulated plant the change requires requalification, documentation, and an approval nobody volunteers to sponsor. That gives the incumbent an annuity of consumables, service, and eventually replacement. The genuine competitive moments are a new line, a regulation change, and a technology switch the customer initiates.
Stickiness varies sharply by how regulated the output is. Pharmaceutical and medical device lines stick hardest, since requalification is expensive and an auditor's question about it is worse. Aerospace sits close behind on documentation grounds. Food and beverage sticks moderately, because line speed and uptime matter more than paperwork. General industrial sticks least: the buyer compares prices at every replacement and switches without ceremony.

The buyer has moved from a production engineer to a regulatory affairs manager and, on passport-driven purchases, to a sustainability or compliance officer. Twenty years ago the specification concerned print quality and line speed. Now it concerns data structure, database resolution, and whether the mark survives the product's stated life. Suppliers still leading with print resolution answer a question that stopped mattering some time ago.
industrial-marking-equipment-market-end-use-penetration-index-1787332595199

Our Call On Industrial Marking

These are among the four positions where our research anticipates prominent divergence between winners and laggards over the coming forecast period. Each is grounded in the demand model, the regulatory perimeter, and the announced capacity pipeline.
01 / ANNUITY REPLACEMENT URGENCY

Rebuild the recurring revenue before ink disappears

Consumables carry 39% of category revenue and a good deal more of its profit, and every fiber laser placed removes one of those streams for the seven to ten year life of the installation. The replacement has to be software, validation support, and service contracts, all of which recur and attach to the same installed base but need years of development before they cover anything meaningful. Suppliers who started that work five years ago are comfortable, and those still discussing it internally have already left the decision too late.
02 / REGULATORY DOCUMENTATION DEPTH

Sell the audit trail, not the machine

A pharmaceutical or medical device customer is buying evidence that will satisfy an inspector, and the marking system is the least difficult component of that package. Installation, operational, and performance qualification take 3 to 6 weeks of specialist work the customer cannot perform alone, and a supplier who provides it wins accounts that hardware pricing never reaches. Competitors quoting a machine specification into that conversation are not participating in the same procurement at all, and rarely understand why they lost.
03 / PASSPORT INDUSTRY TIMING

Arrive before the tender exists

Battery, textile, electronics, and construction product manufacturers face Digital Product Passport obligations between 2027 and 2030, and most have never installed marking equipment because nothing previously required it. They will not run a competitive tender, since they do not yet know what to specify, which makes an early supplier with an application study and a compliance timeline the default choice. That window closes as soon as the first installations establish a standard practice, and in every industry that has happened faster than anybody expected.
04 / LASER PRICING DISCIPLINE

Quote the ink the customer stops buying

A buyer comparing an inkjet printer against a fiber laser on purchase price is comparing the wrong figure, and letting them do it costs the supplier both the margin and frequently the order. Roughly USD 28,000 of ink and makeup fluid across a seven year installation life is the number that settles the argument, and presenting it converts a price objection into an obvious decision. Sales teams still leading with the machine price are discounting against a comparison they could simply have removed.

Engagement Snapshot From the Field

A live engagement with an industry participant carrying material or product regulatory and market exposure ahead of a defining policy shift, showing how our research translates into a defensible multi-year portfolio strategy.
MARKET MINDS ADVISORY · CLIENT ENGAGEMENT SUMMARY
Industrial Marking Equipment Producer Strategic Portfolio Review and Transition Roadmap 2026·Investment Scenario on Industrial Marking Equipment Exposure Evaluation 2025-26
CLIENT PROFILE
A European coding and marking manufacturer with roughly USD 210 million in annual revenue engaged MMA after three years in which unit shipments grew while gross profit fell (client-reported, unverified by MMA). The company's laser range was selling well and its inkjet consumables business was contracting at almost exactly the same rate, and nobody internally had connected the two numbers.
STRATEGIC CHALLENGE
The laser division wanted more investment and pointed at its growth. The inkjet division wanted protection and pointed at its margin. Both were correct, which made the argument unresolvable at divisional level. The board needed a portfolio position before the next planning cycle and had no analysis showing what the transition actually cost or how long it would run.
MMA APPROACH
MMA modelled the installed base account by account, tracking which inkjet installations were most exposed to laser conversion and what consumables revenue each carried. We tested three recurring revenue alternatives with 90 existing customers: code management software, validation support subscriptions, and outcome-based service contracts. We then built a ten-year profit model comparing an aggressive laser push against a managed transition and against continued inkjet defence.
KEY FINDINGS
  1. Continued inkjet defence produced the worst ten-year outcome of the three options, losing both the installed base and the consumables revenue it was meant to protect (client-reported, unverified by MMA).
  2. Roughly 44% of the inkjet installed base sat on substrates and line speeds where laser could not yet substitute, which was far more than management had assumed.
  3. Customers accepted validation support subscriptions readily and code management software slowly, while outcome-based service pricing was rejected by nearly every regulated-industry respondent.
  4. Sales compensation paid on hardware revenue was accelerating laser conversion inside accounts the client would have preferred to hold on inkjet for several more years.
CLIENT PROFILE
A European coding and marking manufacturer with roughly USD 210 million in annual revenue engaged MMA after three years in which unit shipments grew while gross profit fell (client-reported, unverified by MMA). The company's laser range was selling well and its inkjet consumables business was contracting at almost exactly the same rate, and nobody internally had connected the two numbers.
STRATEGIC CHALLENGE
The laser division wanted more investment and pointed at its growth. The inkjet division wanted protection and pointed at its margin. Both were correct, which made the argument unresolvable at divisional level. The board needed a portfolio position before the next planning cycle and had no analysis showing what the transition actually cost or how long it would run.
MMA APPROACH
MMA modelled the installed base account by account, tracking which inkjet installations were most exposed to laser conversion and what consumables revenue each carried. We tested three recurring revenue alternatives with 90 existing customers: code management software, validation support subscriptions, and outcome-based service contracts. We then built a ten-year profit model comparing an aggressive laser push against a managed transition and against continued inkjet defence.
KEY FINDINGS
  1. Continued inkjet defence produced the worst ten-year outcome of the three options, losing both the installed base and the consumables revenue it was meant to protect (client-reported, unverified by MMA).
  2. Roughly 44% of the inkjet installed base sat on substrates and line speeds where laser could not yet substitute, which was far more than management had assumed.
  3. Customers accepted validation support subscriptions readily and code management software slowly, while outcome-based service pricing was rejected by nearly every regulated-industry respondent.
  4. Sales compensation paid on hardware revenue was accelerating laser conversion inside accounts the client would have preferred to hold on inkjet for several more years.
RECOMMENDED STRATEGY
Phase 1: Phase 1 (0 to 9 months): Launch validation support subscriptions across the regulated installed base and change sales compensation onto account lifetime value. Phase 2: Phase 2 (9 to 24 months): Push laser hard into the 56% of the base that is convertible anyway, and defend the remainder deliberately. Phase 3: Phase 3 (24 to 48 months): Build code management software into a standalone recurring line rather than a hardware accessory.
OUTCOME
The board adopted the managed transition and changed sales compensation first, which management later described as the decision that mattered most. Validation subscriptions reached a material share of the regulated installed base within a year, and the client reports gross profit stabilising for the first time in four years (client-reported, unverified by MMA). Software remains behind plan.

Frequently Asked Questions

Foundational context covering the market sizes, CAGR, scope, country, region and competition that inform every finding below. This section is provided to cover basics and most often pre-purchase conversations, answered from the MMA Primary Research Dataset.

What is the current size of the Industrial Marking Equipment Market?

The global market is valued at USD 5.4 billion in 2025, covering laser, inkjet, thermal transfer, mechanical, and electrochemical marking systems with their dedicated consumables. Label printing and print-and-apply labelling machines are excluded.

How large will the Industrial Marking Equipment Market be by 2036?

The market is forecast to reach USD 10.69 billion by 2036 in the base case, about 1.86 times the 2026 level. That represents incremental value of roughly USD 4.94 billion.

What is the CAGR for the Industrial Marking Equipment Market 2026 to 2036?

The market grows at a 6.4% CAGR in the base case, with bull and bear scenarios at 7.6% and 5.1%. The spread turns on Digital Product Passport scope and on the pace of laser substitution.

Which segment is growing fastest?

UV and green laser systems grow fastest at 12.6%, about 1.97 times the overall rate, because they mark substrates fiber lasers damage. Fiber laser systems follow at 9.8%.

Who are the major companies in the Industrial Marking Equipment Market?

Leading participants include Danaher, Dover, Domino Printing Sciences, Brady Corporation, and Han's Laser. Concentration sits at roughly 47%, lower than a decade ago because laser entrants needed no service network.

Which country is growing fastest?

India grows fastest at a 9.2% CAGR, driven by pharmaceutical serialisation for regulated export markets and by electronics manufacturing capacity additions. China follows on manufacturing volume.

Report Segmentation Architecture

The full report scope spans multiple orthogonal segmentation dimensions, with cross-tabulated demand data provided for each dimension pair. Coverage extends further to regional breakdowns, trend trajectories, and the competitive detail needed to support segment-level decision-making.

By Marking Technology

  • UV and Green Laser Marking Systems
  • Fiber Laser Marking Systems
  • CO2 Laser Marking Systems
  • Thermal and Continuous Inkjet Coding Systems
  • Mechanical and Electrochemical Marking Systems

By End-Use Industry

  • Pharmaceutical and Medical Devices
  • Food and Beverage Processing
  • Automotive and Aerospace Components
  • Electronics and Semiconductor
  • General Industrial Manufacturing

By Sales Model

  • Direct Sale with Validation Support
  • Machine Builder OEM Integration
  • Distributor and Reseller Channel
  • Consumables and Service Contract

By Region

  • North America
  • Western Europe
  • East Asia
  • South Asia and Pacific
  • Latin America
  • Middle East and Africa
  • Eastern Europe

Scope, Methodology, and Coverage

Every figure in this report is reproducible from documented input assumptions. The scope below maps the historical period, the forecast horizon, the segmentation dimensions, and the countries covered, alongside the underlying primary and qualitative methodology.
Historical Period
2020 to 2025
Forecast Period
2026 to 2036
Base Year
2025 (USD billions; MMA Primary Research Dataset, August 2026)
Market Definition
The industrial marking equipment market comprises the manufacture and sale of systems that apply permanent or durable identification directly onto a product, component, or its primary packaging, valued at manufacturer selling prices to end users, machine builders, distributors, and contract manufacturers. It spans UV, green, fiber, and CO2 laser marking systems, thermal and continuous inkjet coding printers, thermal transfer overprinting, dot peen, scribe and stamping equipment, and electrochemical etching units, together with the inks, makeup fluids, solvents, ribbons, and marking consumables those systems require over their operating life. Label printing presses, print-and-apply labelling machines and the pressure-sensitive labels they apply, barcode scanners and vision inspection systems, RFID readers and tags, general-purpose commercial and office printing equipment, engraving equipment sold for retail personalisation, and packaging machinery are excluded. Serialisation consulting services sold independently of equipment are outside scope.
Quantitative Units
USD billions (current prices); volume in thousands of systems shipped
Segmentation Dimensions
By Marking Technology; By End-Use Industry; By Sales Model; By Region
Regions Covered
North America, Western Europe, East Asia, South Asia and Pacific, Latin America, Middle East and Africa, Eastern Europe
Countries Covered
USA, Canada, Mexico, Germany, France, Italy, Spain, UK, Switzerland, Ireland, Netherlands, Sweden, China, Japan, South Korea, Taiwan, India, Australia, Vietnam, Thailand, Indonesia, Singapore, Brazil, Argentina, Chile, Colombia, Saudi Arabia, United Arab Emirates, South Africa, Turkey, Poland, Czechia, Slovakia, Hungary, and additional markets relevant to this sector
Key Companies Profiled
Danaher, Dover, Domino Printing Sciences, Brady Corporation, Han's Laser, Matthews International, Keyence, Trotec Laser, Gravotech, SIC Marking, Pryor Marking Technology, Telesis Technologies, Hitachi Industrial Equipment Systems, Paul Leibinger, KBA-Metronic, REA Elektronik, Kortho, Illinois Tool Works, Universal Laser Systems, Epilog Laser
Quantitative Methodology
Primary survey, n=3,800 respondents, Q4 2025, six countries; demand-side model with trade association cross-validation
Qualitative Methodology
47 expert interviews, Q4 2025; applied to validate demand model assumptions, identify emerging dynamics, and assess competitive positioning
Report Format
PDF and XLSX data workbook (Word format preview document)
Publisher
Market Minds Advisory
Report Code
MMA-2026-CON-449
Published
August 2026
Contact
sales@marketmindsadvisory.com | www.marketmindsadvisory.com

Purchase the full Industrial Marking Equipment Market Report (2026 to 2036).

The full MMA Industrial Marking Equipment report sizes the market across five marking technologies, five end-use industries, four sales models, and seven regions through 2036. It profiles 20 participants on a consistent basis of marking equipment and dedicated consumables revenue, scoring each on validation capability, substrate breadth, consumables exposure, and recurring software position. Scenario models quantify how Digital Product Passport scope, laser substitution pace, and source module pricing move both volume and achievable margin. The report also includes consumables exposure modelling by supplier, laser substitution mapping by substrate and line speed, regulatory deadline tracking across jurisdictions, and installed base conversion analysis for the coding incumbents.
Five-technology and four-channel market sizing to 2036
Twenty-participant benchmark on equipment and consumables revenue
Consumables exposure modelling by supplier and installed base
Laser substitution mapping by substrate and line speed
Regulatory deadline tracking across major marking jurisdictions
Installed base conversion analysis for coding incumbents

Built For The People Who Decide

From boardroom strategy to bench-side execution, this report is read cover-to-cover by leaders shaping the next decade of their industry, turning demand scenarios, market dynamics and valuation benchmarks into decisions.
CXOs/ Presidents/ VPs/ Managers
M&A and Corporate Development
Strategy Teams and R&D Heads
Procurement and Product Directors
Regulatory and Compliance Leaders
Investor Relations and Equity Analysts