Market Minds Advisory
Industrial Energy Management System Market

Industrial Energy Management System Market: Industrial Energy Management System Market. Software Infrastructure for Industrial Energy Efficiency and Demand Optimization

Rising industrial electricity costs and tightening decarbonization mandates push manufacturers toward software that monitors, forecasts, and automatically optimizes plant-level energy consumption across production lines, utilities, and multi-site facility portfolios worldwide.

Lead Analyst

Published

September 2026

Make Smarter Decisions with Customized Research Insights

Request a free sample report and evaluate market opportunities, growth trends, and competitive dynamics relevant to your business needs.

2025 MARKET VALUE$1.1BMarket Size 2025
2036 FORECAST VALUE$3.1BBase Case , 2026 to 2036
CAGR 2026 TO 20369.5 %Bull 10.7% / Bear 8.3%
INCREMENTAL OPPORTUNITY$1.9BNet 10- year value creation
EXPANSION MULTIPLE2.48x2036 value over 2026 base
Strategic Levers
M&A Pipeline
Regional Outlook
Country Rankings
Competitive Intelligence
Segmental Deep-dive
Call-Us : 91 93563 13602

Executive Snapshot and Market Trajectory.

Industrial energy management software is shifting from optional efficiency tooling to a compliance and cost-control necessity as electricity prices climb and carbon mandates tighten sharply across manufacturing sectors worldwide, forcing plant operators to justify every kilowatt-hour consumed and report consumption data upward to corporate sustainability teams.
AI-based forecasting and process optimization platforms are pulling ahead of basic metering tools as manufacturers chase double-digit energy cost savings across multi-site facility portfolios spanning multiple production lines and utility connections. East Asia's dense industrial base and aggressive national efficiency mandates concentrate the fastest deployment activity globally right now, well ahead of comparable adoption elsewhere, as regulators tie continued export competitiveness directly to measurable plant-level efficiency gains.
Diversified industrial conglomerates dominate through bundled hardware-software offerings backed by decades of established plant relationships and long-standing service contracts across major manufacturing regions. Specialist AI analytics vendors are winning standalone deals by demonstrating measurable savings within single-digit month payback windows that legacy incumbents rarely match consistently, pressuring established players to accelerate their own software roadmaps and pursue targeted acquisitions of smaller analytics specialists rather than build comparable forecasting capability from scratch internally.
Market Definition
The Industrial Energy Management System Market covers software and integrated platforms that monitor, analyze, forecast, and automatically optimize energy consumption across industrial facilities and production processes. It excludes standalone hardware sensors sold without management software, building-only energy systems outside industrial facilities, and generic enterprise resource planning software.
Base Year Value
$1.1B in 2025 (MMA Primary Research Dataset, September 2026)
Forecast Period
2026 to 2036, eleven discrete annual values
CAGR
9.5% base case. Bull 10.7%. Bear 8.3%.
Fastest Growth Segment
Energy Analytics and AI-Based Forecasting Platforms: 14.0% CAGR
Fastest Growth Country
China: 12.0% CAGR
Fastest Growth Region
South Asia and Pacific: 11.5% CAGR
Largest Region
East Asia: 29% of 2025 global value
Market Leaders
Schneider Electric, Siemens, Honeywell, Johnson Controls, and ABB lead the market. Source: MMA Analysis, July 2026.
Primary Survey
n=3,800 procurement and R&D decision-makers, Q4 2025, six countries
Methodology
Demand-side build-up, cross-validated against public data, 47 expert interviews

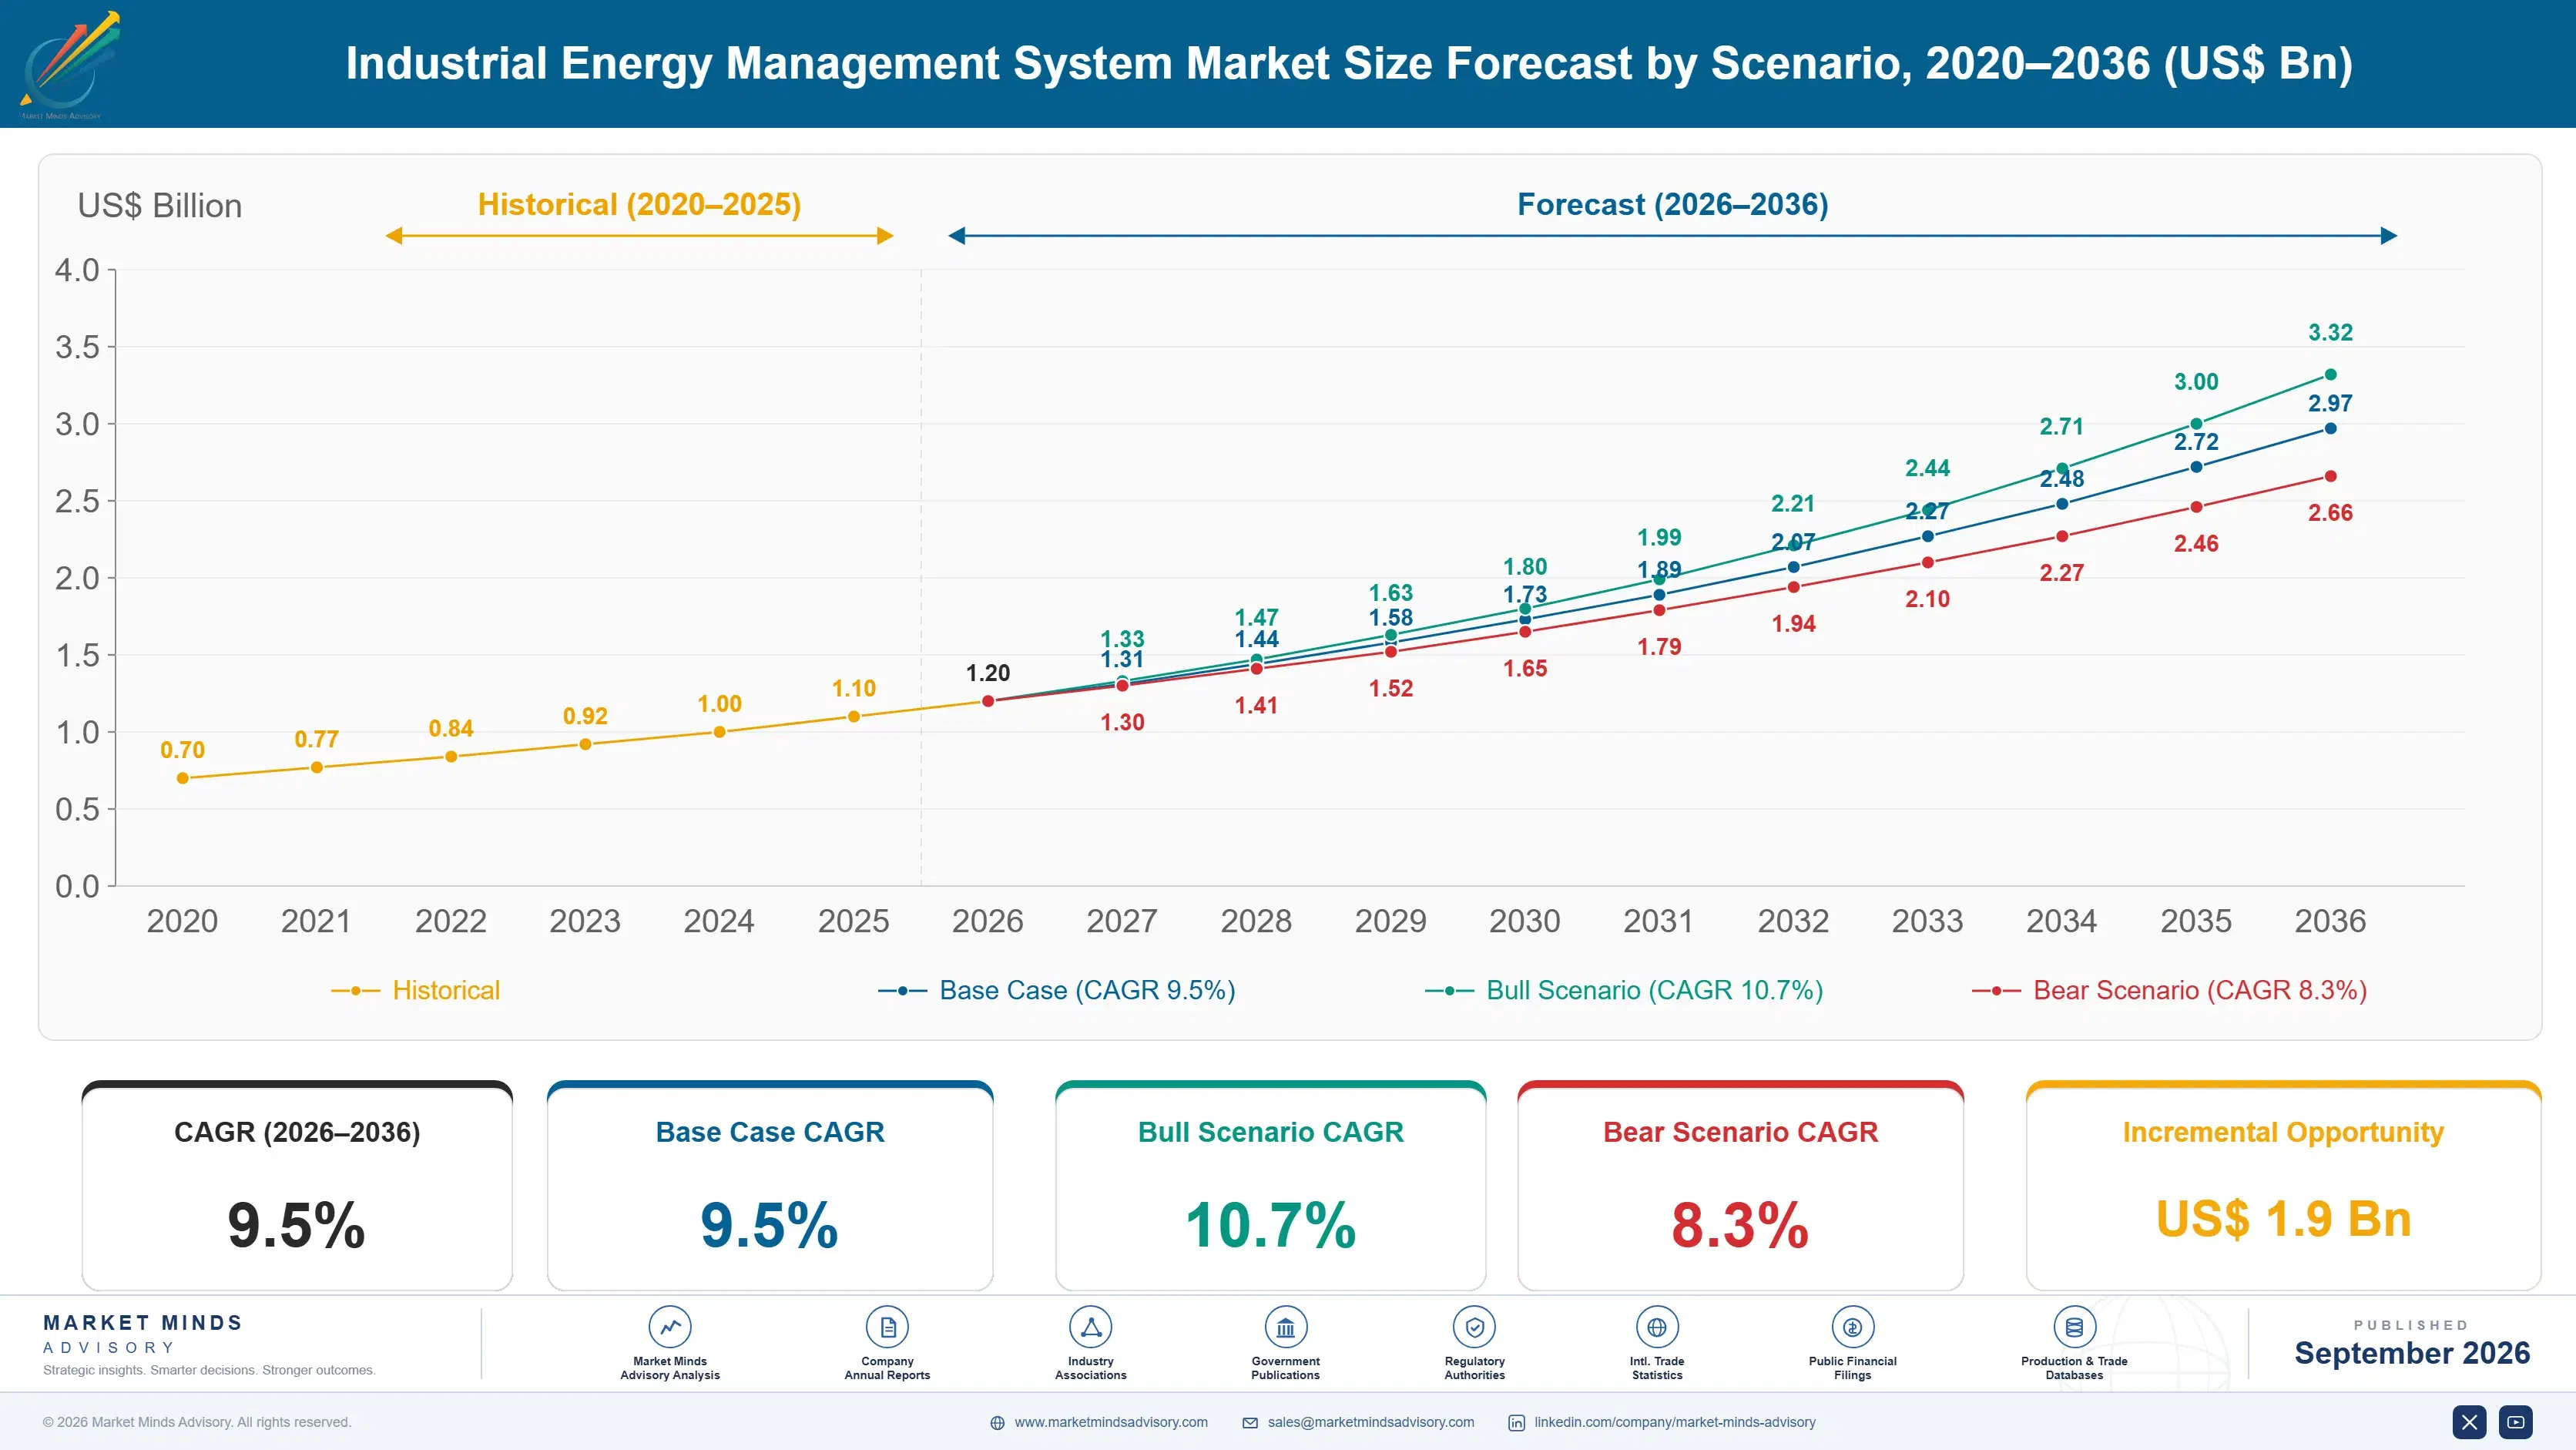
Industrial Energy Management System Market Forecast Scenarios

industrial-energy-management-system-market-size-forecast-scenario-1788455764441
Industrial energy management software grew steadily between 2020 and 2025 as early manufacturing adopters proved out basic monitoring and metering deployments across single-site facilities, laying the groundwork for the broader multi-site rollouts now underway across most major manufacturing regions. Historical growth ran near 8.5 percent annually across that period, accelerating meaningfully toward the tail end as electricity prices rose.
The base case assumes sustained double-digit growth through 2036, driven by three commercial mechanisms working together across the forecast window. Tightening national carbon reporting mandates are forcing measurement infrastructure investment regardless of near-term payback economics. Rising industrial electricity prices make optimization software increasingly self-funding through demonstrated savings within a single budget cycle. Expanding AI forecasting capability continues shortening payback periods across facility types and production processes worldwide, widening the addressable buyer base each year.
A bull case built on accelerated carbon pricing regimes and mandatory disclosure requirements across major manufacturing economies could push growth meaningfully above base case levels through the back half of the forecast period. A bear case tied to delayed regulatory enforcement or a prolonged industrial recession would slow capital investment in optimization software considerably across price-sensitive facility segments and smaller manufacturers.

Efficiency Software Becomes a Balance Sheet Line Item

Industrial facilities are converging on a common realization: energy consumption data that once lived in isolated utility bills now belongs alongside production output and labor cost as a tracked operating metric reviewed monthly by plant management and increasingly by corporate finance teams overseeing capital allocation decisions across multi-site facility portfolios spanning several manufacturing regions and utility rate structures that vary considerably between countries.
MARKET CONCENTRATION52% CR5top five vendors hold this combined participation share currently
AVERAGE ANNUAL PLATFORM PRICE$85K per facilitytypical mid-size manufacturing site annual subscription cost estimate
RETROFIT DEPLOYMENT SHARE64%installations occurring within existing brownfield facility infrastructure currently
TYPICAL PAYBACK PERIOD14 monthsaverage time required for savings to offset platform cost
CLOUD DEPLOYMENT SHARE71%platforms delivered via cloud rather than on-premises infrastructure currently
COGS ENERGY COST SHARE18%typical energy input share of total manufacturing production costs
Commercially, the market splits between diversified conglomerates selling bundled hardware-software suites to existing customers through long-standing service relationships built over decades of plant equipment installation, and specialist software vendors competing purely on analytics depth, forecasting accuracy, and measurable savings performance that plant managers can verify against their own utility billing records each billing quarter without relying on vendor-reported estimates alone.
Over the coming decade, tightening carbon disclosure rules and rising electricity price volatility will keep pushing optimization software from a discretionary purchase toward a standard line item in industrial capital budgets, with AI forecasting depth increasingly separating credible platforms from basic dashboard tools that manufacturers now consider commodity infrastructure unworthy of premium pricing or dedicated budget line consideration going forward as procurement teams grow more sophisticated.
"The facilities that treat energy data like a spreadsheet afterthought are the ones getting blindsided by next year's carbon compliance audit."
Director, Industrial Technology and Sustainability Practice · MMA Industrial Energy Monitoring Practice · September 2026

Market Trends

Corporate Carbon Disclosure Rules Force Measurement Infrastructure Investment

National and regional carbon disclosure regulations, including expanding scope two and scope three reporting mandates, now require manufacturers to report facility-level energy consumption with auditable granularity rather than annual utility bill estimates. Roughly 42 percent of large manufacturers surveyed report that disclosure compliance, not cost savings alone, now drives their initial energy management software purchase decision. This regulatory push is pulling smaller mid-market manufacturers into the addressable buyer base earlier than cost economics alone would justify, since penalties for non-disclosure now exceed typical software subscription costs across most major manufacturing jurisdictions worldwide.
Market Impact: 34 percent cite cost as driver
AI Forecasting Shortens Payback Periods Below One Year

Machine learning based load forecasting and anomaly detection have compressed typical platform payback periods from over two years to roughly 14 months on average, making standalone software purchases easier to justify without bundled hardware attached. Vendors report that facilities using AI forecasting modules capture 23 percent more measurable savings than those using static rule-based dashboards alone. This capability gap is becoming the primary basis on which manufacturers now differentiate between competing platform vendors during procurement evaluations across most industrial sectors and geographies worldwide, particularly among facilities operating around the clock across multiple shifts.
Market Impact: 27 percent now participate in programs

Market Opportunities and Growth Drivers

Rising Industrial Electricity Prices Make Software Self-Funding

Industrial electricity prices have climbed considerably across major manufacturing economies over the past several years, driven by grid infrastructure investment costs and volatile fuel input pricing passed through to commercial and industrial rate classes. This has pushed typical software payback periods below 14 months for facilities with meaningful production volume, making the purchase decision straightforward for finance teams that previously deprioritized efficiency software behind other capital projects. Roughly 34 percent of surveyed manufacturers now cite electricity cost as their primary purchase justification, ahead of sustainability reporting requirements alone, a reversal from survey results collected just two years earlier.
Market Impact: 7 months average brownfield deployment time

Demand Response Program Participation Creates New Revenue Streams

Utility-run demand response and grid flexibility programs increasingly pay industrial facilities for verified load curtailment during peak demand periods, turning energy management software from a pure cost center into a modest new revenue source for participating manufacturers. Facilities with automated, software-verified curtailment capability qualify for materially higher program payments than those relying on manual load-shedding procedures. Roughly 27 percent of large industrial facilities in mature grid markets now participate in at least one formal demand response program, up meaningfully from participation levels five years earlier, as utilities expand program eligibility to smaller facility tiers.
Market Impact: 19 percent added to project timelines

Market Restraints and Challenges

Legacy Equipment Integration Complexity Slows Deployment Timelines

Many industrial facilities run production equipment installed decades ago without modern data connectivity, forcing energy management vendors to retrofit sensors and gateway hardware before software deployment can even begin. The root cause is that plant equipment replacement cycles run far longer than software refresh cycles, leaving a persistent installed base of unconnected machinery. This extends average deployment timelines to roughly seven months at brownfield sites, materially longer than the six-week timeline typical of greenfield facilities built with connectivity in mind. Vendors are increasingly offering wireless retrofit sensor kits and phased rollout plans to shorten this gap.
Market Impact: 42 percent cite disclosure as driver

Data Ownership Disputes Complicate Multi-Vendor Facility Deployments

Facilities running equipment from multiple original equipment manufacturers frequently encounter disputes over who owns the machine-level data feeding the energy management platform, since some equipment vendors restrict data access through proprietary licensing terms. The underlying cause is that equipment manufacturers view operational data as a competitive asset worth protecting, not merely a byproduct of running their machinery. This friction adds roughly 19 percent to average project timelines at multi-vendor sites, according to procurement teams. Some software vendors now negotiate direct data-sharing agreements with major equipment manufacturers to bypass this repeated site-by-site friction.
Market Impact: 23 percent higher savings with AI
3 additional market trends, 4 additional growth drivers, and 3 additional restraints and challenges are covered in the full report. Contact sales@marketmindsadvisory.com to access the complete intelligence.

Segment CAGR and Growth Architecture

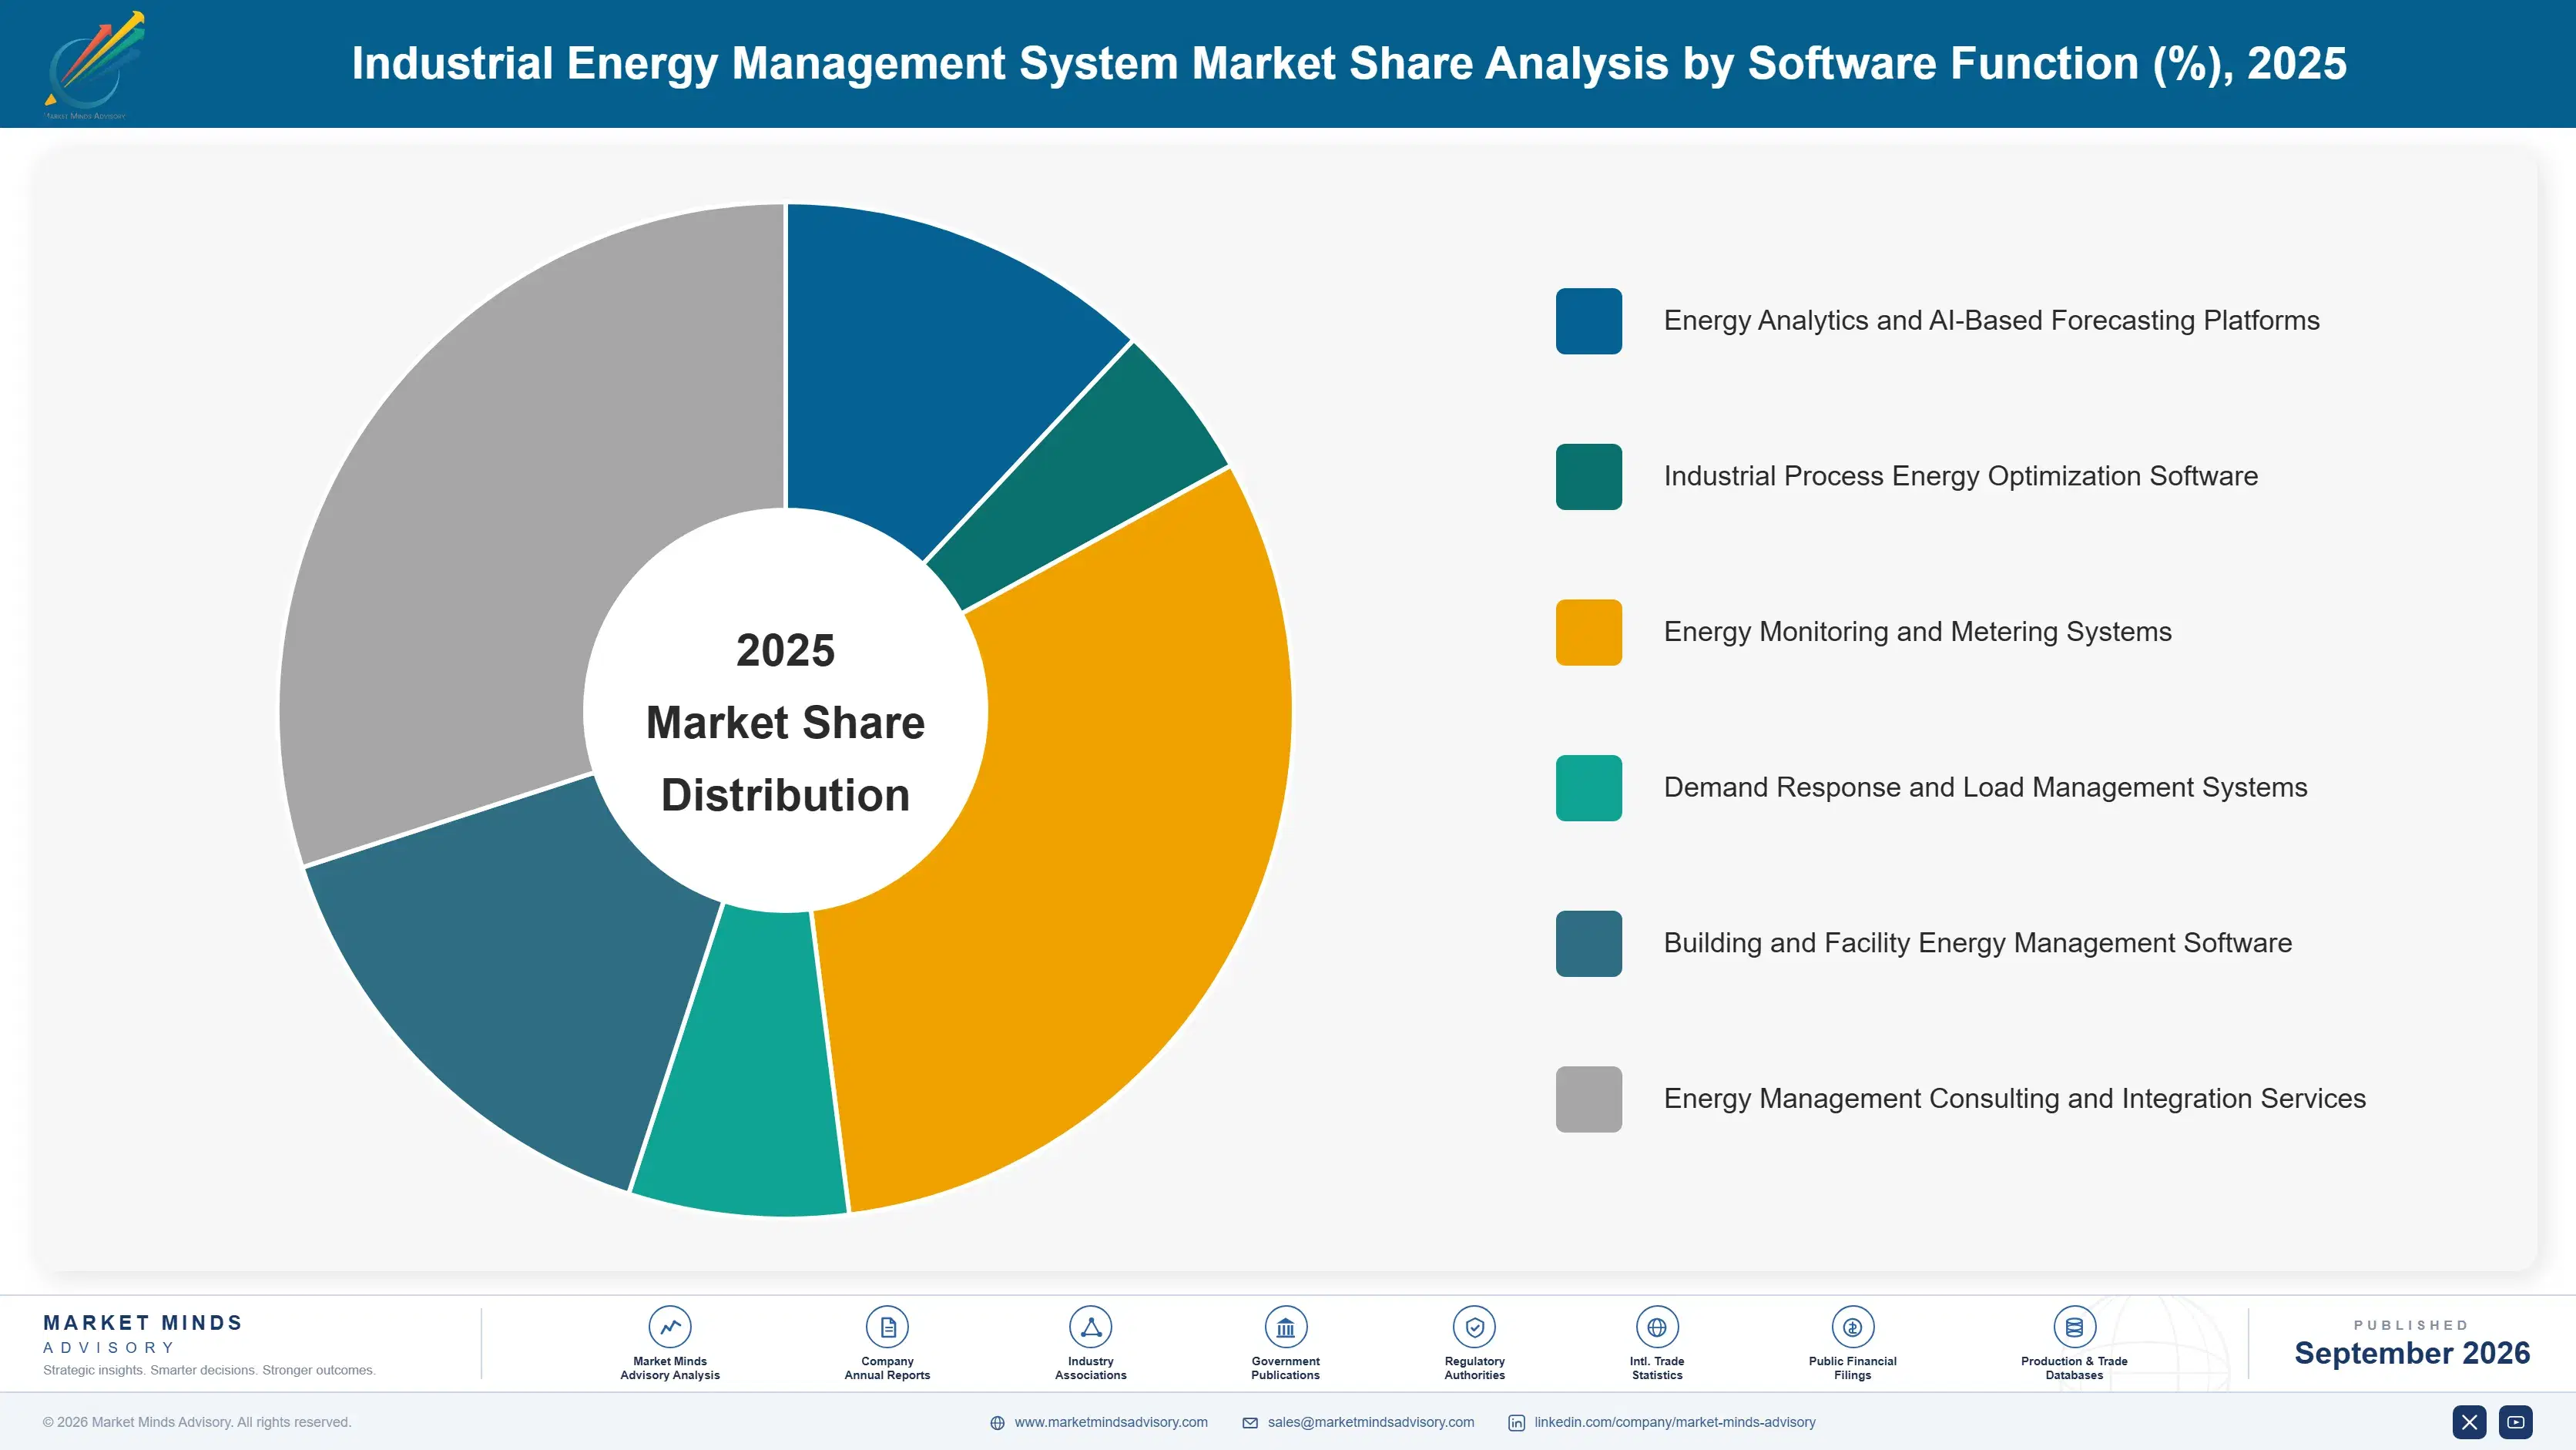
This report segments the Industrial Energy Management System Market by software function, the clearest lens for near-term capital allocation decisions across large and mid-size manufacturing facilities, since forecasting, optimization, and monitoring tools carry distinct pricing models, sales cycles, and competitive dynamics despite often bundling together within a single vendor platform sold to a given facility.
industrial-energy-management-system-market-market-share-analysis-1788455764970

Energy Analytics and AI-Based Forecasting Platforms

AI-based forecasting platforms predict facility-level demand and identify optimization opportunities before consumption occurs, rather than simply reporting historical usage after the fact. Demand for these tools is accelerating fastest among manufacturers seeking to participate in demand response programs, where accurate forecasting directly determines program payment eligibility and curtailment sizing. Vendors offering proven forecasting accuracy above industry benchmarks are commanding premium pricing over basic monitoring competitors, and enterprise buyers increasingly treat forecasting depth as a mandatory procurement requirement rather than an optional add-on module during vendor evaluation processes across most manufacturing sectors, particularly among larger facilities with dedicated sustainability and energy procurement staff evaluating multiple competing platforms simultaneously each budget cycle.
CAGR 14.0%

Industrial Process Energy Optimization Software

Process optimization software adjusts production line parameters in near real time to minimize energy consumption while holding output quality and throughput steady, moving beyond passive monitoring into active control territory. This segment is growing fastest among energy-intensive process industries such as metals, cement, and chemicals, where even small percentage efficiency gains translate into meaningful absolute cost savings given the scale of baseline consumption involved. Vendors increasingly bundle optimization modules with predictive maintenance capability, since equipment operating outside optimal parameters both wastes energy and accelerates component wear across the underlying production equipment itself, a combined value proposition that pure monitoring vendors cannot easily replicate without acquiring dedicated process control engineering expertise internally over time.
CAGR 12.5%
Full segment breakdown across 6 segments available in the complete report.

Regional Architecture and Country Demand Map

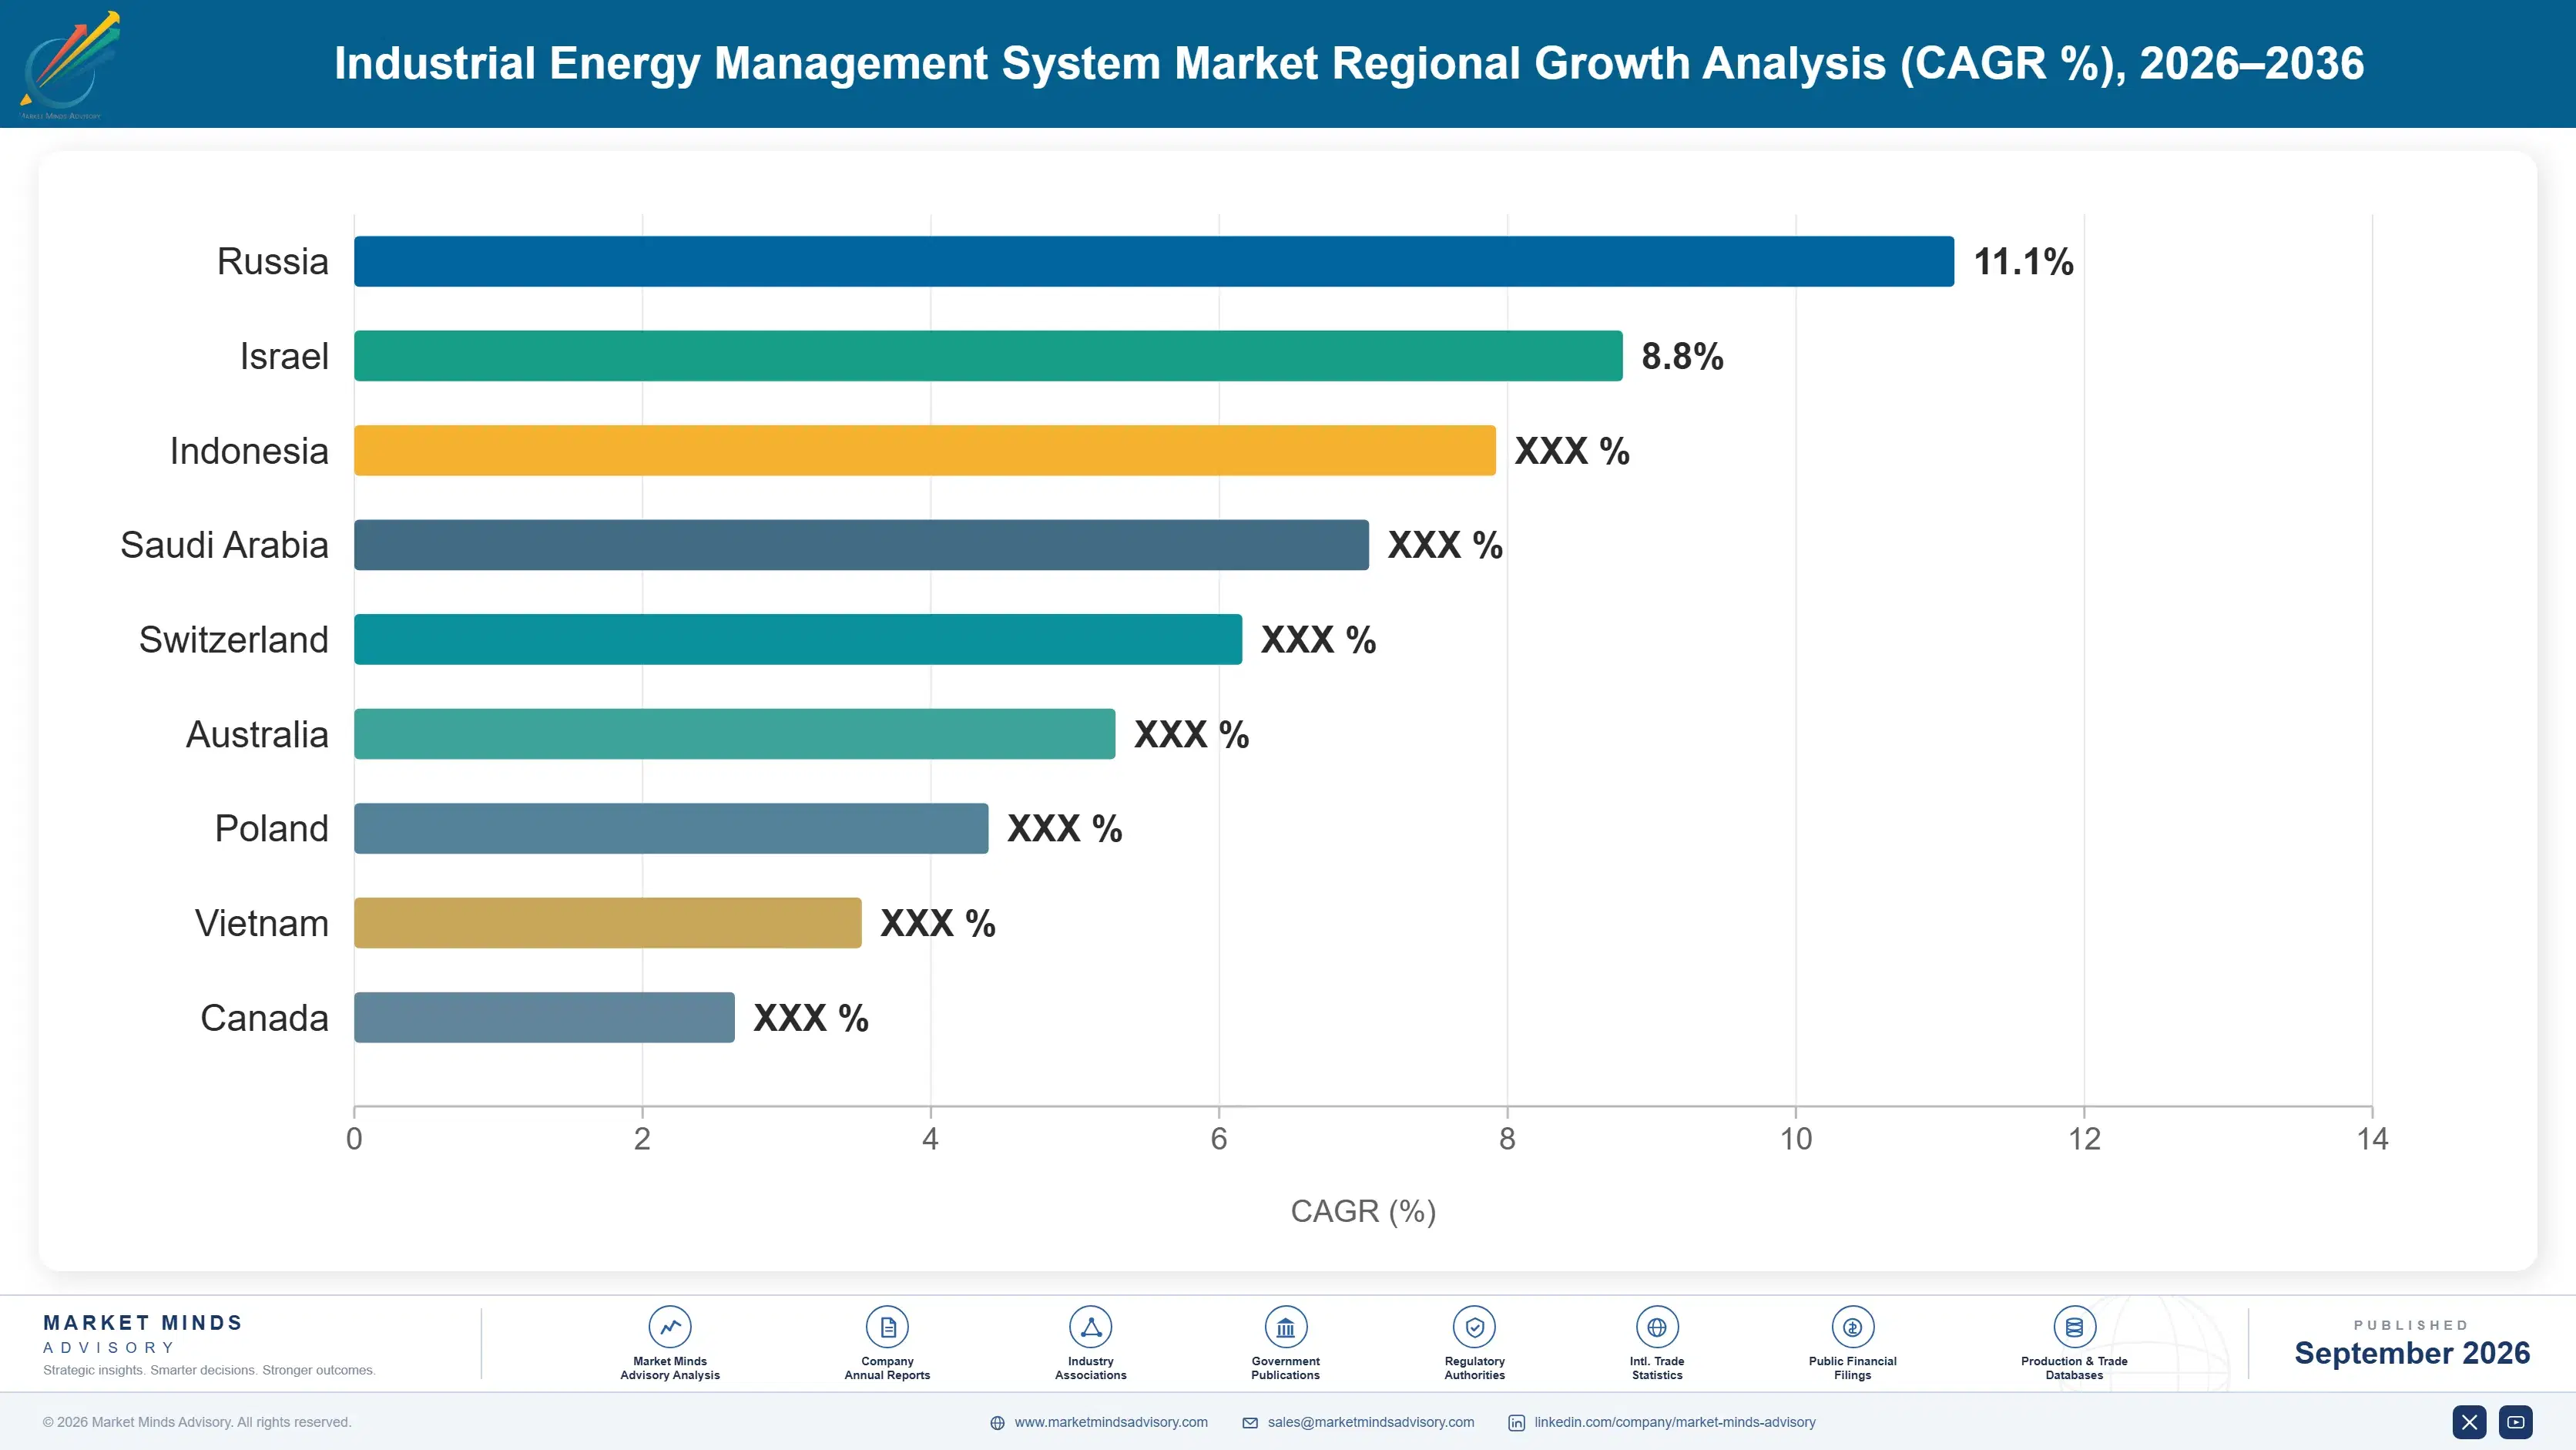
East Asia leads on manufacturing density, binding provincial energy intensity targets, and export-driven carbon credential demand, North America follows closely on carbon disclosure regulation and demand response program participation, and South Asia and Pacific grows fastest off a smaller installed base of connected facilities today.

North America

United States manufacturers are responding to Securities and Exchange Commission climate disclosure proposals and state-level carbon reporting rules by installing facility-level energy monitoring ahead of mandatory compliance deadlines. Large automotive and chemical plants lead adoption, driven partly by corporate net-zero pledges tied to executive compensation targets. Canada's industrial base follows a similar trajectory, though at smaller scale given its more concentrated resource-extraction manufacturing footprint. Utility demand response program participation is unusually mature across this region, giving software vendors an additional revenue-generating use case beyond pure cost avoidance that resonates strongly with finance-oriented procurement teams evaluating competing vendor proposals during annual budget planning cycles that increasingly weigh both compliance and revenue-generating program upside together.
Share: 27% | CAGR: 10.0% (2026 to 2036)

Western Europe

Germany, France, and Italy's energy-intensive manufacturing base, spanning steel, chemicals, and automotive production, faces some of the highest industrial electricity prices globally, making energy management software close to mandatory rather than discretionary. The European Union's Corporate Sustainability Reporting Directive is compressing implementation timelines across mid-size manufacturers previously exempt from disclosure requirements. Regional vendors with deep expertise navigating fragmented national grid codes hold a durable service advantage over foreign entrants unfamiliar with country-specific interconnection rules. Growth trails the global average since much of the addressable large-facility base already completed initial deployment during the preceding several years of accelerated rollout activity across the region's largest and most energy-intensive industrial sites, leaving remaining growth concentrated among smaller facilities.
Share: 20% | CAGR: 8.0% (2026 to 2036)
Regional intelligence for 5 additional markets available in the complete report: East Asia, South Asia and Pacific, Latin America, Middle East and Africa, Eastern Europe. Contact sales@marketmindsadvisory.com.
industrial-energy-management-system-market-country-cagr-analysis-1788455765491

Monetizing Beyond the Core Monitoring Subscription

Beyond standard software subscriptions, vendors are building several distinct adjacent revenue streams around demand response program participation, compliance consulting engagements, predictive maintenance analytics bundling, and equipment OEM licensing partnerships that together capture considerably more of the total value their platforms already generate for industrial customers across large, multi-site facility portfolios worldwide, well beyond what pure subscription pricing alone allows.

Broker Demand Response Program Enrollment Directly

Vendors negotiate demand response program enrollment directly with utilities on behalf of client facilities, taking a percentage of the resulting curtailment payments in exchange for handling verification reporting and program administration. This converts pure cost software into a shared revenue-generating service, an increasingly popular structure among facilities uncertain about program complexity. Vendors offering this bundled service capture a share of the 27 percent of large facilities now participating in formal demand response programs, well beyond what standalone software subscription fees alone would ever generate for a comparable multi-year client engagement of similar scope.
Market Impact: Captures a share of the 27 percent participation pool

Bundle Predictive Maintenance Analytics Modules Together

Since equipment running outside optimal energy parameters typically signals impending mechanical wear, vendors are bundling predictive maintenance analytics alongside core energy optimization modules at a premium price point. This addresses a second budget line, maintenance, using data the platform already collects for energy purposes, requiring minimal incremental engineering investment. Facilities purchasing bundled maintenance analytics report renewal rates roughly 18 percent higher than those buying energy monitoring alone, since a single avoided maintenance failure event makes the platform's value immediately visible to plant leadership, finance teams, and operations staff alike across the organization.
Market Impact: Lifts renewal rates among the 71 percent cloud-deployed base

Offer Carbon Disclosure Compliance Consulting Services

Vendors are layering compliance consulting services onto core software, helping manufacturers translate raw consumption data into the specific reporting formats required under expanding national and regional carbon disclosure regulations. This service captures budget that would otherwise flow to standalone consulting firms lacking direct platform data access. Consulting-attached deals command materially higher average contract value than standalone software subscriptions, and the 42 percent of manufacturers citing disclosure compliance as their primary purchase driver represent the clearest addressable base for this consulting expansion across the vendor's existing client relationships and referral network.
Market Impact: Targets the 42 percent disclosure-driven buyer segment directly

License Forecasting Models To Equipment OEMs

Vendors with proven AI forecasting accuracy are licensing their underlying models to industrial equipment original equipment manufacturers seeking to embed energy intelligence directly into new machinery at the point of sale. This creates a software licensing revenue stream distinct from direct facility subscriptions, reaching new equipment before it even enters service. Given that AI forecasting modules already deliver 23 percent higher measurable savings than static dashboards, OEM licensing partnerships extend that proven advantage into new equipment channels vendors could not otherwise reach directly through facility-level sales efforts alone today at this stage.
Market Impact: Extends the 23 percent AI savings advantage further

Who Controls the Margin Pool

The top five vendors, all diversified industrial conglomerates, hold roughly 52 percent combined market participation, leaving a wide gap between these bundled hardware-software leaders and smaller software-only challengers still building comparable facility relationships and installed sensor bases across major manufacturing regions and industrial sectors worldwide today, particularly outside their traditional home markets and long-established core industrial customer bases built over several decades of continuous plant equipment relationships.
Current competitive activity centers on three fronts: AI forecasting accuracy claims backed by third-party validated case studies, expanding demand response program partnerships negotiated directly with regional utilities, and aggressive bundling of predictive maintenance modules into what were previously standalone energy monitoring contracts sold separately to industrial buyers across most manufacturing sectors and facility sizes, from small single-site plants to sprawling multi-site operations.

Specialist analytics vendors without hardware legacies are gaining ground fastest in greenfield deployments where no existing equipment relationship favors an incumbent, and rankings could shift meaningfully if one of these challengers secures a landmark multi-site contract with a top-tier global manufacturer during the coming several years of continued market expansion and consolidation activity across the broader competitive landscape now taking shape industry wide.
industrial-energy-management-system-market-company-positioning-matrix-1788455766015

Competitive Moat and Risk Dimensions

SCHNEIDER ELECTRIC

Moat: Installed Hardware Base Depth

Decades of industrial equipment installations across manufacturing plants worldwide give Schneider Electric direct access to facility relationships that software-only challengers must build from nothing, shortening its sales cycles considerably relative to newer entrants lacking comparable installed hardware footprint and long-standing customer trust built over many years.
SCHNEIDER ELECTRIC

Risk: AI Analytics Lag Risk

Specialist analytics vendors increasingly out-innovate Schneider Electric on forecasting accuracy and model sophistication, since its own software development historically prioritized broad hardware compatibility over cutting algorithmic depth relative to smaller, more focused competitors moving faster with dedicated engineering resources and considerably narrower product scope overall.
SIEMENS

Moat: Cross-Vertical Engineering Relationships

Deep engineering relationships spanning automotive, chemicals, and heavy industry give Siemens credibility and access that pure software vendors struggle to replicate quickly, particularly among conservative industrial buyers who prioritize proven long-term vendor stability over newer, unproven platforms lacking comparable track records across large multi-site deployments.
SIEMENS

Risk: Slower Product Iteration Speed

Siemens' large organizational structure and broad product portfolio slow software iteration speed relative to smaller, more focused competitors who can ship new forecasting model improvements considerably faster without navigating comparable internal coordination overhead across numerous business units and legacy product lines competing for engineering resources.

Players Tracked

Prominent Players

Schneider Electric
Siemens
Honeywell
Johnson Controls
ABB

Other Key Players

Eaton
Rockwell Automation
Emerson Electric
GE Vernova
Itron
Landis+Gyr
Enel X
Verdigris Technologies
EnergyCAP
Engie Impact
Envision Digital
C3 AI
Uplight
Bidgely
Stem Inc

Recent Developments

JUNE 2025

Schneider Electric Launches AI-Enabled Energy Optimization Platform

Schneider Electric introduced a new AI-based forecasting and optimization platform module designed to integrate directly with its existing industrial hardware installed base, targeting facilities seeking measurable savings without requiring a separate standalone software vendor relationship or entirely new sensor hardware installation across their production floor.
Signal: Signals established hardware vendors racing to close the AI forecasting capability gap against faster-moving specialist challengers.
OCTOBER 2025

Siemens Acquires Industrial Energy Analytics Software Provider

Siemens acquired a privately held industrial energy analytics software provider to accelerate its forecasting and optimization capability, folding the acquired team's algorithmic expertise directly into its existing digital industries software portfolio rather than continuing to build comparable capability internally from scratch over a multi-year development timeline.
Signal: Signals consolidation pressure building steadily as incumbents choose to buy analytics depth rather than build it internally over time.
FEBRUARY 2026

Honeywell Forms Joint Venture With Regional Grid Operator

Honeywell formed a joint venture with a regional grid operator to jointly develop demand response program infrastructure connecting industrial facility energy management software directly to utility dispatch systems, creating a new distribution channel for its software alongside the operator's existing utility customer relationships across its regional footprint.
Signal: Signals growing utility-vendor collaboration as demand response becomes a core commercial battleground across the broader industry landscape.

Sensor Hardware and Cloud Compute Exposure

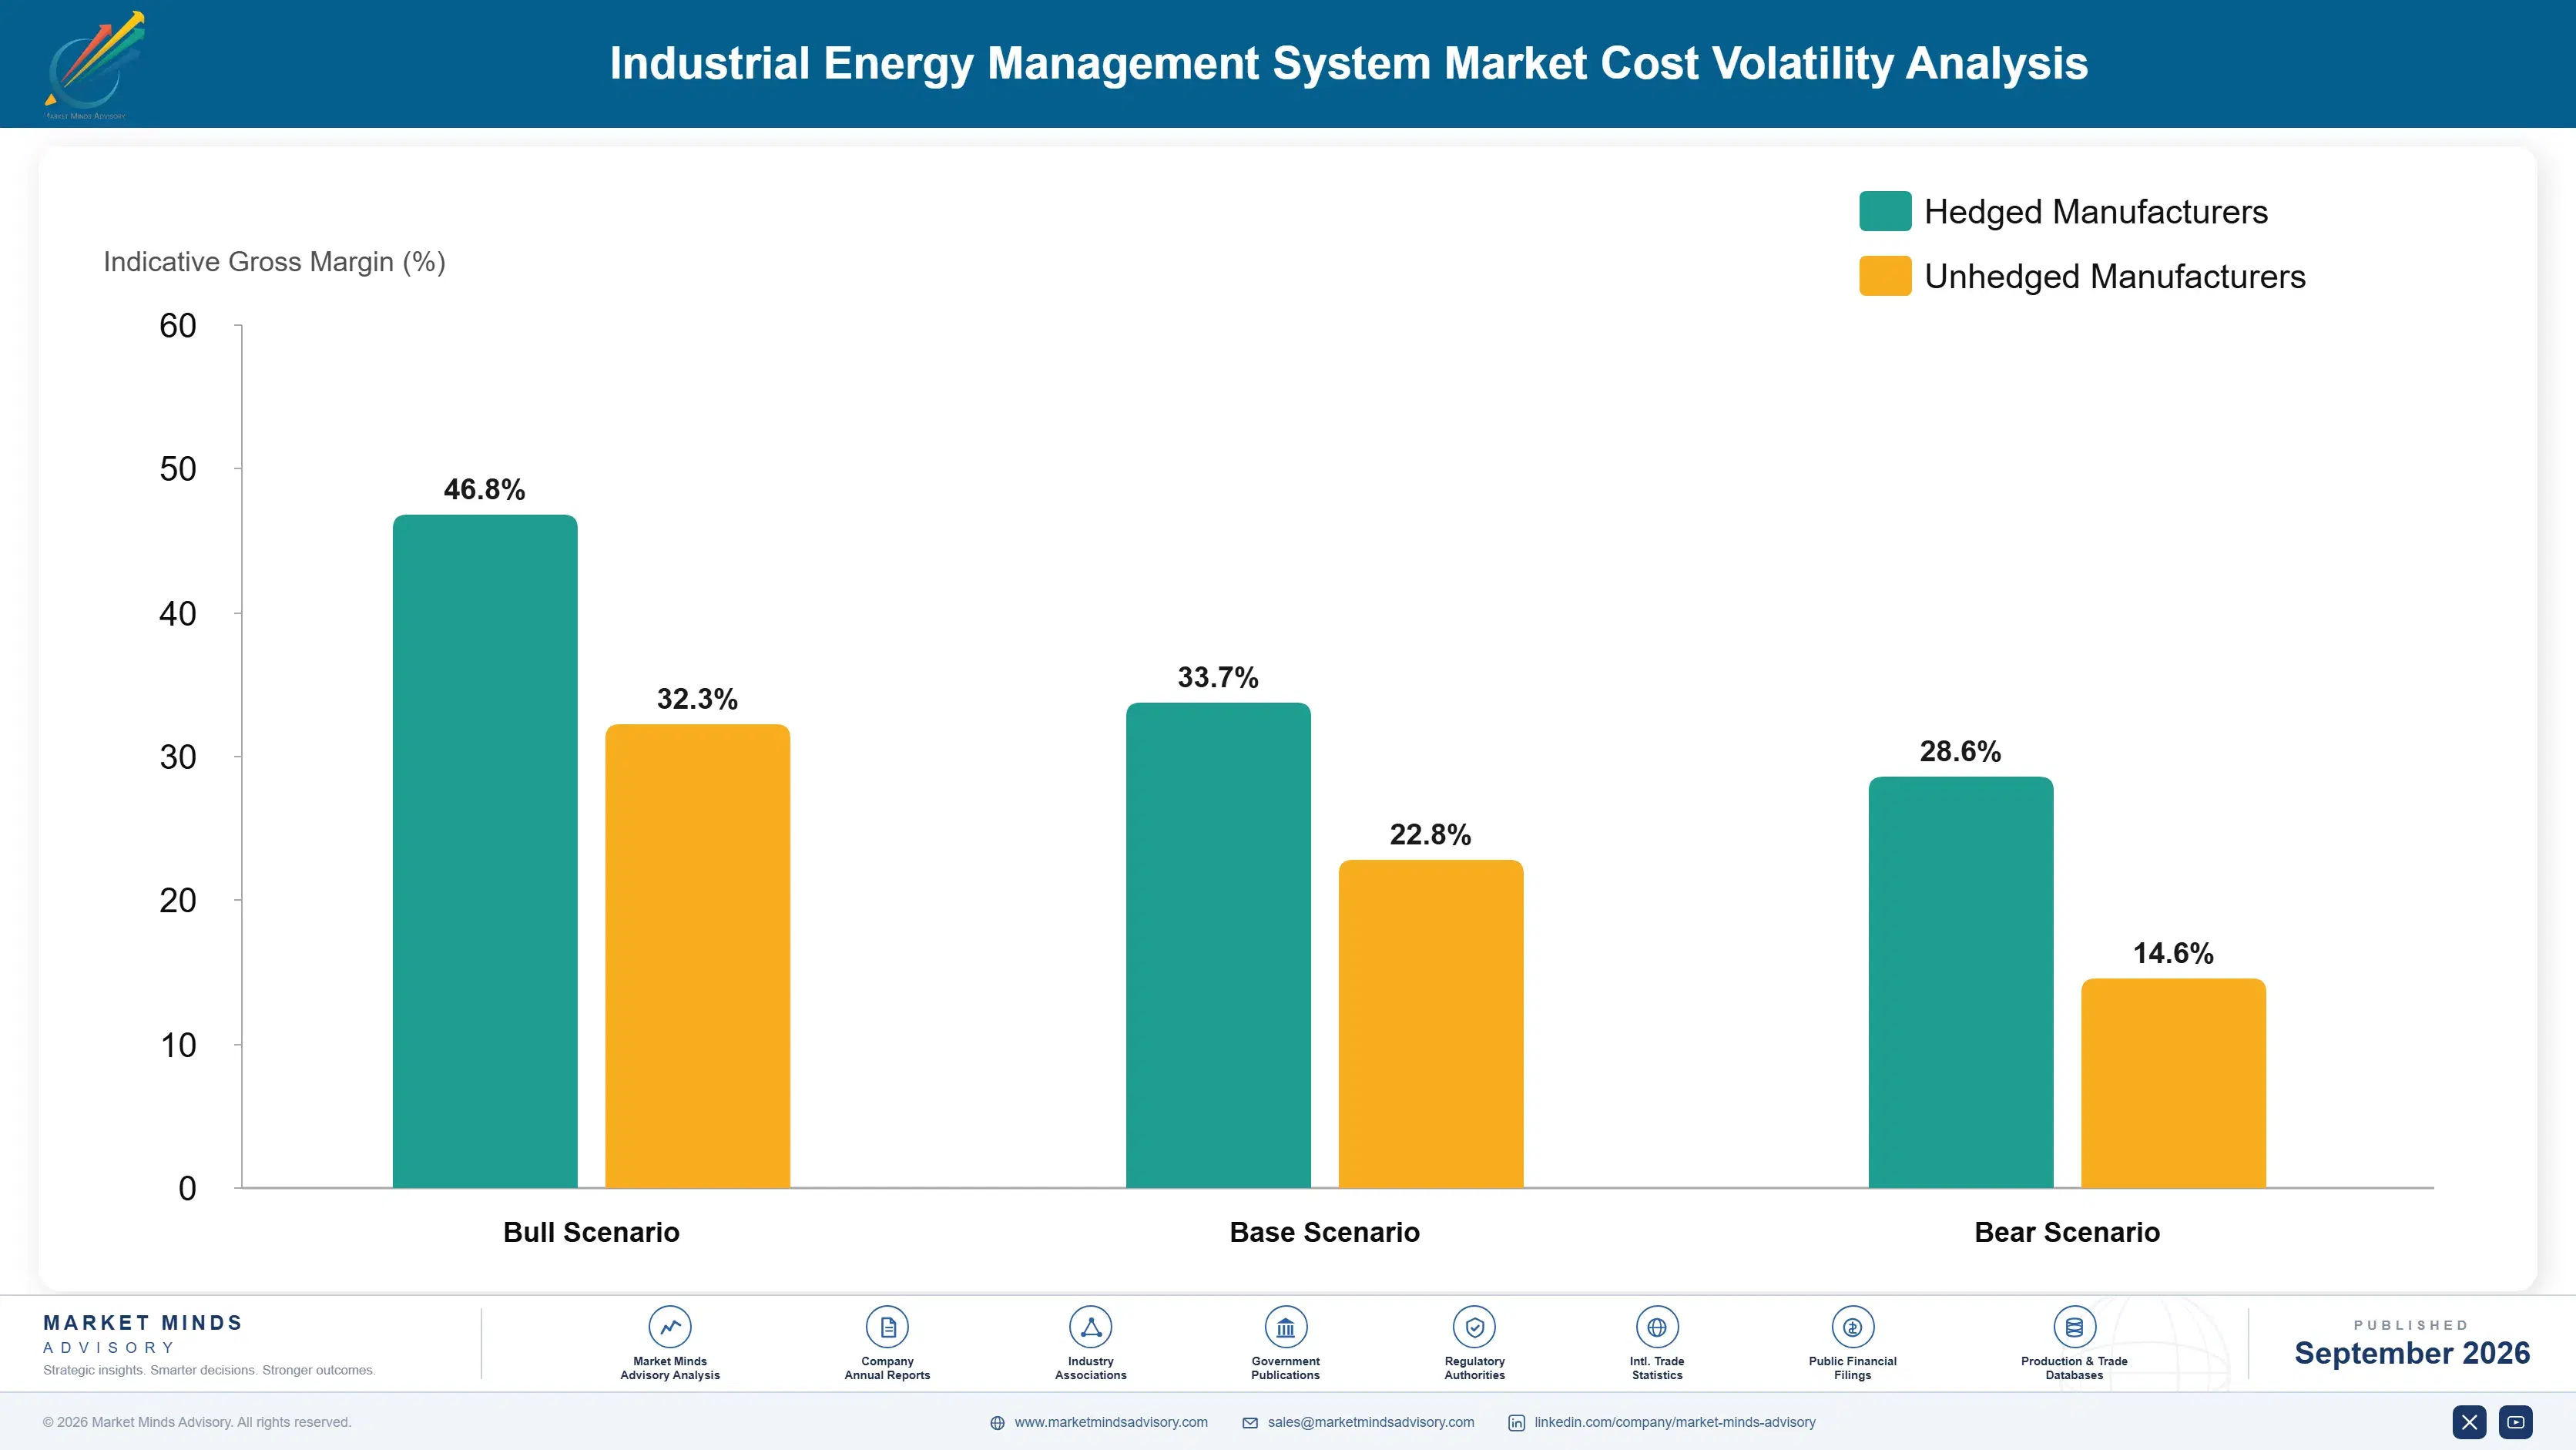
Sensor hardware, gateway equipment, and cloud computing infrastructure together represent roughly 34 percent of cost of goods sold for energy management software vendors, with AI forecasting platforms carrying the highest cloud compute intensity given the volume of continuous sensor data processed in near real time across large, multi-site facility portfolios spanning numerous production lines and utility connections.
Semiconductor component pricing for sensor and gateway hardware rose considerably during 2024 amid broader chip supply tightness, with unit costs increasing by roughly 15 percent within a single fiscal year according to named component supplier annual disclosures and IEA industrial electronics cost benchmarking. Vendors passed a meaningful portion of this cost increase through to newly signed hardware-bundled facility contracts across most affected regions during the tightest months of the supply shortfall.

This cost exposure disadvantages smaller software-only vendors dependent on third-party hardware partners more severely than diversified conglomerates that manufacture sensors internally at scale and negotiate directly with component suppliers. Vendors serving facilities requiring dense sensor coverage face proportionally higher hardware cost exposure than those serving facilities with simpler, single-point metering requirements and fewer connected production lines overall.
industrial-energy-management-system-market-cost-volatility-analysis-1788455766210

Negotiate Multi-Year Component Supply Agreements Directly

Vendors committing to multi-year sensor and gateway component purchasing volumes secure more predictable unit pricing from semiconductor suppliers, insulating margin from short-term chip pricing volatility that smaller competitors without comparable purchasing scale cannot avoid as easily during tight supply periods across the broader semiconductor and industrial electronics component market as a whole, particularly for smaller vendors lacking dedicated procurement teams.

Shift Toward Software-First Deployment Model Approaches

Vendors are increasingly designing platforms to work with existing facility sensors and third-party data sources rather than requiring proprietary hardware installation, reducing hardware cost exposure considerably while shortening deployment timelines for facilities that already have baseline connectivity infrastructure and sensor coverage already deployed in place, cutting time to initial measurable savings for facilities already partially instrumented.

Optimize Cloud Compute Through Model Efficiency

Vendors are investing in more computationally efficient forecasting model architectures that reduce cloud compute costs per facility without sacrificing forecasting accuracy, an increasingly important margin lever as AI-based platforms process growing volumes of continuous sensor data across larger, more complex facility portfolios over time without a proportional rise in underlying cloud infrastructure spend per facility.

Portfolio Architecture for Margin Defence

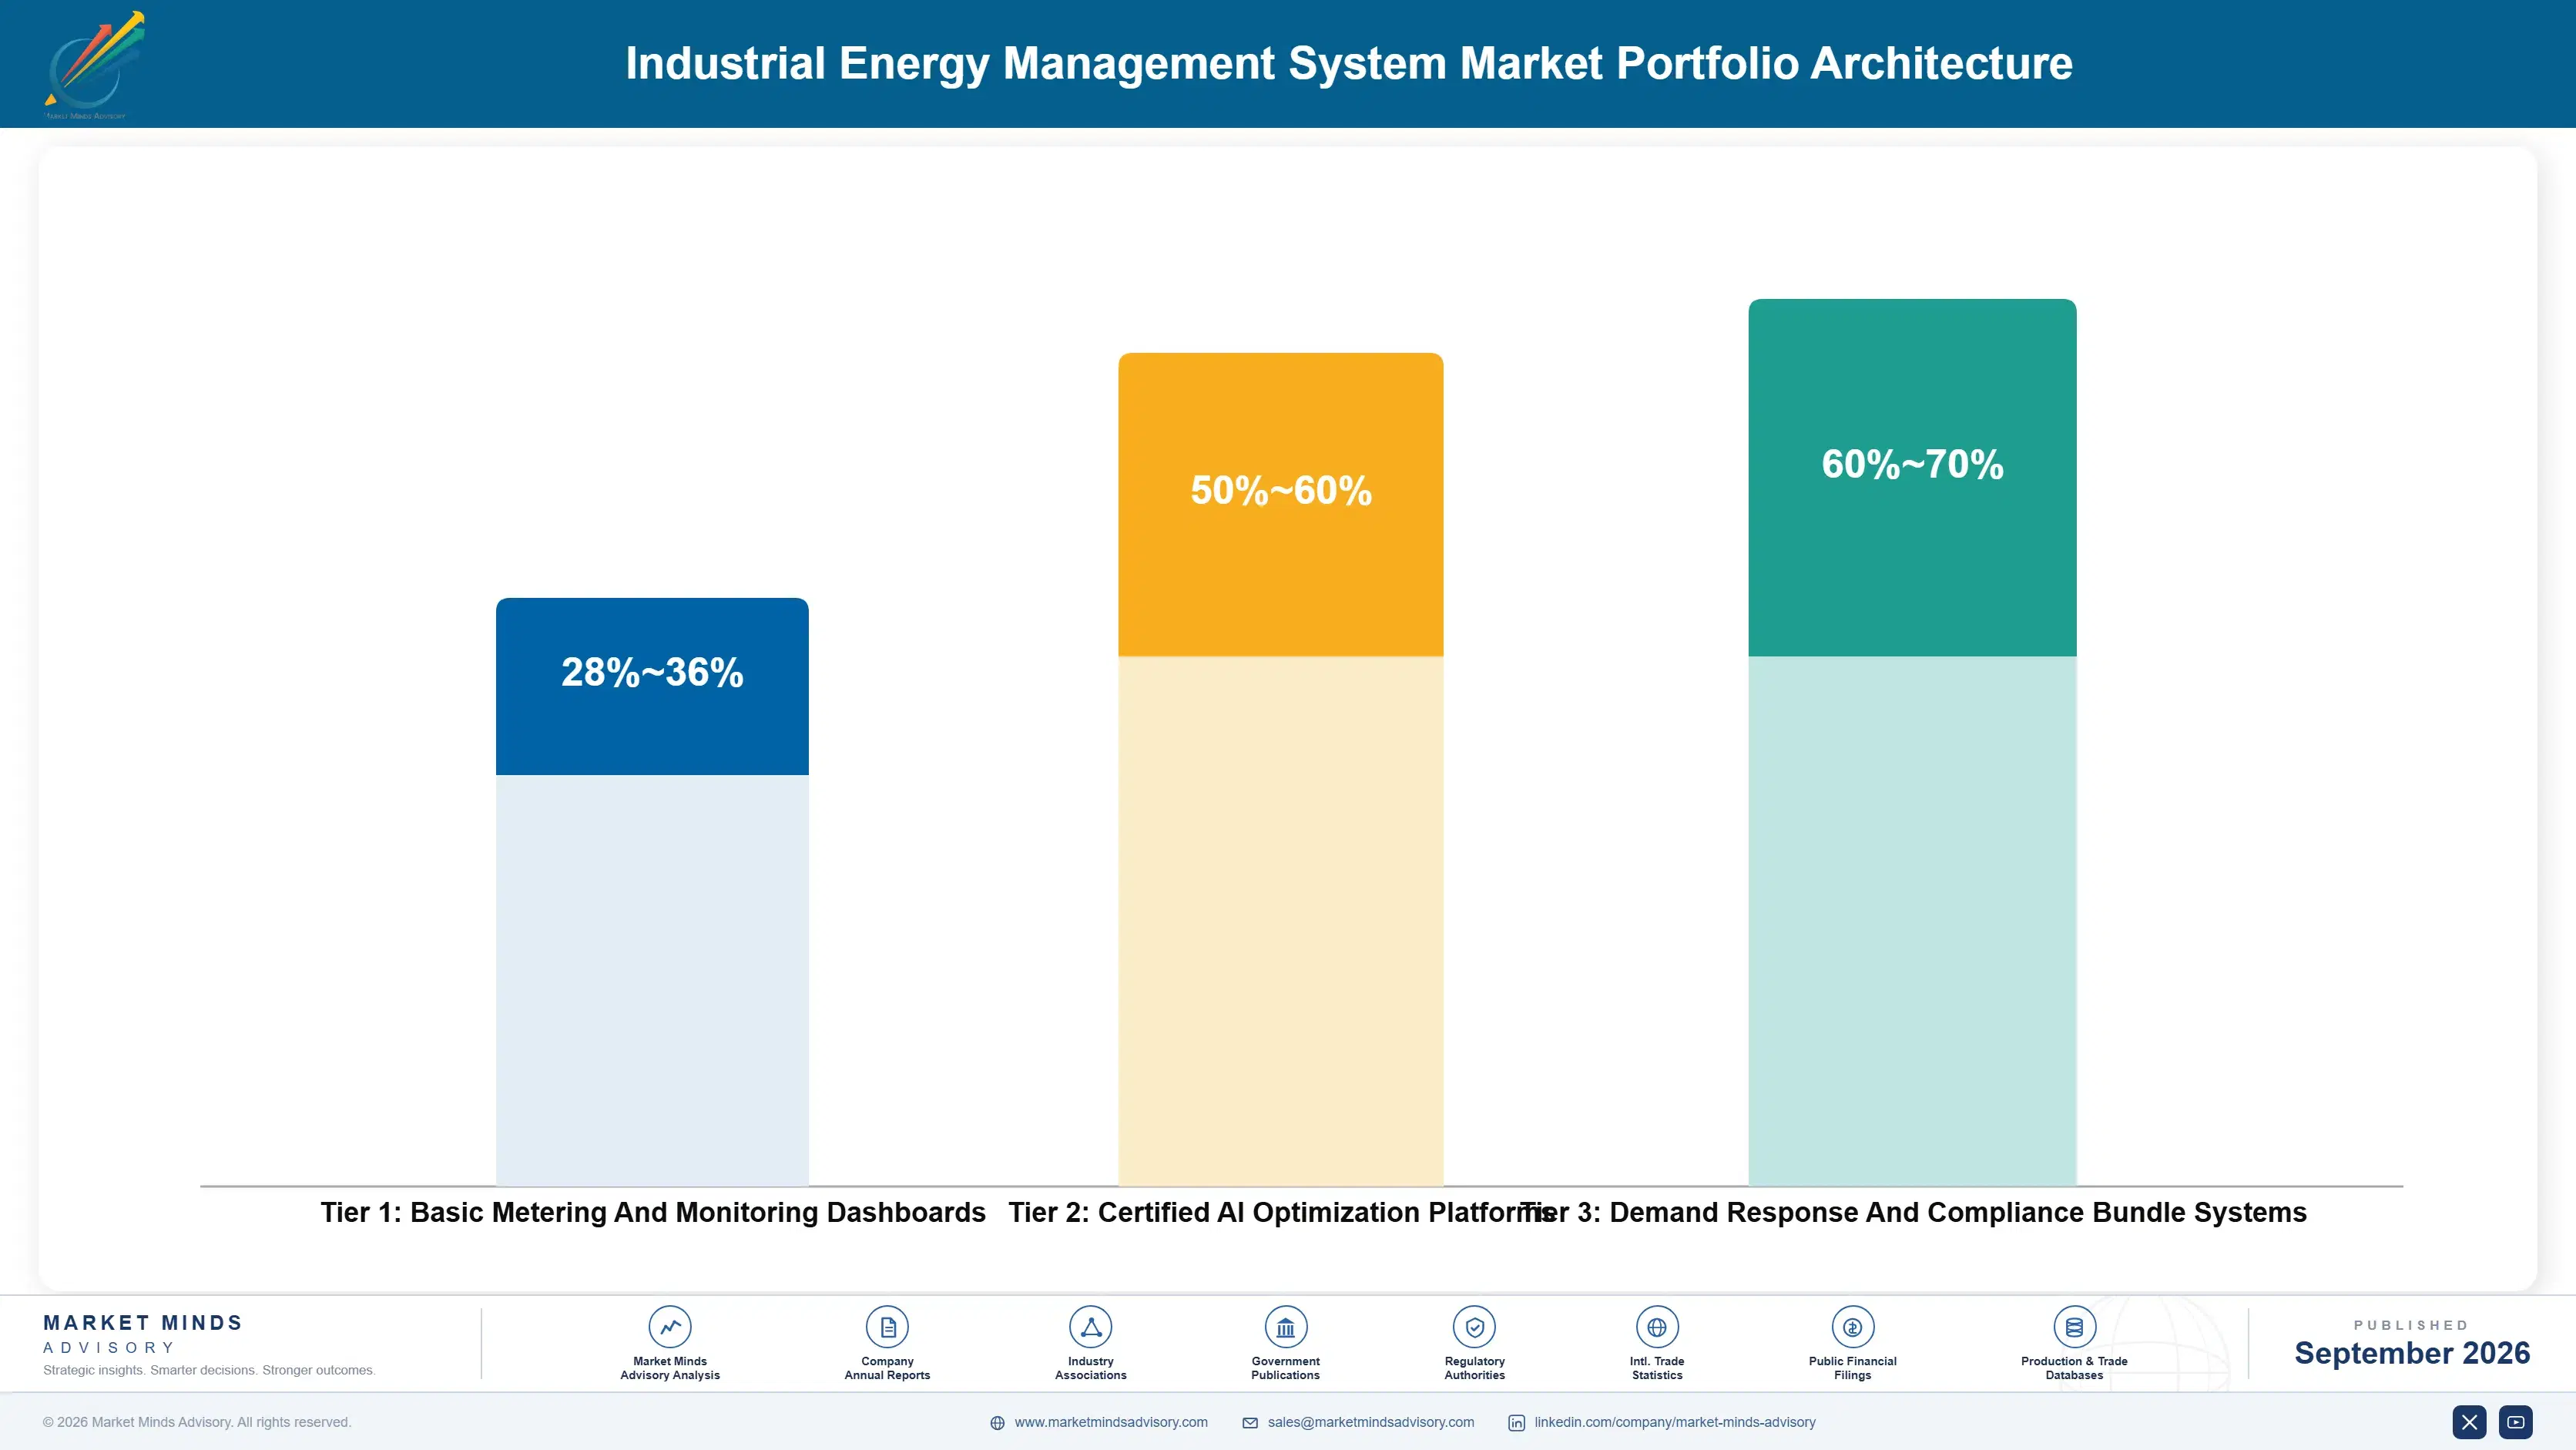
Industrial energy management software margins split along a volume-to-premium axis similar to other industrial software categories. Basic monitoring and metering tools generate modest gross margins under bundled hardware-software competition, while certified optimization platforms and next-generation AI forecasting bundles command materially higher margins on the strength of demonstrated savings performance and forecasting accuracy that basic dashboards cannot replicate without significant, sustained additional engineering investment over time.
The volume tier serves smaller facilities seeking baseline consumption visibility, where hardware bundling compresses standalone software margin and switching costs stay moderate. Premium tiers serving large, multi-site manufacturers carry meaningfully higher willingness to pay, since the scale of potential savings and regulatory disclosure exposure at that tier makes optimization software close to self-funding within a single budget year, unlike smaller facility deployments.

High-value margin pools concentrate in AI forecasting and demand response integration bundles, where measurable performance advantage and program revenue-sharing arrangements justify premium pricing well above standard monitoring subscriptions, and where vendors with proven forecasting accuracy increasingly capture disproportionate deal value relative to their overall installed facility count, particularly among the largest multinational manufacturing clients operating across several regulatory jurisdictions simultaneously.

Basic Metering And Monitoring Dashboards

Entry-level consumption monitoring tools serving smaller facilities seeking baseline visibility under intense hardware-bundled competitive pressure and thin standalone software margin across most facility size tiers and manufacturing sub-sectors covered in this report.
Gross Margin: 28-36%

Certified AI Optimization Platforms

Multi-site optimization platforms with certified forecasting accuracy commanding meaningfully higher willingness to pay from large manufacturers facing regulatory disclosure exposure and rising industrial electricity price volatility across most major manufacturing economies today.
Gross Margin: 50-60%

Demand Response And Compliance Bundle Systems

AI forecasting bundled with demand response program integration and carbon disclosure compliance consulting serving audit-exposed, revenue-sharing facility clients pursuing both cost control and regulatory compliance objectives at the same time.
Gross Margin: 60-70%
industrial-energy-management-system-market-portfolio-architecture-1788455766709

High-value Sub-segments and Strategic Watch-out

Demand Response Program Integration Bundles

High-value, high-growth pool serving facilities enrolling in utility demand response programs, where verified curtailment revenue sharing commands premium engagement pricing well above standard monitoring subscription tiers, and deal size scales with contracted load capacity and the specific program duration terms negotiated with each utility partner.
Gross Margin: 62-70%

Multi-Site Carbon Disclosure Compliance Bundles

High-value, moderate-growth pool serving large multinational manufacturers navigating expanding carbon disclosure regulation, where bundled consulting services generate durable recurring engagement revenue as reporting requirements continue tightening globally across most major manufacturing jurisdictions covered under this report's scope, sustaining demand well into the next decade across most covered jurisdictions.
Gross Margin: 55-64%

Single-Facility Baseline Monitoring

Volume core segment serving smaller single-facility manufacturers with straightforward monitoring needs, where hardware-bundled competition keeps standalone software pricing power limited despite steady renewal volume across the broader installed facility base heading into subsequent annual budget cycles for most smaller manufacturers operating a single production site.
Gross Margin: 28-35%

Legacy Brownfield Retrofit Deployments

Strategic watch-out segment where aging facility infrastructure and inconsistent connectivity threaten to slow deployment timelines and inflate service costs relative to greenfield sites built with modern sensor infrastructure already designed and installed in place from initial construction planning rather than retrofitted years later at considerably higher incremental cost.
Gross Margin: 38-46%

Recurring Optimization Revenue Compounds

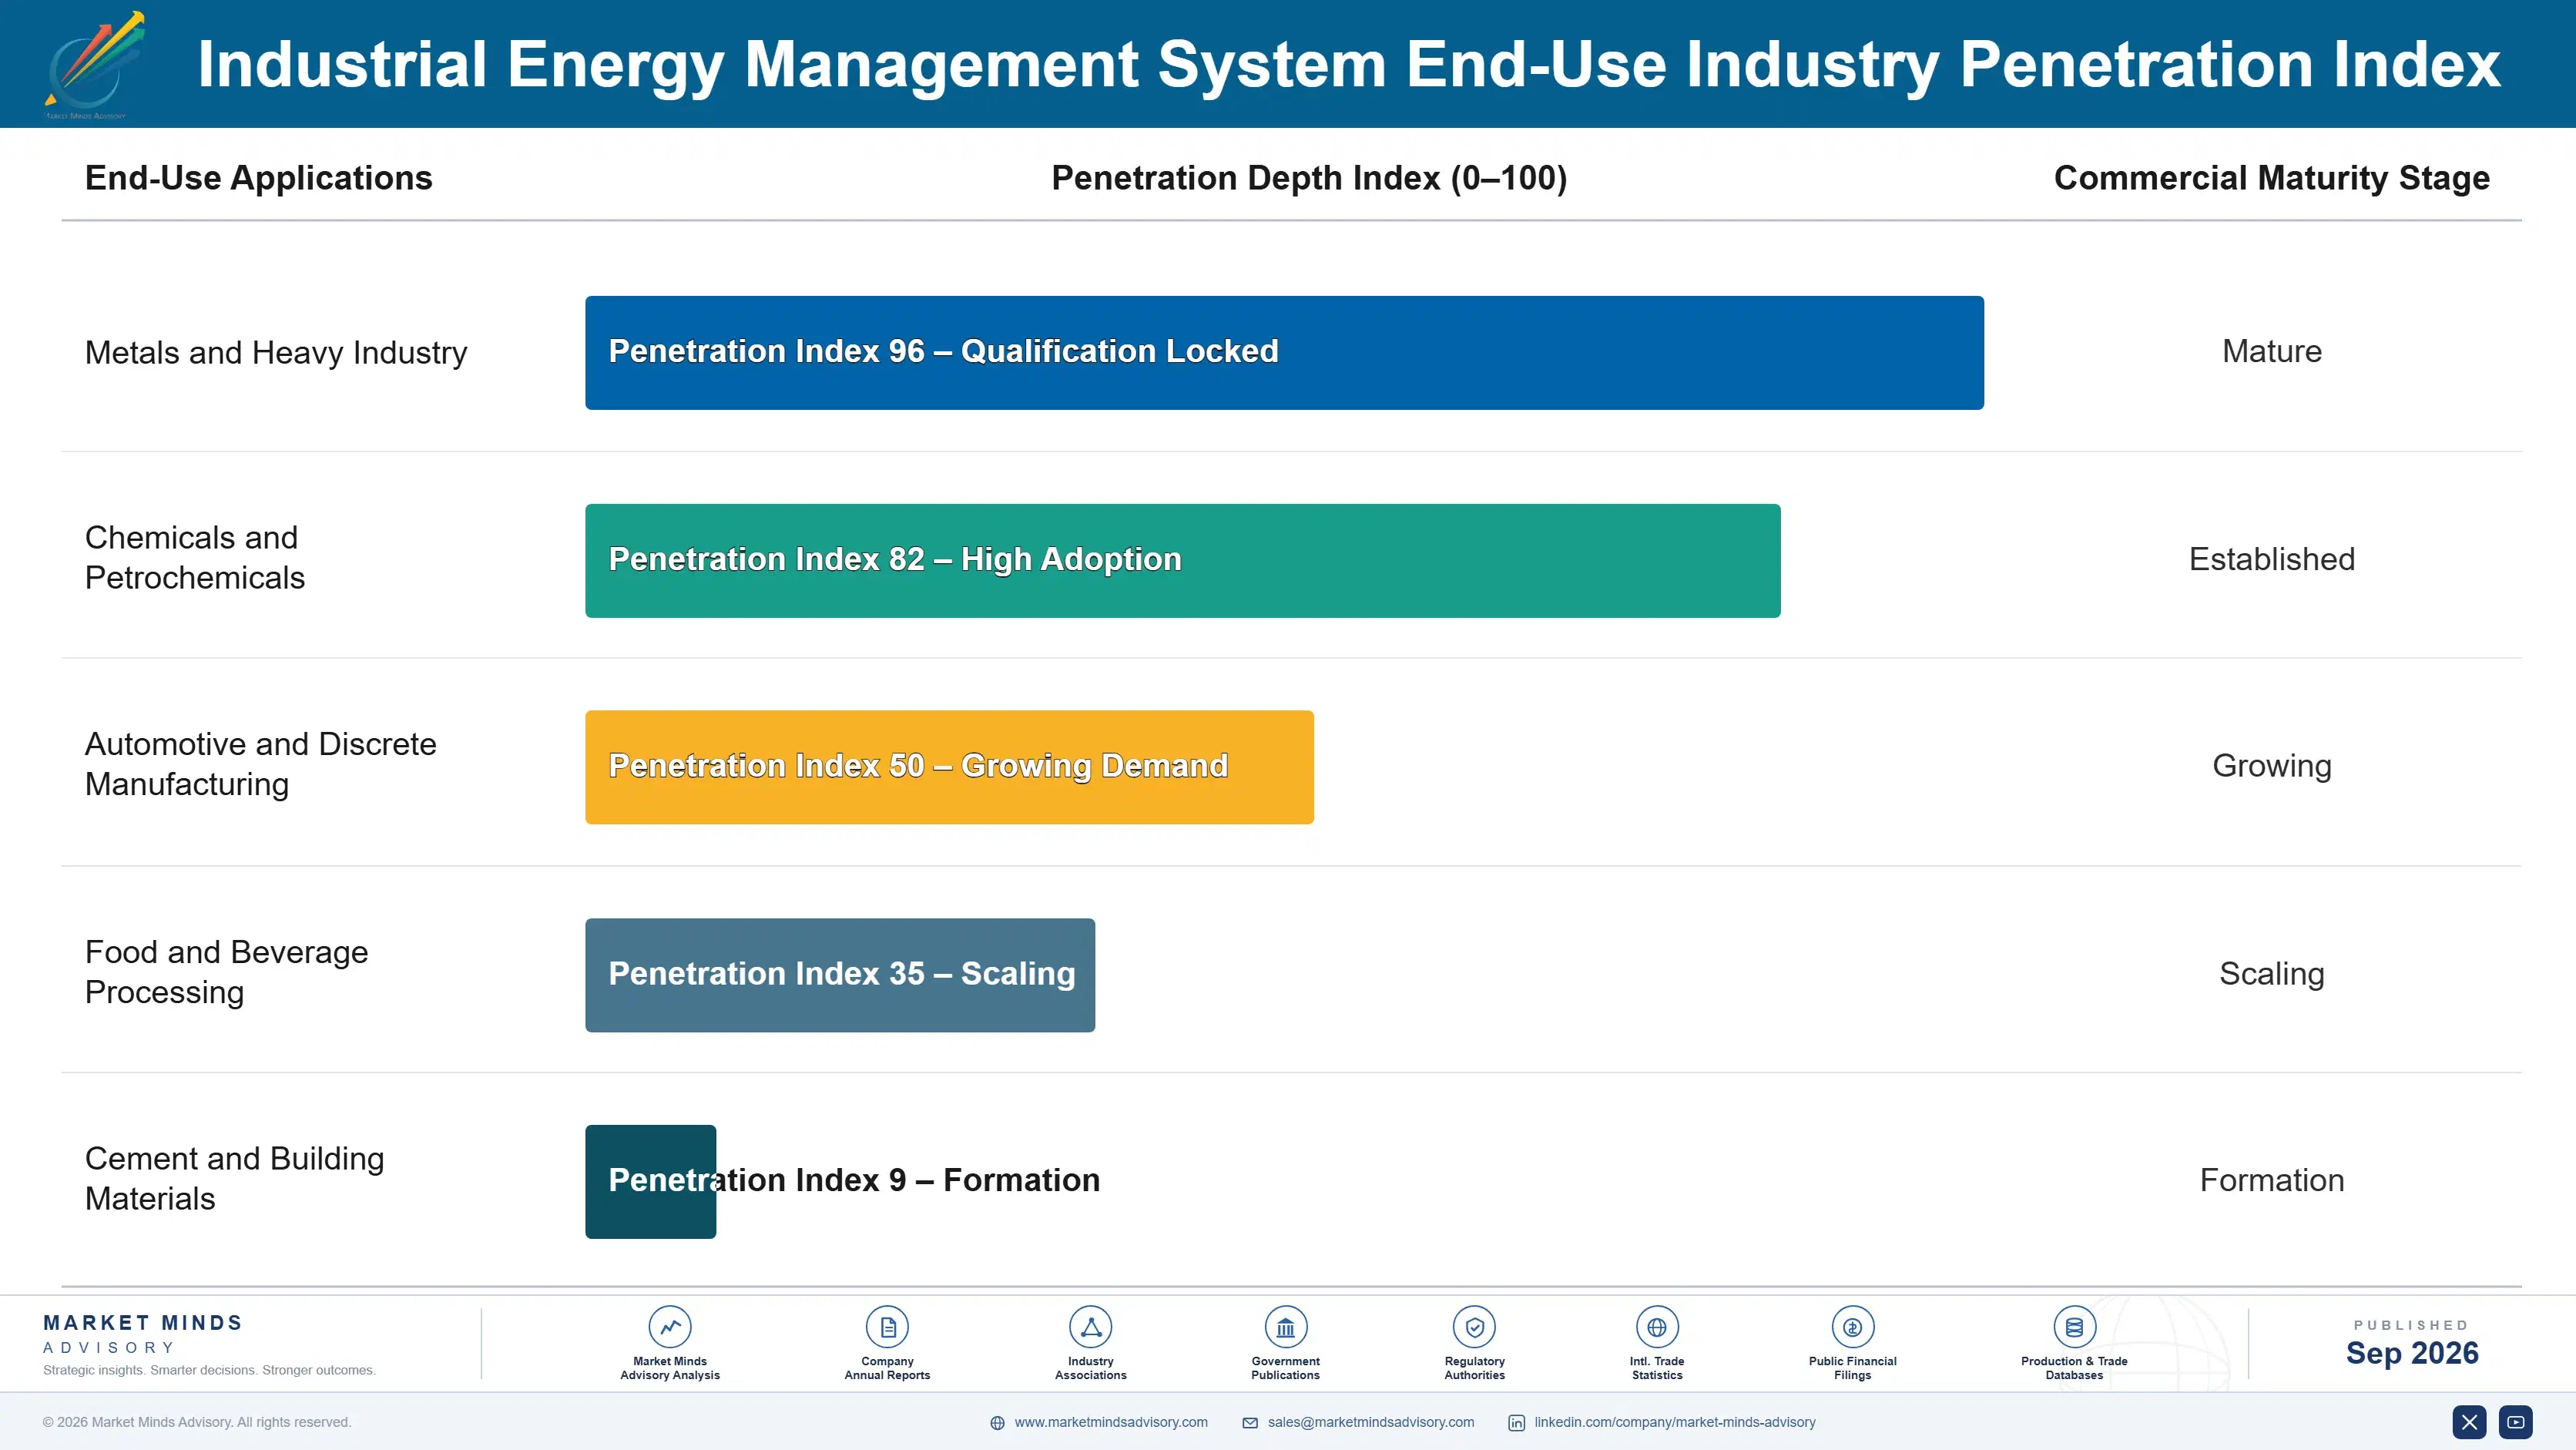
Industrial energy management software revenue behaves like an annuity anchored to continuous facility operation rather than a one-time equipment sale. Once sensors, historical consumption baselines, and forecasting models are calibrated to a specific facility's production patterns, switching vendors requires re-establishing that calibration from scratch, a costly and disruptive process most plant managers avoid unless measured performance falls short considerably over several consecutive reporting periods.
Adoption depth varies meaningfully by end-use vertical. Energy-intensive process industries such as metals, cement, and chemicals show the deepest platform lock-in, since optimization models tuned to specific process parameters over multiple years become genuinely difficult to replicate elsewhere, while discrete manufacturers with simpler, more standardized energy profiles show comparatively weaker loyalty and shop more actively on price at each contract renewal point.

Buyer profiles are shifting generationally as sustainability and energy procurement roles, largely absent from plant organizational charts a decade ago, now sit alongside operations and finance leadership in software purchase decisions, pushing average contract value and platform sophistication expectations steadily upward across the industrial buyer base as this newer generation of decision makers gains budget authority and organizational influence within manufacturing companies.
industrial-energy-management-system-market-end-use-penetration-index-1788455767204

Where MMA Sees the Opportunity

These are among the four positions where our research anticipates prominent divergence between winners and laggards over the coming forecast period. Each is grounded in the demand model, the regulatory perimeter, and the announced capacity pipeline.
01 / AI FORECASTING INVESTMENT

Prioritize AI forecasting depth as the primary differentiator

Energy Analytics and AI-Based Forecasting Platforms is growing at roughly 14.0 percent annually against a market-wide 9.5 percent average, the widest gap of any covered segment. Vendors that under-invest in forecasting accuracy will lose enterprise deals to competitors offering demonstrably shorter payback periods, since procurement teams increasingly benchmark vendors directly against each other on this single measurable metric. MMA views forecasting depth as the primary competitive battleground through 2036, ahead of pricing, hardware bundling, or brand reputation alone, since accuracy claims are now independently verifiable by third parties.
02 / DEMAND RESPONSE EXPANSION

Build demand response brokerage revenue beyond core subscriptions

Demand response program integration carries the industry's highest gross margins, well above standard monitoring subscription tiers available to smaller facilities. Vendors that broker program enrollment on behalf of clients capture a share of curtailment payments that would otherwise flow entirely to utilities and third-party aggregators alone. MMA expects program-brokerage revenue to expand meaningfully faster than core software growth across the coming decade as utility program eligibility broadens to smaller facility tiers previously excluded entirely from formal curtailment participation programs until quite recently.
03 / CHINA MARKET DEPTH

Deepen presence in China given its scale and mandates

China is growing at roughly 12.0 percent annually, the fastest of any covered country, driven by binding provincial energy intensity targets tied directly to industrial permitting decisions. Vendors without established local manufacturing relationships risk ceding this expansion to domestic specialists already embedded within provincial regulatory processes. MMA views deepened local partnership investment as materially cheaper than delayed market entry once domestic incumbents consolidate their position further across the region's largest and most energy-intensive industrial provinces over the coming several years.
04 / RETENTION INFRASTRUCTURE INVESTMENT

Defend renewal economics through deeper calibration lock-in

Switching cost from re-calibrating forecasting models to a specific facility's production patterns is the strongest retention lever available to incumbents, and it strengthens with every additional year a facility stays with one vendor. Vendors should invest in deeper process-specific calibration accuracy rather than competing purely on entry-level monitoring pricing alone. MMA expects vendors with the strongest calibration depth to command premium renewal pricing well ahead of price-competitive challengers by 2036, particularly among energy-intensive process industries where calibration accuracy matters most to overall plant economics.

Engagement Snapshot From the Field

A live engagement with an industry participant carrying material or product regulatory and market exposure ahead of a defining policy shift, showing how our research translates into a defensible multi-year portfolio strategy.
MARKET MINDS ADVISORY · CLIENT ENGAGEMENT SUMMARY
Industrial Energy Management System Producer Strategic Portfolio Review and Transition Roadmap 2026·Investment Scenario on Industrial Energy Management System Exposure Evaluation 2025-26
CLIENT PROFILE
The client is a multi-site industrial manufacturer operating chemicals and metals processing facilities across North America and Western Europe, with combined annual electricity spend representing a significant share of total production cost. Facing tightening carbon disclosure mandates in both regions, the manufacturer sought an independent assessment of energy management software options before committing capital to a single-vendor platform.
STRATEGIC CHALLENGE
The manufacturer's facilities ran a patchwork of legacy metering systems installed at different times by different equipment vendors, making consolidated reporting across sites nearly impossible without extensive manual reconciliation. Leadership needed clarity on whether a phased single-vendor rollout or a continued multi-vendor approach better balanced deployment speed against long-term integration cost.
MMA APPROACH
MMA conducted structured interviews with plant operations, sustainability, and finance leadership across four representative facilities, alongside a comparative technical assessment of five leading energy management software vendors' integration architectures and total cost of ownership profiles. The engagement benchmarked projected savings against each facility's own historical utility billing data across the preceding two fiscal years.
KEY FINDINGS
  1. Legacy metering fragmentation across sites added a measurable reporting delay each quarter that a consolidated single-vendor platform would substantially eliminate going forward.
  2. Facilities with the highest energy intensity showed the largest projected savings from AI forecasting adoption relative to smaller, less energy-intensive sites in the portfolio.
  3. A phased single-vendor rollout reduced projected total integration cost meaningfully compared to continued multi-vendor management, per client-reported estimates shared during the engagement.
  4. Pilot facility staff reported measurably higher confidence in reported consumption figures once consolidated platform reporting replaced the prior fragmented, manually reconciled spreadsheet-based process.
CLIENT PROFILE
The client is a multi-site industrial manufacturer operating chemicals and metals processing facilities across North America and Western Europe, with combined annual electricity spend representing a significant share of total production cost. Facing tightening carbon disclosure mandates in both regions, the manufacturer sought an independent assessment of energy management software options before committing capital to a single-vendor platform.
STRATEGIC CHALLENGE
The manufacturer's facilities ran a patchwork of legacy metering systems installed at different times by different equipment vendors, making consolidated reporting across sites nearly impossible without extensive manual reconciliation. Leadership needed clarity on whether a phased single-vendor rollout or a continued multi-vendor approach better balanced deployment speed against long-term integration cost.
MMA APPROACH
MMA conducted structured interviews with plant operations, sustainability, and finance leadership across four representative facilities, alongside a comparative technical assessment of five leading energy management software vendors' integration architectures and total cost of ownership profiles. The engagement benchmarked projected savings against each facility's own historical utility billing data across the preceding two fiscal years.
KEY FINDINGS
  1. Legacy metering fragmentation across sites added a measurable reporting delay each quarter that a consolidated single-vendor platform would substantially eliminate going forward.
  2. Facilities with the highest energy intensity showed the largest projected savings from AI forecasting adoption relative to smaller, less energy-intensive sites in the portfolio.
  3. A phased single-vendor rollout reduced projected total integration cost meaningfully compared to continued multi-vendor management, per client-reported estimates shared during the engagement.
  4. Pilot facility staff reported measurably higher confidence in reported consumption figures once consolidated platform reporting replaced the prior fragmented, manually reconciled spreadsheet-based process.
RECOMMENDED STRATEGY
Phase 1: Phase one: pilot a single vendor platform across two representative facilities over four months, tracking forecasting accuracy and reporting consolidation gains. Phase 2: Phase two: expand the platform to remaining North American and Western European sites while sunsetting legacy metering systems incrementally across each site. Phase 3: Phase three: negotiate a multi-year enterprise agreement bundling demand response program enrollment and carbon disclosure compliance consulting services across all covered facilities.
OUTCOME
The manufacturer adopted the recommended phased single-vendor rollout, reporting a substantial reduction in quarterly consolidated reporting time within three quarters of full deployment (client-reported, unverified by MMA). Sustainability and finance staff previously consumed by manual reconciliation were redirected toward proactive carbon disclosure strategy work instead.

Frequently Asked Questions

Foundational context covering the market sizes, CAGR, scope, country, region and competition that inform every finding below. This section is provided to cover basics and most often pre-purchase conversations, answered from the MMA Primary Research Dataset.

What is the current size of the Industrial Energy Management System Market?

The Industrial Energy Management System Market reached an estimated 1.15 billion dollars in 2025. Growth is driven by tightening carbon disclosure mandates and rising industrial electricity prices worldwide.

How large will the Industrial Energy Management System Market be by 2036?

MMA projects the market will reach approximately 3.12 billion dollars by 2036. This reflects sustained regulatory pressure and expanding AI forecasting adoption across manufacturing facilities.

What is the CAGR for the Industrial Energy Management System Market 2026 to 2036?

The market is projected to grow at a 9.5 percent compound annual growth rate between 2026 and 2036. Bull and bear scenarios range from 8.3 to 10.7 percent.

Which segment is growing fastest?

Energy Analytics and AI-Based Forecasting Platforms is the fastest-growing segment, expanding at roughly 14.0 percent annually. This outpaces the overall market by nearly 1.5 times.

Who are the major companies in the Industrial Energy Management System Market?

Leading vendors include Schneider Electric, Siemens, Honeywell, Johnson Controls, and ABB. Together these five vendors hold an estimated 52 percent combined share on a market participation basis.

Which country is growing fastest?

China is the fastest-growing country, expanding at roughly 12.0 percent annually. Binding provincial energy intensity targets tied to industrial permitting decisions are driving this accelerated growth.

Report Segmentation Architecture

The full report scope spans multiple orthogonal segmentation dimensions, with cross-tabulated demand data provided for each dimension pair. Coverage extends further to regional breakdowns, trend trajectories, and the competitive detail needed to support segment-level decision-making.

By Software Function

  • Energy Analytics and AI-Based Forecasting Platforms
  • Industrial Process Energy Optimization Software
  • Energy Monitoring and Metering Systems
  • Demand Response and Load Management Systems
  • Building and Facility Energy Management Software
  • Energy Management Consulting and Integration Services

By End-Use Industry

  • Metals and Heavy Industry
  • Chemicals and Petrochemicals
  • Automotive and Discrete Manufacturing
  • Food and Beverage Processing
  • Cement and Building Materials

By Commercial Deployment Model

  • Direct Software License Purchase
  • Bundled Hardware-Software Contracts
  • Managed Optimization Service Agreements
  • Demand Response Revenue-Sharing Bundles

By Region

  • North America
  • Western Europe
  • East Asia
  • South Asia and Pacific
  • Latin America
  • Middle East and Africa
  • Eastern Europe

Scope, Methodology, and Coverage

Every figure in this report is reproducible from documented input assumptions. The scope below maps the historical period, the forecast horizon, the segmentation dimensions, and the countries covered, alongside the underlying primary and qualitative methodology.
Historical Period
2020 to 2025
Forecast Period
2026 to 2036
Base Year
2025 (USD billions; MMA Primary Research Dataset, September 2026)
Market Definition
The Industrial Energy Management System Market covers software and integrated platforms that monitor, analyze, forecast, and automatically optimize energy consumption across industrial facilities and production processes. It excludes standalone hardware sensors sold without management software, building-only energy systems outside industrial facilities, and generic enterprise resource planning software.
Quantitative Units
USD billions, market share percent, CAGR percent
Segmentation Dimensions
Software function, end-use industry, commercial deployment model, region
Regions Covered
North America, Western Europe, East Asia, South Asia and Pacific, Latin America, Middle East and Africa, Eastern Europe
Countries Covered
United States, China, Germany, Japan, India, Brazil, and 14 additional countries across seven regions
Key Companies Profiled
Schneider Electric, Siemens, Honeywell, Johnson Controls, ABB, and 15 additional participants
Quantitative Methodology
Primary survey, n=3,800 respondents, Q4 2025, six countries; demand-side model with trade association cross-validation
Qualitative Methodology
47 expert interviews, Q4 2025; applied to validate demand model assumptions, identify emerging dynamics, and assess competitive positioning
Report Format
PDF and XLSX data workbook (Word format preview document)
Publisher
Market Minds Advisory
Report Code
MMA-2026-ENE-441
Published
September 2026
Contact
sales@marketmindsadvisory.com | www.marketmindsadvisory.com

Purchase the full Industrial Energy Management System Market Report (2026 to 2036).

This report delivers a complete assessment of the Industrial Energy Management System Market spanning sizing, segmentation, regional dynamics, and competitive positioning through 2036. It combines primary survey data from 3,800 respondents across six countries with 47 expert interviews conducted in the fourth quarter of 2025. Analysts detail segment-level growth drivers, regional demand mechanisms, and competitive moats among leading vendors, alongside forward-looking scenario analysis. The report also profiles input cost exposure, portfolio economics, and demand response monetization strategies, supported by an anonymized client engagement case study.
Segment-level CAGR and market share breakdowns
Seven-region demand analysis with quantified drivers
Competitive landscape with moat and risk profiles
Input cost exposure and mitigation strategies
Portfolio tier economics and margin benchmarks
Anonymized client engagement case study analysis

Built For The People Who Decide

From boardroom strategy to bench-side execution, this report is read cover-to-cover by leaders shaping the next decade of their industry, turning demand scenarios, market dynamics and valuation benchmarks into decisions.
CXOs/ Presidents/ VPs/ Managers
M&A and Corporate Development
Strategy Teams and R&D Heads
Procurement and Product Directors
Regulatory and Compliance Leaders
Investor Relations and Equity Analysts