Market Minds Advisory
India Industrial Lubricants Market

India Industrial Lubricants Market: Manufacturing Expansion Driving India's Industrial Lubricants Demand

Manufacturing expansion under India's production-linked incentive schemes, rising machine tool utilisation, and tightening equipment efficiency expectations are pushing Indian industrial buyers toward higher-performance hydraulic, gear, and metalworking lubricant formulations across every major manufacturing state.

Lead Analyst

Bilal Shaikh

Published

August 2026

Make Smarter Decisions with Customized Research Insights

Request a free sample report and evaluate market opportunities, growth trends, and competitive dynamics relevant to your business needs.

2025 MARKET VALUE$3.6BMarket Size 2025
2036 FORECAST VALUE$7.4BBase Case , 2026 to 2036
CAGR 2026 TO 20366.8 %Bull 8.1% / Bear 5.5%
INCREMENTAL OPPORTUNITY$3.6BNet 10- year value creation
EXPANSION MULTIPLE1.93x2036 value over 2026 base
Strategic Levers
M&A Pipeline
Regional Outlook
Country Rankings
Competitive Intelligence
Segmental Deep-dive
Call-Us : 91 93563 13602

Executive Snapshot and Market Trajectory

Indian manufacturers are upgrading from generic mineral lubricants to synthetic and semi-synthetic formulations as equipment warranty terms and energy efficiency targets tighten across automotive, machinery, and process manufacturing plants nationwide, a shift reshaping how suppliers compete for contracts this year. That upgrade cycle is reshaping supplier selection criteria nationwide.
Hydraulic fluid and metalworking lubricant demand is growing fastest as production-linked incentive schemes drive new capacity in electronics assembly, auto components, and heavy engineering, concentrating incremental demand in Maharashtra, Tamil Nadu, and Gujarat. Multinational lubricant majors and domestic refiners are both expanding blending capacity to serve this manufacturing buildout, though import dependence on base oil and additive packages remains a persistent constraint on how quickly domestic supply can scale.
Competitive intensity centers on distribution reach and technical service capability rather than price alone, since industrial buyers increasingly value lubricant suppliers who can provide onsite condition monitoring and equipment-specific formulation guidance. Domestic public sector oil marketing companies retain strong distribution networks, while multinational players compete on synthetic formulation depth and global technical support. Buyers increasingly weigh documented technical service capability alongside price when awarding large multi-year industrial supply contracts to competing suppliers nationwide.
Market Definition
This market covers lubricants formulated for industrial machinery, manufacturing equipment, and process applications within India, including hydraulic fluids, gear and transmission oils, greases, metalworking fluids, and industrial process oils. It excludes automotive engine oils sold through retail and passenger vehicle service channels.
Base Year Value
$3.6B in 2025 (MMA Primary Research Dataset, August 2026)
Forecast Period
2026 to 2036, eleven discrete annual values
CAGR
6.8% base case. Bull 8.1%. Bear 5.5%.
Fastest Growth Segment
Hydraulic Fluids: 9.2% CAGR
Fastest Growth Country
India: 6.8% CAGR
Fastest Growth Region
South Asia and Pacific: 8.8% CAGR
Largest Region
South Asia and Pacific: 88% of 2025 global value
Market Leaders
Castrol India, Indian Oil Corporation, Hindustan Petroleum, Shell India, and Gulf Oil Lubricants India. Source: MMA Analysis based on company annual reports.
Primary Survey
n=3,800 procurement and R&D decision-makers, Q4 2025, six countries
Methodology
Demand-side build-up, cross-validated against public data, 47 expert interviews

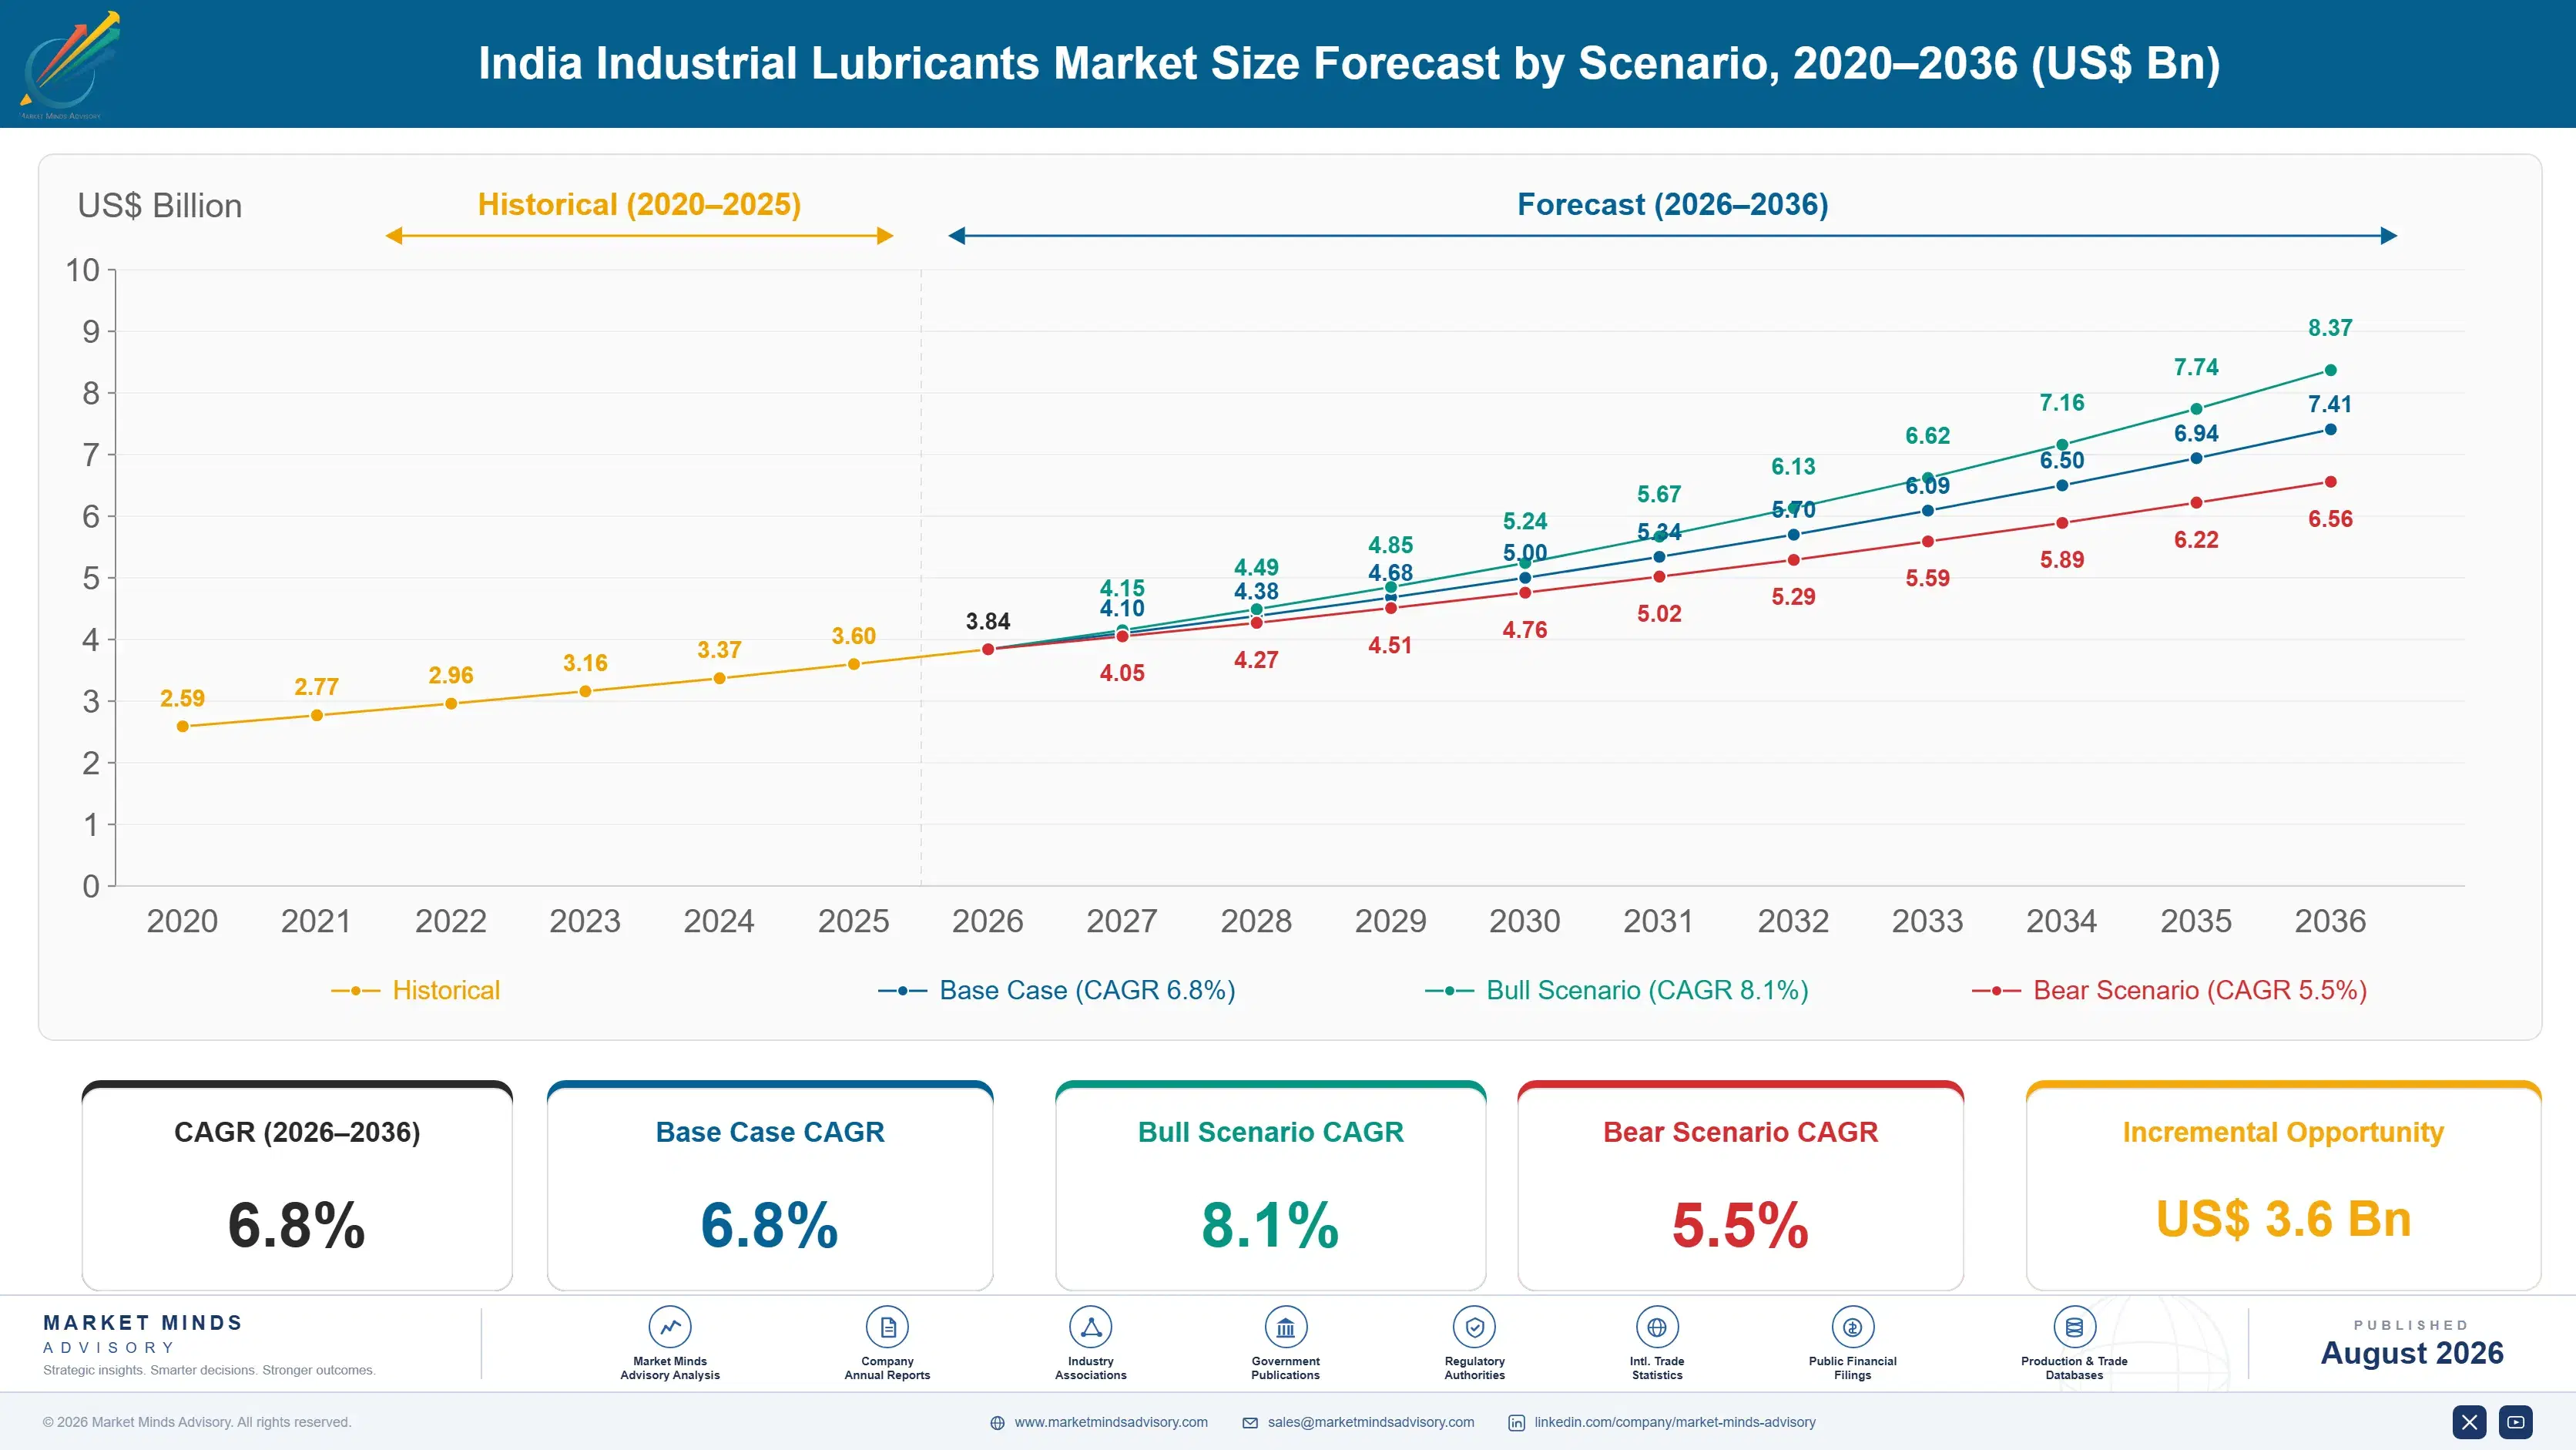
India Industrial Lubricants Market Forecast Scenarios

india-industrial-lubricants-market-trends-size-forecast-scenario-1787310911764
Between 2020 and 2025 demand grew steadily as manufacturing output recovered from pandemic-era disruption and gradually accelerated as production-linked incentive scheme approvals translated into actual new factory construction from 2022 onward, implying roughly 5.8% historical annual growth over the period as measured against comparable industrial output and machinery utilisation data published by India's Ministry of Commerce.
The base case assumes continued growth anchored in three commercial mechanisms: production-linked incentive scheme factories reaching full commercial output and requiring sustained lubricant replenishment, auto component manufacturers scaling capacity to serve both domestic and export demand, and heavy engineering firms upgrading aging machinery to synthetic lubricant specifications that extend service intervals. Together these mechanisms sustain above-trend demand even where broader industrial capital investment cycles slow periodically across individual manufacturing states. Regional industrial cluster growth reinforces this trajectory further.
A bull scenario centers on faster-than-expected production-linked incentive scheme commissioning across electronics and semiconductor-adjacent manufacturing, lifting synthetic lubricant volumes sharply. The bear case involves delayed factory construction tied to land acquisition and power infrastructure bottlenecks, which would push several announced manufacturing investments beyond their original commissioning timelines. Suppliers positioned for either outcome should maintain flexible synthetic blending capacity.

Manufacturing Upgrade Cycle Reshaping Lubricant Specification

Manufacturing capacity expansion under production-linked incentive schemes is pulling industrial lubricant demand toward higher-performance synthetic and semi-synthetic formulations, even as overall equipment counts grow more slowly than headline manufacturing output figures would suggest, since newer machinery requires proportionally less lubricant volume per unit of output than older equipment being gradually retired. Newer facilities also carry longer service interval requirements than older,
MARKET CONCENTRATION (CR5)42%moderately concentrated supplier base across major states today
AVERAGE SELLING PRICE TREND+5.4% p.a.synthetic formulations commanding steady rising price premium overall
TOP PRODUCING STATE SHAREMaharashtra, 24%largest industrial manufacturing and consumption base found nationally
SYNTHETIC FORMULATION PENETRATION31%share of volume using synthetic or semi-synthetic base stocks
BASE OIL IMPORT DEPENDENCE58%share of base oil and additive inputs sourced internationally
ORGANIZED SECTOR DISTRIBUTION SHARE64%volume sold through branded distributor and dealer networks
Commercial activity increasingly rewards suppliers who can demonstrate technical service capability and consistent distribution reach across industrial clusters over suppliers competing purely on unit price, a shift that favors both established multinational majors and domestic refiners with strong dealer networks reaching tier two and tier three manufacturing hubs beyond the traditional metro industrial belts. Smaller regional distributors increasingly struggle to compete without comparable technical depth.
Over the next decade, production-linked incentive scheme commissioning pace, base oil import cost trends, and synthetic formulation adoption rates will determine which suppliers capture the fastest incremental revenue pools within this expanding industrial manufacturing base across India's leading states. Suppliers positioned ahead of these shifts stand to capture outsized incremental share. Government policy continuity around these incentive schemes remains a key variable analysts are watching closely.
"Plant managers used to ask for the cheapest drum on the truck. Now they ask what extends their gearbox service interval, and that question changes everything."
Director, Chemicals and Industrial Materials Practice · MMA Chemicals and Materi

Market Trends

Production-Linked Incentive Schemes Driving New Factory Lubricant Demand

India's production-linked incentive schemes covering electronics, automotive components, specialty steel, and textiles have approved manufacturing investments exceeding $26 billion since 2020, with a growing share of approved factories now reaching commercial production and requiring sustained industrial lubricant procurement. Each new facility typically specifies synthetic or semi-synthetic hydraulic and gear lubricants meeting equipment manufacturer warranty requirements, a specification standard that generic mineral lubricant suppliers increasingly struggle to meet without reformulating their existing commodity product lines across most manufacturing categories and machinery types nationwide currently. Suppliers lacking a synthetic reformulation roadmap risk losing warranty qualification renewals entirely across most facility types.
Market Impact: Adds $26 billion in investment
Synthetic Formulation Adoption Accelerating Across Heavy Engineering

Heavy engineering and machinery manufacturers are increasingly specifying synthetic lubricants that extend service intervals and reduce unplanned downtime, a shift accelerated by rising labor costs for maintenance technicians and growing awareness of total cost of ownership economics beyond upfront lubricant pricing. Synthetic and semi-synthetic formulations now represent roughly 31% of total industrial lubricant volume nationally, up from a meaningfully smaller share five years earlier, and multinational suppliers with established synthetic formulation expertise are capturing disproportionate share of this upgrade cycle across most major manufacturing clusters currently expanding capacity nationwide. Domestic blenders without synthetic capability struggle to compete here.
Market Impact: Lifts synthetic share by 8 points

Market Opportunities and Growth Drivers

Auto Component Export Manufacturing Expansion Across Southern States

Auto component manufacturers in Tamil Nadu, Karnataka, and Maharashtra are expanding capacity to serve both domestic vehicle production and growing export orders from global automakers diversifying supply chains away from single-country sourcing concentration. India's auto component exports have grown consistently since 2021, and each new or expanded manufacturing facility requires specialized metalworking fluids and hydraulic lubricants meeting precision machining tolerances that generic industrial lubricants cannot reliably support across high-volume precision component production lines running continuous shifts. Suppliers with early relationships at these export-oriented facilities are best positioned to capture repeat volume as production scales toward full capacity utilisation nationwide.
Market Impact: Exposes 58% of inputs to swings

Government Machine Tool Modernization Support Programmes

Government-backed machine tool modernization incentives and lower financing costs for capital equipment purchases are accelerating the replacement of aging, decades-old machinery with modern CNC and precision equipment across small and medium manufacturing enterprises nationwide. Newer machinery specifies synthetic lubricants and more frequent condition monitoring than the mineral oils commonly used in older equipment, creating fresh demand even where total machine tool counts grow only modestly, since replacement equipment carries meaningfully different lubrication requirements than the machinery it displaces across most small and medium manufacturing enterprises undergoing this transition currently. Suppliers lacking synthetic qualification risk losing replacement contracts.
Market Impact: Limits synthetic uptake among 63% S

Market Restraints and Challenges

Base Oil and Additive Import Dependence Limiting Domestic Margins

Roughly 58% of base oil and additive package inputs used in Indian lubricant blending are imported, leaving domestic blenders exposed to global crude and additive pricing swings that are difficult to fully pass through under competitive industrial contract pricing. The root cause is limited domestic Group II and Group III base oil refining capacity relative to growing synthetic formulation demand. Several domestic refiners are investing in expanded base oil processing units, while blenders are qualifying additional additive suppliers across multiple countries to reduce single-source dependence and improve negotiating position during periods of tight global supply and elevated freight costs.
Market Impact: Adds $26 billion approved factory i

Price-Sensitive Small Manufacturer Segment Resisting Synthetic Upgrades

Small and medium manufacturing enterprises, which represent a substantial share of India's total industrial base, often resist upgrading from mineral to synthetic lubricants despite longer service life, since upfront per-litre pricing for synthetic formulations runs meaningfully higher than mineral alternatives. The root cause is limited working capital and short investment payback horizons typical of smaller enterprises operating on thin margins. Suppliers are increasingly offering total cost of ownership calculators and extended payment terms to demonstrate long-term savings and ease this segment's transition toward higher-performance formulations over multiple purchasing cycles across several years.
Market Impact: Lifts synthetic penetration to 31 p
3 additional market trends, 4 additional growth drivers, and 3 additional restraints and challenges are covered in the full report. Contact sales@marketmindsadvisory.com to access the complete intelligence.

Segment CAGR and Growth Architecture

The market is segmented by lubricant type, the classification that best reflects how industrial buyers actually specify and procure lubricants, since hydraulic, gear, and metalworking applications each carry distinct viscosity, additive, and service interval requirements that determine purchasing decisions more than end-use industry alone. Each dimension carries distinct qualification cycles that materially affect long-term switching costs.
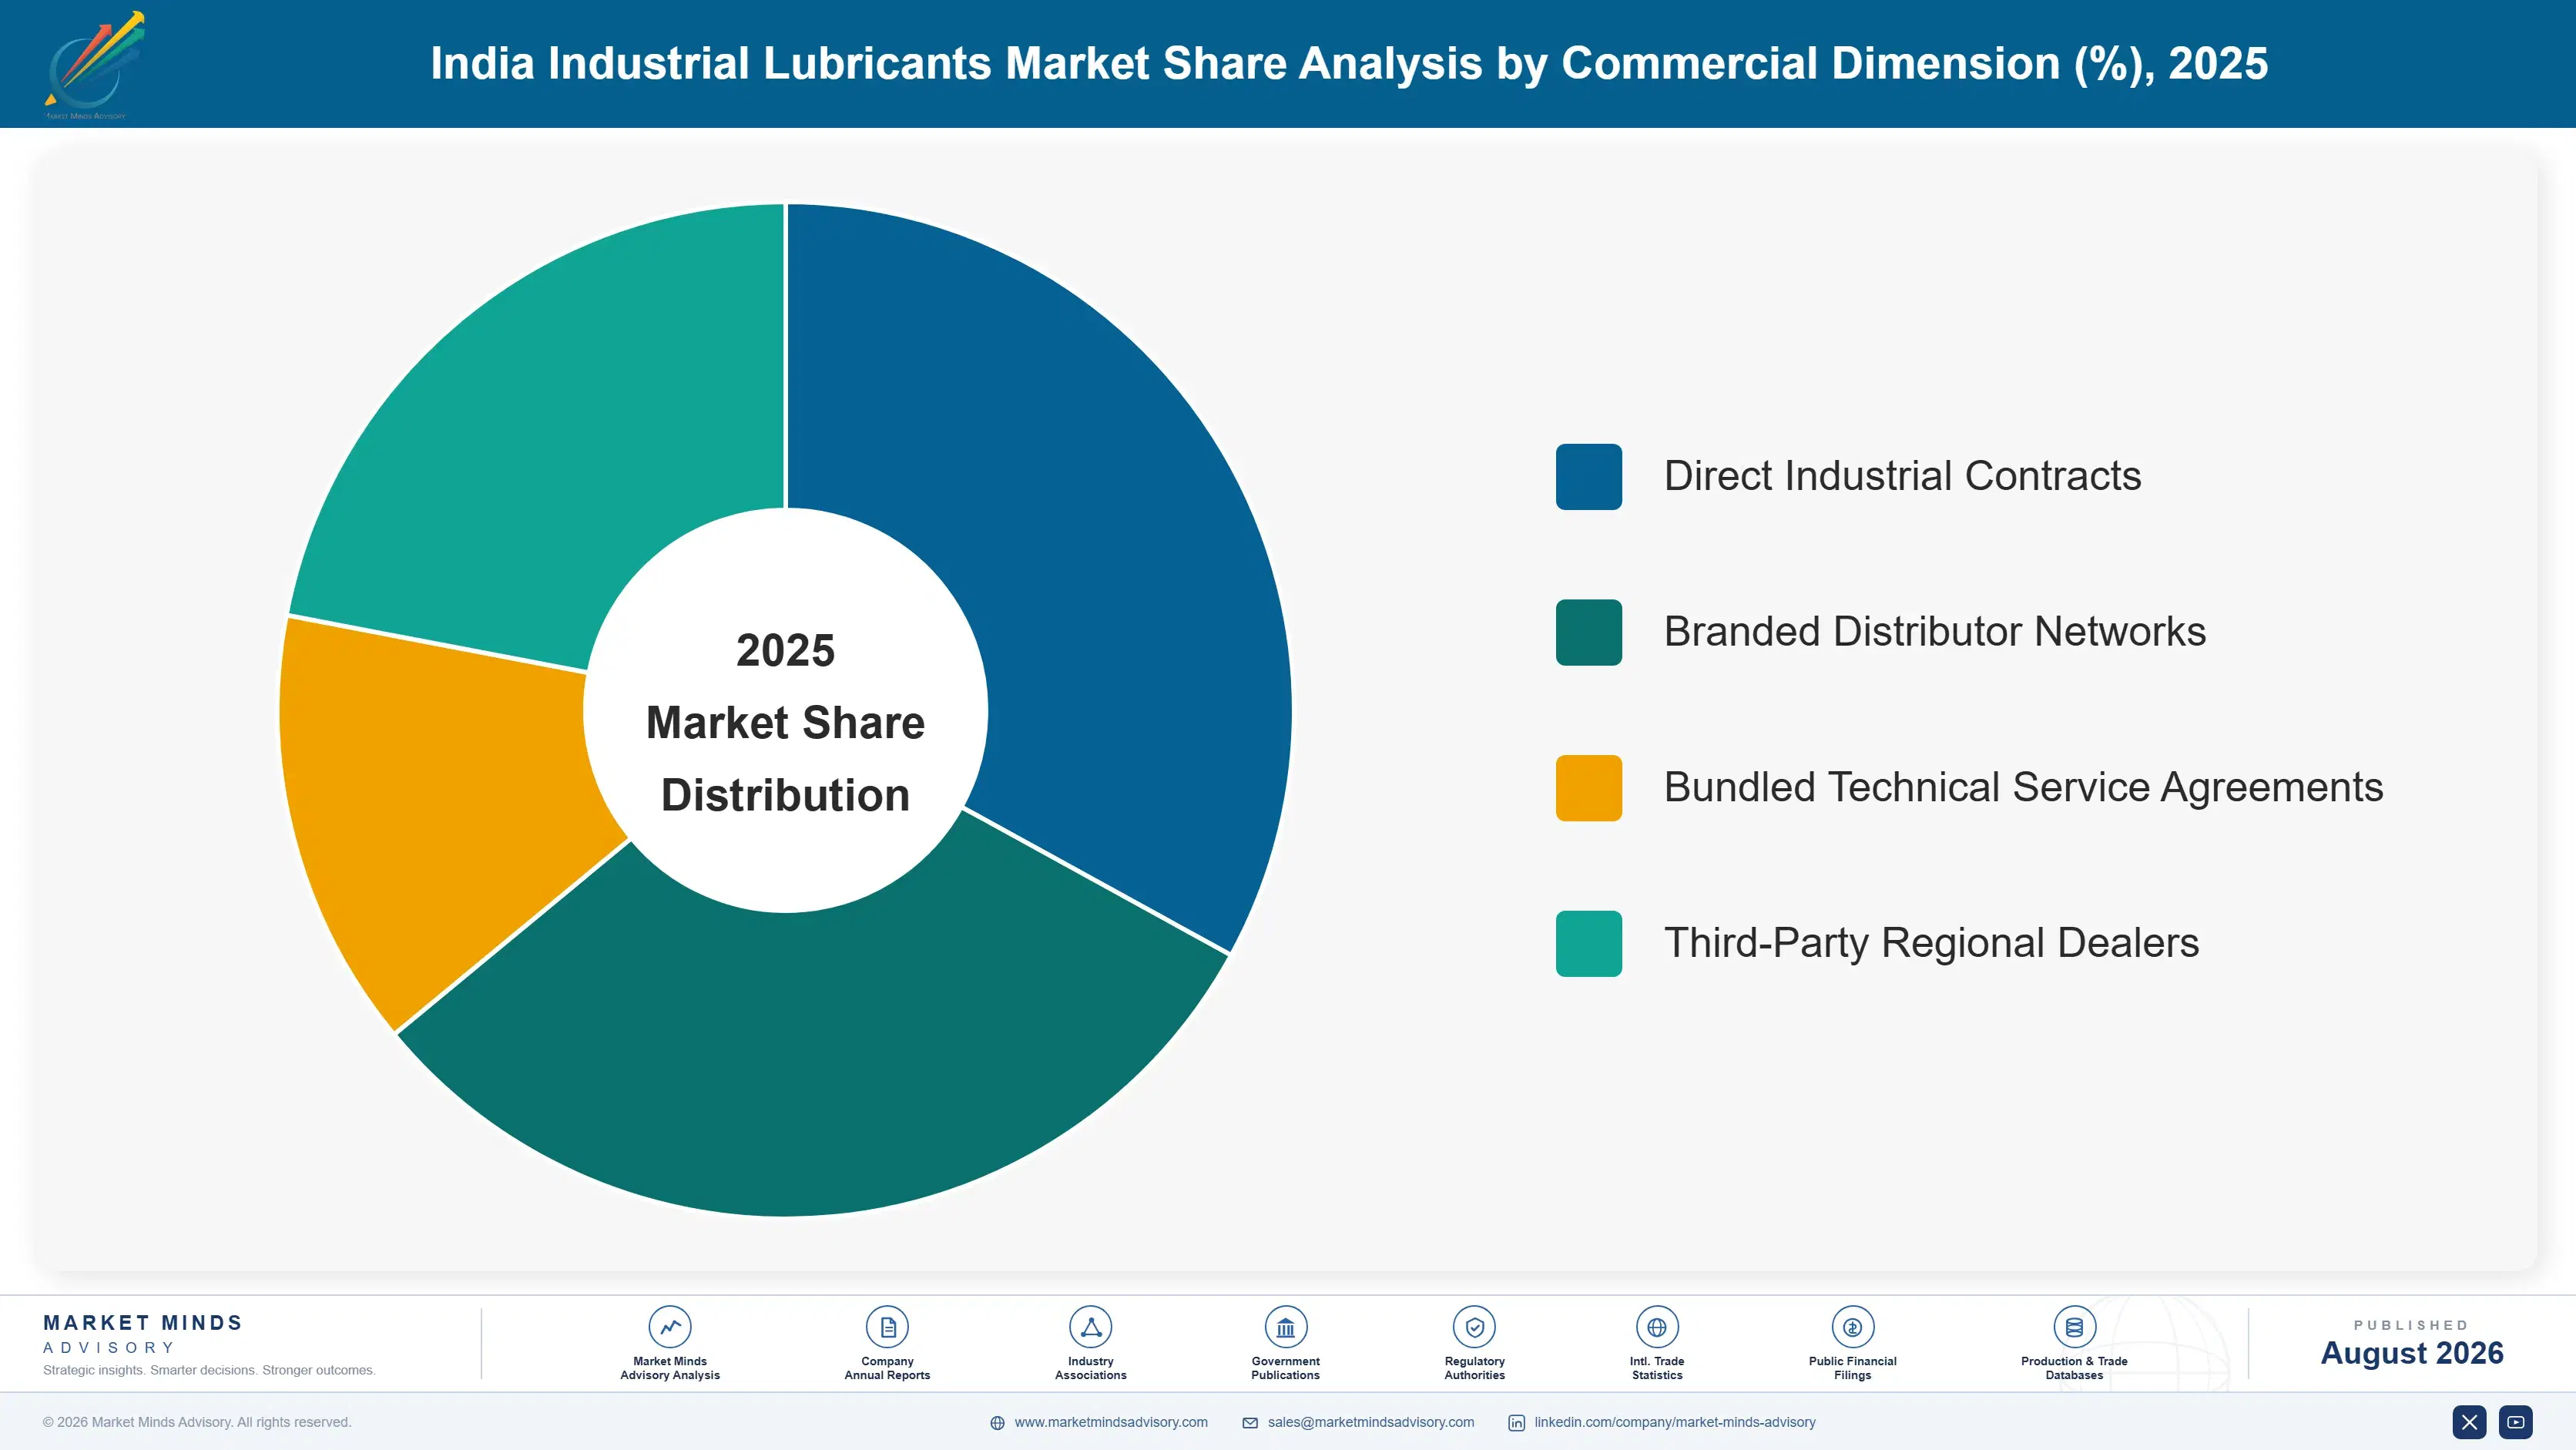
india-industrial-lubricants-market-trends-market-share-analysis-1787310912345

Hydraulic Fluids

Hydraulic fluids are the fastest-growing lubricant category as manufacturing capacity expansion under production-linked incentive schemes installs substantial new hydraulic press, injection molding, and material handling equipment across electronics, automotive component, and specialty steel plants. Buyers increasingly specify fire-resistant and biodegradable hydraulic fluid formulations for facilities operating under stricter workplace safety and environmental compliance requirements, creating a premium sub-category growing even faster than conventional hydraulic fluid volume overall. Suppliers with established technical service teams capable of onsite fluid condition monitoring are capturing disproportionate share of new facility contracts, since hydraulic system failures carry high production downtime costs that buyers actively work to avoid through proactive fluid maintenance programmes across their expanding manufacturing footprint.
CAGR 9.2%

Metalworking Fluids

Metalworking fluids are growing quickly as precision auto component and electronics manufacturing expands capacity to serve both domestic and export demand, requiring specialized cutting, grinding, and forming fluids matched to increasingly tight machining tolerances. Export-oriented manufacturers face particular pressure to adopt formulations meeting international quality certification standards their overseas customers require, pushing them toward synthetic and semi-synthetic metalworking fluids over traditional mineral oil options still common among smaller domestic-focused manufacturers. Suppliers offering formulation customization and rapid technical troubleshooting support are winning disproportionate share of contracts with precision manufacturers running continuous multi-shift production, where fluid performance issues translate directly into costly tool wear and rejected part rates across facilities. Buyers increasingly request documented certification records alongside standard technical performance data sheets.
CAGR 8.4%
Full segment breakdown across 6 segments available in the complete report.

Regional Architecture and Country Demand Map

This report's scope is explicitly confined to India. South Asia and Pacific therefore accounts for the overwhelming majority of market value by definition, with the small remainder reflecting global supplier corporate exposure and cross-border trade linkage. Trade linkage and multinational corporate exposure explain the modest remainder across all six other.

South Asia and Pacific

[Out-of-band justification: this report's scope is explicitly India, so South Asia and Pacific captures the overwhelming majority of market value by definition rather than by competitive dominance alone.] Maharashtra, Tamil Nadu, and Gujarat together account for the largest share of national demand, anchored in auto component, electronics assembly, and specialty chemical manufacturing clusters expanding under production-linked incentive schemes. Northern industrial belts around Delhi NCR and Punjab contribute steady demand tied to machinery and textile manufacturing, while eastern states including West Bengal and Odisha show slower but improving growth as steel and heavy engineering investment gradually increases. Southern states increasingly lead synthetic formulation adoption given their concentration of export-oriented precision manufacturing requiring tighter equipment specifications than domestic-focused plants.
Share: 88% | CAGR: 8.8% (2026 to 2036)

North America

[Out-of-band justification: this region's share sits below the standard band because this report's scope is confined to India; its listed share reflects multinational supplier corporate exposure rather than domestic Indian consumption.] Multinational lubricant majors headquartered in the United States, including some of the largest additive and base oil technology licensors, generate meaningful licensing and technology transfer revenue from their Indian operations even though physical product volumes are produced and sold domestically within India rather than imported directly from North American facilities. This corporate linkage represents the modest share captured in this regional figure rather than any direct physical trade flow of finished lubricant products between the two regions across the forecast period.
Share: 2% | CAGR: 6.0% (2026 to 2036)
Regional intelligence for 5 additional markets available in the complete report: Western Europe, East Asia, Latin America, Middle East and Africa, Eastern Europe. Contact sales@marketmindsadvisory.com.
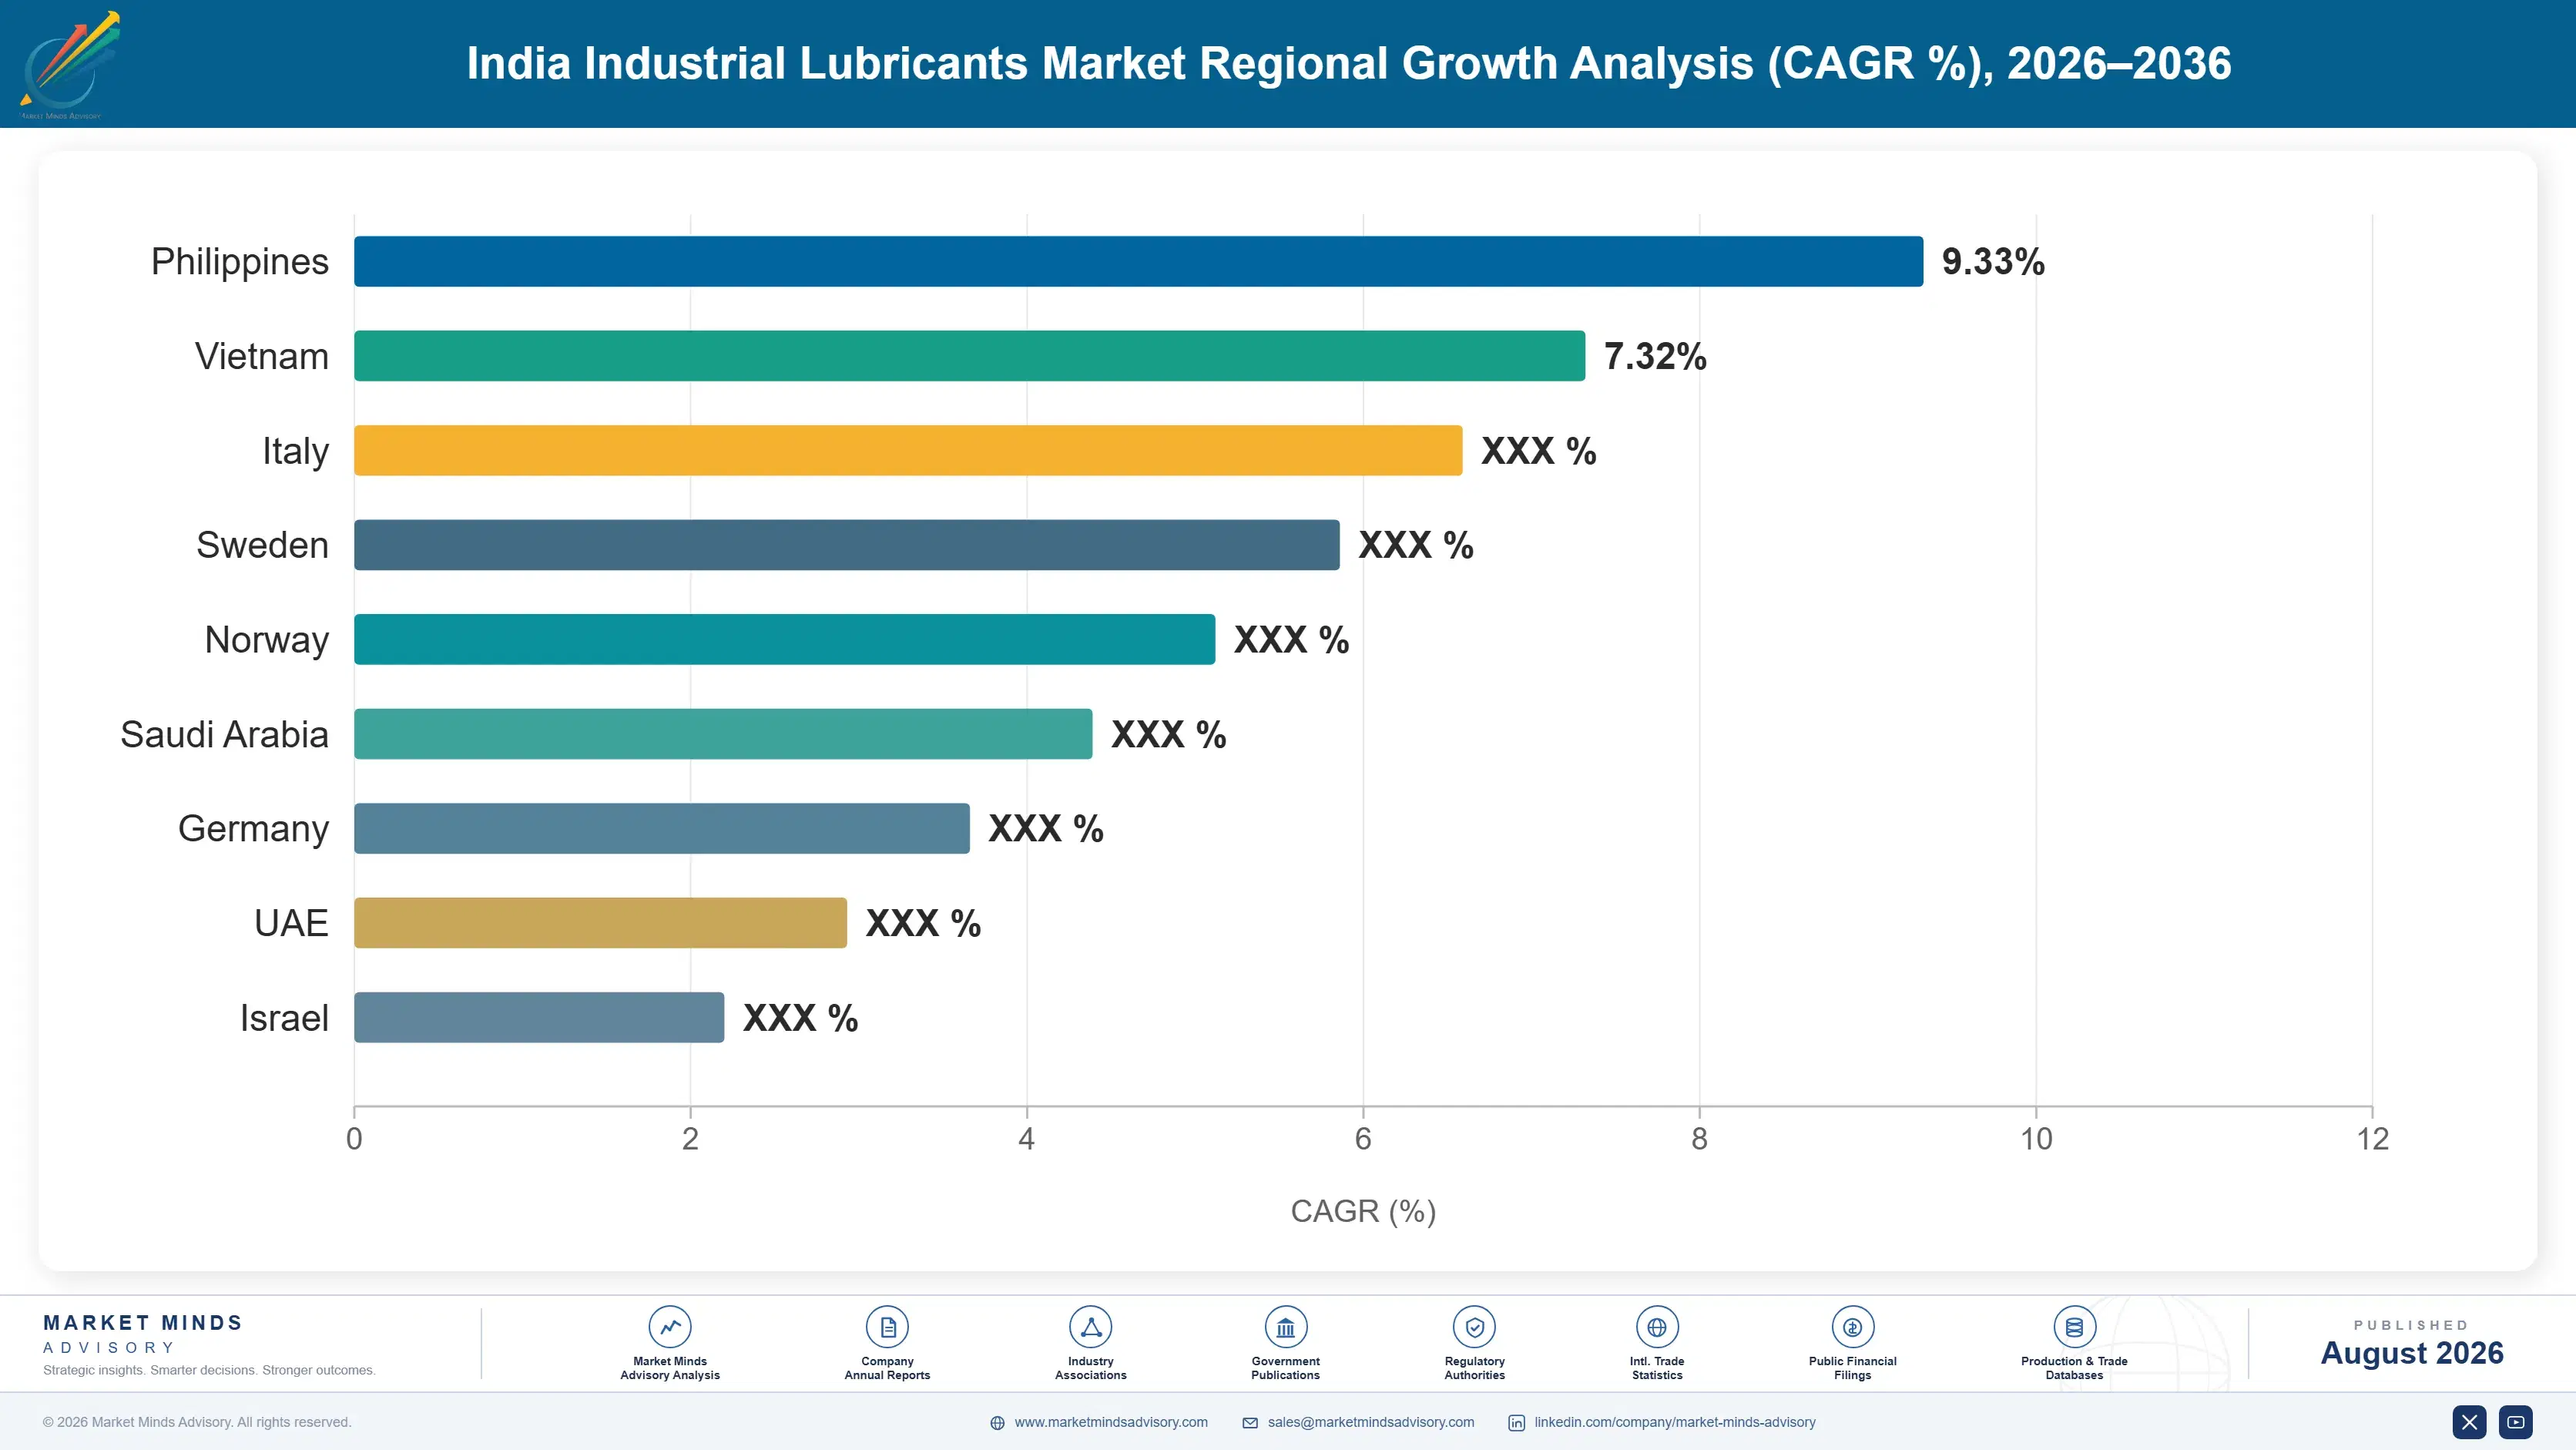
india-industrial-lubricants-market-trends-country-cagr-analysis-1787310912861

Converting Technical Service Into Distribution Advantage

Suppliers who pair distribution reach with genuine technical service capability are capturing disproportionate share of the manufacturing upgrade cycle underway across India. The levers below outline where formulation depth and service investment translate most directly into premium pricing and durable industrial customer relationships. Producers who ignore this shift risk ceding their best long-term contracts to faster-moving rivals nationwide.

Bundling Condition Monitoring Services With Synthetic Fluid Supply

Suppliers who bundle onsite hydraulic and lubricant condition monitoring services with their synthetic fluid offering reduce unplanned equipment downtime for industrial buyers, creating a service advantage that pure commodity distributors cannot match. This approach has let leading suppliers command price premiums of roughly 10 to 15% above standard synthetic lubricant pricing on contracts with precision manufacturers, since buyers value the reduced downtime risk more than marginal per-litre cost differences across comparable product specifications available. Buyers weigh reduced downtime risk heavily when comparing otherwise similar bids from competing suppliers each cycle.
Market Impact: Adds 10 to 15% pricing premium on c

Expanding Distribution Reach Into Tier Two Manufacturing Clusters

Suppliers extending branded distributor networks into tier two and tier three manufacturing clusters beyond traditional metro industrial belts are capturing disproportionate share of new production-linked incentive scheme facility contracts, since these newer manufacturing hubs often lack established multinational supplier presence. Companies that expanded distribution into these emerging clusters since 2022 report volume growth meaningfully above their established metro market growth rates across comparable facility counts and product categories. This distribution-driven growth advantage compounds meaningfully as production-linked incentive scheme facilities continue commissioning nationwide over the coming years. Competitors without comparable regional footprint increasingly struggle to match delivery reliability on time-sensitive facility.
Market Impact: Lifts volume growth by roughly 2x m

Offering Total Cost of Ownership Financing for SME Buyers

Suppliers offering extended payment terms and total cost of ownership calculators targeted at small and medium manufacturing enterprises are converting price-sensitive buyers who would otherwise remain on cheaper mineral lubricants, capturing incremental synthetic formulation volume this segment previously avoided. Early adopters of this financing approach report SME segment volume growth roughly 2x the rate achieved by suppliers relying solely on standard cash payment terms across comparable small and medium manufacturing customer accounts nationwide currently expanding capacity. This financing-driven volume growth compounds steadily as more small and medium manufacturing enterprises complete their initial synthetic formulation trial period.
Market Impact: Roughly doubles SME segment volume

Localizing Base Oil Blending Near Manufacturing Clusters

Building regional blending capacity near fast-growing manufacturing clusters in Gujarat and Tamil Nadu reduces logistics costs and delivery lead times, which matters disproportionately for industrial buyers running continuous production who cannot tolerate delayed lubricant deliveries. Suppliers with regional blending plants announced capacity investments exceeding $180 million across new facilities near major manufacturing hubs since 2023, positioning themselves ahead of competitors lacking comparable local production and delivery reliability nationwide. Early movers in this approach have already secured multiple long-term supply relationships ahead of slower-moving competitors nationwide. This early positioning advantage compounds as remaining facilities finalize their preferred supplier lists over subsequent.
Market Impact: Requires roughly $180 million in to

Who Controls the Margin Pool

This market carries moderate concentration, with the top five suppliers holding roughly 42% combined share on a revenue basis, leaving substantial share held by regional blenders and public sector oil marketing companies competing mainly on distribution reach and price across smaller industrial accounts nationwide. That gap has widened as technical service capability becomes a harder qualification barrier to replicate quickly.
Current competitive activity centers on three dimensions: expanding synthetic formulation capability to serve the manufacturing upgrade cycle, extending distribution networks into tier two and tier three industrial clusters, and building technical service teams offering condition monitoring and equipment-specific formulation guidance to differentiate beyond price competition. Several producers are also expanding brownfield blending capacity to reduce logistics costs near growing manufacturing hubs.

Emerging pressure comes from domestic regional blenders scaling production to compete on price against multinational majors in commodity mineral lubricant categories, gradually eroding share in price-sensitive segments while multinational leaders retreat toward higher-margin synthetic and technical-service-bundled offerings where formulation expertise still commands premium pricing across most precision manufacturing accounts. Rankings among mid-tier suppliers are shifting fastest as service capability becomes a stronger competitive differentiator.
india-industrial-lubricants-market-trends-company-positioning-matrix-1787310913383

Competitive Moat and Risk Dimensions

CASTROL INDIA

Moat: Synthetic Formulation Leadership

Castrol India's deep synthetic formulation expertise and established relationships with equipment manufacturers give it warranty-approval advantages that domestic blenders cannot easily replicate, particularly valuable as manufacturers increasingly specify synthetic lubricants meeting original equipment manufacturer standards. Its brand recognition among industrial buyers supports premium pricing across most synthetic product categories nationwide, reinforced by decades of technical service history.
CASTROL INDIA

Risk: Import Cost Exposure on Additives

Castrol India's reliance on imported specialty additive packages leaves it exposed to currency fluctuation and global additive pricing swings that domestic vertically integrated competitors can partially avoid. This exposure can compress margins during periods of rupee depreciation or additive supply disruption, particularly for premium synthetic formulations requiring the most specialized imported additive technology not yet available from domestic chemical suppliers.
INDIAN OIL CORPORATION

Moat: Nationwide Distribution Infrastructure

Indian Oil Corporation's extensive nationwide distribution network, built through decades of fuel retailing infrastructure, gives it reach into tier two and tier three manufacturing clusters that multinational competitors struggle to match cost-effectively. Its integrated refining operations also provide insulation from base oil import cost volatility that pure blenders face.
INDIAN OIL CORPORATION

Risk: Lagging Synthetic Formulation Depth

Indian Oil Corporation's historical focus on conventional mineral lubricants leaves it comparatively behind multinational competitors in synthetic formulation depth and technical service capability, a gap that could limit its ability to capture the fastest-growing premium synthetic segments as manufacturing buyers increasingly demand higher-performance formulations meeting original equipment manufacturer specifications across expanding precision manufacturing accounts nationwide.

Players Tracked

Prominent Players

Castrol India
Indian Oil Corporation
Hindustan Petroleum
Shell India
Gulf Oil Lubricants India

Other Key Players

Bharat Petroleum
Valvoline Cummins
Total Energies India
ExxonMobil Lubricants India
Savita Oil Technologies
Panama Petrochemicals
Balmer Lawrie
Tide Water Oil Company
Veedol International
Apar Industries
Repsol Lubricants India
Phillips 66 Lubricants India
Fuchs Lubricants India
Idemitsu Lubricants India
Petronas Lubricants India

Recent Developments

APRIL 2026

Castrol India Expands Synthetic Blending Capacity in Gujarat

Castrol India commissioned an expanded synthetic lubricant blending line at its existing Gujarat facility, targeting growing demand from electronics and auto component manufacturers under production-linked incentive schemes. The expansion adds meaningful annual synthetic formulation capacity aimed at reducing import dependence for finished premium lubricant products sold domestically.
Signal: Domestic synthetic blending capacity is be
NOVEMBER 2025

Indian Oil Corporation Signs Long-Term Supply Agreement With Auto Component Manufacturer Consortium

Indian Oil Corporation signed a multi-year lubricant supply agreement with a consortium of auto component manufacturers across Tamil Nadu and Karnataka. The agreement was a long-term supply contract, not an acquisition or joint venture, and includes provisions for joint technical service support across covered manufacturing facilities throughout the contract term.
Signal: Long-term industrial supply agreements are
JULY 2025

Gulf Oil Lubricants India Acquires Regional Metalworking Fluid Specialist

Gulf Oil Lubricants India completed the acquisition of a mid-sized regional metalworking fluid specialist based in Maharashtra, gaining formulation capability and customer relationships in precision manufacturing. The transaction was structured as a full acquisition rather than a joint venture or minority equity stake in the target company's operations.
Signal: Acquisitions of specialist formulators are

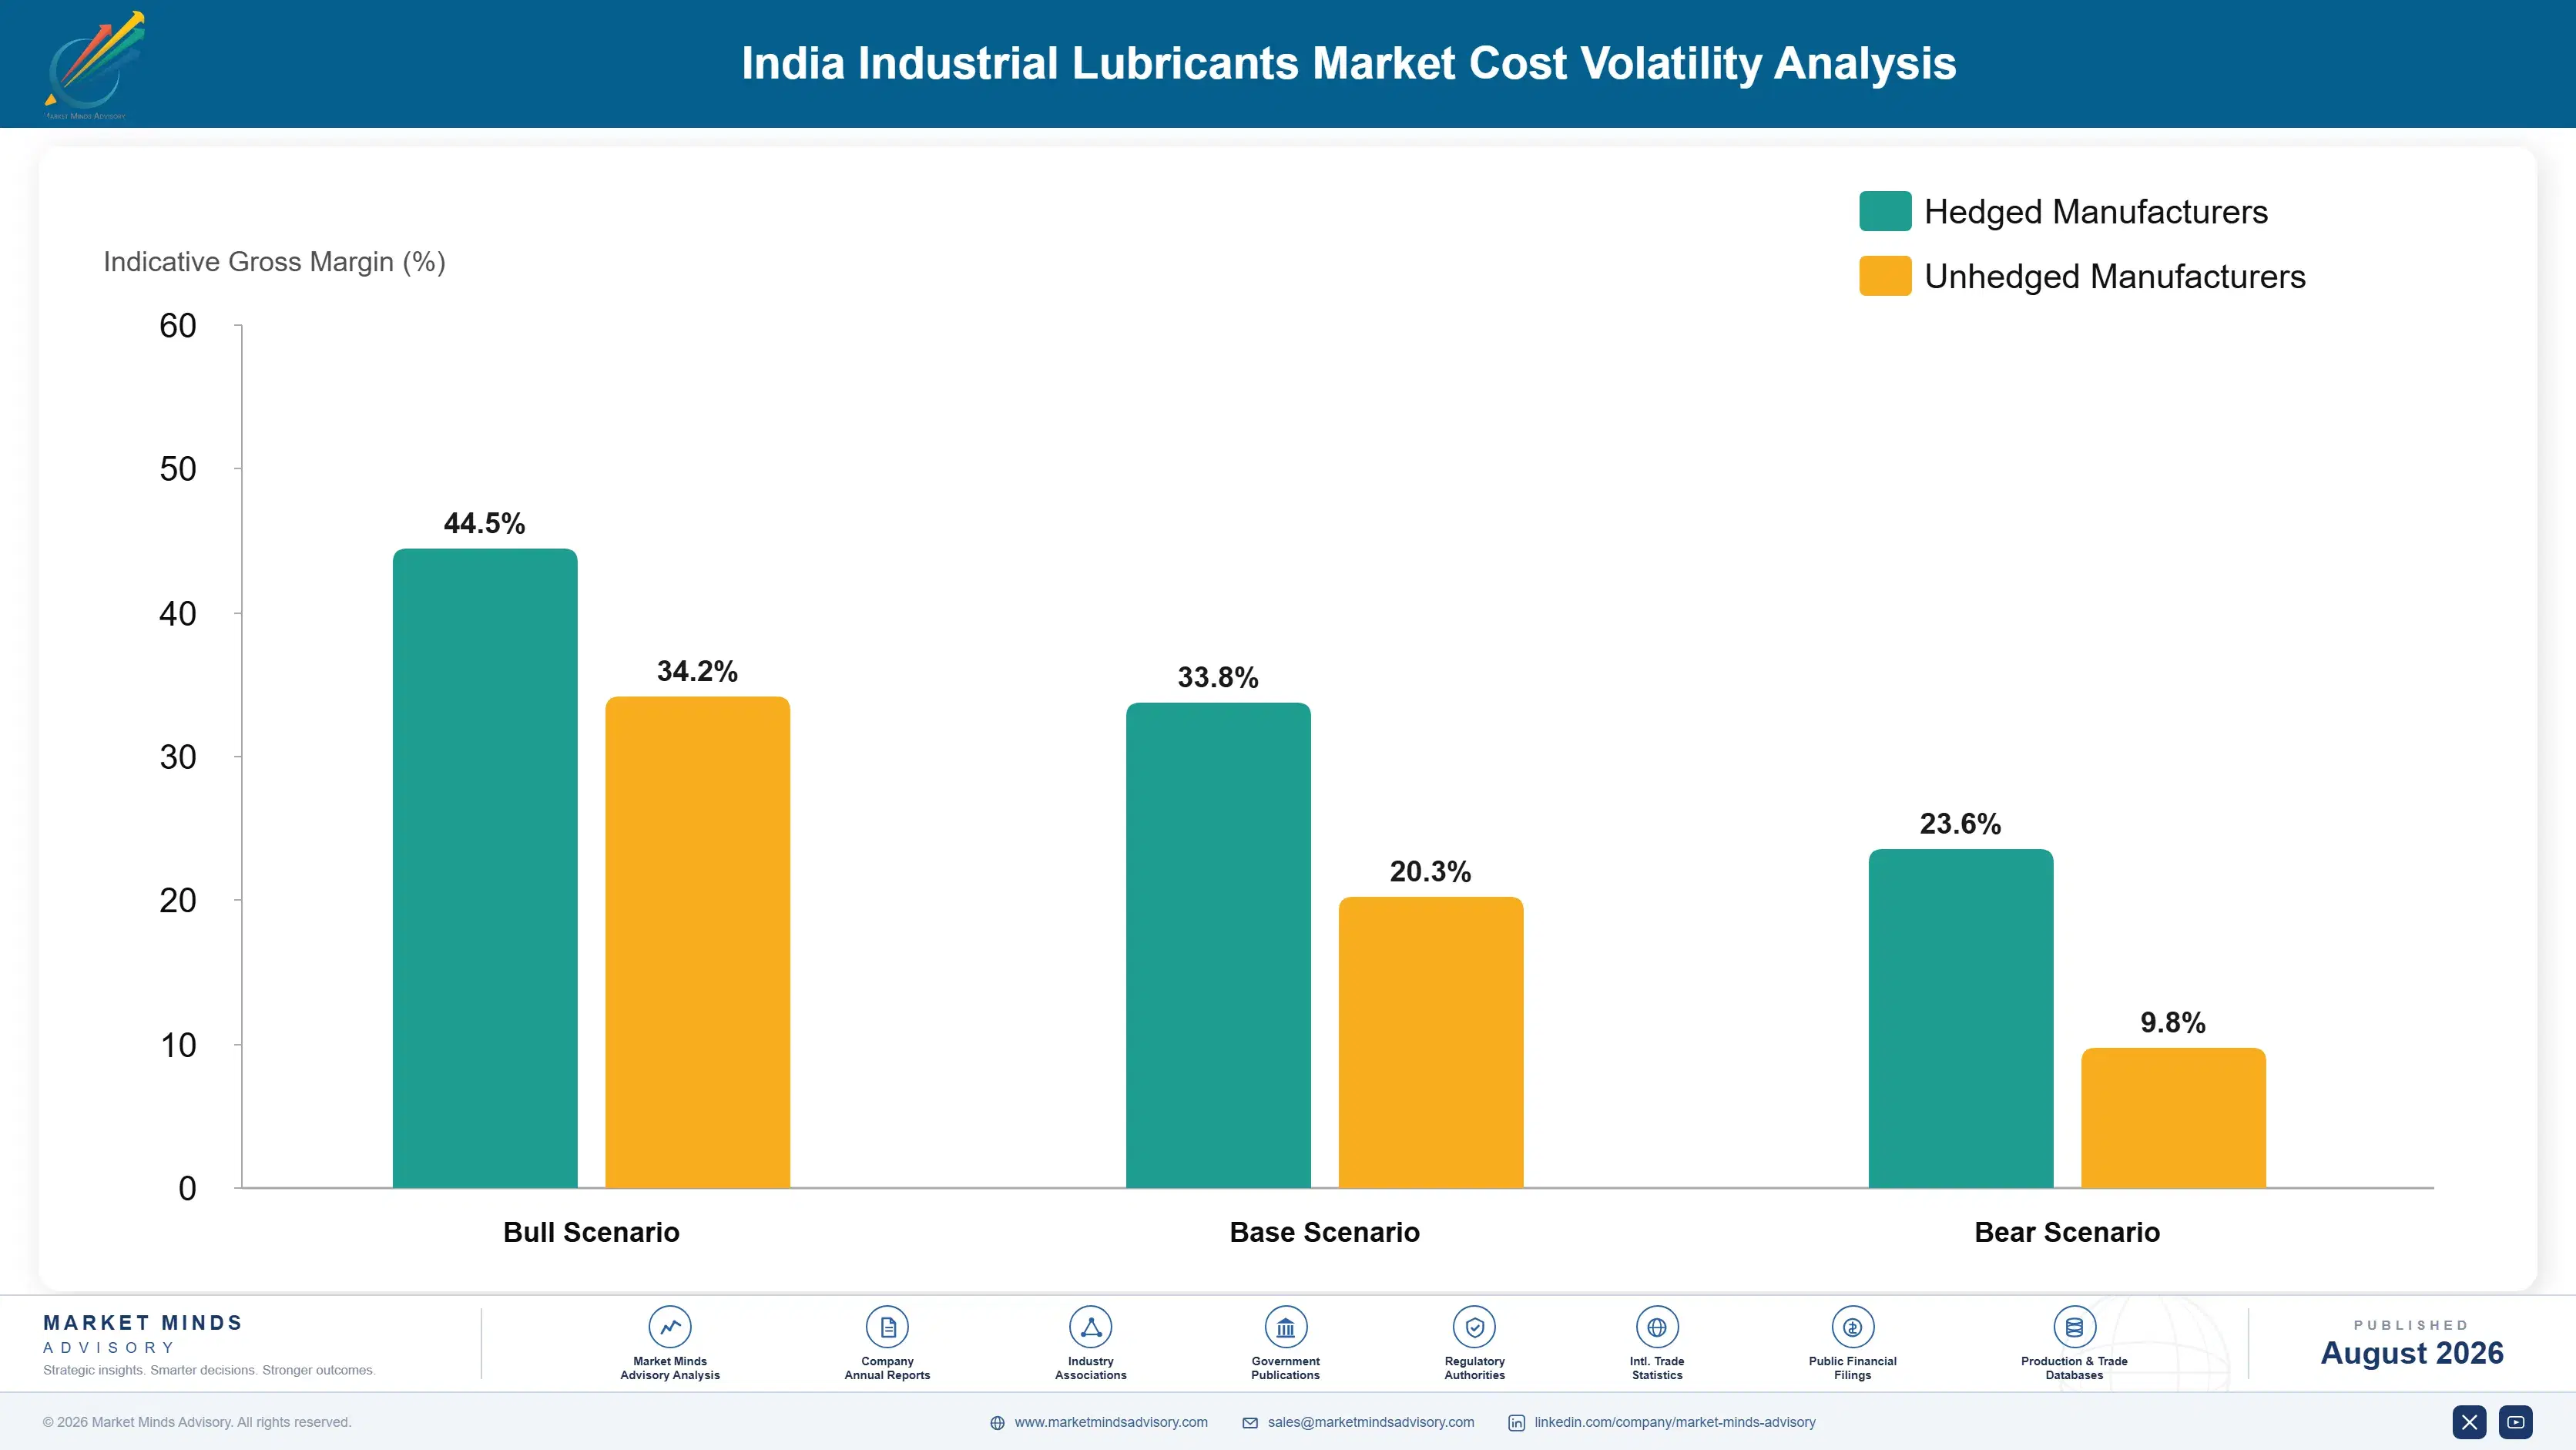
Base Oil and Additive Import Exposure

Base oil and additive packages together represent roughly 62% of production cost of goods sold for Indian lubricant blenders, with roughly 58% of these inputs imported given limited domestic Group II and Group III base oil refining capacity relative to growing synthetic formulation demand across the industrial manufacturing base nationwide. Rupee-dollar exchange rate movements therefore directly influence domestic blending economics for most suppliers.
Rupee depreciation against the US dollar during 2024, combined with elevated global crude oil pricing documented in IEA market reports, drove a sustained increase in imported base oil and additive costs for Indian blenders. Several domestic blenders reported margin compression during this period as competitive industrial contract pricing limited how quickly cost increases could be passed through to manufacturing customers. Several blenders reported multi-quarter margin compression directly tied to this cost pressure in their filings.

This cost exposure disadvantages smaller regional blenders lacking long-term supply agreements or currency hedging arrangements, since they must absorb import cost spikes immediately or lose price-sensitive contracts. Larger integrated players with domestic refining capacity and diversified additive sourcing weather these disruptions more smoothly, widening the competitive gap during periods of currency or crude price volatility.
india-industrial-lubricants-market-trends-cost-volatility-analysis-1787310913580

Expanding Domestic Group II and Group III Base Oil Capacity

Domestic refiners are investing in expanded Group II and Group III base oil processing capacity to reduce reliance on imported synthetic base stocks, cutting exposure to currency and freight cost volatility. This investment has begun reducing import dependence for several major domestic blenders over the past two years, though full capacity commissioning remains several years away for most projects.

Diversifying Additive Package Sourcing Across Multiple Countries

Blenders are increasingly qualifying additive suppliers across multiple countries, including domestic Indian chemical manufacturers, to reduce dependence on any single import source. This diversification has helped several blenders avoid the sharpest cost spikes experienced by single-source-dependent competitors during recent periods of rupee depreciation and global additive supply tightness. This approach also shortens qualification timelines when a primary supplier faces disruption.

Locking Multi-Year Currency-Hedged Import Contracts

Larger blenders are negotiating multi-year import contracts with currency hedging provisions to shield formulation costs from short-term rupee volatility. This approach has helped several major suppliers maintain steadier quarterly margins compared to unhedged competitors during recent periods of currency depreciation and elevated global base oil pricing across import-dependent product categories. Fixed terms also simplify budgeting for multi-year industrial supply contracts.

Portfolio Architecture for Margin Defence

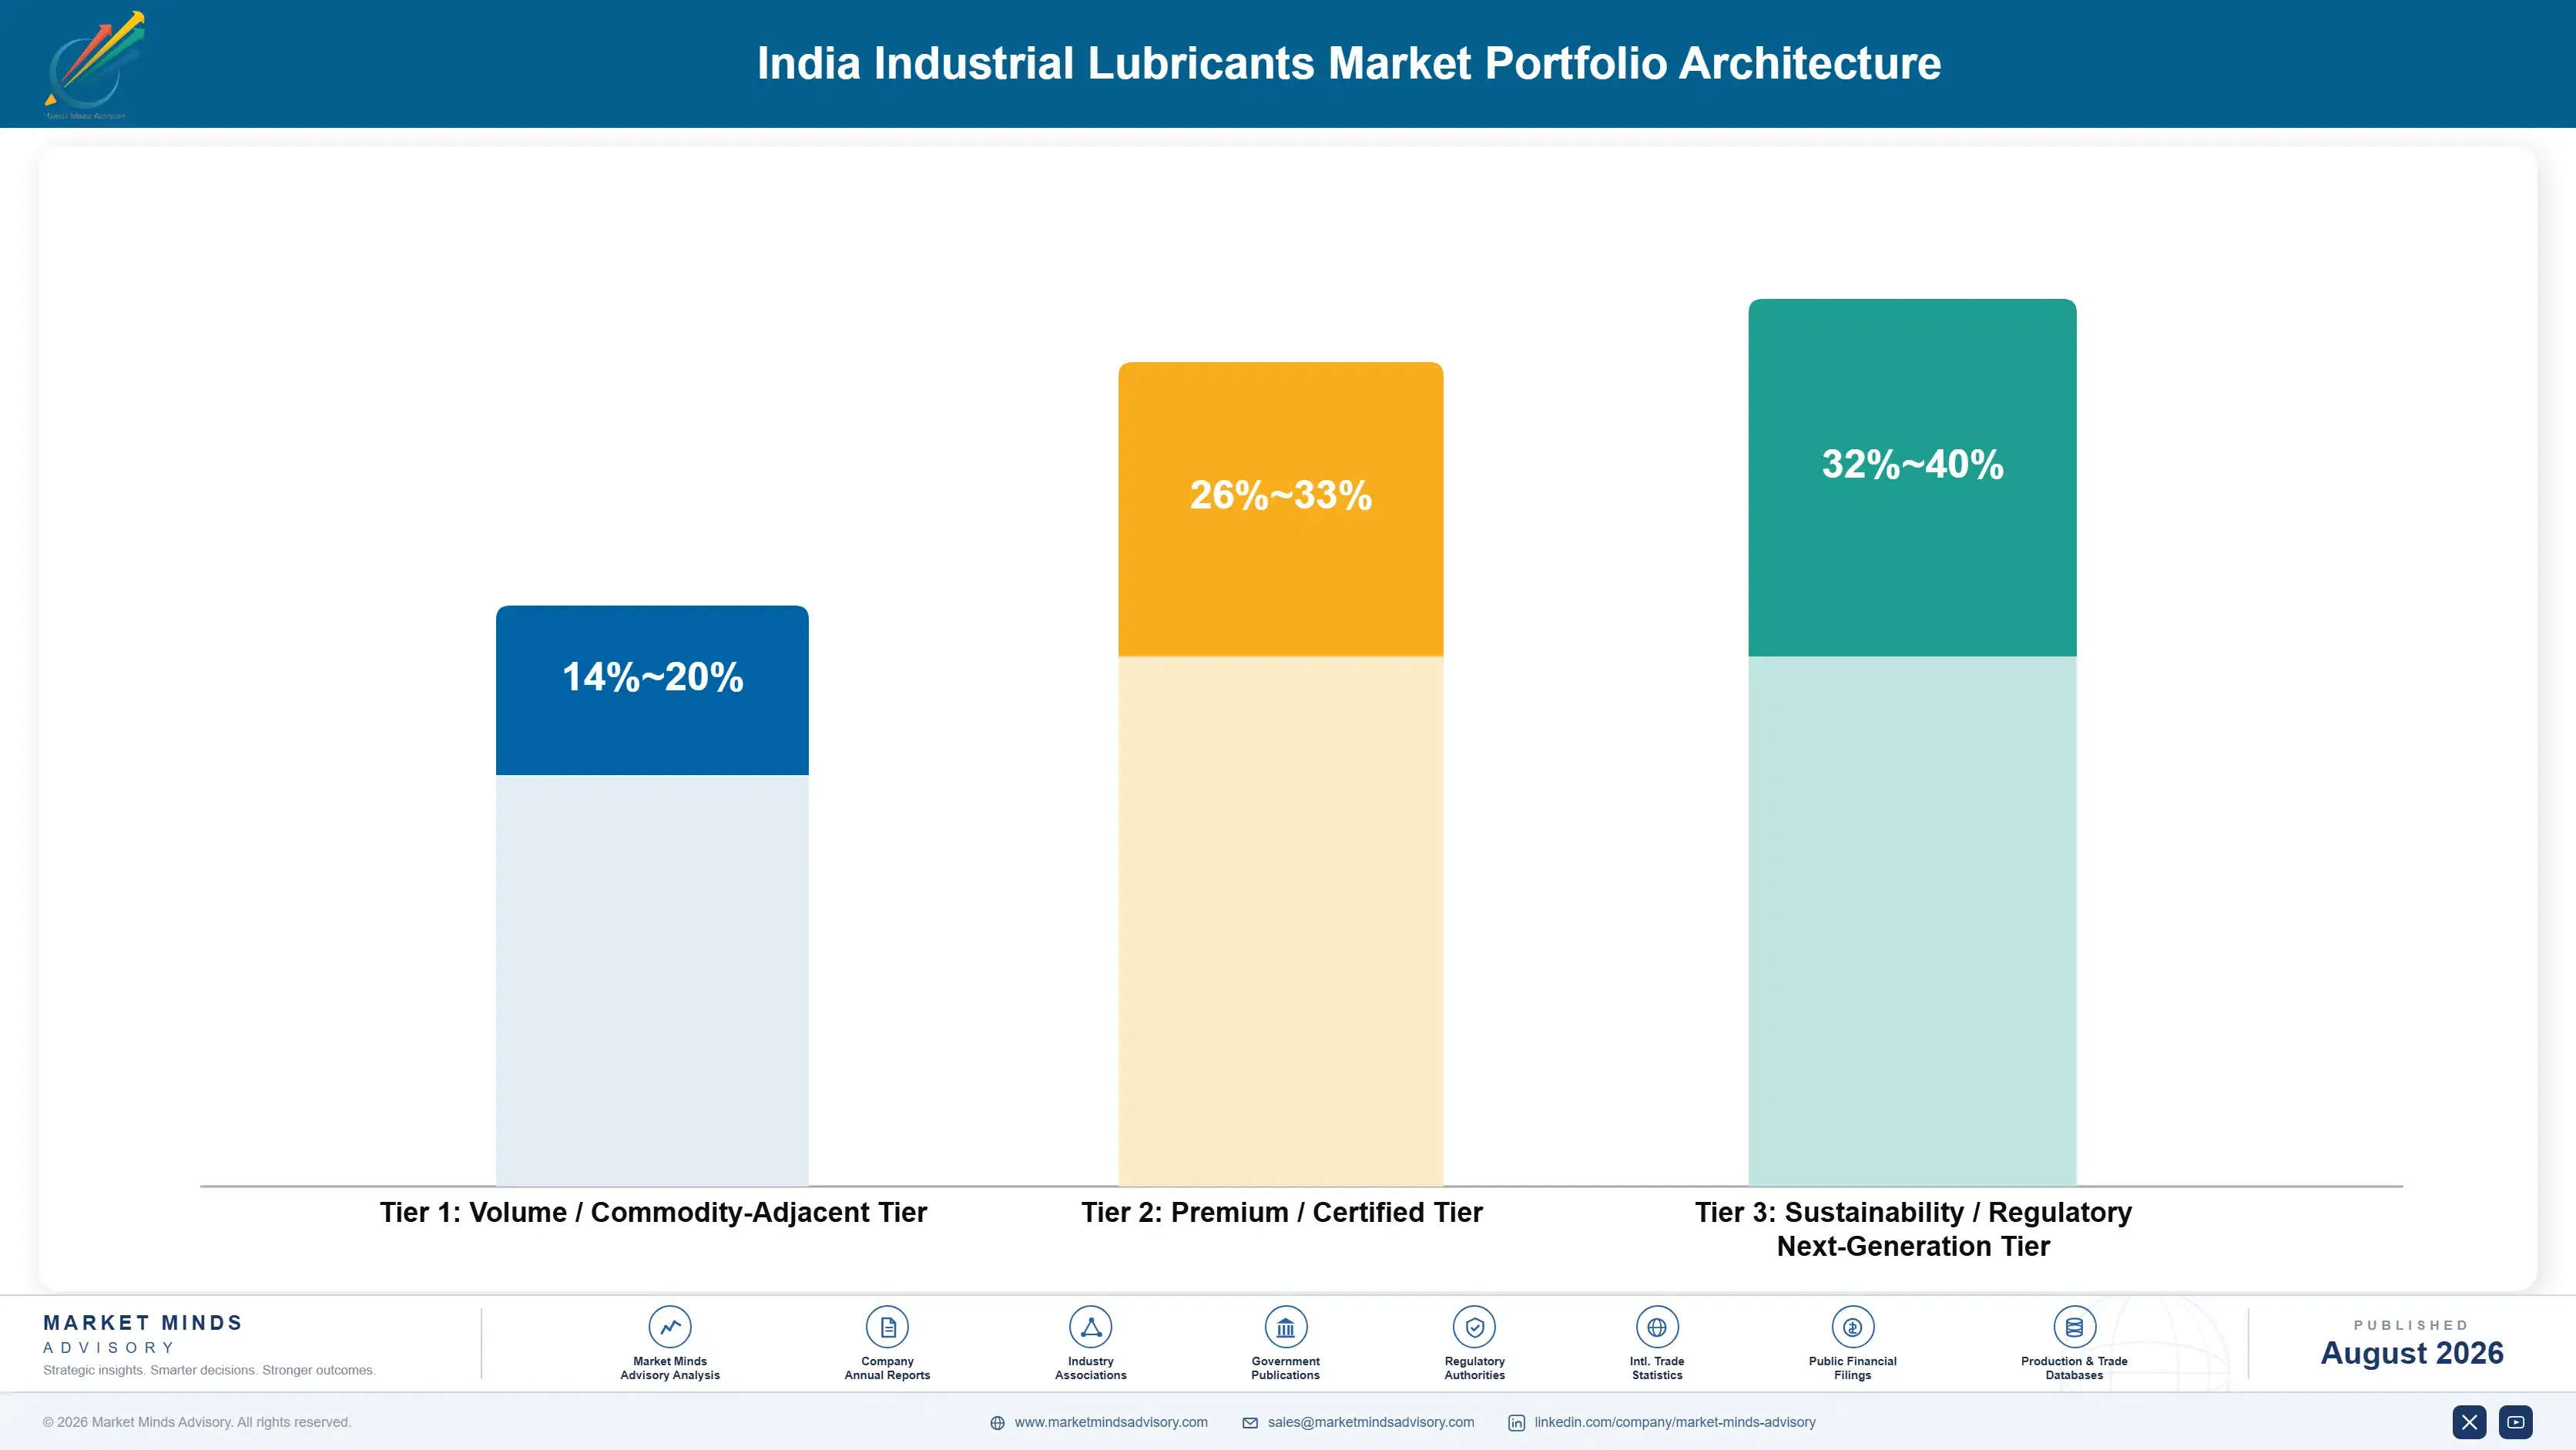
Portfolio economics split across three tiers. Volume commodity-adjacent mineral lubricants carry thin margins driven by price competition from regional blenders, while premium synthetic formulations qualified for original equipment manufacturer warranty requirements command meaningfully higher gross margins reflecting formulation complexity and the technical service investment required to support these products effectively. Buyers in each tier evaluate suppliers on different criteria, complicati
The tension between volume and premium positioning defines supplier strategy. Commodity mineral lubricant volume remains large but slow-growing and price-competitive, while premium synthetic and technical-service-bundled offerings represent a smaller but much faster-growing and higher-margin pool that rewards suppliers with dedicated formulation and service capability across their expanding industrial customer base nationwide. Suppliers unable to run both playbooks well risk losing ground on at least one competitive front nationwide.

High-value margin pools concentrate specifically in synthetic hydraulic fluids, precision metalworking fluids, and condition-monitoring-bundled service contracts, where technical differentiation and warranty compliance requirements remain highest relative to commodity mineral lubricant categories sold mainly on distribution reach and price alone. Suppliers absent from these pools risk being confined to thinner-margin commodity competition over the long term.

Volume / Commodity-Adjacent Tier

Standard mineral lubricants sold mainly on price and distribution reach to broad industrial buyers, carrying thin, competition-sensitive margins nationwide. These buyers typically negotiate primarily on delivered price and minimum order volume commitments each purchasing cycle.
Gross Margin: 14-20%

Premium / Certified Tier

Synthetic and semi-synthetic formulations meeting original equipment manufacturer warranty specifications, commanding steadier premium pricing from precision manufacturers. Qualification testing cycles can take a year or more before a new supplier is fully warranty-approved.
Gross Margin: 26-33%

Sustainability / Regulatory / Next-Generation Tier

Biodegradable and fire-resistant hydraulic fluids and condition-monitoring-bundled service offerings capturing early-mover premiums from safety-conscious buyers. Adoption remains early-stage but is expanding steadily as manufacturers formalize workplace safety compliance requirements. and export-oriented buyers.
Gross Margin: 32-40%
india-industrial-lubricants-market-trends-portfolio-architecture-1787310914086

High-value Sub-segments and Strategic Watch-out

Synthetic Hydraulic Fluids for PLI Facilities

Highest-value, fastest-growing pool tied directly to production-linked incentive scheme facility commissioning, commanding premium pricing on formulation depth and technical service. Contracts here typically run multiple years and carry the highest switching costs across the entire portfolio. Delivery penalties in these contracts make reliability the biggest differentiator in this segment overall.
Gross Margin: 30-37%

Precision Metalworking Fluids for Exporters

High-value pool growing steadily alongside auto component export manufacturing expansion, anchored in formulation customization and international quality certification compliance. Suppliers embedded early in an exporter's supply chain rarely get displaced once certification is complete. International certification renewal cycles create additional recurring qualification touchpoints suppliers can use to their advantage.
Gross Margin: 28-35%

General Industrial Mineral Lubricants

Largest volume core segment, price-competitive and distribution-dependent, generating steady but comparatively low-margin revenue across smaller manufacturing enterprises nationwide currently. Consolidation pressure is intensifying here as regional low-cost blenders expand capacity faster than demand growth. Producers here compete mainly on logistics efficiency and regional proximity rather than deep technical differentiation.
Gross Margin: 14-19%

Import-Dependent Premium Additive Categories

Strategic watch-out segment facing rupee volatility and global additive pricing exposure; suppliers reliant on imported specialty additives face ongoing margin compression risk. Suppliers reliant on these categories should actively diversify sourcing to reduce currency exposure risk. Rupee volatility could compress this segment's already thin margins further with limited advance notice.
Gross Margin: 12-18%

Equipment Warranty Cycles and Service Contracts

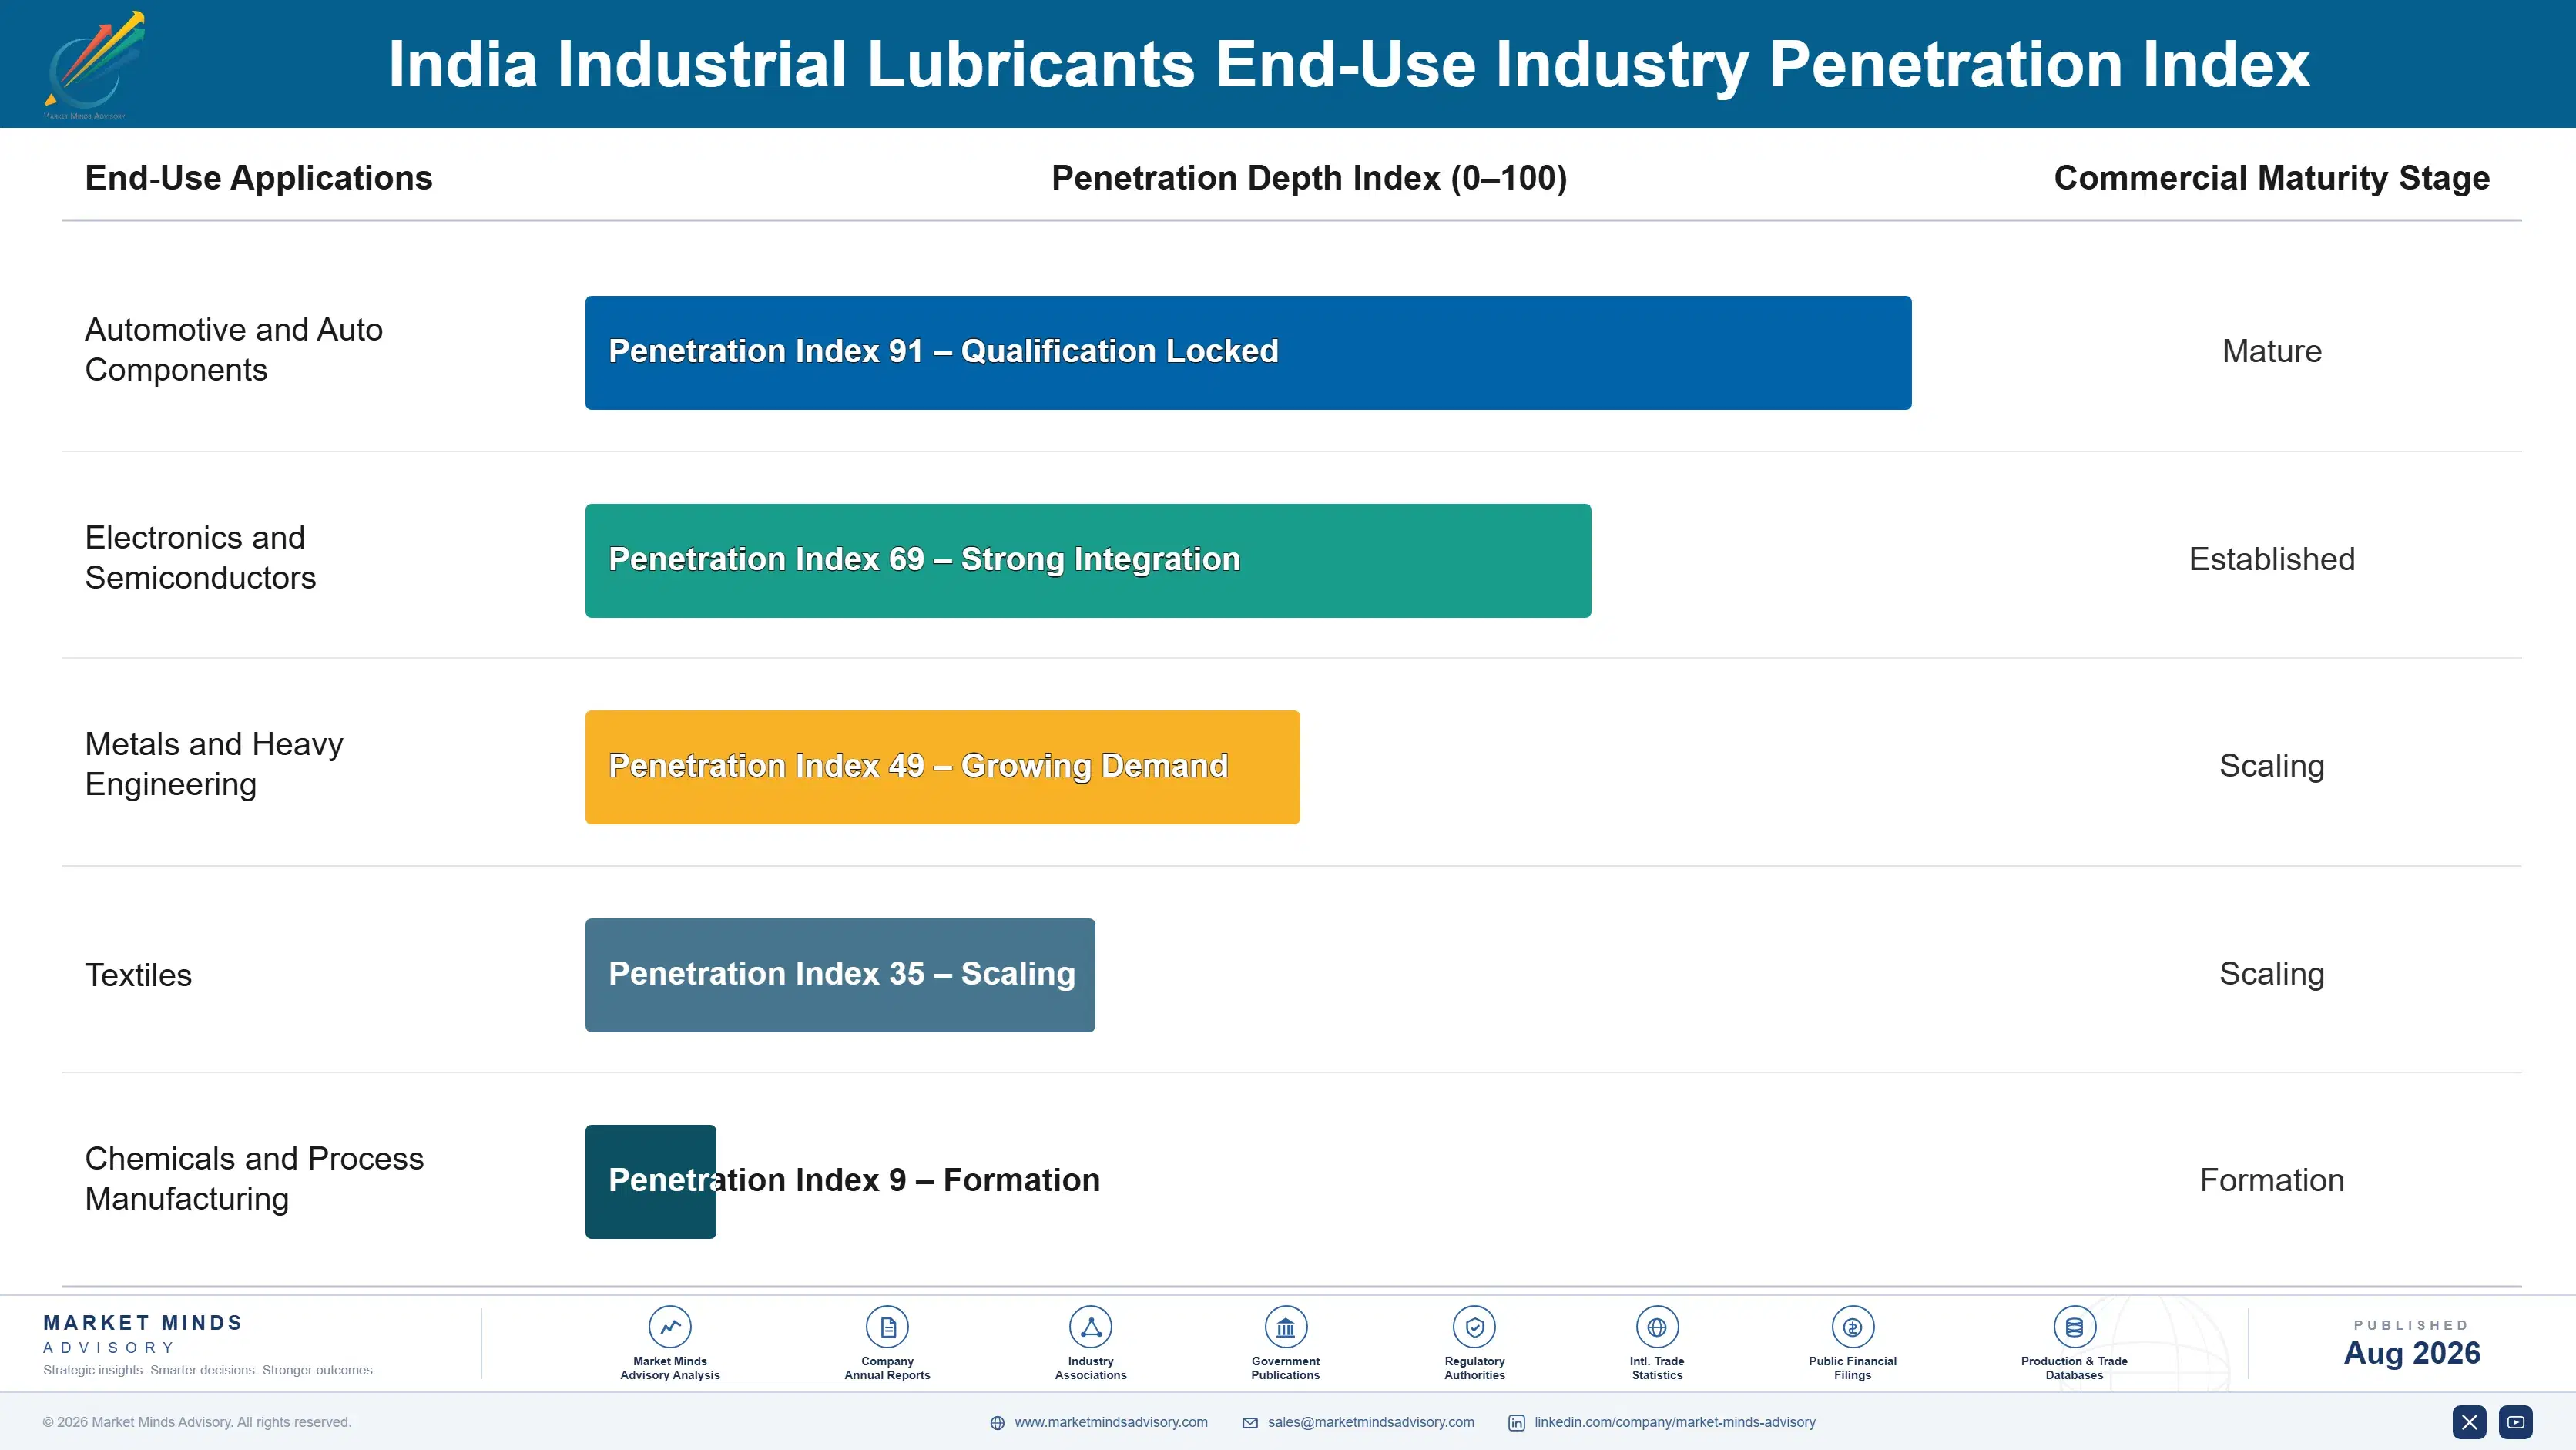
Industrial lubricant demand behaves like an annuity once a supplier is qualified against a manufacturer's equipment warranty specifications, since switching suppliers mid-warranty period risks voiding coverage, a risk most manufacturing buyers actively avoid unless forced by persistent cost or performance problems with their current lubricant supplier. Requalifying an alternative supplier mid-warranty period can add unwanted risk to a facility's coverage.
Adoption stickiness varies meaningfully by end-use vertical. Precision electronics and auto component manufacturers show the deepest stickiness given strict equipment warranty and quality certification requirements, while general industrial buyers show moderate stickiness tied to periodic competitive tendering, and small manufacturing enterprises show the least stickiness, frequently switching suppliers when short-term price differentials widen beyond typical purchasing thresholds set during initial qualification. Electronics manufacturers increasingly mirror this stickiest-tier behavior given comparably strict quality requirements.

A generational shift in buyer profiles is underway as manufacturing procurement teams increasingly include dedicated maintenance and reliability engineers rather than relying solely on purchasing staff, changing how suppliers must present technical performance data and total cost of ownership analysis during the qualification and renewal process. Younger procurement staff also weigh total cost of ownership data more heavily than their predecessors did.
india-industrial-lubricants-market-trends-end-use-penetration-index-1787310914588

Where Technical Service Beats Distribution Alone

These are among the four positions where our research anticipates prominent divergence between winners and laggards over the coming forecast period. Each is grounded in the demand model, the regulatory perimeter, and the announced capacity pipeline.
01 / SYNTHETIC FORMULATION INVESTMENT

Prioritize synthetic formulation depth ahead of the manufacturing upgrade cycle

Suppliers who invest early in synthetic formulation capability and secure original equipment manufacturer warranty approvals will capture a disproportionate share of the manufacturing upgrade cycle underway across production-linked incentive scheme facilities nationwide. Waiting until synthetic demand fully materializes risks losing qualification slots to faster-moving competitors who have already built the necessary formulation and warranty compliance track record across comparable facility types. Early movers can also charge meaningful premiums for documented synthetic formulation depth that slower, less-prepared competitors cannot yet offer their industrial customers.
02 / DISTRIBUTION NETWORK EXPANSION

Extend distribution reach into tier two and tier three manufacturing clusters

Extending branded distribution networks into tier two and tier three manufacturing clusters beyond traditional metro industrial belts captures disproportionate share of new production-linked incentive scheme facility contracts, since these emerging hubs often lack established multinational supplier presence. This positioning matters most as manufacturing investment increasingly spreads beyond traditional industrial corridors toward newer state-level industrial parks, and companies without this reach face a widening gap versus faster-moving multinational and domestic rivals. Suppliers without this expanded reach risk losing contracts to regional blenders who move faster.
03 / TECHNICAL SERVICE BUNDLING

Pair lubricant supply with condition monitoring to defend premium pricing

Bundling condition monitoring services with synthetic lubricant supply creates differentiation that pure commodity distributors cannot replicate, defending premium pricing of 10 to 15% on contracts with precision manufacturers. This approach matters most for hydraulic and metalworking fluid categories where equipment failure carries high downtime costs buyers actively work to avoid, and suppliers without comparable capability increasingly lose bids even at similar base pricing levels. Suppliers without this service capability should expect gradual share erosion in accounts where competitors already offer bundled technical support.
04 / SME SEGMENT FINANCING

Offer financing tools to convert price-sensitive SME buyers toward synthetics

Offering extended payment terms and total cost of ownership calculators targeted at small and medium manufacturing enterprises converts price-sensitive buyers who would otherwise remain on cheaper mineral lubricants, capturing incremental synthetic volume this segment previously avoided entirely. This approach matters most given how large the SME segment remains within India's total industrial base, and companies that delay this financing investment risk ceding the segment permanently to more flexible rivals. Suppliers without comparable financing tools risk losing this segment to competitors willing to extend more flexible payment terms.

Engagement Snapshot From the Field

A live engagement with an industry participant carrying material or product regulatory and market exposure ahead of a defining policy shift, showing how our research translates into a defensible multi-year portfolio strategy.
MARKET MINDS ADVISORY · CLIENT ENGAGEMENT SUMMARY
India Industrial Lubricants Producer Strategic Portfolio Review and Transition Roadmap 2026·Investment Scenario on India Industrial Lubricants Exposure Evaluation 2025-26
CLIENT PROFILE
The client is a mid-sized auto component manufacturing group operating several precision machining facilities across Tamil Nadu and Karnataka, with combined annual revenue in the range of $340 million (client-reported, unverified by MMA). The group was consolidating from six regional lubricant suppliers to a smaller preferred vendor panel ahead of a planned capacity expansion tied to new export orders from global automakers.
STRATEGIC CHALLENGE
The manufacturing group needed to select lubricant suppliers capable of meeting stricter international quality certification standards required by new export customers while consolidating purchasing volume to secure better pricing terms. Existing supplier relationships varied widely in formulation quality and technical service capability, creating inconsistent machining performance across the group's different facilities.
MMA APPROACH
MMA conducted a comparative supplier capability assessment covering seven candidate metalworking fluid and hydraulic lubricant suppliers, evaluating formulation quality, technical service capacity, and pricing structure across consolidated contract volumes. The engagement included facility visits and review of supplier performance data against the specific machining tolerance requirements applicable to each production line.
KEY FINDINGS
  1. Only two of seven candidate suppliers had formulations meeting the international quality certification standards required by the group's new export customers. across the group's precision facilities.
  2. Consolidating purchasing volume to a two-supplier panel reduced projected annual lubricant spend by an estimated 12% (client-reported, unverified by MMA). once the transition was fully complete.
  3. Suppliers offering bundled condition monitoring services demonstrated measurably lower tool wear rates across comparable precision machining production lines. during peak multi-shift production periods.
  4. Three candidate suppliers lacked sufficient regional technical service staffing to support the group's planned multi-facility capacity expansion timeline. within the group's planned timeline.
CLIENT PROFILE
The client is a mid-sized auto component manufacturing group operating several precision machining facilities across Tamil Nadu and Karnataka, with combined annual revenue in the range of $340 million (client-reported, unverified by MMA). The group was consolidating from six regional lubricant suppliers to a smaller preferred vendor panel ahead of a planned capacity expansion tied to new export orders from global automakers.
STRATEGIC CHALLENGE
The manufacturing group needed to select lubricant suppliers capable of meeting stricter international quality certification standards required by new export customers while consolidating purchasing volume to secure better pricing terms. Existing supplier relationships varied widely in formulation quality and technical service capability, creating inconsistent machining performance across the group's different facilities.
MMA APPROACH
MMA conducted a comparative supplier capability assessment covering seven candidate metalworking fluid and hydraulic lubricant suppliers, evaluating formulation quality, technical service capacity, and pricing structure across consolidated contract volumes. The engagement included facility visits and review of supplier performance data against the specific machining tolerance requirements applicable to each production line.
KEY FINDINGS
  1. Only two of seven candidate suppliers had formulations meeting the international quality certification standards required by the group's new export customers. across the group's precision facilities.
  2. Consolidating purchasing volume to a two-supplier panel reduced projected annual lubricant spend by an estimated 12% (client-reported, unverified by MMA). once the transition was fully complete.
  3. Suppliers offering bundled condition monitoring services demonstrated measurably lower tool wear rates across comparable precision machining production lines. during peak multi-shift production periods.
  4. Three candidate suppliers lacked sufficient regional technical service staffing to support the group's planned multi-facility capacity expansion timeline. within the group's planned timeline.
RECOMMENDED STRATEGY
Phase 1: Phase 1 (Months 1 to 2): Finalize supplier panel selection based on quality certification, technical service capacity, and consolidated pricing terms. Phase 2: Phase 2 (Months 3 to 6): Transition existing facilities to the new preferred supplier panel while monitoring machining performance metrics closely. Phase 3: Phase 3 (Months 7 to 12): Extend the new supplier relationships to the planned capacity expansion facilities as they come online.
OUTCOME
The manufacturing group consolidated to a two-supplier panel offering bundled condition monitoring services and formulations meeting all required export quality certifications. Annual lubricant procurement costs came in approximately 10% below the prior multi-supplier arrangement (client-reported, unverified by MMA), while machining performance consistency improved meaningfully across all covered production facilities.

Frequently Asked Questions

Foundational context covering the market sizes, CAGR, scope, country, region and competition that inform every finding below. This section is provided to cover basics and most often pre-purchase conversations, answered from the MMA Primary Research Dataset.

What is the current size of the India Industrial Lubricants Market?

The market is valued at approximately $3.6 billion in 2025. Growth is driven by manufacturing expansion under production-linked incentive schemes across major industrial states, with capacity additions accelerating nationwide.

How large will the India Industrial Lubricants Market be by 2036?

The market is projected to reach approximately $7.41 billion by 2036. Sustained manufacturing capacity growth and synthetic formulation adoption, reinforced by regional industrial cluster expansion, drive this trajectory forward.

What is the CAGR for the India Industrial Lubricants Market 2026 to 2036?

The market is forecast to grow at a compound annual growth rate of 6.8% between 2026 and 2036. Hydraulic fluids are growing considerably faster than the overall market average.

Which segment is growing fastest?

Hydraulic fluids are growing fastest at approximately 9.2% CAGR, roughly 1.35 times the overall market rate. Growth is driven by production-linked incentive scheme facility commissioning nationwide.

Who are the major companies in the India Industrial Lubricants Market?

Leading suppliers include Castrol India, Indian Oil Corporation, Hindustan Petroleum, Shell India, and Gulf Oil Lubricants India. Together these five hold roughly 42% combined market share.

Which country is growing fastest?

This report's scope is confined to India, which is forecast to grow at approximately 6.8% CAGR through 2036. Southern manufacturing states lead adoption of synthetic lubricant formulations.

Report Segmentation Architecture

The full report scope spans multiple orthogonal segmentation dimensions, with cross-tabulated demand data provided for each dimension pair. Coverage extends further to regional breakdowns, trend trajectories, and the competitive detail needed to support segment-level decision-making.

By Lubricant Type

  • Hydraulic Fluids
  • Gear and Transmission Oils
  • Greases
  • Metalworking Fluids
  • Industrial Process Oils
  • Compressor and Turbine Oils

By End-Use Industry

  • Automotive and Auto Components
  • Electronics and Semiconductors
  • Metals and Heavy Engineering
  • Textiles
  • Chemicals and Process Manufacturing

By Commercial Dimension

  • Direct Industrial Contracts
  • Branded Distributor Networks
  • Bundled Technical Service Agreements
  • Third-Party Regional Dealers

By Region

  • North America
  • Western Europe
  • East Asia
  • South Asia and Pacific
  • Latin America
  • Middle East and Africa
  • Eastern Europe

Scope, Methodology, and Coverage

Every figure in this report is reproducible from documented input assumptions. The scope below maps the historical period, the forecast horizon, the segmentation dimensions, and the countries covered, alongside the underlying primary and qualitative methodology.
Historical Period
2020 to 2025
Forecast Period
2026 to 2036
Base Year
2025 (USD billions; MMA Primary Research Dataset, August 2026)
Market Definition
This report covers lubricants formulated for industrial machinery, manufacturing equipment, and process applications within India, including hydraulic fluids, gear and transmission oils, greases, metalworking fluids, and industrial process oils. It excludes automotive engine oils sold through retail and passenger vehicle service channels.
Quantitative Units
USD billions (current prices); kilolitres where volume data is available
Segmentation Dimensions
By Lubricant Type; By End-Use Industry; By Commercial Dimension; By Region
Regions Covered
North America, Western Europe, East Asia, South Asia and Pacific, Latin America, Middle East and Africa, Eastern Europe
Countries Covered
India, with reference data for USA, China, Germany, Japan, South Korea, Saudi Arabia, UAE, and additional markets relevant to base oil and additive trade linkage
Key Companies Profiled
Castrol India, Indian Oil Corporation, Hindustan Petroleum, Shell India, Gulf Oil Lubricants India, Bharat Petroleum, Valvoline Cummins, Total Energies India, ExxonMobil Lubricants India, Savita Oil Technologies, Panama Petrochemicals, Balmer Lawrie, Tide Water Oil Company, Veedol International, Apar Industries, Repsol Lubricants India, Phillips 66 Lubricants India, Fuchs Lubricants India, Idemitsu Lubricants India, Petronas Lubricants India
Quantitative Methodology
Primary survey, n=3,800 respondents, Q4 2025, six countries; demand-side model with trade association cross-validation
Qualitative Methodology
47 expert interviews, Q4 2025; applied to validate demand model assumptions, identify emerging dynamics, and assess competitive positioning
Report Format
PDF and XLSX data workbook (Word format preview document)
Publisher
Market Minds Advisory
Report Code
MMA-2026-CHM-103
Published
August 2026
Contact
sales@marketmindsadvisory.com | www.marketmindsadvisory.com

Purchase the full India Industrial Lubricants Market Report (2026 to 2036).

The full report delivers detailed segment-level sizing across all six lubricant type categories, state-level demand breakdowns across India's major industrial clusters, and in-depth competitive profiles covering twenty companies active in this market. It includes granular analysis of production-linked incentive scheme facility commissioning timelines, base oil import sensitivity modeling, and supplier qualification pathway guidance for manufacturers navigating synthetic formulation upgrades. Buyers also receive access to underlying data tables and a dedicated analyst briefing call. The report also profiles emerging biodegradable and fire-resistant hydraulic fluid formulations gaining early commercial traction across safety-conscious buyers.
State-level sizing across major industrial clusters
PLI facility commissioning tracker by sector
Base oil import sensitivity modeling and tools
Twenty-company competitive benchmarking profiles provided in full
Supplier qualification pathway guidance and checklists
Dedicated analyst briefing call included free

Built For The People Who Decide

From boardroom strategy to bench-side execution, this report is read cover-to-cover by leaders shaping the next decade of their industry, turning demand scenarios, market dynamics and valuation benchmarks into decisions.
CXOs/ Presidents/ VPs/ Managers
M&A and Corporate Development
Strategy Teams and R&D Heads
Procurement and Product Directors
Regulatory and Compliance Leaders
Investor Relations and Equity Analysts