Market Minds Advisory
India Digital Commerce Market

India Digital Commerce Market: India Digital Commerce: Penetration, Cost to Serve and the Economics of Reaching the Next Buyer

Around 8% of Indian retail spending moves through digital channels, and the constraint is not demand at all but the cost of physically serving a buyer who orders eleven dollars of goods.

Lead Analyst

Published

September 2026

Make Smarter Decisions with Customized Research Insights

Request a free sample report and evaluate market opportunities, growth trends, and competitive dynamics relevant to your business needs.

2025 MARKET VALUE$640.0BMarket Size 2025
2036 FORECAST VALUE$1754MBase Case , 2026 to 2036
CAGR 2026 TO 20369.6 %Bull 10.8% / Bear 8.4%
INCREMENTAL OPPORTUNITY$1053MNet 10- year value creation
EXPANSION MULTIPLE2.50x2036 value over 2026 base
Strategic Levers
M&A Pipeline
Regional Outlook
Country Rankings
Competitive Intelligence
Segmental Deep-dive
Call-Us : 91 93563 13602

Executive Snapshot and Market Trajectory.

Digital commerce in India reaches roughly 8% of retail spending, which sounds like enormous headroom and is really a cost problem. Serving an order worth about USD 11 across 19,000 postal codes costs more than the platform retains on it. The headroom is real and expensive.
Quick commerce is the segment that changed the arithmetic, growing at 14.4% globally and far faster inside India, half again the market rate of 9.6%. Dark stores work in Indian cities because density and delivery labour cost make them viable at a scale no Western market supports. Social and creator-led selling follows at 12.8%. South Asia and Pacific takes 24% of global value. Meesho and similar entrants serve smaller cities on thinner economics.
Concentration sits near 34% across the top five on measured gross merchandise value, and India's own market is contested rather than settled. Payment rails through UPI removed the transaction friction years ago. What remains is logistics cost at around 14% of order value and an 18% return rate that apparel categories drive almost entirely. Cash on delivery once made both problems considerably worse than they are today.
Market Definition
This market covers merchandise and services transacted through digital commerce channels, spanning horizontal marketplace commerce, quick commerce and instant delivery, social and creator-led commerce, direct-to-consumer brand channels, vertical specialist commerce, and cross-border digital commerce. Value is measured as gross merchandise value transacted through the channel, with India treated as the analytical centre within a global sizing frame. Digital financial services, travel and ticketing, food service delivery, business-to-business procurement platforms, and offline retail with digital payment acceptance are excluded.
Base Year Value
$640.0B in 2025 (MMA Primary Research Dataset, September 2026)
Forecast Period
2026 to 2036, eleven discrete annual values
CAGR
9.6% base case. Bull 10.8%. Bear 8.4%.
Fastest Growth Segment
Quick Commerce and Instant Delivery: 14.4% CAGR
Fastest Growth Country
India: 14.0% CAGR
Fastest Growth Region
South Asia and Pacific: 12.0% CAGR
Largest Region
East Asia: 32% of 2025 global value
Market Leaders
Amazon, Alibaba Group, Flipkart, Shopify and MercadoLibre lead on measured gross merchandise value transacted. Source: MMA Primary Research Dataset, July 2026.
Primary Survey
n=3,800 procurement and R&D decision-makers, Q4 2025, six countries
Methodology
Demand-side build-up, cross-validated against public data, 47 expert interviews

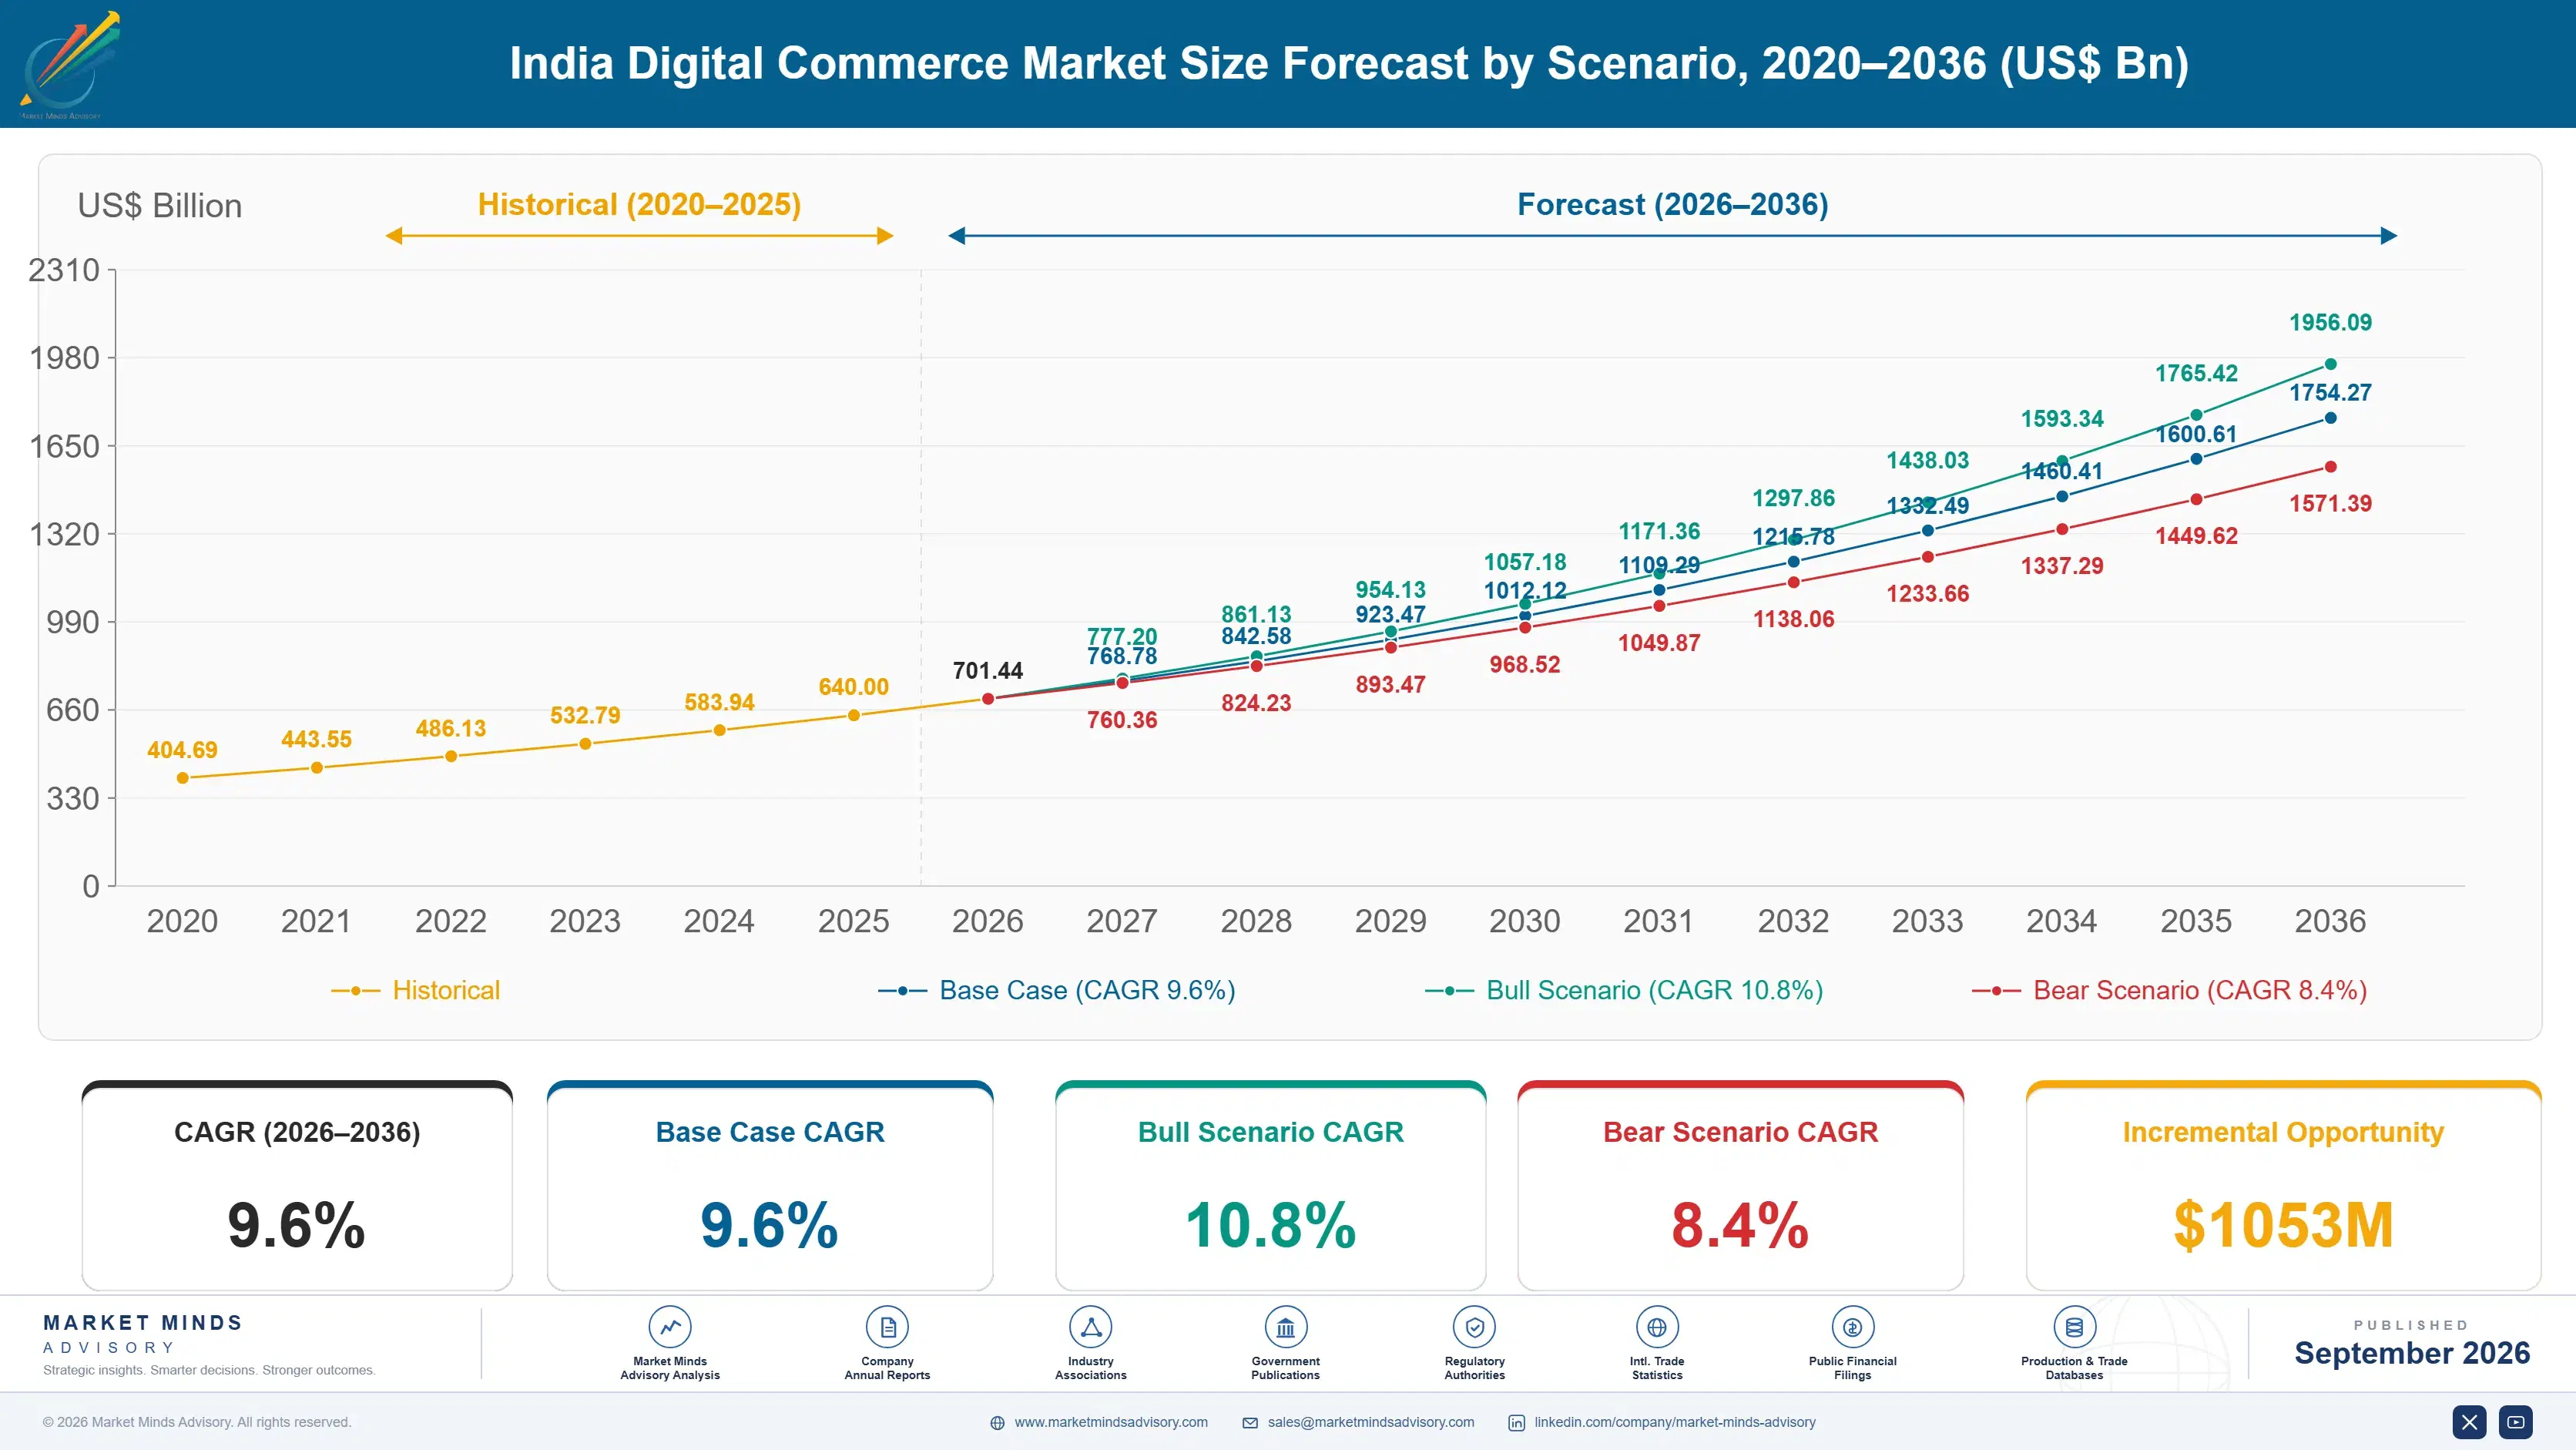
India Digital Commerce Market Forecast Scenarios

india-digital-commerce-market-size-forecast-scenario-1788425229983
Growth ran at 8.6% from 2020 to 2025 and the Indian portion of it ran considerably faster, driven by payment rails rather than by shopping preference. UPI made small-value digital transactions free and instant, which removed the friction that cash on delivery had imposed on every order. Quick commerce arrived late and reshaped urban buying behaviour faster than anything before it.
The base case at 9.6% rests on three mechanisms. Penetration expansion into smaller Indian cities continues, though each new buyer costs more to serve than the last because delivery density falls away from metropolitan areas. Quick commerce converts grocery and convenience spending that never moved online before, at frequencies horizontal marketplaces never achieved. Third, the Open Network for Digital Commerce, backed by DPIIT, lowers the cost of a small seller reaching buyers without joining a large platform.
The bull case at 10.8% assumes quick commerce order frequency holds as it expands beyond the largest cities, which would change unit economics decisively. The bear case at 8.4% is that logistics cost at 14% of order value and returns at 18% prove permanent rather than temporary, capping profitable expansion at roughly the buyer base already served today.

Penetration Is Cheap, Delivery Is Not

India's digital commerce numbers look like an opportunity until the unit economics are laid out. Penetration at around 8% of retail suggests a decade of expansion available. Average order value of about USD 11 against logistics cost at 14% and platform take rate at 6.4% suggests otherwise: every incremental order in a less dense area destroys value unless something changes about how it is fulfilled.
TOP FIVE CONCENTRATION34%Moderately concentrated across large horizontal platforms operating worldwide
INDIA ONLINE PENETRATION8%Retail spending transacted digitally rather than in stores
AVERAGE ORDER VALUEUSD 11Typical basket size across Indian digital commerce transactions
PLATFORM TAKE RATE6.4%Share of merchandise value retained by the platform
RETURN RATE18%Orders sent back, concentrated heavily in apparel categories
LOGISTICS COST SHARE14%Fulfilment and delivery expense measured against order value
What changed was frequency rather than basket size. Quick commerce built dark stores serving small radii, which works in Indian cities because residential density is extreme and delivery labour is inexpensive relative to order value. A buyer ordering four times a week from a store two kilometres away has different economics from one ordering twice a month from a regional warehouse. That is the entire innovation, and it does not transfer to lower-density geographies.
Returns remain the least discussed problem. At 18% overall and considerably higher in apparel, the reverse logistics cost falls entirely on the platform and the merchandise frequently cannot be resold at full value. Cash on delivery made this worse for years by removing commitment at the point of order. UPI adoption reduced that, though category behaviour drives most of what remains.
"Everyone points at 8% penetration as though the remaining 92% is waiting to be collected. It is not. The buyers already served are the cheapest ones to reach, and each additional cohort costs more per order than the one before it."
Director, Digital Commerce and Consumer Platforms Practice · MMA Technology Practice · September 2026

Market Trends

Dark Stores Replace Warehouses in Dense Indian Cities

Quick commerce operators built networks of small fulfilment points serving radii of two to three kilometres, which cuts delivery time to minutes and delivery cost per order well below regional warehouse fulfilment. The model works because Indian urban residential density is extreme and delivery labour costs a fraction of order value. Order frequency rises to several times weekly, which spreads fixed store cost across far more transactions. It is a density arbitrage rather than a technology advance, and it degrades quickly outside the largest cities. Second-tier city expansion tests exactly that assumption right now.
Market Impact: Serves orders averaging USD 11
Open Network Commerce Separates Discovery From Platforms

The Open Network for Digital Commerce, backed by DPIIT, lets buyers and sellers transact across applications rather than within a single platform, which in principle removes the platform's ability to price its position. Adoption has concentrated in categories where sellers are numerous and margins thin, since those are the sellers a 6.4% take rate hurts most. Progress has been slower than announcements suggested, because discovery, trust and fulfilment are harder to unbundle than payment was. The direction remains a genuine constraint on platform pricing. Sellers with the thinnest margins move first, which is telling.
Market Impact: Grows at 14.4% annually

Market Opportunities and Growth Drivers

Payment Rails Removed Small Transaction Friction Entirely

UPI made small-value digital payment instant and effectively free, which mattered more in India than anywhere else because the average order sits near USD 11 and card economics never worked at that size. Cash on delivery had imposed handling cost, settlement delay and elevated return risk on every order it touched. The shift toward prepaid transactions cut working capital tied up in collection and reduced casual returns measurably. Payment is now solved, which usefully exposes logistics as the remaining constraint. Prepaid share has risen steadily and casual returns fell alongside it, which nobody predicted.
Market Impact: Costs 14% against 6.4% take

Quick Commerce Converts Spending That Never Moved Online

Grocery, household consumables and convenience purchases stayed in neighbourhood stores through fifteen years of digital commerce because delivery took days and the goods were needed immediately. Ten-minute delivery removes that objection completely, and the categories involved carry purchase frequencies horizontal marketplaces never approached. The segment grows at 14.4% globally, half again the market rate of 9.6%, and considerably faster within India itself. Frequency rather than basket size is what makes the economics work at all. Basket sizes stay small and that turns out not to matter much. Fixed store cost is what frequency has to cover.
Market Impact: Returns run at 18% overall

Market Restraints and Challenges

Cost to Serve Rises With Every New Buyer Cohort

Logistics runs around 14% of order value against a platform take rate of 6.4%, and that gap widens as delivery moves into less dense areas where drop density per route falls. The root cause is geography rather than operating discipline: fewer deliveries per kilometre travelled means higher cost per order, permanently. Commercially this caps profitable expansion well short of the addressable population. Operators mitigate through shared delivery networks, third-party logistics partnerships and higher minimum order values, which trade volume for viability. None of those mitigations changes the underlying geography that causes the problem.
Market Impact: Serves radii of 2 kilometres

Apparel Returns Destroy Margin on the Highest-Value Category

Overall returns run near 18% and apparel runs considerably above that, which matters because apparel carries the margins that fund lower-value categories. The root cause is that buyers cannot assess fit or fabric before ordering, so ordering multiple sizes becomes rational behaviour. Commercially the platform absorbs reverse logistics and frequently cannot resell returned goods at full value. Mitigation runs through sizing tools, stricter return windows and seller-level return accountability, none of which addresses the underlying uncertainty a buyer faces. Apparel remains too commercially important for any platform to simply restrict it.
Market Impact: Contests a 6.4% take rate
4 additional market trends, 3 additional growth drivers, and 2 additional restraints and challenges are covered in the full report. Contact sales@marketmindsadvisory.com to access the complete intelligence.

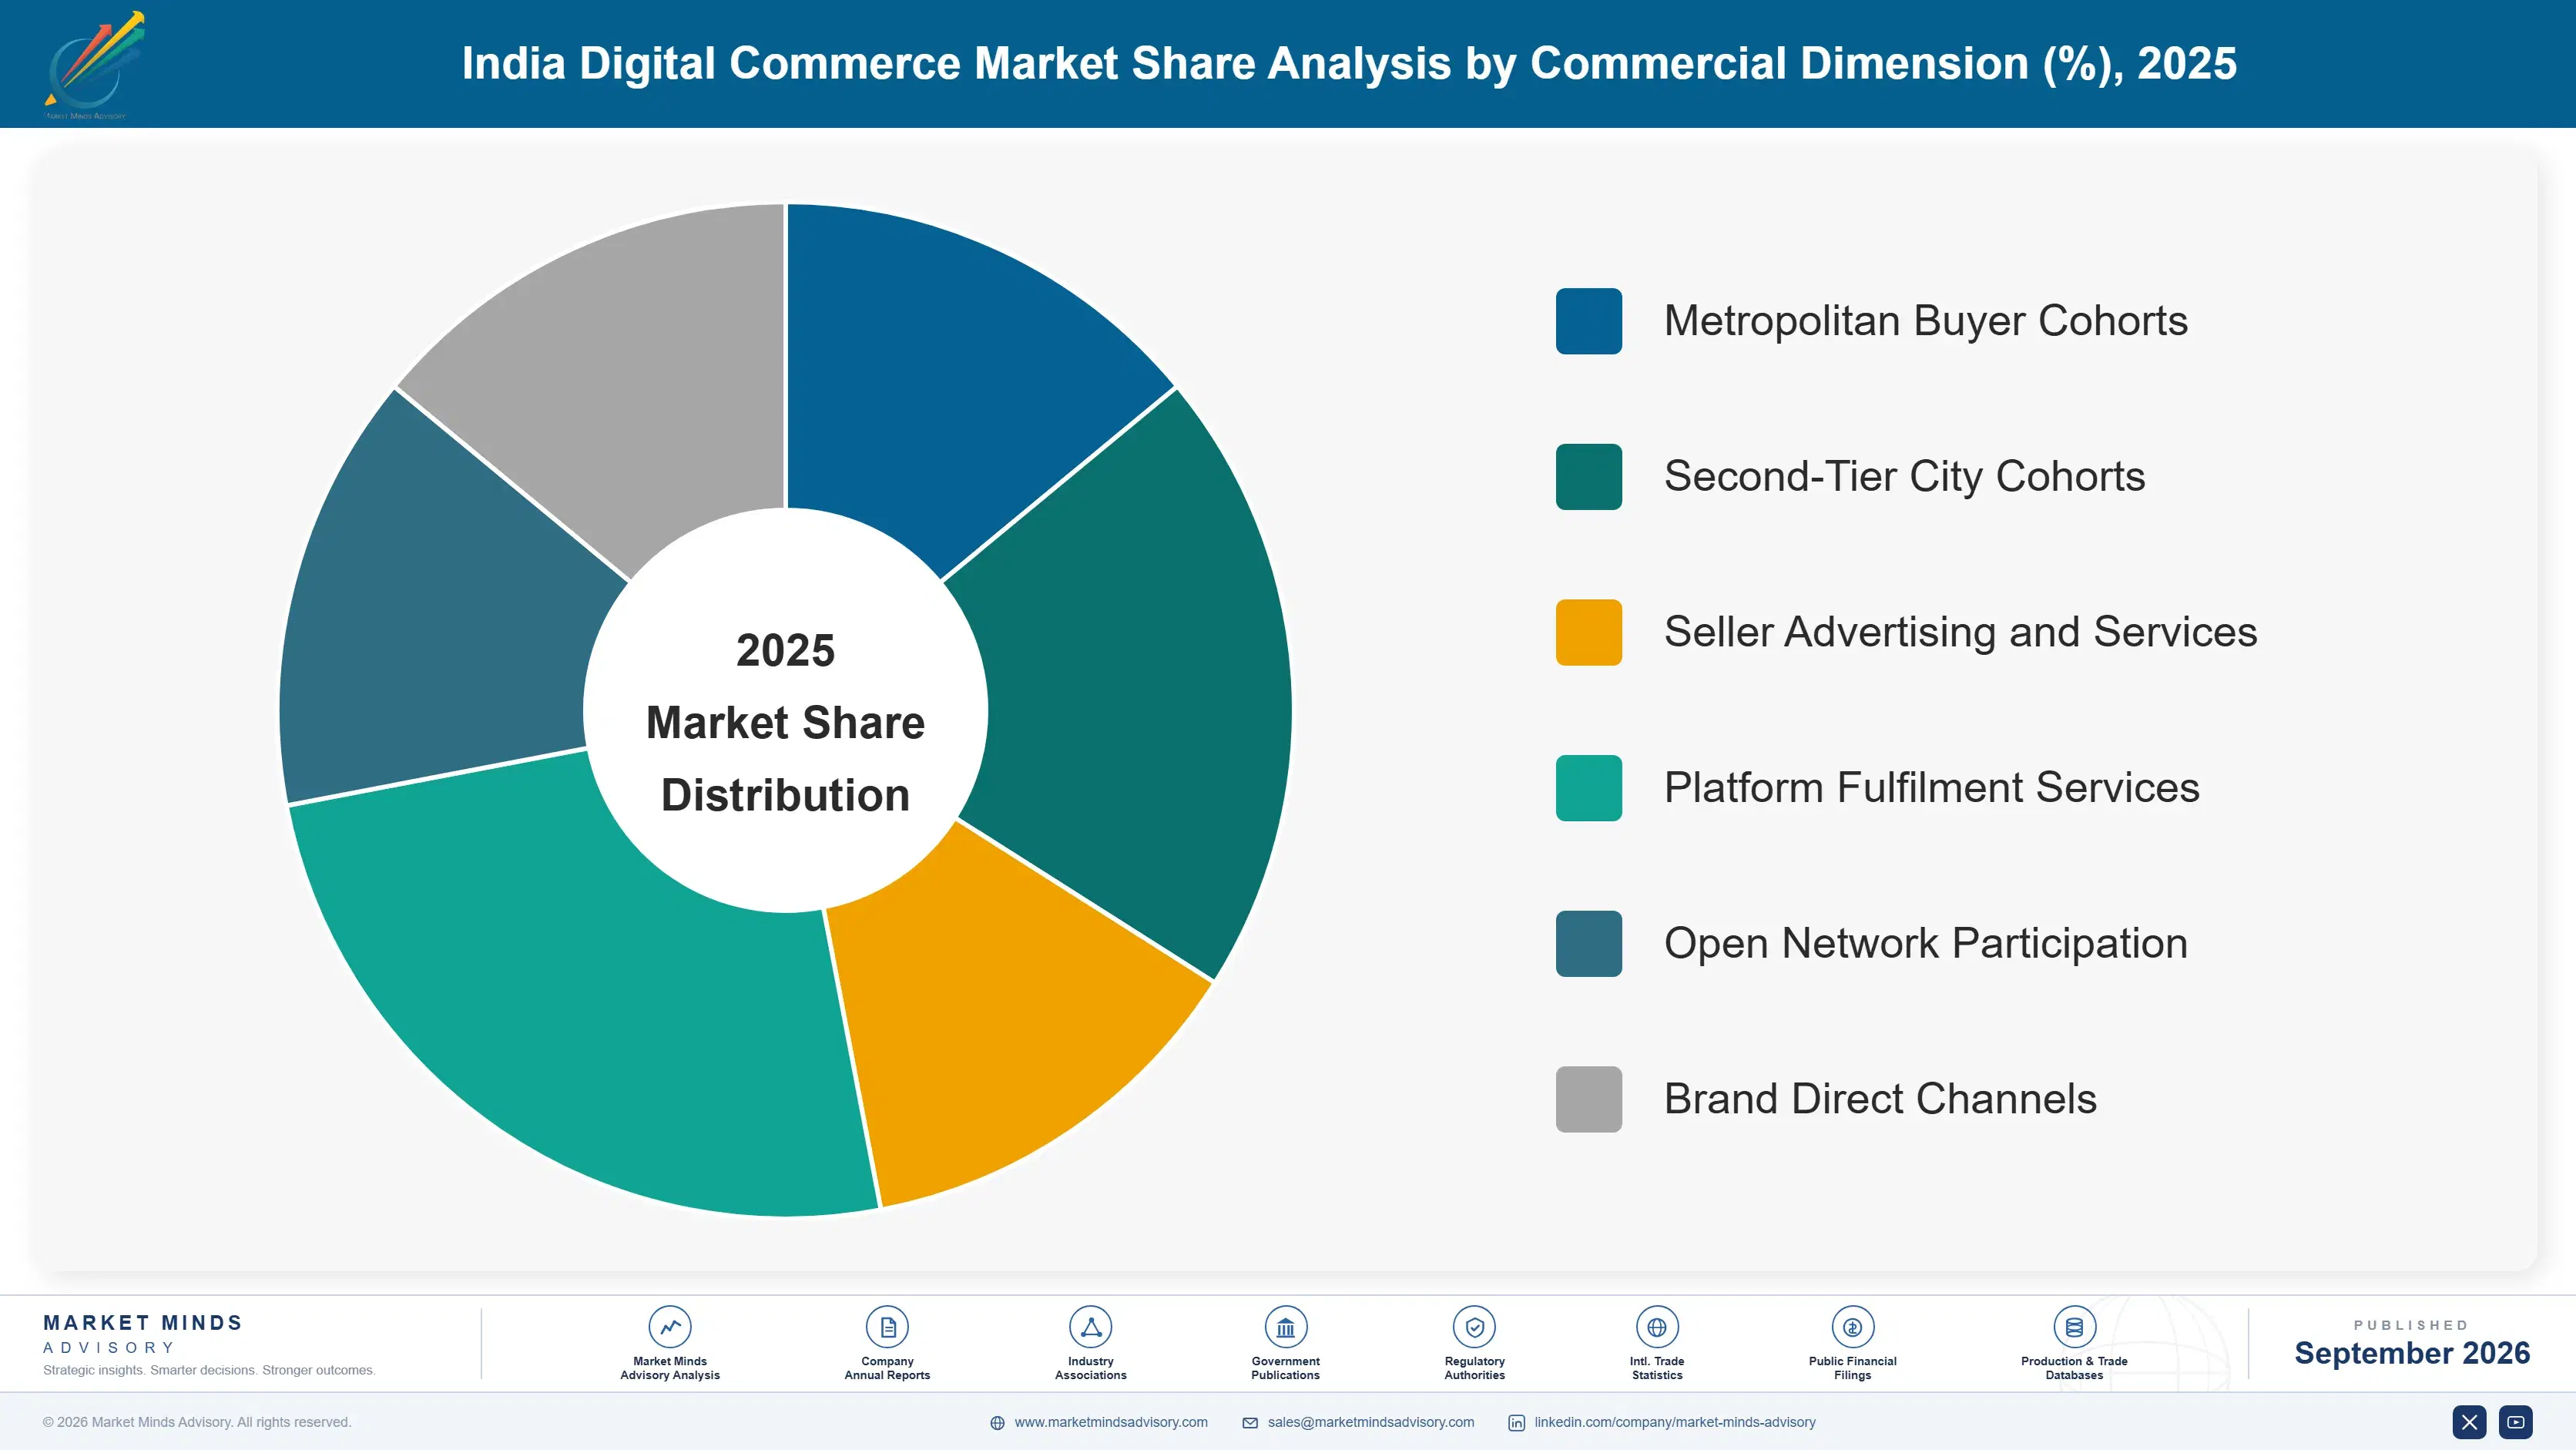
Segment CAGR and Growth Architecture

Segmentation follows the commerce model, because the model determines cost to serve and purchase frequency together. A marketplace order and a ten-minute grocery delivery share a payment rail and almost nothing else: different fulfilment, different frequency, different basket, and entirely different arithmetic on whether the transaction earns anything at all. The two are not the same business at all.
india-digital-commerce-market-market-share-analysis-1788425230520

Quick Commerce and Instant Delivery

Quick commerce grows at 14.4%, half again the market rate of 9.6%, and considerably faster inside India where the model originated commercially. Dark stores serving two to three kilometre radii cut delivery cost below warehouse fulfilment and drive purchase frequency to several times weekly, which is what spreads fixed cost across enough orders to work. The categories involved, grocery and household consumables, never moved online before because delivery took days. Expansion beyond the largest cities is the open question, since the economics rest on residential density rather than on anything the operator controls. Second-tier city entry is the segment's real commercial test, and the early results there are mixed rather than clearly encouraging.
CAGR 14.4%

Social and Creator-Led Commerce

Selling through social platforms and creators grows at 12.8% because discovery costs less when it happens inside content the buyer already came for, rather than through paid placement on a marketplace. Conversion runs higher than marketplace advertising achieves and the seller keeps more of the transaction, which matters at Indian basket sizes. Returns run above average, since purchases are frequently impulsive rather than considered. The commercial risk is dependence on platform algorithms that sellers do not influence and that change without warning or consultation. Vernacular-language creators reach buyers in smaller cities that marketplace search interfaces have never served well, which is where most of the incremental volume now originates. Attribution remains crude enough that sellers struggle to measure what works.
CAGR 12.8%
Full segment breakdown across 6 segments available in the complete report.

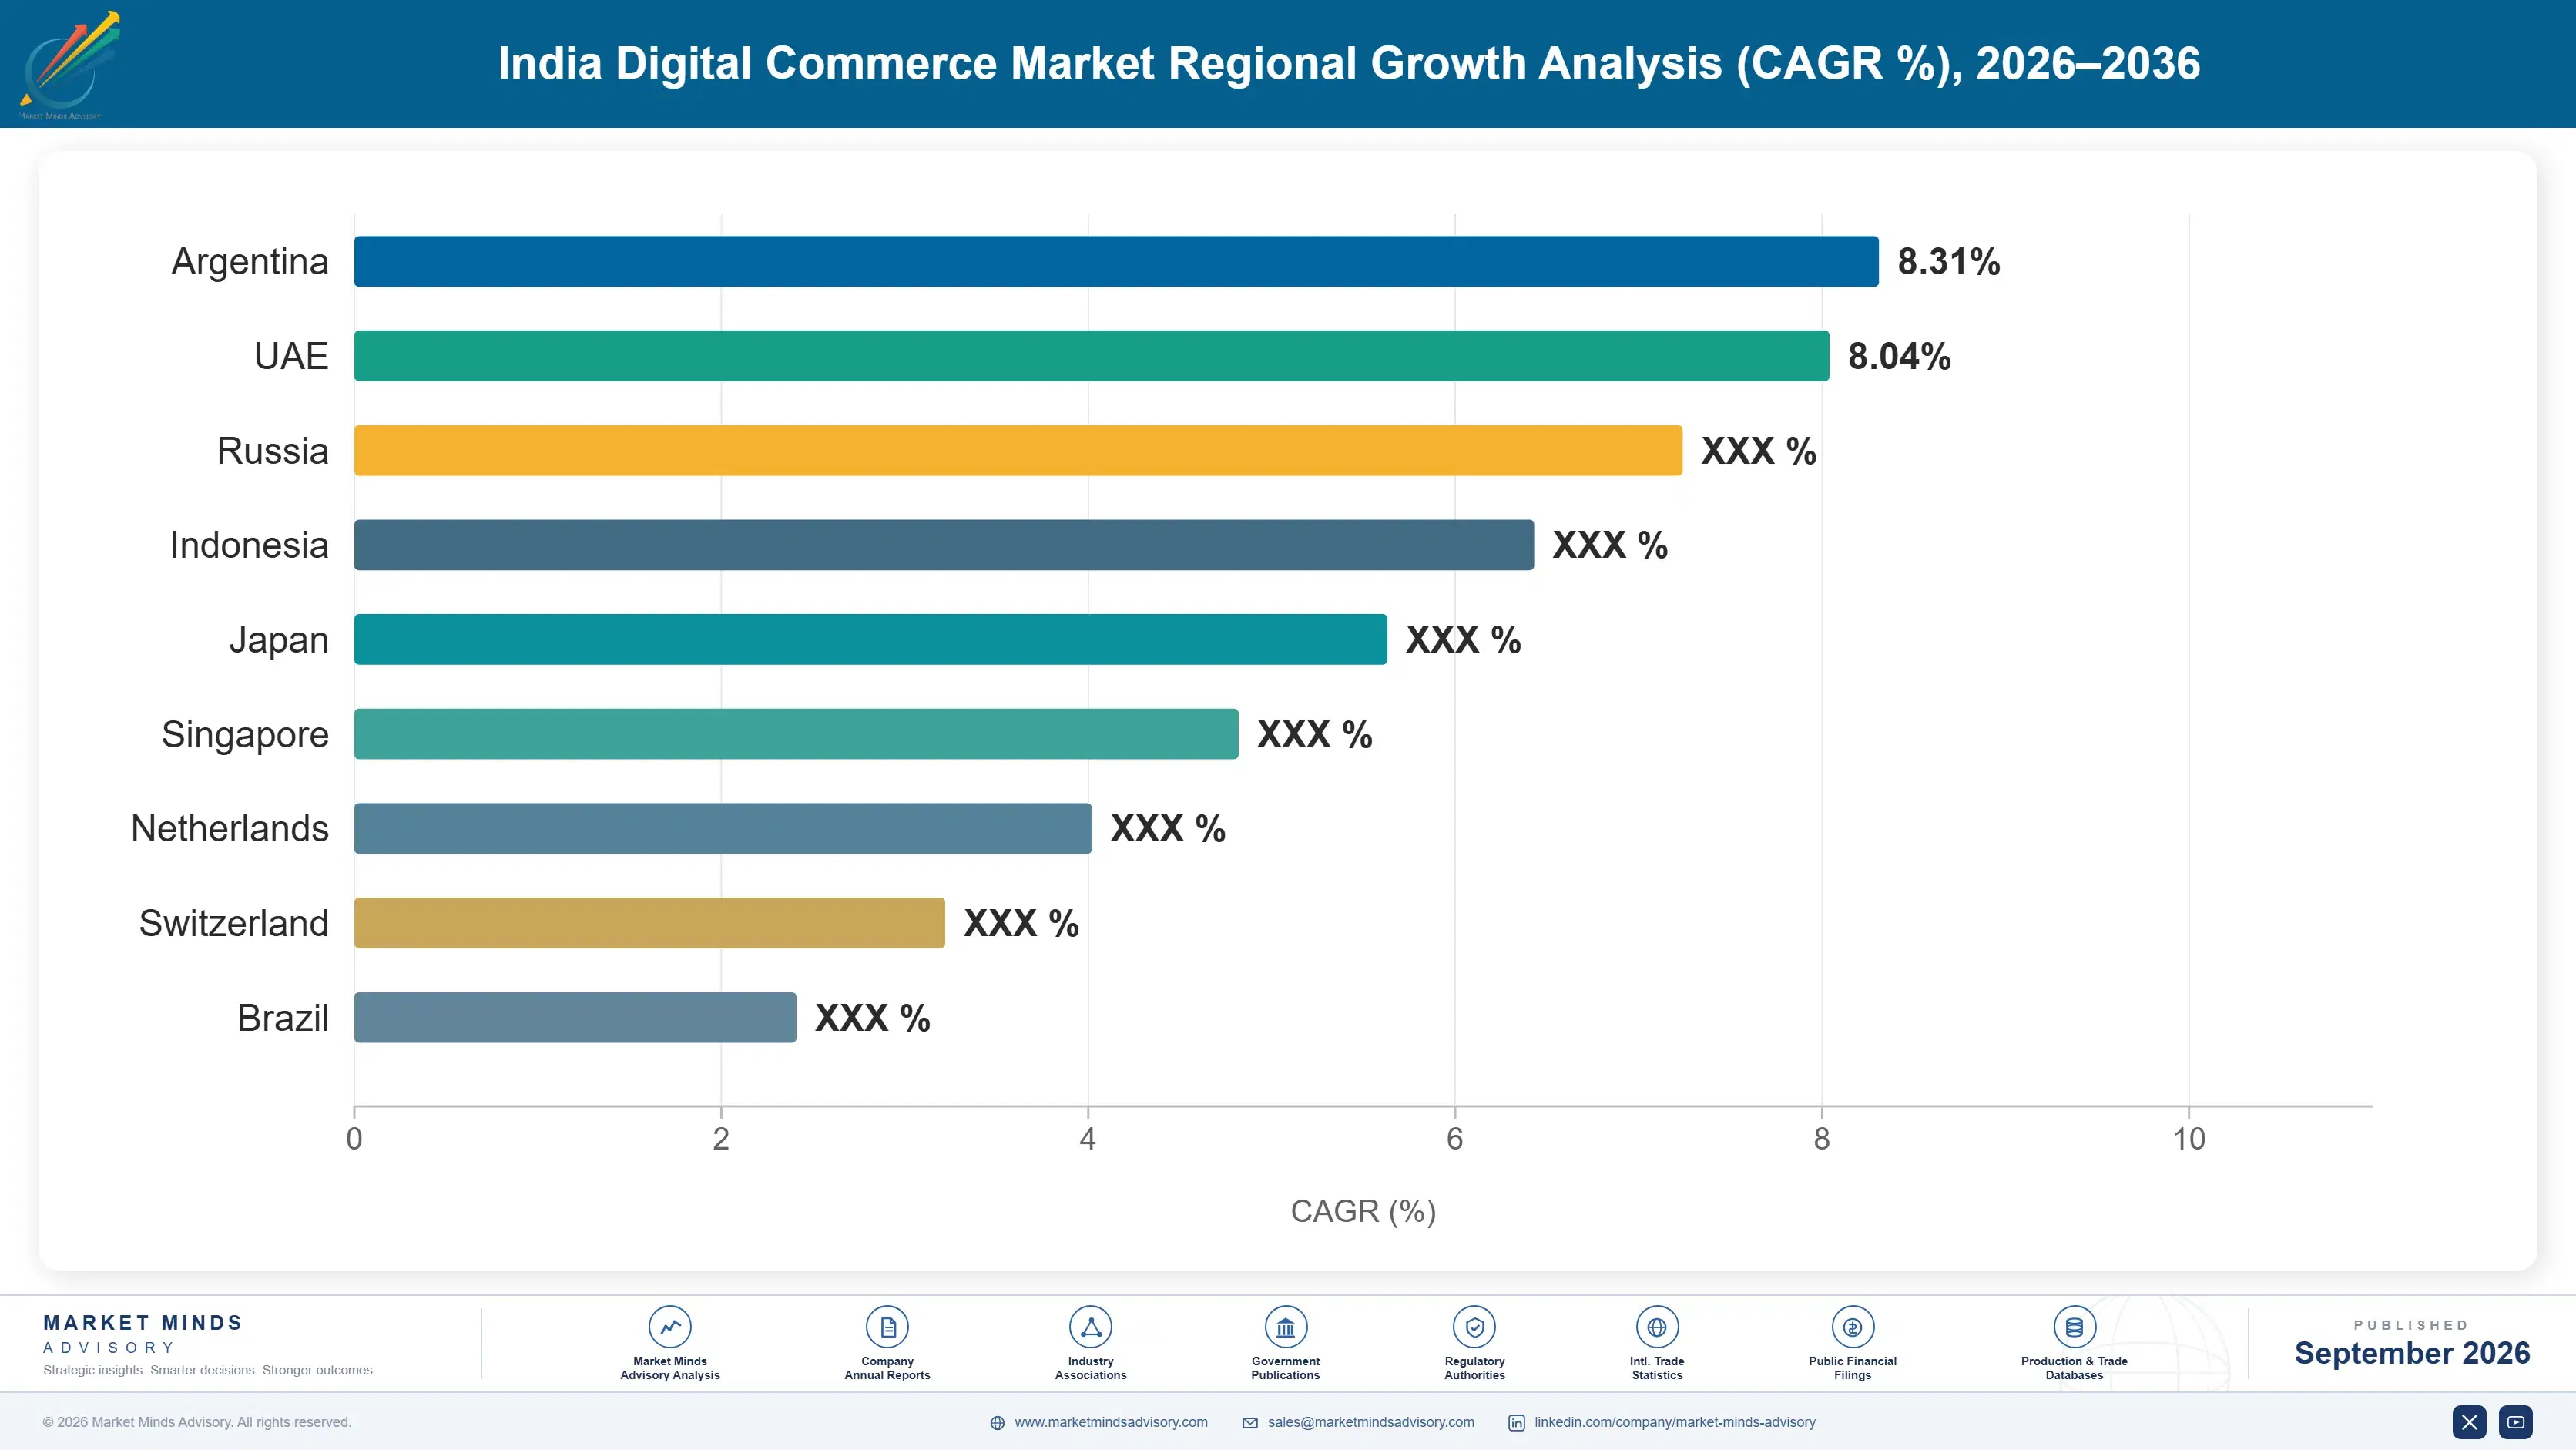
Regional Architecture and Country Demand Map

This report is India-centred within a global sizing frame, so regional shares describe where comparable digital commerce value transacts worldwide. Penetration, basket size and cost to serve differ enough between regions that direct comparison requires care. Cost to serve differs most, and it governs everything downstream.

South Asia and Pacific

The region holds 24%, above the regional band, because India alone is the analytical subject of this report and its digital commerce value is genuinely of that order within the global frame. India grows fastest of any country at 14.0%, on penetration near 8% of retail and delivery coverage now reaching roughly 19,000 postal codes. Quick commerce originated commercially here and works because urban residential density supports dark stores at radii no other market sustains. Southeast Asian markets add scale through platforms operating across Indonesia, Vietnam and the Philippines with similar basket economics and similar logistics constraints. Bangladesh and Sri Lanka contribute modest value on payment infrastructure that lags India considerably. Australian commerce is mature and small by comparison.
Share: 24% | CAGR: 12.0% (2026 to 2036)

East Asia

China dominates this region and dominates global digital commerce value outright, with online penetration several times India's level and a logistics network built over two decades of continuous investment. Live selling converts at rates no other market approaches and has been mainstream there for years rather than emerging. Japanese and Korean commerce is mature, high in basket value and slow growing, with concentration among domestic platforms rather than global ones. Regional growth at 10.6% runs modestly ahead of the market, carried by Chinese cross-border selling into other regions rather than by domestic expansion. Cross-border platforms shipping directly from Chinese manufacturers have taken share in apparel across several regions, at basket values and delivery times Western retailers cannot match on cost.
Share: 32% | CAGR: 10.6% (2026 to 2036)
Regional intelligence for 5 additional markets available in the complete report: North America, Western Europe, Latin America, Middle East and Africa, Eastern Europe. Contact sales@marketmindsadvisory.com.
india-digital-commerce-market-country-cagr-analysis-1788425231043

Making the Next Order Pay

Take rate at 6.4% against logistics at 14% of order value is the arithmetic every operator in India works within. Nothing about penetration headroom changes it. The levers that matter all attack frequency, basket composition or delivery density rather than pursuing further buyer acquisition. Buyer acquisition is the easiest of them and the least useful.

Build Frequency Before Chasing New Buyers

A buyer ordering four times weekly from a dark store two kilometres away generates completely different economics from one ordering twice monthly from a regional warehouse, even at identical basket size. Frequency spreads fixed fulfilment cost and raises retained value per buyer by roughly 60% in the operators that have measured it properly. Acquisition spending pursues cohorts that cost more to serve than the last. Operators still reporting buyer counts as the headline metric are measuring the thing that matters least here. The metric that decides profitability is orders per buyer per month.
Market Impact: Raises retained value per buyer by roughly 60%

Price Returns Back to Sellers by Category

Apparel returns run well above the 18% overall rate and the platform absorbs reverse logistics on goods it frequently cannot resell at full value. Seller-level return accountability, priced by category and by individual seller history, moves roughly 4 percentage points of that cost to the party who controls sizing accuracy and product description quality. Sellers object strongly and the better ones benefit immediately. It requires return data most platforms hold and very few actually use commercially. Platforms holding return data and not pricing it are subsidising the sellers who describe their products worst.
Market Impact: Moves roughly 4 percentage points of return cost

Share Delivery Density Rather Than Duplicating It

Multiple operators running separate delivery fleets over the same streets duplicates the exact cost that makes expansion unviable, and drop density per route is what determines cost per order. Shared or third-party networks raise drops per route and cut last-mile cost by around 20% in less dense areas where the problem is worst. Operators resist because delivery feels like a competitive asset. In lower-density geographies it is a cost centre nobody wins by owning alone. Third-party providers already aggregate volume across competing brands in most other logistics markets, which is the arrangement this one keeps refusing.
Market Impact: Cuts last-mile delivery cost by around 20% overall

Use Open Network Access as Seller Supply

The Open Network for Digital Commerce, backed by DPIIT, is generally read as a threat to platform take rates, and it is also the cheapest available route to seller supply in categories where acquisition costs are high. Platforms participating as buyer-side applications reach sellers they would otherwise spend to recruit, at roughly 30% of conventional acquisition cost. It requires accepting lower take rates on that supply. The alternative is watching the same sellers become reachable to competitors anyway. Take rate on that supply matters less than whether the seller transacts through the platform at all.
Market Impact: Costs roughly 30% of conventional seller acquisition spend

Who Controls the Margin Pool

Concentration sits near 34% across the top five on measured gross merchandise value, which understates how contested individual national markets are. India specifically remains unsettled: two large horizontal platforms compete with a well-funded quick commerce group, a social commerce entrant serving smaller cities, and conglomerate-backed retail platforms with physical store networks behind them. No participant has established the position that concentration figures elsewhere imply.
Competition runs on three dimensions rather than on price alone. Delivery speed and reliability is first, since it decides which categories a platform can credibly serve. Second is seller supply, particularly in long-tail categories where breadth drives discovery. Third is capital endurance, because quick commerce dark store networks consume cash for years before density makes them profitable, and several participants are funding that from balance sheets rather than operations.

Two pressures will move positions. Open network access lowers the cost of a seller reaching buyers without a platform, which pressures take rates in exactly the thin-margin categories platforms rely on for breadth. Meanwhile quick commerce operators have demonstrated purchase frequencies that horizontal marketplaces cannot match, and frequency is the variable that determines whether serving a buyer earns anything.
india-digital-commerce-market-company-positioning-matrix-1788425231563

Competitive Moat and Risk Dimensions

AMAZON

Moat: Fulfilment network depth

Amazon operates fulfilment and delivery capability in India built over a decade, reaching postal code coverage that new entrants cannot replicate quickly at any funding level. Its seller base spans long-tail categories where breadth drives discovery and retention together. Cloud and advertising revenue elsewhere in the group allow Indian operations to be run for position rather than for near-term profitability.
AMAZON

Risk: Quick commerce frequency gap

The company's Indian model rests on warehouse fulfilment at purchase frequencies well below what dark store operators now achieve, and frequency rather than basket size determines whether serving a buyer earns anything. Building competing store density requires a different operating discipline from warehouse logistics. Regulatory constraints on foreign-owned inventory models also limit some responses available to domestic competitors.
FLIPKART

Moat: Domestic market understanding

Flipkart holds deep operating knowledge of Indian buyer behaviour across smaller cities, category preferences and price sensitivity that has been built through direct trading rather than acquired. Its logistics arm operates at postal code coverage matching any competitor. Ownership by a large global retailer provides funding capacity without the foreign inventory restrictions that constrain some rivals.
FLIPKART

Risk: Category margin concentration

A substantial share of contribution comes from apparel and electronics, and apparel carries the return rates well above the 18% overall figure that erode exactly the margins funding lower-value categories. Quick commerce competitors are taking the frequency that drives buyer retention. Open network access also pressures take rates in the long-tail categories where the platform's breadth advantage is most valuable.

Players Tracked

Prominent Players

Amazon
Alibaba Group
Flipkart
Shopify
MercadoLibre

Other Key Players

JD.com
PDD Holdings
Coupang
Rakuten
Meesho
Nykaa
Zepto
Swiggy
Zomato
Shein
Zalando
Allegro
Jumia
Reliance Retail
Tata Digital

Recent Developments

FEBRUARY 2025

Quick commerce operators extend dark store networks beyond metropolitan cities

Indian quick commerce groups opened fulfilment points in second-tier cities, testing whether the density economics that work in metropolitan areas survive at lower residential concentration. Store radii were widened and order minimums raised to compensate for reduced drop density per delivery route. Early results have not matched metropolitan performance.
Signal: Whether the model travels beyond dense cities determines how much of the segment growth is genuinely available.
JUNE 2025

Open network transaction volumes concentrate in thin-margin seller categories

Open Network for Digital Commerce activity grew principally among sellers in grocery, food and small retail categories where platform take rates weigh heaviest against margin. Larger branded sellers continued transacting through established platforms rather than shifting materially. The pattern reflects where take rates hurt rather than where volume sits.
Signal: Take rate pressure arrives first where sellers have least margin, not where transaction volume is largest.
OCTOBER 2025

Platforms introduce seller-level return accountability in apparel categories

Several Indian platforms began pricing return costs back to sellers based on category and individual return history, targeting apparel where rates run well above the overall average. Sellers with accurate sizing information and product description quality saw fee reductions. Return costs had previously been absorbed centrally by platforms.
Signal: Returns are moving from a platform cost of doing business toward a priced seller performance variable.

What Serving an Order Costs

Cost structure is dominated by physical fulfilment rather than by technology. Logistics, comprising warehousing, line haul and last-mile delivery, runs around 14% of order value, with last-mile alone over half of that in less dense areas. Payment processing has fallen close to zero on UPI rails. Customer acquisition and marketing form the second large block, and returns handling sits underneath both as a cost frequently accounted for imprecisely.
Delivery labour cost has been the sharpest pressure. Competition for riders between quick commerce, food delivery and ride hailing raised effective earnings requirements through 2024 and 2025, just as operators expanded store networks that depend on rider availability. Amazon and MercadoLibre both referenced last-mile cost conditions in recent annual reporting. Operators absorbed most of it, since raising delivery fees on an order averaging USD 11 suppresses the frequency the model depends on.

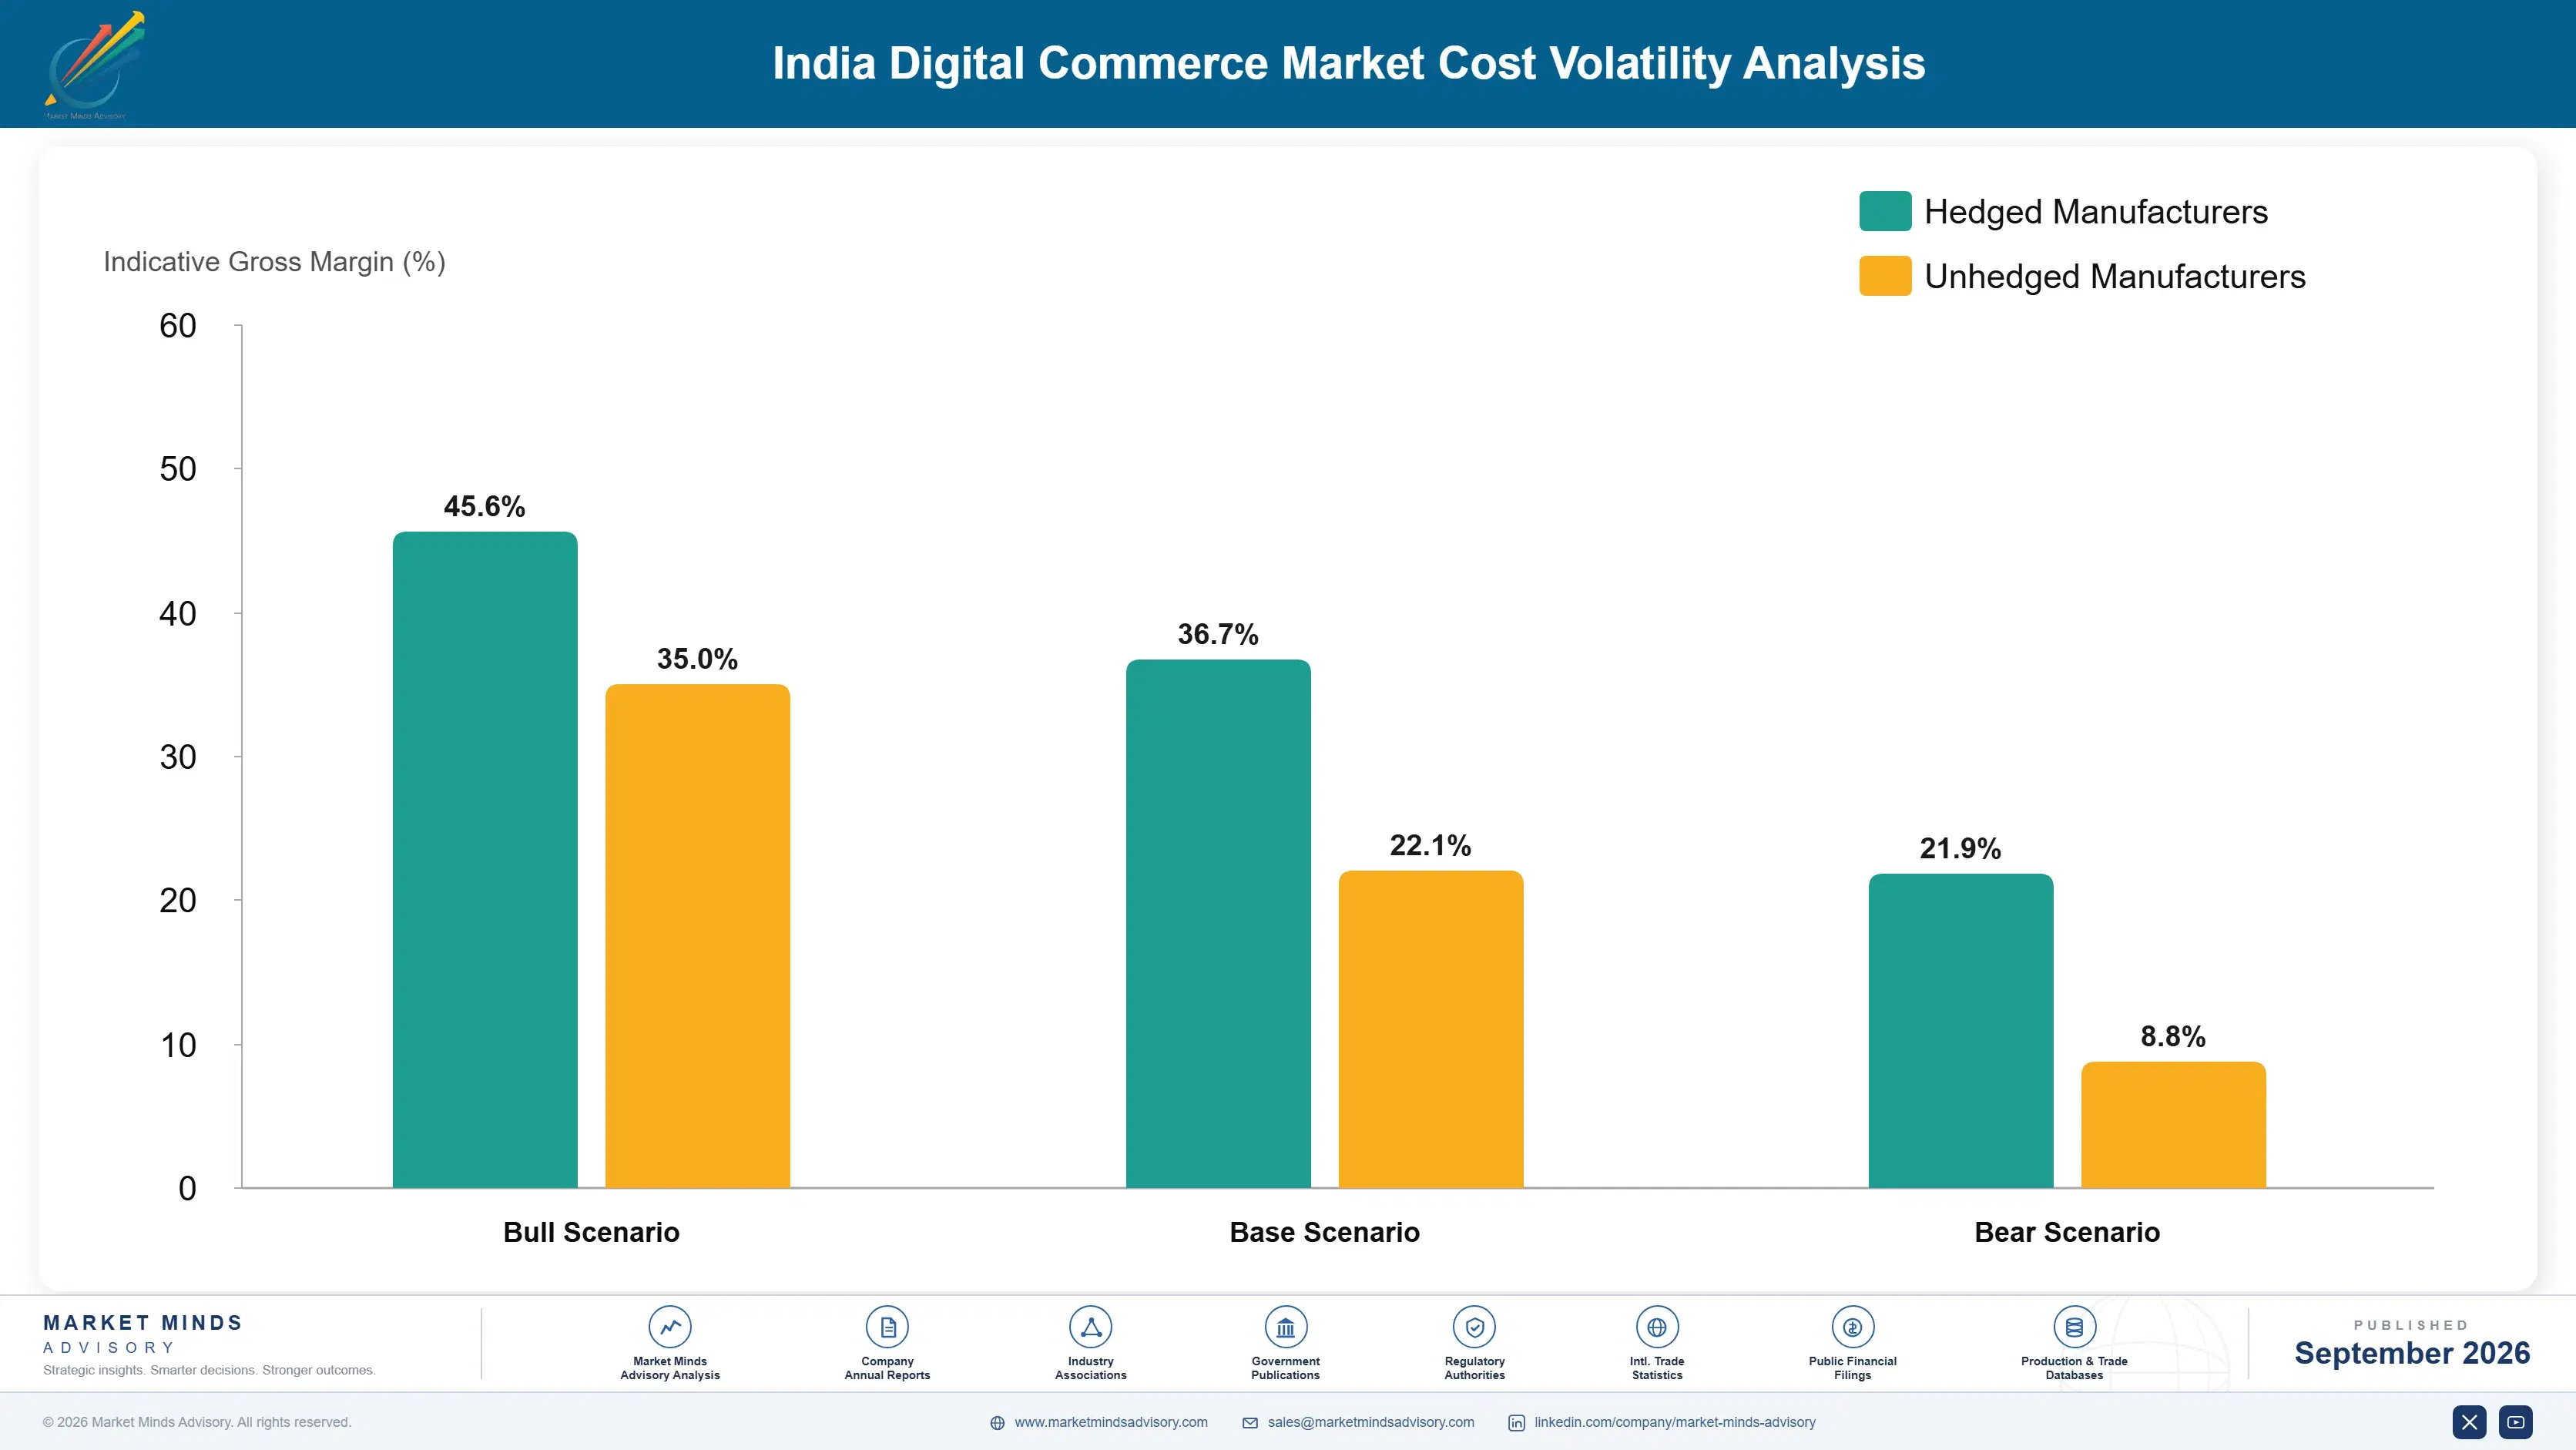
Exposure varies sharply by operating model. Quick commerce operators carry fixed dark store cost that only high frequency justifies, so any frequency decline hits them immediately and hard. Horizontal marketplaces carry warehouse and line haul cost that scales with volume more gracefully. Operators expanding into lower-density cities fare worst, since drop density falls while rider earnings expectations do not.
india-digital-commerce-market-cost-volatility-analysis-1788425231761

Raise drops per route before widening coverage

Cost per order is determined by deliveries completed per kilometre travelled, not by total network size, and expanding coverage into thin areas worsens the ratio directly. Densifying existing zones through frequency growth and shared delivery capacity improves the metric that governs unit economics. It is unglamorous compared with coverage announcements, and it is the only route to profitable last-mile operation.

Price returns to sellers rather than absorbing them centrally

Reverse logistics on an 18% return rate sits with the platform while sizing accuracy and description quality sit with the seller, which puts cost and control in different hands. Category and seller-level return pricing aligns the two and moves roughly 4 percentage points of cost. Sellers with accurate listings gain immediately, which is what makes the change defensible commercially.

Hold delivery fees and protect order frequency

Raising delivery charges on an order averaging USD 11 recovers cost per transaction while suppressing the frequency that spreads fixed store cost across enough orders to matter. The arithmetic usually favours holding fees and attacking cost through density instead. Operators that raised fees during the 2025 rider cost pressure saw frequency decline faster than the fee recovered.

Portfolio Architecture for Margin Defence

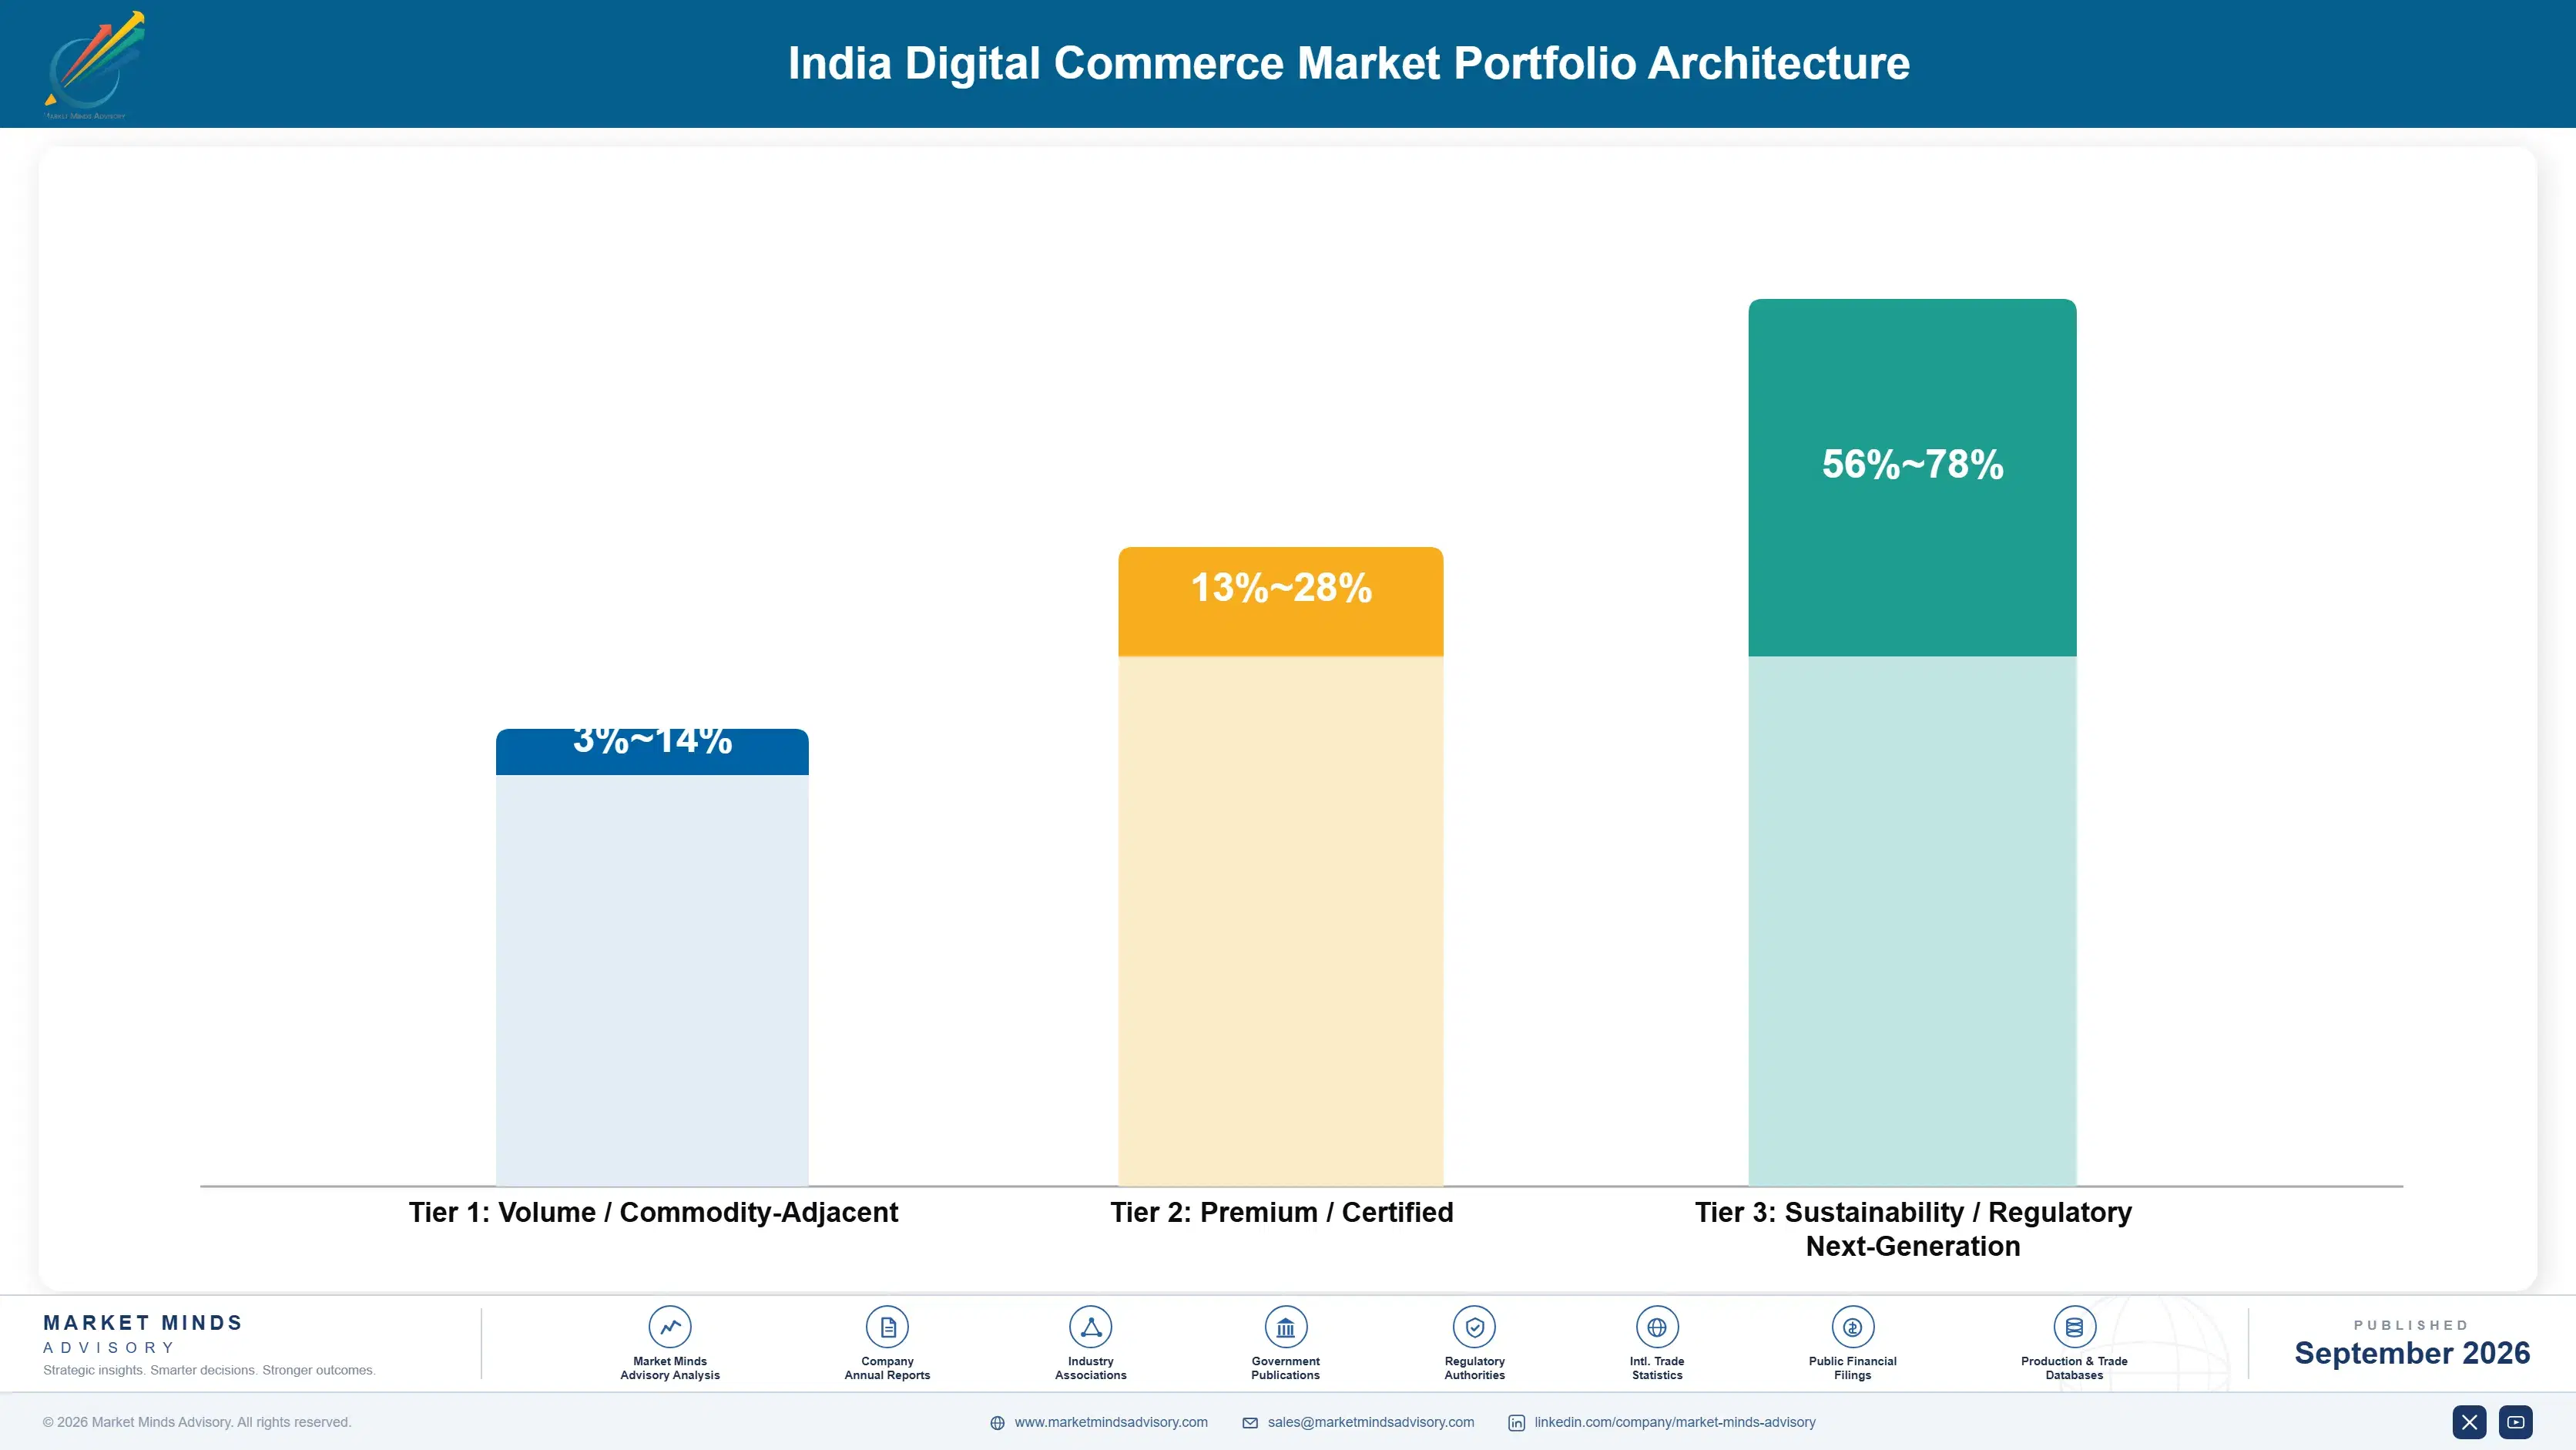
Margin architecture separates on purchase frequency rather than on category value. Horizontal marketplace commerce earns a take rate near 6.4% against logistics at 14% of order value, which works only where basket sizes are large enough to absorb it. Quick commerce earns thinner rates on far higher frequency, which spreads fixed store cost. Social and creator-led selling carries the lowest fulfilment burden and the highest return rates simultaneously.
The tension runs between volume categories and margin categories. Grocery and consumables deliver the frequency that makes networks viable and almost no gross margin per order. Apparel and electronics deliver the margin that funds everything else and carry return rates that claw much of it back, particularly in apparel. Operators need both and cannot optimise for either alone, which is why category mix management matters more here than in markets with higher basket values.

High-value revenue concentrates in advertising and seller services rather than in merchandise margin at all. Platforms with sufficient buyer traffic monetise seller visibility at margins that merchandise transactions never approach, and that revenue carries no logistics cost whatsoever. It requires traffic scale most participants lack. Merchandise commerce funds the traffic, and the traffic funds the business.

Volume / Commodity-Adjacent

Grocery, consumables and quick commerce merchandise sold at high frequency and minimal gross margin per order. The wide range separates operators with dark store density from those fulfilling from warehouses. Frequency rather than margin justifies the position at all.
Gross Margin: 3-14%

Premium / Certified

Apparel, electronics, beauty and branded merchandise carrying genuine gross margin. Returns claw back a substantial portion, particularly in apparel where rates run well above the 18% average. Category mix within this tier determines most of the variance.
Gross Margin: 13-28%

Sustainability / Regulatory / Next-Generation

Seller advertising, fulfilment services, financing and data products sold to sellers rather than buyers. The widest range in the portfolio, reflecting traffic scale differences between participants. No logistics cost attaches, which is what produces the margin.
Gross Margin: 56-78%
india-digital-commerce-market-portfolio-architecture-1788425232264

High-value Sub-segments and Strategic Watch-out

Seller Advertising and Services

High value with strong growth, monetising seller visibility at margins merchandise never approaches and carrying no fulfilment cost at all. The range reflects traffic scale, which smaller platforms cannot manufacture at all. It requires buyer volume that merchandise commerce funds and rarely earns on its own.
Gross Margin: 58-78%

Quick Commerce Merchandise

High growth at 14.4% with the thinnest margins here, viable purely on frequency spreading fixed dark store cost. The range separates dense metropolitan operations from second-tier city expansion. Whether the economics survive at lower residential density is the segment's open commercial question. Nobody has answered it yet.
Gross Margin: 4-15%

Horizontal Marketplace Merchandise

The volume core, earning a 6.4% take rate against 14% logistics cost and working only where basket size absorbs it. The range reflects category mix between apparel, electronics and general merchandise. It funds the traffic that seller services then monetise at far better rates. That is the actual model.
Gross Margin: 12-26%

Lower-Density City Expansion

The strategic watch-out, where drop density falls, rider costs do not, and each cohort costs more to serve than the last. Volume growth here is genuine and margin contribution is close to absent. Several operators are reporting it as expansion progress rather than as a cost commitment.
Gross Margin: 0-6%

What Makes Buying Repeat

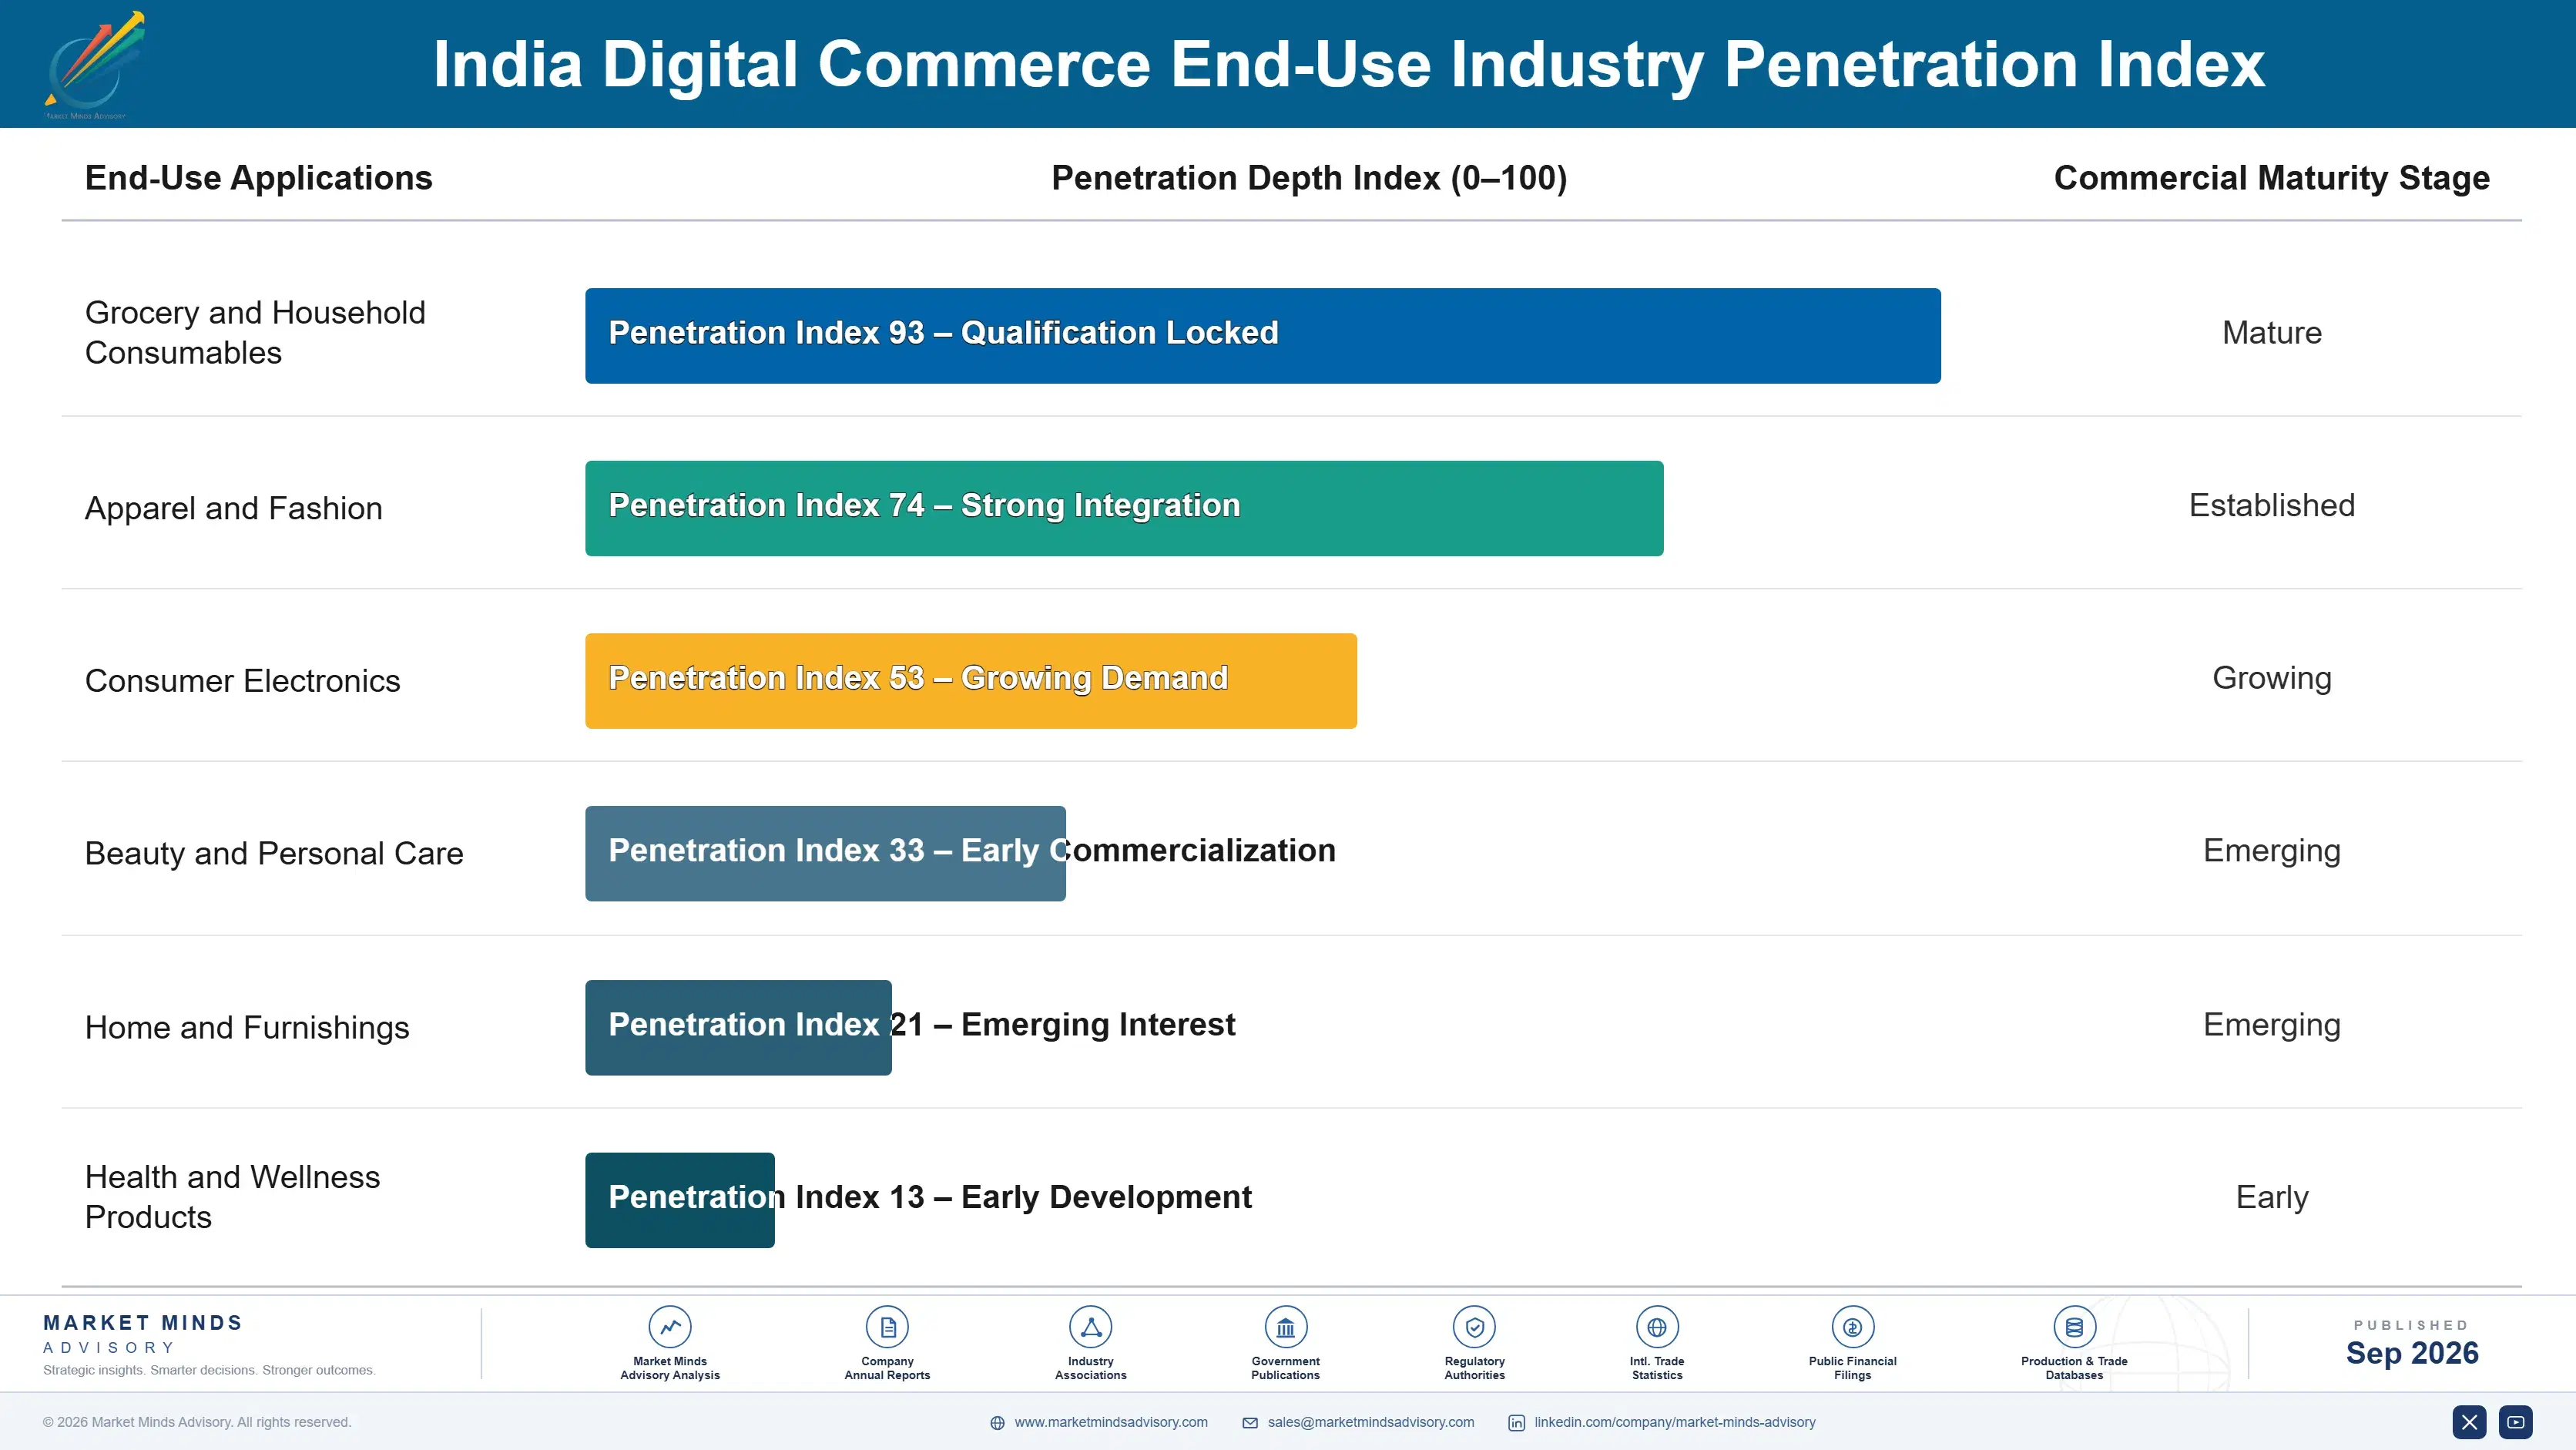
Recurrence divides sharply by category rather than by platform. Grocery and consumables repeat several times weekly through quick commerce, which is the only part of this market with genuine annuity behaviour. Apparel repeats seasonally and electronics repeats over years, so both depend on the platform being remembered rather than on habit. Seller advertising recurs continuously because sellers cannot stop competing for visibility once buyers are concentrated on a platform.
Adoption depth varies more than penetration figures suggest. Metropolitan buyers use several platforms interchangeably and switch on price and delivery speed without friction. Smaller city buyers concentrate on fewer platforms, partly through habit and partly because delivery reliability differs more there. Sellers integrate deeply once fulfilment services are adopted, since inventory sitting in a platform's warehouse is genuinely difficult to move. That is where retention actually sits.

The buyer has changed materially over five years. Early digital commerce in India served metropolitan buyers comfortable with cards and English interfaces. Current growth comes from vernacular-language buyers in smaller cities paying through UPI, shopping from video rather than search, and returning goods more often. Platforms built around the earlier profile are serving a customer base that no longer represents where volume is going.
india-digital-commerce-market-end-use-penetration-index-1788425232753

What Actually Earns Here

These are among the four positions where our research anticipates prominent divergence between winners and laggards over the coming forecast period. Each is grounded in the demand model, the regulatory perimeter, and the announced capacity pipeline.
01 / FREQUENCY OVER ACQUISITION

Build order frequency instead of counting new buyers

A buyer ordering four times weekly from a nearby dark store generates entirely different economics from one ordering twice monthly from a regional warehouse, even at identical basket size and category mix. Frequency spreads fixed fulfilment cost and raises retained value per buyer by roughly 60% among operators measuring it properly. Acquisition spending pursues cohorts that each cost more to serve than the last, so operators still reporting buyer counts as their headline metric are tracking the variable that matters least of all here.
02 / RETURN COST ALLOCATION

Price returns to the seller who controls them

Returns run near 18% overall and considerably higher in apparel, with reverse logistics falling on the platform while sizing accuracy and description quality sit entirely with the seller who listed the product. Category and seller-level return pricing moves roughly 4 percentage points of that cost to the party who can actually reduce it through better listings. Sellers with accurate listings benefit immediately, which makes the change commercially defensible rather than merely a fee increase dressed up as an incentive scheme.
03 / DELIVERY DENSITY SHARING

Stop treating last-mile delivery as a competitive asset

Cost per order is set by deliveries completed per kilometre travelled, and multiple operators running separate fleets over identical streets in the same city duplicates precisely the cost that makes expansion unviable in the first place. Shared or third-party networks cut last-mile cost by around 20% in the lower-density areas where the problem bites hardest against thin margins. Operators resist because delivery feels strategic, yet outside dense metropolitan cores it is a cost centre that nobody wins by owning alone.
04 / SELLER SERVICES MONETISATION

Earn from sellers, not from merchandise margin

Advertising and seller services carry gross margins between 58% and 78% with no logistics cost attached, while merchandise commerce earns a 6.4% take rate against logistics running at 14% of order value on every single transaction. Merchandise funds the traffic and seller services monetise it, which is the actual business model sitting underneath all that transaction volume, though few participants describe it that way. Platforms without sufficient buyer concentration cannot access this revenue and are left competing on merchandise economics that barely work at Indian basket sizes.

Engagement Snapshot From the Field

A live engagement with an industry participant carrying material or product regulatory and market exposure ahead of a defining policy shift, showing how our research translates into a defensible multi-year portfolio strategy.
MARKET MINDS ADVISORY · CLIENT ENGAGEMENT SUMMARY
India Digital Commerce Producer Strategic Portfolio Review and Transition Roadmap 2026·Investment Scenario on India Digital Commerce Exposure Evaluation 2025-26
CLIENT PROFILE
An Indian quick commerce operator running roughly 340 dark stores across eleven metropolitan areas (client-reported, unverified by MMA), with average order value near USD 9 and order frequency above three times weekly among active buyers. The board had approved expansion into second-tier cities on the assumption that metropolitan unit economics would broadly hold in those markets too.
STRATEGIC CHALLENGE
Expansion into 18 second-tier cities carried an estimated capital and operating commitment of USD 74 million over two years (client-reported, unverified by MMA). The business case assumed order frequency and drop density comparable to metropolitan performance. Nobody had tested whether residential density in those cities supported the two to three kilometre store radii the model requires.
MMA APPROACH
MMA modelled unit economics against residential density and drop density per route in each candidate city rather than against population or retail spending. We analysed delivery route data from existing stores, interviewed 15 operations managers, six riders and four third-party logistics providers. Cities were scored on density thresholds rather than on addressable market size.
KEY FINDINGS
  1. Only six of the 18 candidate cities had residential density supporting the store radii the model requires at metropolitan cost per order.
  2. Drop density per route in the remaining twelve cities fell roughly 45% below metropolitan levels, which raised last-mile cost per order above gross margin.
  3. Order frequency in the client's own smaller existing markets ran near half the metropolitan rate, a figure already in the data and never analysed.
  4. Rider earnings expectations in second-tier cities were within 15% of metropolitan levels despite significantly lower delivery volumes per rider shift in those markets.
CLIENT PROFILE
An Indian quick commerce operator running roughly 340 dark stores across eleven metropolitan areas (client-reported, unverified by MMA), with average order value near USD 9 and order frequency above three times weekly among active buyers. The board had approved expansion into second-tier cities on the assumption that metropolitan unit economics would broadly hold in those markets too.
STRATEGIC CHALLENGE
Expansion into 18 second-tier cities carried an estimated capital and operating commitment of USD 74 million over two years (client-reported, unverified by MMA). The business case assumed order frequency and drop density comparable to metropolitan performance. Nobody had tested whether residential density in those cities supported the two to three kilometre store radii the model requires.
MMA APPROACH
MMA modelled unit economics against residential density and drop density per route in each candidate city rather than against population or retail spending. We analysed delivery route data from existing stores, interviewed 15 operations managers, six riders and four third-party logistics providers. Cities were scored on density thresholds rather than on addressable market size.
KEY FINDINGS
  1. Only six of the 18 candidate cities had residential density supporting the store radii the model requires at metropolitan cost per order.
  2. Drop density per route in the remaining twelve cities fell roughly 45% below metropolitan levels, which raised last-mile cost per order above gross margin.
  3. Order frequency in the client's own smaller existing markets ran near half the metropolitan rate, a figure already in the data and never analysed.
  4. Rider earnings expectations in second-tier cities were within 15% of metropolitan levels despite significantly lower delivery volumes per rider shift in those markets.
RECOMMENDED STRATEGY
Phase 1: Enter only the six cities meeting the residential density threshold, and defer the remaining twelve until shared delivery capacity is available. Phase 2: Densify the existing metropolitan zones through frequency growth, which improves drops per route without adding any fixed store cost at all. Phase 3: Rebuild the expansion business case on drop density per route rather than on population or addressable retail spending figures alone.
OUTCOME
The client entered six cities rather than 18, cutting the commitment to roughly USD 24 million (client-reported, unverified by MMA). Cost per order in the six markets came within 12% of metropolitan levels against a projected 40% gap, and metropolitan frequency growth added contribution the deferred expansion would have consumed.

Frequently Asked Questions

Foundational context covering the market sizes, CAGR, scope, country, region and competition that inform every finding below. This section is provided to cover basics and most often pre-purchase conversations, answered from the MMA Primary Research Dataset.

What is the current size of the India Digital Commerce Market?

The market was worth USD 640.0 billion in 2025 and reaches USD 701.4 billion in 2026 on a global sizing frame. India, the analytical centre of this report, sits at roughly 8% retail penetration.

How large will the India Digital Commerce Market be by 2036?

MMA forecasts USD 1,754.2 billion by 2036, an expansion of 2.50 times over the forecast period. That represents USD 1,052.8 billion of incremental annual value against 2026.

What is the CAGR for the India Digital Commerce Market 2026 to 2036?

The base case is 9.6% compound annual growth, with a bull case at 10.8% and a bear case at 8.4%. Cost to serve rather than demand separates the scenarios.

Which segment is growing fastest?

Quick commerce and instant delivery grows at 14.4%, half again the market rate of 9.6%. Dark stores serving small radii raise order frequency enough to spread fixed fulfilment cost.

Who are the major companies in the India Digital Commerce Market?

Amazon, Alibaba Group, Flipkart, Shopify and MercadoLibre lead on measured gross merchandise value. Within India specifically the market remains contested rather than settled among several well-funded participants.

Which country is growing fastest?

India grows fastest at 14.0%, on retail penetration near 8% and delivery coverage extending across roughly 19,000 postal codes. Each new buyer cohort costs more to serve than the last.

Report Segmentation Architecture

The full report scope spans multiple orthogonal segmentation dimensions, with cross-tabulated demand data provided for each dimension pair. Coverage extends further to regional breakdowns, trend trajectories, and the competitive detail needed to support segment-level decision-making.

By Primary Market Dimension

  • Horizontal Marketplace Commerce
  • Quick Commerce and Instant Delivery
  • Social and Creator-Led Commerce
  • Direct-to-Consumer Brand Channels
  • Vertical Specialist Commerce
  • Cross-Border Digital Commerce

By End-Use Industry

  • Grocery and Household Consumables
  • Apparel and Fashion
  • Consumer Electronics
  • Beauty and Personal Care
  • Home and Furnishings
  • Health and Wellness Products

By Commercial Dimension

  • Metropolitan Buyer Cohorts
  • Second-Tier City Cohorts
  • Seller Advertising and Services
  • Platform Fulfilment Services
  • Open Network Participation
  • Brand Direct Channels

By Region

  • East Asia
  • South Asia and Pacific
  • North America
  • Western Europe
  • Latin America
  • Middle East and Africa
  • Eastern Europe

Scope, Methodology, and Coverage

Every figure in this report is reproducible from documented input assumptions. The scope below maps the historical period, the forecast horizon, the segmentation dimensions, and the countries covered, alongside the underlying primary and qualitative methodology.
Historical Period
2020 to 2025
Forecast Period
2026 to 2036
Base Year
2025 (USD billions; MMA Primary Research Dataset, September 2026)
Market Definition
This market covers merchandise and services transacted through digital commerce channels, spanning horizontal marketplace commerce, quick commerce and instant delivery, social and creator-led commerce, direct-to-consumer brand channels, vertical specialist commerce, and cross-border digital commerce. Value is measured as gross merchandise value transacted through the channel, with India treated as the analytical centre within a global sizing frame required by the seven-region reporting structure. Digital financial services, travel and ticketing, prepared food service delivery, business-to-business procurement platforms, subscription content, and offline retail transactions using digital payment acceptance are excluded from scope.
Quantitative Units
USD billions, gross merchandise value transacted through digital commerce channels
Segmentation Dimensions
Commerce model, end-use category, commercial dimension, region
Regions Covered
East Asia, South Asia and Pacific, North America, Western Europe, Latin America, Middle East and Africa, Eastern Europe
Countries Covered
India, Bangladesh, Sri Lanka, Indonesia, Vietnam, Philippines, Thailand, Malaysia, Singapore, Australia, China, Japan, South Korea, Taiwan, United States, Canada, Mexico, Brazil, Argentina, Chile, United Kingdom, Germany, France, Netherlands, Spain, Poland, Czechia, United Arab Emirates, Saudi Arabia, Nigeria, South Africa
Key Companies Profiled
Amazon, Alibaba Group, Flipkart, Shopify, MercadoLibre, JD.com, PDD Holdings, Coupang, Rakuten, Meesho, Nykaa, Zepto, Swiggy, Zomato, Shein, Zalando, Allegro, Jumia, Reliance Retail, Tata Digital
Quantitative Methodology
Primary survey, n=3,800 respondents, Q4 2025, six countries; demand-side model with trade association cross-validation
Qualitative Methodology
47 expert interviews, Q4 2025; applied to validate demand model assumptions, identify emerging dynamics, and assess competitive positioning
Report Format
PDF and XLSX data workbook (Word format preview document)
Publisher
Market Minds Advisory
Report Code
MMA-2026-TEC-951
Published
September 2026
Contact
sales@marketmindsadvisory.com | www.marketmindsadvisory.com

Purchase the full India Digital Commerce Market Report (2026 to 2036).

The full MMA report treats Indian digital commerce as a cost problem rather than a penetration opportunity, and sets out the arithmetic that governs whether serving an additional buyer earns anything. It sizes the market to 2036 across six commerce models, seven regions and 31 countries, with segment growth rates and regional demand mechanisms detailed throughout. Competitive analysis covers 20 participants assessed on measured gross merchandise value, with moat and risk assessment for the two leaders. The report quantifies fulfilment cost structure, return economics and margin architecture across three portfolio tiers. It closes with four strategic verdicts and an anonymised quick commerce expansion engagement.
Six commerce models sized through 2036
Seven regions with demand mechanism analysis
Twenty participants on consistent value basis
Cost to serve and return rate benchmarks
Margin architecture across three portfolio tiers
Anonymised quick commerce expansion economics engagement

Built For The People Who Decide

From boardroom strategy to bench-side execution, this report is read cover-to-cover by leaders shaping the next decade of their industry, turning demand scenarios, market dynamics and valuation benchmarks into decisions.
CXOs/ Presidents/ VPs/ Managers
M&A and Corporate Development
Strategy Teams and R&D Heads
Procurement and Product Directors
Regulatory and Compliance Leaders
Investor Relations and Equity Analysts