Market Minds Advisory
India Data Storage Market

India Data Storage Market: India Data Storage Market: Enterprise Systems, Hyperscale Capacity and Regulated Onshore Deployment, 2026 to 2036

Two markets are stacked on top of each other here and reported as one. Hyperscale operators buying commodity drives and enterprises buying vendor arrays share a growth rate and almost nothing else.

Lead Analyst

Published

September 2026

Make Smarter Decisions with Customized Research Insights

Request a free sample report and evaluate market opportunities, growth trends, and competitive dynamics relevant to your business needs.

2025 MARKET VALUE$3.8BMarket Size 2025
2036 FORECAST VALUE$18.1BBase Case , 2026 to 2036
CAGR 2026 TO 203615.2 %Bull 16.5% / Bear 13.9%
INCREMENTAL OPPORTUNITY$13.7BNet 10- year value creation
EXPANSION MULTIPLE4.11x2036 value over 2026 base
Strategic Levers
M&A Pipeline
Regional Outlook
Country Rankings
Competitive Intelligence
Segmental Deep-dive
Call-Us : 91 93563 13602

Executive Snapshot and Market Trajectory.

Large platform operators hold 58% of installed capacity in India and buy almost nothing that enterprises buy. They purchase drives and build their own software layer. Blending both into one growth figure produces a number that describes neither market accurately, and vendors planning against it misread both.
Software-defined and scale-out storage grows at 22.8%, half again the market rate of 15.2%, because that is what capacity at hyperscale actually looks like once you stop counting arrays. Cloud storage services delivered from domestic regions follow closely behind. East Asia supplies 33% of what reaches Indian installations, dominated by memory and media rather than by finished systems. Finished systems are a small part of what actually arrives here.
Regulation is the second demand source and it is genuinely independent of workload. Around 23% of capacity now sits onshore because financial sector directives and data protection rules require it, not because anybody chose the location. Five vendors hold 51% of contracted value in the enterprise segment, a figure that says little about the larger volume moving through platform operators. That regulated demand is the least price-sensitive revenue anybody sells into this market.
Market Definition
This market covers data storage systems, media, and services deployed in India, including all-flash enterprise arrays, hybrid and disk-based arrays, software-defined and scale-out storage, cloud storage services delivered from domestic regions, backup, archive and data protection systems, and tape and long-term retention media. It excludes server compute hardware, networking equipment, database software licensing, endpoint device storage, and consumer cloud subscription services.
Base Year Value
$3.8B in 2025 (MMA Primary Research Dataset, September 2026)
Forecast Period
2026 to 2036, eleven discrete annual values
CAGR
15.2% base case. Bull 16.5%. Bear 13.9%.
Fastest Growth Segment
Software-Defined And Scale-Out Storage: 22.8% CAGR
Fastest Growth Country
Tamil Nadu: 19.8% CAGR
Fastest Growth Region
South Asia and Pacific: 17.3% CAGR
Largest Region
East Asia: 33% of 2025 global value
Market Leaders
Dell Technologies, NetApp, Hewlett Packard Enterprise, Hitachi Vantara, and Pure Storage lead the field. Source: MMA Primary Research Dataset, July 2026.
Primary Survey
n=3,800 procurement and R&D decision-makers, Q4 2025, six countries
Methodology
Demand-side build-up, cross-validated against public data, 47 expert interviews

India Data Storage Market Forecast Scenarios

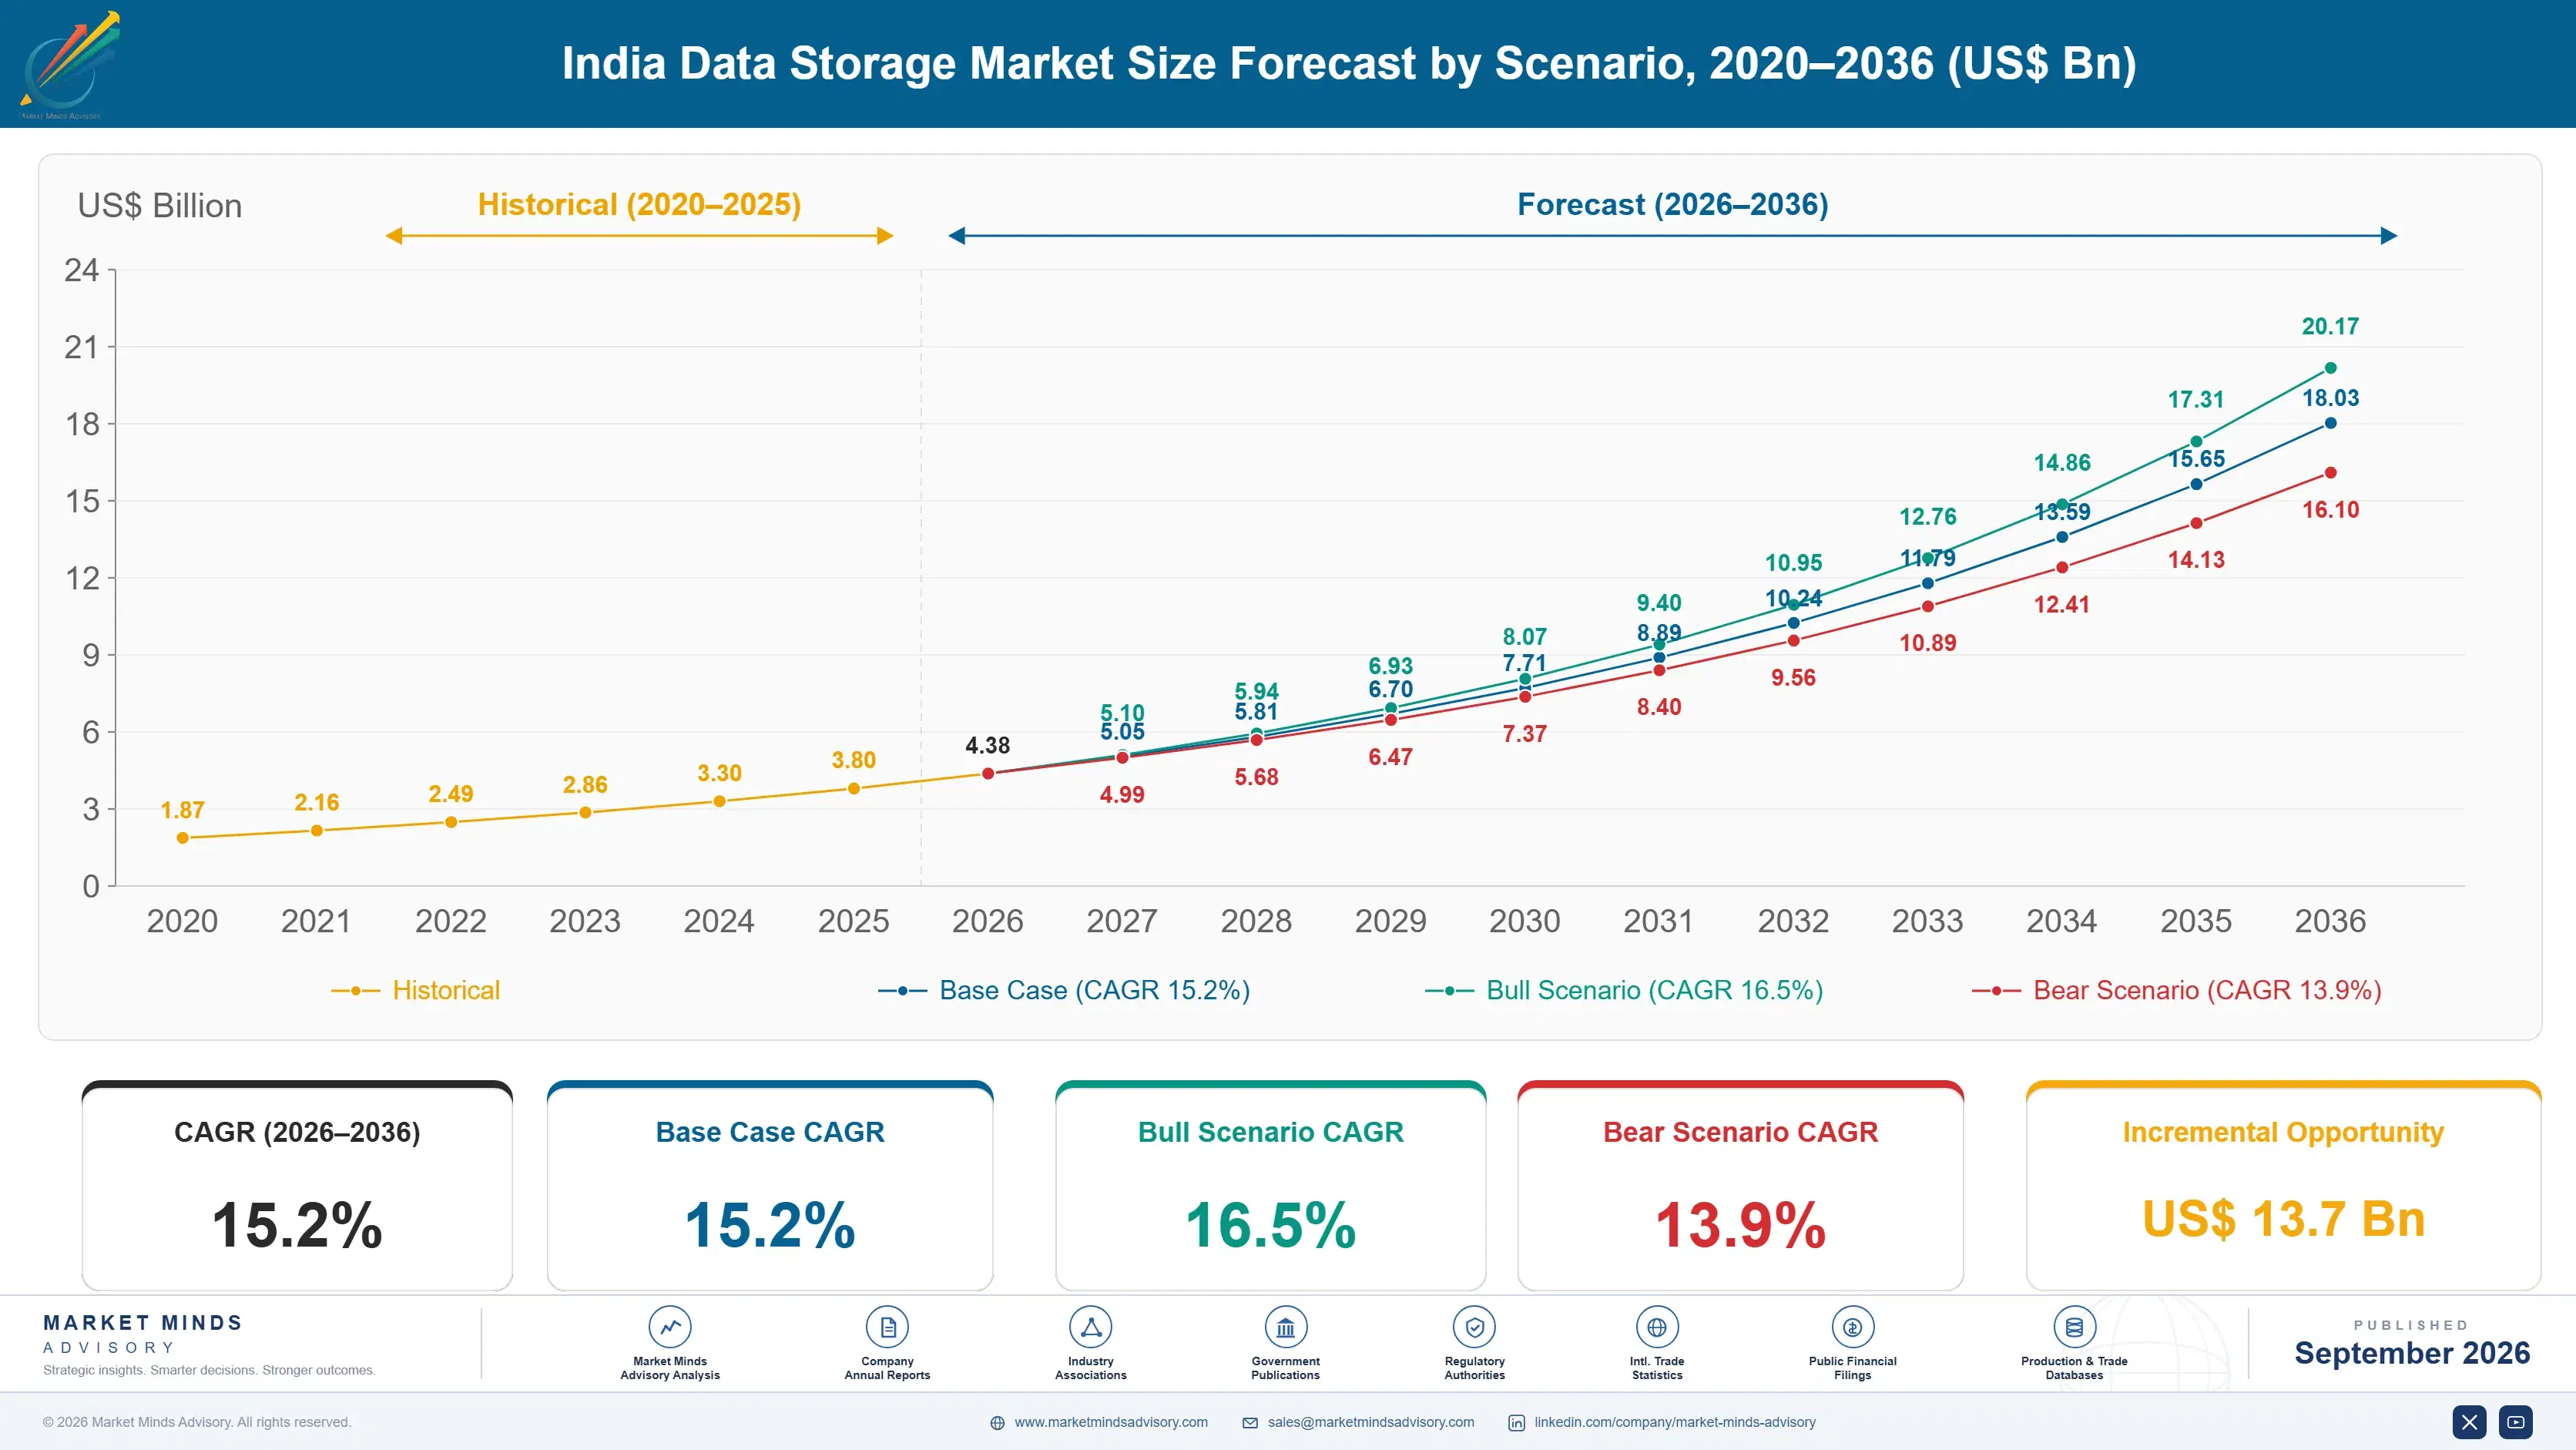
india-data-storage-market-size-forecast-scenario-1790006595324
Between 2020 and 2025 the shape of demand changed more than its size. Enterprise array purchasing grew modestly while hyperscale and colocation capacity expanded at multiples of that rate, and the two were reported together throughout. Historical growth of 13.8% blends a slow enterprise market with a very fast platform one, a distinction few drew.
The base case at 15.2% rests on three mechanisms. Model training and inference capacity built in India consumes storage at ratios enterprise workloads never approached, and that build-out is still early. Data residency directives in financial services, payments, and under the data protection framework force capacity onshore regardless of where the workload would naturally sit. And enterprise flash refresh continues as disk-based arrays reach end of support across banking and telecommunications estates.
The bull case at 16.5% turns on India becoming a genuine training location for global models rather than an inference and serving location, which would multiply capacity requirements per facility several times over. The bear case at 13.9% is power and land constraint: data centre capacity in the established clusters is limited by grid connection and site availability rather than by demand, and slipped connections defer storage purchases directly.

Two Markets Reported As One

The single most useful thing an analyst can do with this market is separate it. Platform operators hold 58% of installed petabytes, buy drives rather than arrays, write their own storage software, and negotiate on price per terabyte at volumes no Indian enterprise approaches. Enterprises buy supported systems with service contracts. These are different businesses sharing a category name. Treating them as one produces forecasts nobody can act on.
TOP FIVE CONCENTRATION51%Share of enterprise contracted value held by leading vendors
HYPERSCALE CAPACITY SHARE58%Portion of installed petabytes held by large platform operators
AVERAGE PRICE PER TERABYTEUSD 38Effective delivered cost across all enterprise array purchases
LOCALISATION DRIVEN CAPACITY23%Storage deployed onshore to meet regulatory residency requirements
FLASH SHARE OF SHIPMENTS67%Proportion of new enterprise capacity delivered on solid state
UTILISATION OF PROVISIONED CAPACITY44%Average share of allocated enterprise storage actually holding data
Enterprise buying has its own uncomfortable statistic. Provisioned capacity runs at 44% utilisation on average, which means nearly half of what Indian enterprises have paid for holds nothing. That is not unusual internationally, and it matters more here because capital discipline is tighter and because vendors have been selling capacity growth as though it reflected data growth. Capacity growth and data growth are not the same thing.
Regulation supplies demand that neither trend explains. Financial sector directives and the data protection framework require certain data to remain in India, and roughly 23% of installed capacity exists for that reason rather than because the workload belongs here. That demand is insensitive to price and to technology preference, which makes it the most reliable revenue in the market.
"Every vendor quotes the blended growth rate and then wonders why their enterprise pipeline does not match it. The hyperscale number is real, and almost none of it is addressable by a company selling arrays with support contracts. Those are two businesses that happen to share a word."
Practice Director, Enterprise Infrastructure and Data Centres · MMA Technology Practice · September 2026

Market Trends

Model Serving Capacity Changes Storage Ratios Entirely

Inference and serving infrastructure built in India carries storage per compute unit at ratios enterprise workloads never produced, since model weights, embeddings, and retrieval corpora all live on fast media that must be read constantly. That pulls demand toward scale-out architecture rather than toward arrays, and toward capacity purchased by the rack rather than by the system. Software-defined and scale-out storage grows at 22.8% on this. Around 58% of installed petabytes now sits with platform operators, and the proportion continues to rise with each facility that opens. Arrays address almost none of this.
Market Impact: Drives 23% of capacity
Domestic Cloud Regions Absorb Regulated Enterprise Workloads

Every major platform now operates multiple Indian regions, and enterprises subject to residency requirements can use them without building anything. That converts what would have been on-premise array purchases into consumption revenue recorded quite differently, and it is why cloud storage services from domestic regions grow at 20.6%. Banks and insurers that resisted public cloud for a decade have moved substantial secondary and archive workloads there, keeping only primary transactional data on owned infrastructure that regulators inspect directly. Revenue moves from capital to consumption, which changes vendor economics considerably and makes year-on-year shipment comparison misleading.
Market Impact: Flash takes 67% of shipments

Market Opportunities and Growth Drivers

Residency Directives Force Capacity Onshore Regardless Of Workload

Reserve Bank directives on payment system data, sectoral rules in insurance and securities, and the data protection framework together require defined categories of data to remain within India. Roughly 23% of installed capacity exists because of that rather than because the workload belongs here. This demand is insensitive to price and largely insensitive to technology preference, since the requirement is location rather than performance. It is the most predictable revenue in the market and the least discussed, because it grows with regulation rather than with any commercial cycle. Regulation rather than any commercial cycle sets its pace.
Market Impact: Utilisation sits at 44%

Disk Array End Of Support Forces Enterprise Flash Refresh

Large hybrid and disk-based arrays installed across banking, telecommunications, and government estates during the previous decade are reaching end of vendor support, and extending it costs more each year while the risk of an unrepairable failure grows. Flash now takes 67% of new enterprise capacity. The refresh is not driven by performance need in most cases, since the workloads ran adequately before, but by the impossibility of maintaining equipment nobody will supply parts for beyond a defined date. Support expiry dates therefore set the refresh timetable across whole estates, which makes the demand unusually easy to forecast years ahead.
Market Impact: Constrains 3 major clusters

Market Restraints and Challenges

Provisioned Enterprise Capacity Sits Under Half Utilised

Average utilisation of allocated enterprise storage runs at 44%, and the root cause is allocation practice rather than technology: capacity is provisioned per application at peak projections and never reclaimed when those projections fail. Commercially this means Indian enterprises have already bought much of the capacity they will need for years, which suppresses refresh volume and makes every renewal conversation harder. Vendors respond with capacity reporting that exposes the waste, consumption pricing that decouples payment from provisioning, and reclamation services sold as a precursor to any expansion. Finance functions have started asking about it.
Market Impact: Holds 58% of installed petabytes

Data Centre Growth Is Limited By Power And Land

Capacity in the established Mumbai, Chennai, and Hyderabad clusters is constrained by grid connection availability and by suitable land rather than by any shortage of demand, and connection timelines routinely slip beyond original schedules. The root cause is infrastructure planning rather than anything about storage. Commercially this defers purchases directly, since equipment is ordered against a facility handover date. Participants respond by developing sites in secondary locations with better grid access, by staging deployments to match phased connections, and by holding buffer inventory locally. Secondary locations with better grid access are being developed accordingly.
Market Impact: Grows at 20.6% annually
3 additional market trends, 4 additional growth drivers, and 2 additional restraints and challenges are covered in the full report. Contact sales@marketmindsadvisory.com to access the complete intelligence.

Segment CAGR and Growth Architecture

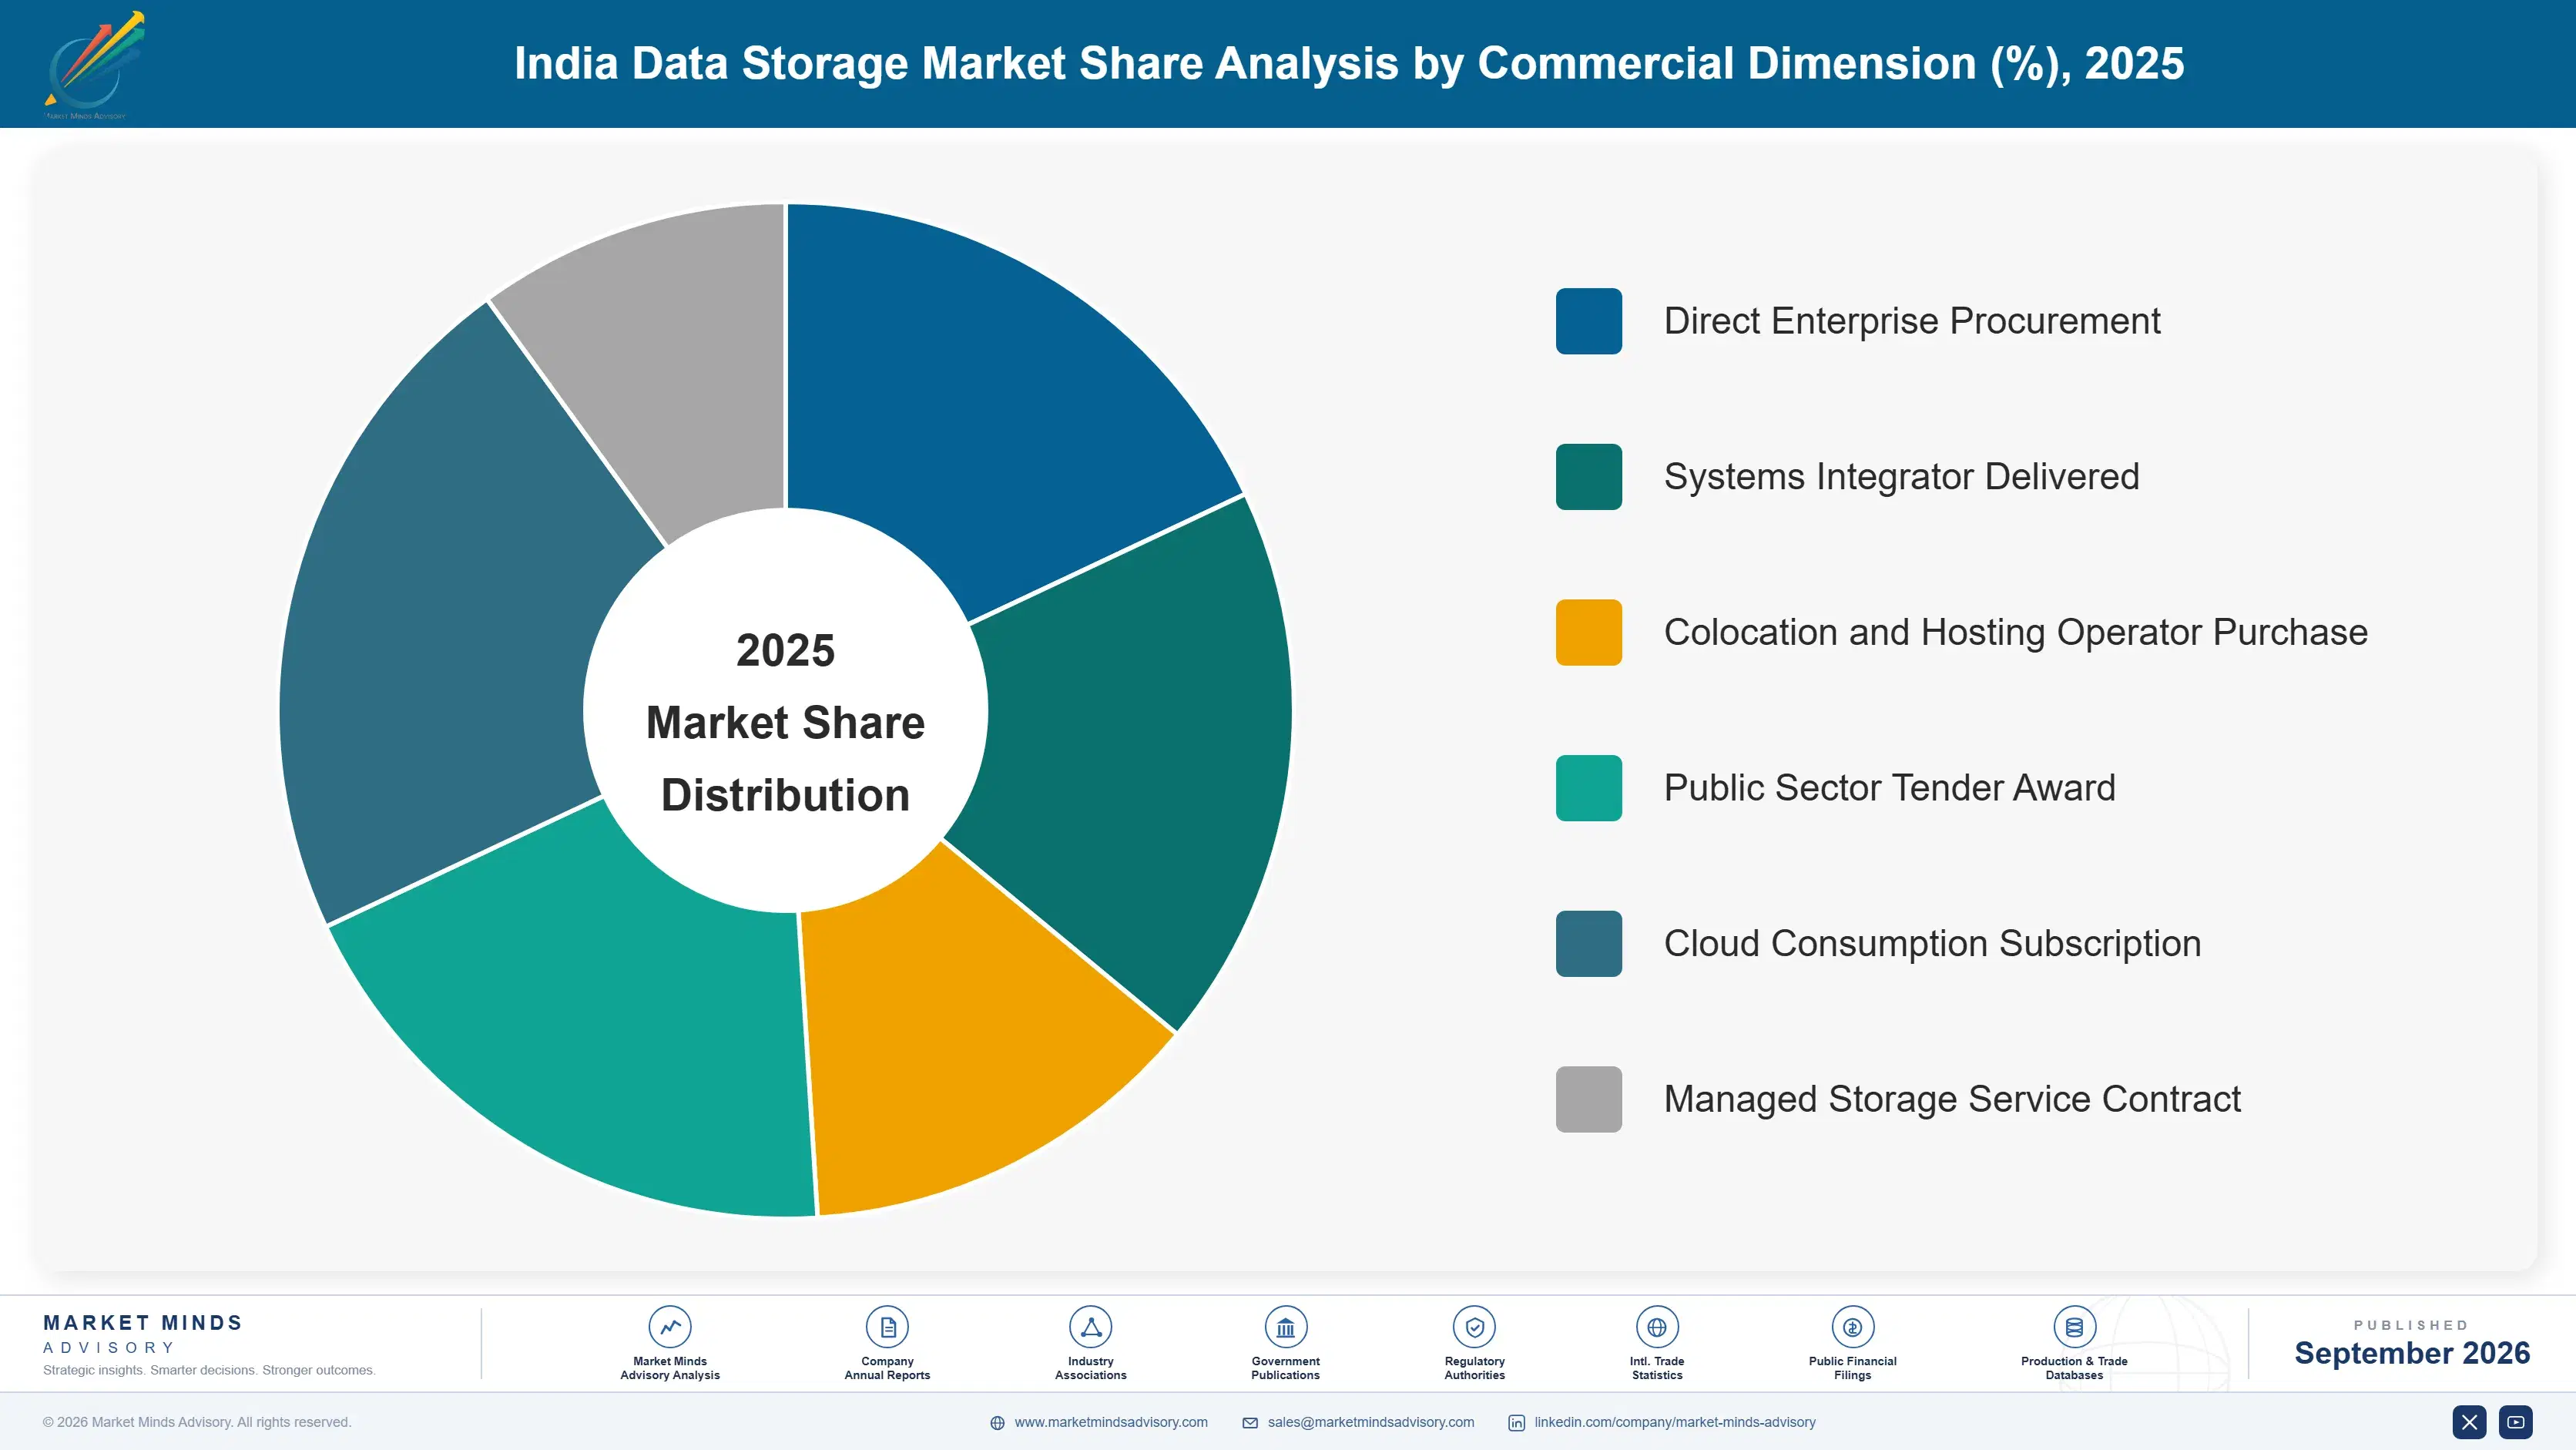
Segmentation follows product and delivery category. Six segments cover the market: all-flash enterprise arrays, hybrid and disk-based arrays, software-defined and scale-out storage, cloud storage services from domestic regions, backup, archive and data protection systems, and tape and long-term retention media. Arrays dominate enterprise value while capacity sits elsewhere. The two are frequently confused in reporting.
india-data-storage-market-market-share-analysis-1790006595882

Software-Defined And Scale-Out Storage

Scale-out storage grows at 22.8%, half again the market rate of 15.2%, and it is what capacity at platform scale actually looks like once arrays are set aside. Operators buy drives and enclosures, write or adopt their own software layer, and negotiate on price per terabyte at volumes no Indian enterprise approaches. Model serving infrastructure has accelerated this, since weights, embeddings, and retrieval corpora demand fast media read constantly rather than transactional array behaviour. Vendors selling supported systems address almost none of this volume, which is why enterprise pipelines never match the headline growth figure quoted for the market. Enterprise pipelines never match it. The headline growth figure describes buyers most vendors cannot serve.
CAGR 22.8%

Cloud Storage Services From Domestic Regions

Domestic region cloud storage grows at 20.6% and is taking demand that would previously have become on-premise array purchases. Residency requirements can now be satisfied without building anything, which removed the main obstacle that kept regulated Indian enterprises off public cloud for a decade. Banks and insurers have moved secondary, analytics, and archive workloads across while keeping primary transactional data on owned infrastructure that supervisors inspect directly. The revenue is recorded as consumption rather than capital, which changes vendor economics considerably and makes year-on-year comparisons against array shipment figures genuinely misleading. Supervisors inspect the primary estate directly, which is why it stays on owned infrastructure while everything else moves. Comparisons mislead badly.
CAGR 20.6%
Full segment breakdown across 6 segments available in the complete report.

Regional Architecture and Country Demand Map

Scope is limited to India, so this table records where the storage systems, media, and components deployed on Indian sites originate rather than where they are used. Several shares fall outside the standard bands for that reason, and the table is flagged for operator ruling.

East Asia

At 33% this origin sits above the standard band, and the justification is memory rather than systems. Korean and Japanese manufacturers supply the solid state media inside almost every array and every scale-out node reaching India, and Taiwanese contract manufacture handles a large share of enclosure and controller assembly. Growth of 16.2% runs above the market rate because flash takes 67% of new enterprise capacity and platform operators buy drives directly at volume. Media pricing here therefore sets Indian delivered cost more directly than any decision made by a system vendor elsewhere. Media pricing here sets Indian delivered cost more directly than any vendor decision does. Platform operators buy drives directly.
Share: 33% | CAGR: 16.2% (2026 to 2036)

North America

System design, storage software, and cloud platform services originate here, which accounts for most of this 24% share even though very little physical manufacture does. The major enterprise array vendors and every large cloud platform operating Indian regions are headquartered in this origin. Growth of 14.4% tracks the market rate closely, moderating as consumption revenue from domestic cloud regions substitutes for array shipments. Indian buyers have raised sovereignty questions about this concentration during procurement more frequently since residency rules tightened, without it changing supplier selection materially so far. Sovereignty questions arise during procurement without changing outcomes so far. Consumption revenue from domestic cloud regions increasingly substitutes for array shipments recorded here.
Share: 24% | CAGR: 14.4% (2026 to 2036)
Regional intelligence for 5 additional markets available in the complete report: South Asia and Pacific, Western Europe, Eastern Europe, Latin America, Middle East and Africa. Contact sales@marketmindsadvisory.com.
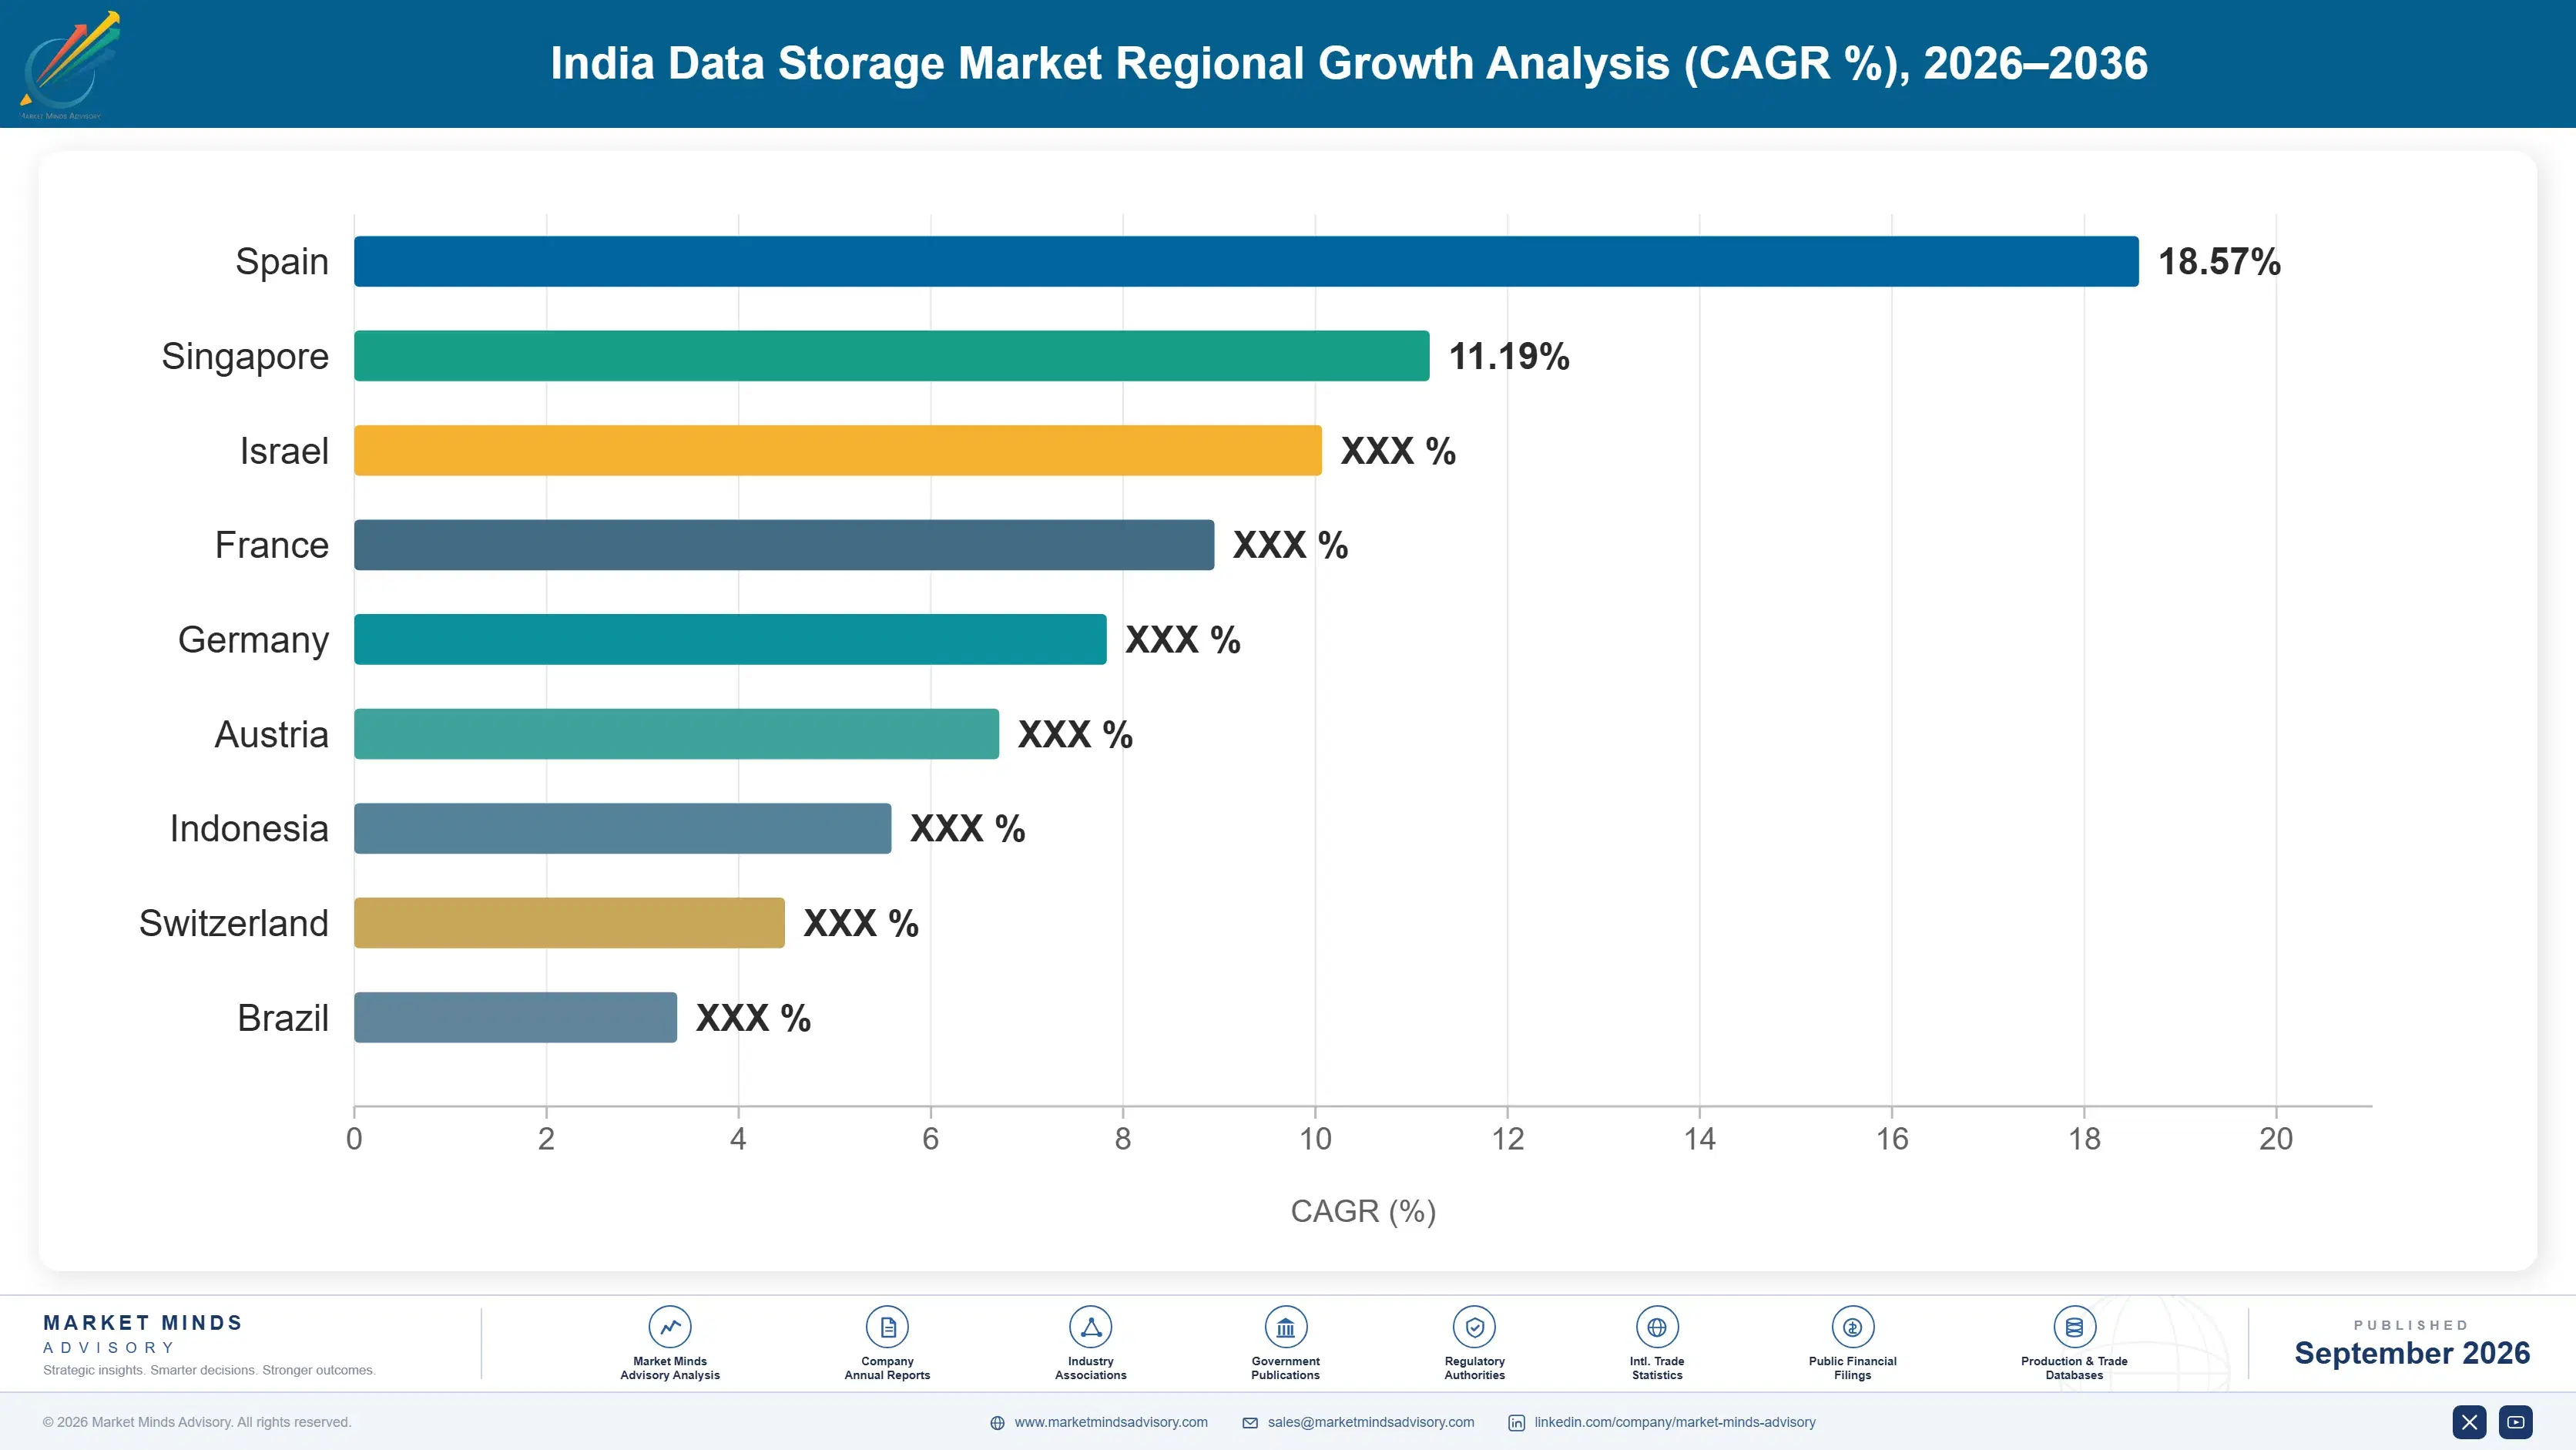
india-data-storage-market-country-cagr-analysis-1790006596409

How Vendors Grow In India

Four commercial moves matter in a market where the headline growth rate belongs mostly to buyers who do not purchase what enterprise vendors sell. Each requires deciding honestly which of the two markets a business is actually in, and then building for that one rather than for the blended figure. The blended figure serves nobody.

Sell Capacity Reclamation Before Selling Expansion

Enterprise provisioned capacity runs at 44% utilisation, so a customer asking for expansion frequently needs reclamation instead, and saying so builds credibility that survives the lost order. Vendors leading with utilisation assessment convert into larger multi-year agreements at roughly 2.4 times the rate of those quoting capacity immediately. The reclaimed space delays the purchase by a year or two and secures the relationship through the refresh cycle that follows, which is worth considerably more than the deal that was declined. Credibility survives the declined order. The refresh cycle that follows is worth far more.
Market Impact: Converts 2.4 times more multi-year customer agreements overall

Build Around Residency Requirements Not Performance Claims

Roughly 23% of Indian capacity exists because regulation requires the location, and that buyer is insensitive to performance benchmarks and largely to price. What they need is documented evidence of data location, access control, and inspection readiness that a supervisor will accept. Vendors packaging that evidence with the system win regulated accounts at 3.2 times the rate of those competing on specification. The work is documentation rather than engineering, and remarkably few vendors have done it properly for Indian sectoral rules. Documentation is the product here. Few vendors have prepared it.
Market Impact: Wins 3.2 times more regulated enterprise accounts overall

Choose Between Platform Volume And Enterprise Margin

Platform operators hold 58% of installed petabytes and buy drives at prices that will not support a supported-system business, while enterprise buyers pay for service and integration at volumes an order of magnitude smaller. Vendors attempting both without separating the operations report gross margin 9 to 14 points below those running them as distinct businesses. The decision is uncomfortable because the platform volume is visible and the margin is not, and pursuing it with an enterprise cost structure is how vendors lose money at scale. Visible volume is the wrong answer.
Market Impact: Protects 9 to 14 points of gross margin

Stage Deployments Against Grid Connection Dates

Data centre capacity in Mumbai, Chennai, and Hyderabad is constrained by grid connection rather than demand, and connection dates slip routinely. Vendors quoting delivery against facility handover rather than against order date, and holding staged inventory locally, avoid the cancellations and renegotiations that slipped connections produce. Those managing this well report order-to-revenue conversion roughly 28% higher than competitors booking against optimistic customer schedules. It requires understanding the customer's power position better than the customer's own procurement team frequently does. Cancellations and renegotiations disappear when delivery follows the actual handover milestone rather than an optimistic order date.
Market Impact: Improves order to revenue conversion by about 28%

Who Controls the Margin Pool

Concentration in the enterprise segment is moderate. Five vendors hold 51% of contracted value, measured consistently on that basis across all participants, and the figure deliberately excludes platform operator self-supply, which would make it meaningless. The gap between the leader and the fifth is narrow, and Indian system integrators and domestic manufacturers have taken visible share as production incentives changed local assembly economics. Production incentives changed local assembly economics materially.
Competition currently turns on three things: documented evidence that satisfies Indian residency and inspection requirements, willingness to address utilisation honestly rather than quote capacity, and delivery discipline against facility dates that routinely slip. Performance specification differentiates less than vendors assume, because most enterprise workloads here were adequately served by the equipment being replaced. The equipment being replaced served those workloads adequately for years.

Pressure comes from two directions. Domestic manufacturers and integrators are winning government and public sector work where local content weighs heavily. Meanwhile cloud platforms with Indian regions are absorbing workloads that would previously have been array purchases. Rankings will shift toward vendors credible on regulatory evidence, which is the demand least exposed to either force. Regulatory evidence is the demand least exposed to either force.
india-data-storage-market-company-positioning-matrix-1790006596940

Competitive Moat and Risk Dimensions

DELL TECHNOLOGIES

Moat: Installed Base And Service Reach

A very large installed estate across Indian banking, telecommunications, and government accounts, supported by field service coverage extending well beyond the metropolitan clusters, makes replacement the path of least resistance at refresh. Competitors must justify not only better technology but the operational risk of changing a supported platform that already works.
DELL TECHNOLOGIES

Risk: Domestic Content Preference Growing

Public sector and government procurement increasingly weights local manufacture and domestic content, and Indian integrators have built credible offerings against exactly that criterion. Competing means local assembly arrangements that transfer margin and capability, in a segment where the alternative is exclusion from a growing share of tenders.
NETAPP

Moat: Hybrid Cloud Data Management

Software allowing the same data management across owned infrastructure and domestic cloud regions suits Indian regulated enterprises precisely, since they must keep primary data on inspected infrastructure while moving secondary workloads to cloud. Few competitors offer that continuity credibly, and it addresses the exact split that residency rules impose on these buyers.
NETAPP

Risk: Scale-Out Volume Position Thin

The fastest growing capacity sits in software-defined scale-out deployments bought by platform operators who write their own storage layer and buy drives directly. That volume is essentially unaddressable with a supported-system model, and competing for it would require an operating cost structure entirely unlike the current business.

Players Tracked

Prominent Players

Dell Technologies
NetApp
Hewlett Packard Enterprise
Hitachi Vantara
Pure Storage

Other Key Players

IBM
Lenovo
Huawei
Amazon Web Services
Microsoft
Google
Oracle
Nutanix
Veritas
Commvault
Quantum
Seagate Technology
Western Digital
Netweb Technologies
Sify Technologies

Recent Developments

MARCH 2026

Netweb Technologies Awarded Storage Contract For National AI Compute Facility

Netweb Technologies was selected to supply scale-out storage for a national artificial intelligence compute facility, on a tender weighting domestic manufacture and local support capability alongside delivered cost per terabyte and sustained read throughput. Support capability within India was weighted alongside delivered cost throughout the evaluation.
Signal: Local content weighting is now winning domestic integrators the work that international vendors previously took uncontested.
OCTOBER 2025

NetApp Signs Supply Agreement With Indian Data Centre Operator

NetApp entered a multi-year supply agreement with an Indian colocation and cloud operator covering storage systems across several facilities, with delivery scheduled against grid connection milestones rather than against calendar dates or order timing. Staged inventory is held locally against each phase of the deployment.
Signal: Delivery terms are increasingly written against power connection dates because these facility schedules slip almost routinely.
JUNE 2025

Hitachi Vantara Expands Local Assembly Capacity In Western India

Hitachi Vantara completed an organic expansion of local assembly and configuration capacity in western India, responding to public sector procurement that weights domestic content and to lead times that imported finished systems could not meet reliably. Configuration and testing now complete within India before delivery.
Signal: Local assembly is becoming a procurement requirement rather than a logistics convenience for public sector work.

What Delivered Capacity Costs

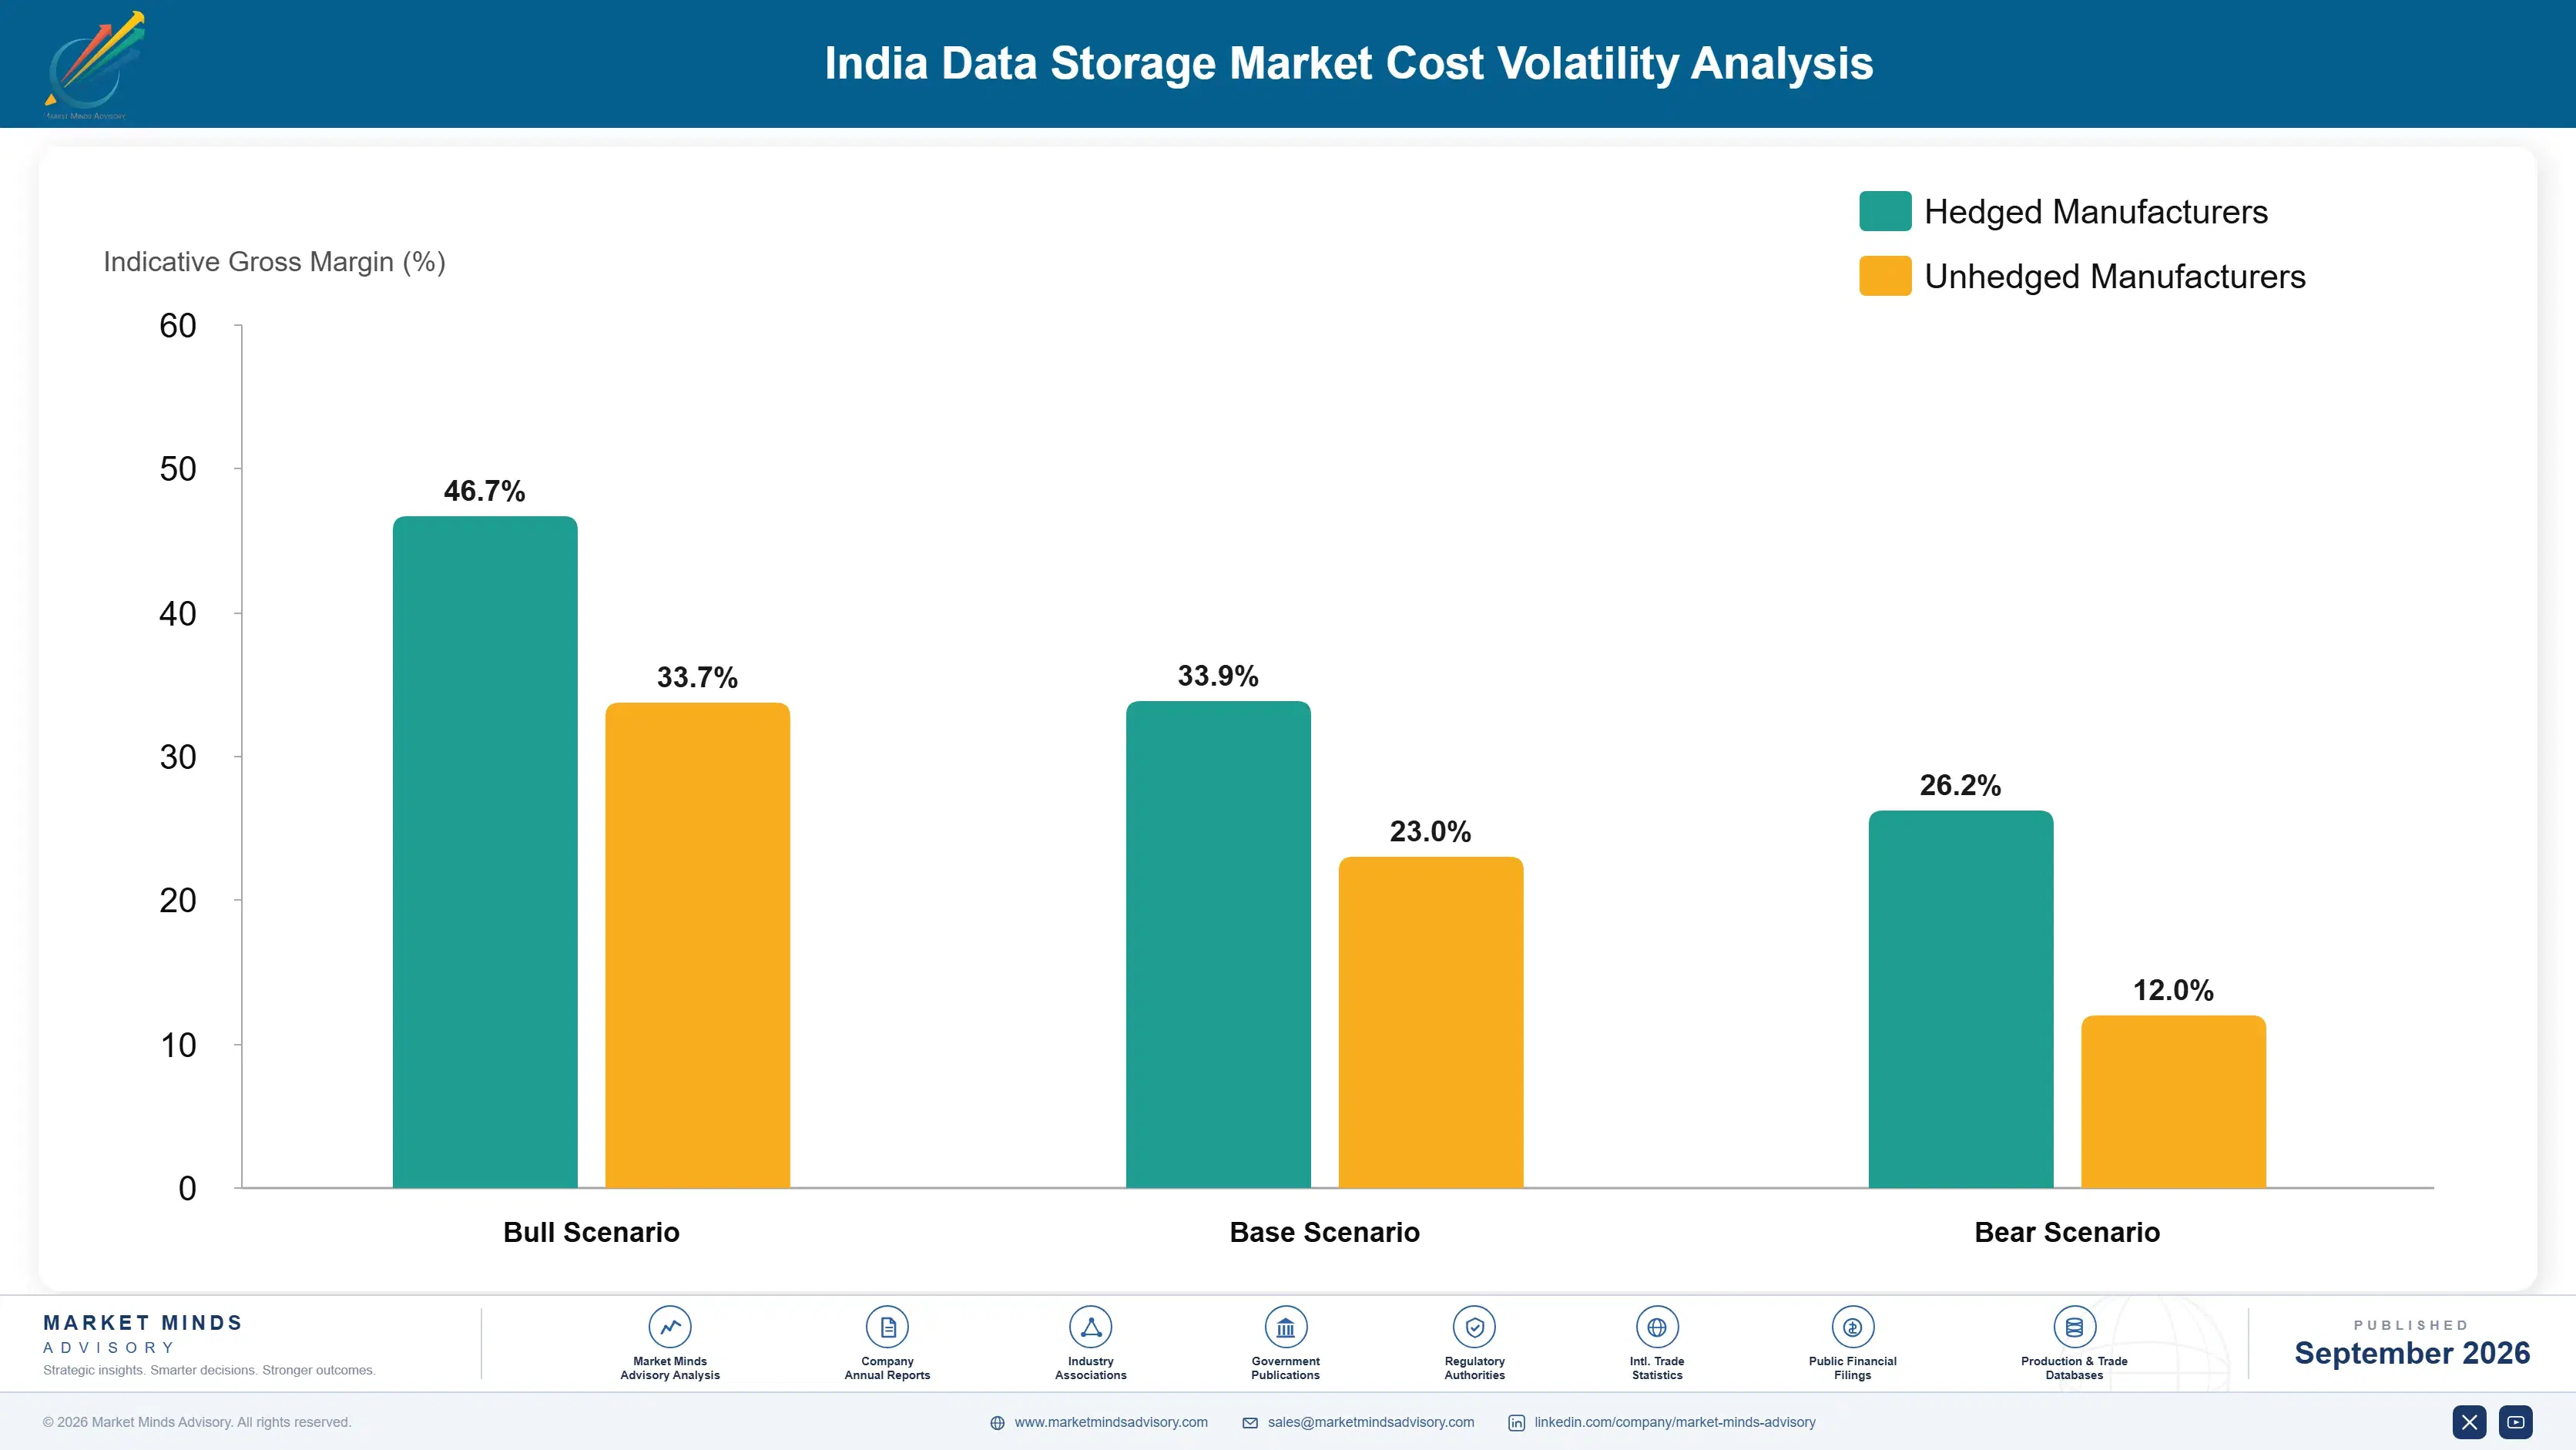
Three inputs dominate delivered cost. Storage media, principally solid state and hard disk drives, runs 42% to 50% of cost of goods sold. Controller hardware, enclosures, and assembly take 18% to 24%. Import duty, logistics, and local configuration add a further 8% to 13%. Media originates almost entirely from a small number of East Asian and Southeast Asian manufacturers, which concentrates the dominant cost line very narrowly indeed.
Solid state media pricing rose sharply through 2024 and 2025 as manufacturers restrained output following an earlier downturn and as artificial intelligence infrastructure absorbed supply, and several vendors described the resulting margin pressure in their annual reports for those years. Indian buyers holding fixed-price framework agreements were partially insulated, while spot purchases absorbed the movement in full and several projects were deferred. Framework pricing offered the only real protection available.

The competitive disadvantage mechanism runs through local configuration rather than through media. A vendor importing finished systems carries duty and lead time that a competitor assembling locally does not, and cannot match delivery commitments against facility schedules that move. Exposure varies by vendor type. Vendors with Indian assembly meet content requirements directly. Import-only vendors face a cost gap and growing exclusion.
india-data-storage-market-cost-volatility-analysis-1790006597136

Establish Local Assembly And Configuration Capacity

Importing finished systems carries duty, lead time, and increasing exclusion from public tenders that weight domestic content. Local assembly addresses all three at once, and vendors who established it report both improved delivery reliability against slipping facility dates and access to procurement they were previously ineligible for entirely. Exclusion from tenders is the harder cost.

Contract Media Supply On Multi-Year Committed Volume

Solid state pricing moves sharply and unpredictably while enterprise agreements in India are frequently fixed for several years. Committed volume arrangements with media manufacturers convert spot exposure into planned cost, and the trade of flexibility for predictability suits vendors whose order books are already visible well ahead. Order books here are visible well ahead.

Hold Staged Inventory Against Facility Connection Dates

Grid connection slippage in the major clusters produces cancelled and renegotiated orders when equipment is scheduled against calendar dates. Holding staged local inventory released against actual handover milestones costs working capital and protects both the order and the customer relationship, which repeated renegotiation reliably damages. Working capital is the price of protecting the relationship.

Portfolio Architecture for Margin Defence

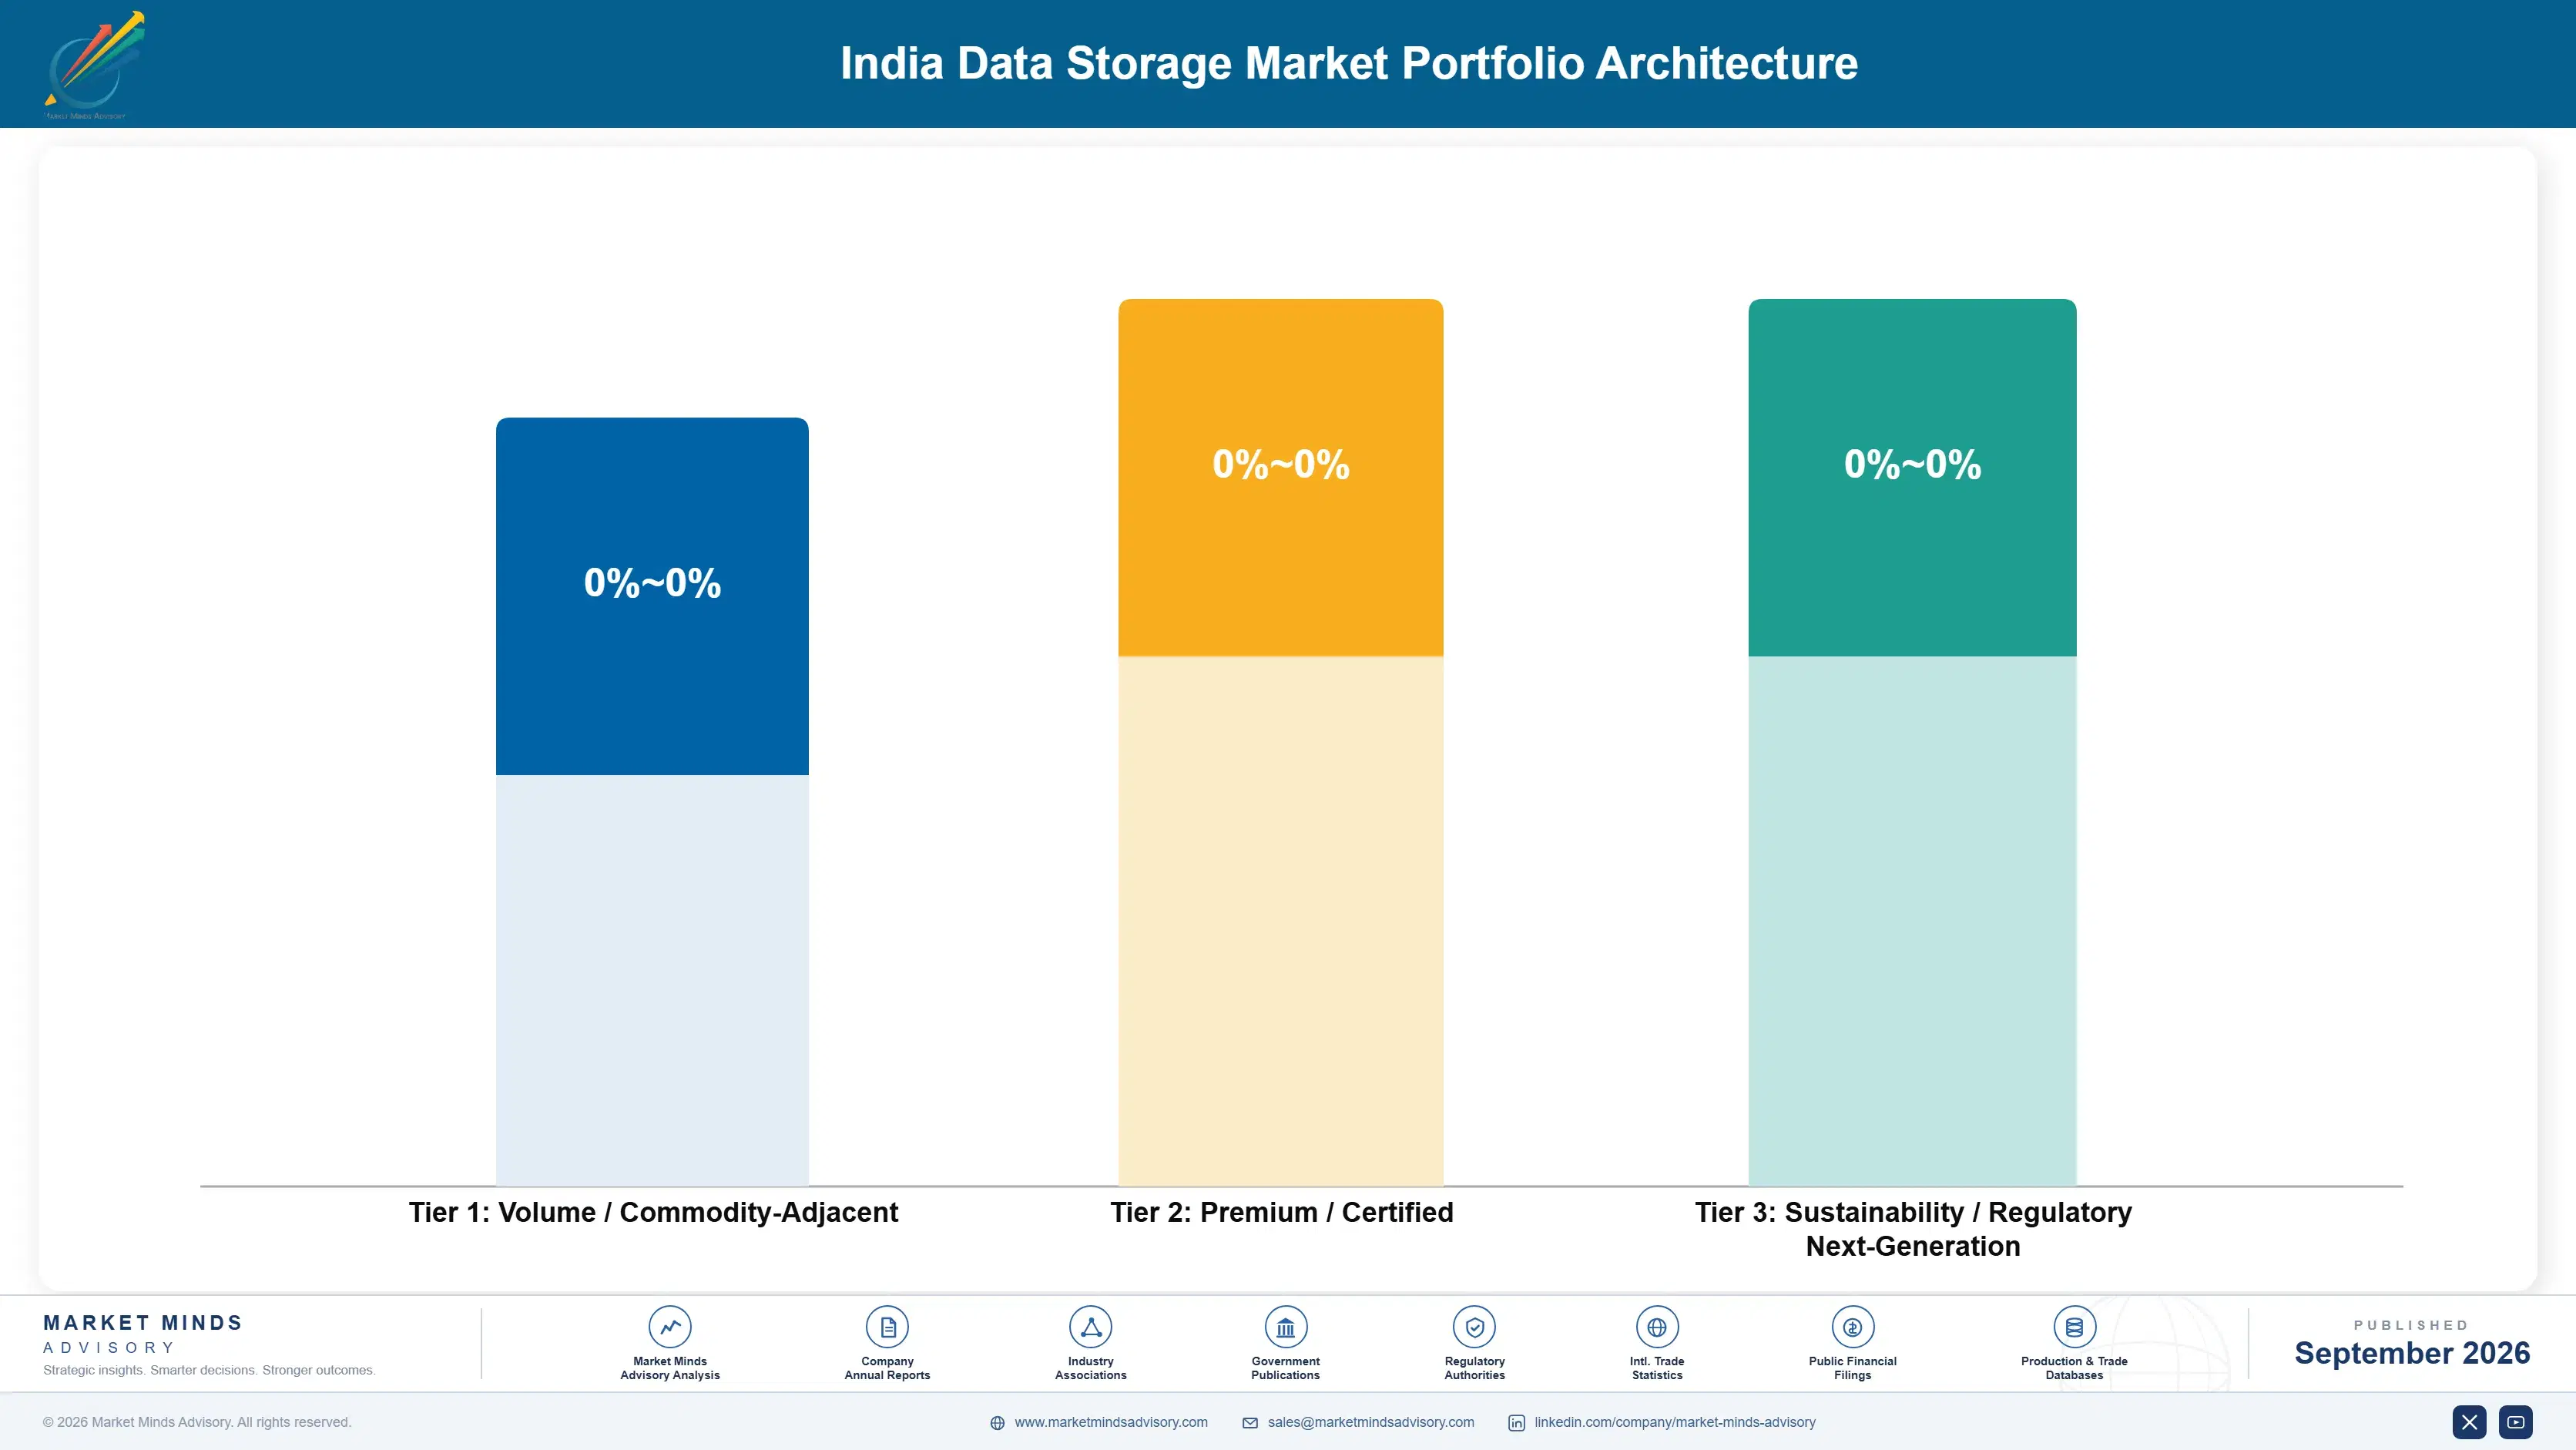
Margin follows how much of the purchase is service rather than media. Drives and enclosures sold to platform operators are close to pure pass-through, priced per terabyte against media cost with almost nothing added. Supported enterprise arrays earn considerably more, carrying integration, service, and warranty. Regulated deployments with documented residency evidence earn most, because the buyer needs assurance a supervisor will accept and there is no substitute.
The tension between volume and premium is unusually severe here. Platform capacity represents 58% of installed petabytes at margins that cannot support field service, and vendors pursuing it with an enterprise cost structure lose money on every rack. Enterprise and regulated work carries good margin on capacity an order of magnitude smaller, which makes revenue growth and margin growth genuinely opposed.

High-value pools concentrate where the buyer needs something beyond capacity: regulated financial services deployments requiring inspection-ready evidence, government work weighting domestic manufacture, and enterprise refresh where end of support removes the option to wait. These share a buyer who cannot simply purchase drives. Everywhere else the product is terabytes, and terabytes price against East Asian media cost.

Volume / Commodity-Adjacent

Drives, enclosures, and capacity tier media sold to platform operators building their own software layer. Pricing runs per terabyte against media cost with minimal value added. The nine-point range reflects variation in whether the vendor manufactures media or resells it.
Gross Margin: 9% to 18%

Premium / Certified

Supported enterprise arrays with integration, service, and warranty across banking, telecommunications, and large corporate estates. Field service reach beyond metropolitan clusters is a genuine differentiator. The nine-point range separates vendors with local assembly from those importing finished systems under duty.
Gross Margin: 38% to 47%

Sustainability / Regulatory / Next-Generation

Regulated deployments carrying documented residency, access control, and inspection evidence, plus public sector work meeting domestic content requirements. Buyers need supervisory assurance rather than performance. The eleven-point range reflects how differently vendors price documentation that few have prepared properly.
Gross Margin: 52% to 63%
india-data-storage-market-portfolio-architecture-1790006597636

High-value Sub-segments and Strategic Watch-out

Regulated Residency Deployments

Highest value, covering roughly 23% of installed capacity that exists because rules require the location. Buyers are insensitive to price and performance and need inspection-ready evidence. The ten-point range reflects how few vendors have prepared documentation properly for Indian sectoral requirements. Assurance is the product.
Gross Margin: 54% to 64%

Enterprise Flash Refresh Cycle

The premium volume core, driven by disk array end of support rather than by performance need, with flash taking 67% of new enterprise capacity. Timing is dictated by support expiry dates. The nine-point range separates local assembly economics from imported system delivery under duty. Timing is externally set.
Gross Margin: 40% to 49%

Domestic Region Cloud Storage

Fast growth at 20.6%, absorbing workloads that would previously have become array purchases and recorded as consumption rather than capital. Residency compliance without construction removed the main obstacle. Revenue recognition differs enough to make shipment comparisons genuinely misleading. Capital converts into consumption spending. Substitution is well underway.
Gross Margin: 44% to 54%

Platform Operator Capacity Supply

The strategic watch-out. It carries 58% of installed petabytes at prices that cannot support field service, and vendors pursuing it with an enterprise cost structure lose money at scale. The thirteen-point range reflects the gap between media manufacturers and resellers competing for the same racks.
Gross Margin: 7% to 20%

How This Demand Actually Repeats

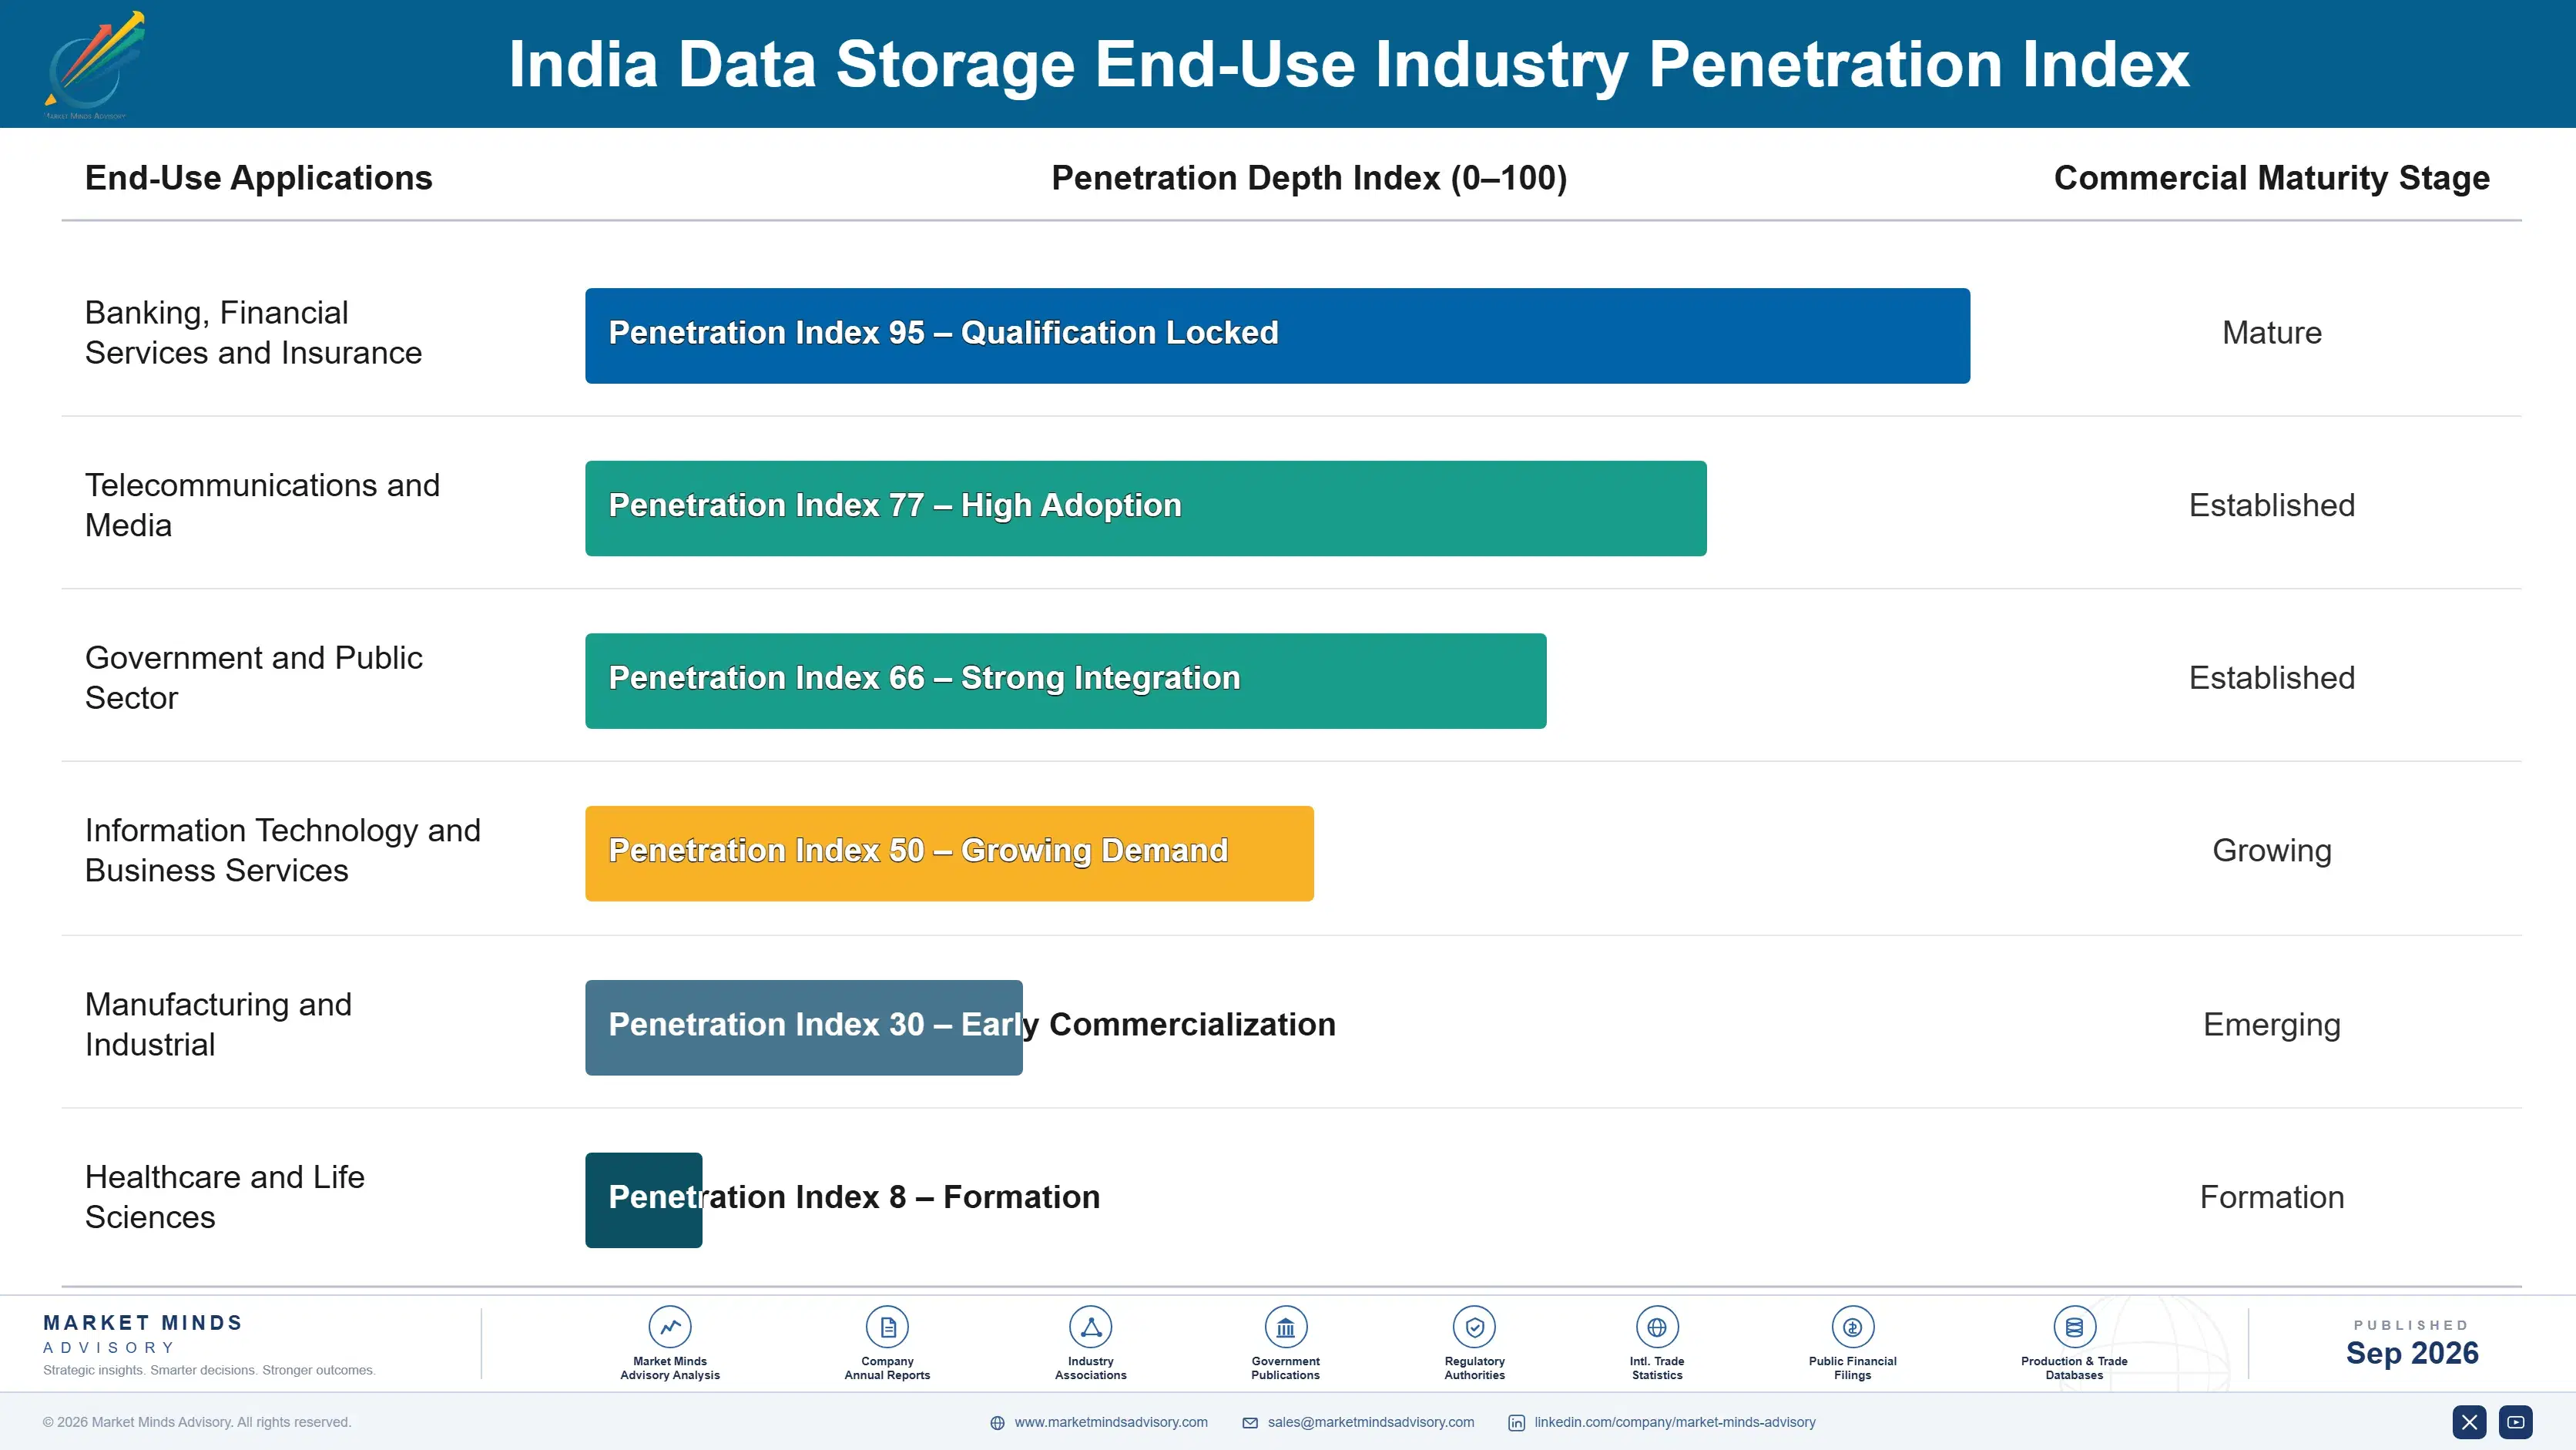
Recurrence differs so completely between the two markets that averaging them explains nothing. Platform operators buy continuously against capacity plans, at prices renegotiated each cycle, with no switching cost worth naming. Enterprises buy in refresh waves set by support expiry, typically five to seven years apart, and between those waves they buy almost nothing beyond incremental shelves and service renewals. Averaging the two produces a cycle nobody experiences.
Depth of commitment varies by sector rather than by size. Regulated financial institutions embed deeply, because the documentation supporting a supervisory inspection is built around specific systems and rebuilding it is genuinely unattractive. Telecommunications operators are less committed, buying competitively at each refresh. Government buyers now weight domestic content heavily enough that established international relationships matter considerably less than they did.

The buyer profile has moved in two directions at once. Infrastructure managers still evaluate systems, but chief information security officers and compliance functions now gate regulated deployments on residency evidence, while finance functions increasingly question utilisation running at 44%. Vendors leading with performance specification are addressing the participant with the least influence over whether the purchase happens at all. Specification arguments land on the wrong participant.
india-data-storage-market-end-use-penetration-index-1790006598126

Where This Market Rewards

These are among the four positions where our research anticipates prominent divergence between winners and laggards over the coming forecast period. Each is grounded in the demand model, the regulatory perimeter, and the announced capacity pipeline.
01 / MARKET SEPARATION DISCIPLINE

The headline growth rate is not addressable

Platform operators hold 58% of installed petabytes, buy drives rather than arrays, and write their own storage software, which makes most of the reported growth unavailable to any vendor selling supported systems with service contracts. Companies pursuing both without separating the operations report gross margin 9 to 14 points below those running them as distinct businesses. The uncomfortable decision is which market to be in, and the visible volume is the wrong answer for most, and the margin that matters is not.
02 / RESIDENCY EVIDENCE PACKAGING

Regulated buyers purchase assurance, not performance

Roughly 23% of Indian installed capacity exists because financial sector directives and the data protection framework require the location rather than because any workload belongs there. Those buyers are insensitive to benchmarks and largely to price, needing documented location, access control, and inspection readiness a supervisor will accept. Vendors packaging that evidence win regulated accounts 3.2 times more often, and remarkably few have prepared it properly for Indian sectoral rules, which leaves the position open to whoever does the work first.
03 / CAPACITY UTILISATION HONESTY

Half the capacity already purchased holds nothing

Provisioned enterprise storage runs at 44% utilisation because capacity is allocated per application at peak projections and never reclaimed when those projections fail to materialise. Vendors leading with utilisation assessment rather than a capacity quote convert into larger multi-year agreements 2.4 times more often, despite deferring the immediate order by a year or more. Declining a sale that a customer does not need is what secures the refresh cycle that follows it, and Indian finance functions have started asking about the gap directly.
04 / POWER SCHEDULE REALISM

Grid connections decide when equipment ships

Data centre capacity in Mumbai, Chennai, and Hyderabad is constrained by grid connection availability and suitable land rather than by demand, and connection dates slip past original schedules routinely. Vendors quoting against facility handover rather than order date, holding staged local inventory, report order-to-revenue conversion roughly 28% higher. It requires understanding the customer's power position better than their own procurement team frequently does, and the customers value being told the truth about their own schedule, which is rarer than it should be.

Engagement Snapshot From the Field

A live engagement with an industry participant carrying material or product regulatory and market exposure ahead of a defining policy shift, showing how our research translates into a defensible multi-year portfolio strategy.
MARKET MINDS ADVISORY · CLIENT ENGAGEMENT SUMMARY
India Data Storage Producer Strategic Portfolio Review and Transition Roadmap 2026·Investment Scenario on India Data Storage Exposure Evaluation 2025-26
CLIENT PROFILE
An Indian private sector bank with approximately 2,900 branches and a technology operating budget above USD 410 million annually (client-reported, unverified by MMA). The storage estate spanned two owned data centres and one colocation facility, mixing arrays from three vendors installed across a decade, with a substantial disk-based population approaching end of vendor support. No utilisation analysis had been performed across the estate.
STRATEGIC CHALLENGE
Support expiry on the disk estate forced a decision within eighteen months, and the proposed replacement quote exceeded the approved capital envelope by a wide margin. Separately, supervisory questions about payment data location had produced an internal review nobody could close, because documentation of where specific data physically resided did not exist in usable form.
MMA APPROACH
MMA measured actual utilisation across the estate against provisioned capacity, mapped data categories subject to residency directives to physical locations, and modelled replacement scenarios combining reclamation, selective flash refresh, and movement of eligible workloads into domestic cloud regions rather than replacing capacity like for like. Supervisory documentation requirements were assessed separately.
KEY FINDINGS
  1. Measured utilisation across the estate stood at 39%, below the 44% national average, with three applications holding provisioned capacity they had never written to at all.
  2. Roughly 31% of stored data was subject to residency directives, while documentation adequate for a supervisory inspection existed for only a small fraction of that.
  3. Reclamation and thin provisioning would defer 44% of the proposed capital purchase by at least two years without any effect on service levels or performance.
  4. Archive and analytics workloads representing 22% of capacity could move to domestic cloud regions within residency rules, converting capital into consumption spending.
CLIENT PROFILE
An Indian private sector bank with approximately 2,900 branches and a technology operating budget above USD 410 million annually (client-reported, unverified by MMA). The storage estate spanned two owned data centres and one colocation facility, mixing arrays from three vendors installed across a decade, with a substantial disk-based population approaching end of vendor support. No utilisation analysis had been performed across the estate.
STRATEGIC CHALLENGE
Support expiry on the disk estate forced a decision within eighteen months, and the proposed replacement quote exceeded the approved capital envelope by a wide margin. Separately, supervisory questions about payment data location had produced an internal review nobody could close, because documentation of where specific data physically resided did not exist in usable form.
MMA APPROACH
MMA measured actual utilisation across the estate against provisioned capacity, mapped data categories subject to residency directives to physical locations, and modelled replacement scenarios combining reclamation, selective flash refresh, and movement of eligible workloads into domestic cloud regions rather than replacing capacity like for like. Supervisory documentation requirements were assessed separately.
KEY FINDINGS
  1. Measured utilisation across the estate stood at 39%, below the 44% national average, with three applications holding provisioned capacity they had never written to at all.
  2. Roughly 31% of stored data was subject to residency directives, while documentation adequate for a supervisory inspection existed for only a small fraction of that.
  3. Reclamation and thin provisioning would defer 44% of the proposed capital purchase by at least two years without any effect on service levels or performance.
  4. Archive and analytics workloads representing 22% of capacity could move to domestic cloud regions within residency rules, converting capital into consumption spending.
RECOMMENDED STRATEGY
Phase 1: Phase one: run capacity reclamation across the estate before any procurement, reducing the replacement requirement to what support expiry genuinely forces. Phase 2: Phase two: build residency documentation mapping regulated data categories to physical locations, and require vendors to supply inspection-ready evidence contractually. Phase 3: Phase three: move archive and analytics workloads to domestic cloud regions, retaining primary transactional data on owned infrastructure that supervisors inspect.
OUTCOME
Capital spending on the refresh fell 46% against the original proposal while every out-of-support array was replaced on schedule (client-reported, unverified by MMA). The supervisory review closed with the new residency documentation accepted. Measured utilisation across the retained estate rose from 39% to 68% within a year.

Frequently Asked Questions

Foundational context covering the market sizes, CAGR, scope, country, region and competition that inform every finding below. This section is provided to cover basics and most often pre-purchase conversations, answered from the MMA Primary Research Dataset.

What is the current size of the India Data Storage Market?

The market was worth USD 3.8 billion in 2025 and reaches USD 4.4 billion in 2026. Value covers systems, media, and storage services deployed in India.

How large will the India Data Storage Market be by 2036?

MMA forecasts USD 18.1 billion by 2036, an increase of USD 13.7 billion across the forecast period. That represents 4.11 times the 2026 base of USD 4.4 billion.

What is the CAGR for the India Data Storage Market 2026 to 2036?

The base case compound annual growth rate is 15.2%, with a bull case at 16.5% and a bear case at 13.9%. Historical growth from 2020 to 2025 ran at 13.8%.

Which segment is growing fastest?

Software-defined and scale-out storage grows at 22.8%, half again the market rate of 15.2%. It is what capacity looks like once platform operators are counted properly.

Who are the major companies in the India Data Storage Market?

Dell Technologies, NetApp, Hewlett Packard Enterprise, Hitachi Vantara, and Pure Storage lead, holding 51% of enterprise contracted value. Domestic integrators are taking public sector share.

Which country is growing fastest?

Scope is limited to India, so growth is compared within it. Tamil Nadu leads at 19.8%, on cable landing capacity at Chennai and new hyperscale construction.

Report Segmentation Architecture

The full report scope spans multiple orthogonal segmentation dimensions, with cross-tabulated demand data provided for each dimension pair. Coverage extends further to regional breakdowns, trend trajectories, and the competitive detail needed to support segment-level decision-making.

By Product Category

  • All-Flash Enterprise Arrays
  • Hybrid and Disk-Based Arrays
  • Software-Defined and Scale-Out Storage
  • Cloud Storage Services from Domestic Regions
  • Backup, Archive and Data Protection Systems
  • Tape and Long-Term Retention Media

By End-Use Industry

  • Banking, Financial Services and Insurance
  • Telecommunications and Media
  • Government and Public Sector
  • Information Technology and Business Services
  • Manufacturing and Industrial
  • Healthcare and Life Sciences

By Commercial Dimension

  • Direct Enterprise Procurement
  • Systems Integrator Delivered
  • Colocation and Hosting Operator Purchase
  • Public Sector Tender Award
  • Cloud Consumption Subscription
  • Managed Storage Service Contract

By Region

  • East Asia
  • North America
  • South Asia and Pacific
  • Western Europe
  • Eastern Europe
  • Latin America
  • Middle East and Africa

Scope, Methodology, and Coverage

Every figure in this report is reproducible from documented input assumptions. The scope below maps the historical period, the forecast horizon, the segmentation dimensions, and the countries covered, alongside the underlying primary and qualitative methodology.
Historical Period
2020 to 2025
Forecast Period
2026 to 2036
Base Year
2025 (USD billions; MMA Primary Research Dataset, September 2026)
Market Definition
This market covers data storage systems, media, and services deployed in India, including all-flash enterprise arrays, hybrid and disk-based arrays, software-defined and scale-out storage, cloud storage services delivered from domestic regions, backup, archive and data protection systems, and tape and long-term retention media. It excludes server compute hardware, networking equipment, database software licensing, endpoint device storage, and consumer cloud subscription services.
Quantitative Units
USD billions, deployed systems, media and services value
Segmentation Dimensions
Product category, end-use industry, commercial dimension, supply origin
Regions Covered
East Asia, North America, South Asia and Pacific, Western Europe, Eastern Europe, Latin America, Middle East and Africa
Countries Covered
India; supply origin analysis covers China, South Korea, Japan, Taiwan, Thailand, Malaysia, Singapore, Vietnam, United States, Canada, Mexico, Ireland, Netherlands, Germany, United Kingdom, France, Poland, Romania, Ukraine, Brazil, United Arab Emirates, Saudi Arabia, South Africa
Key Companies Profiled
Dell Technologies, NetApp, Hewlett Packard Enterprise, Hitachi Vantara, Pure Storage, IBM, Lenovo, Huawei, Amazon Web Services, Microsoft, Google, Oracle, Nutanix, Veritas, Commvault, Quantum, Seagate Technology, Western Digital, Netweb Technologies, Sify Technologies
Quantitative Methodology
Primary survey, n=3,800 respondents, Q4 2025, six countries; demand-side model with trade association cross-validation
Qualitative Methodology
47 expert interviews, Q4 2025; applied to validate demand model assumptions, identify emerging dynamics, and assess competitive positioning
Report Format
PDF and XLSX data workbook (Word format preview document)
Publisher
Market Minds Advisory
Report Code
MMA-2026-TEC-481
Published
September 2026
Contact
sales@marketmindsadvisory.com | www.marketmindsadvisory.com

Purchase the full India Data Storage Market Report (2026 to 2036).

The full report sizes the Indian data storage market across six product categories with forecasts to 2036 under base, bull, and bear cases. It separates platform operator capacity from enterprise purchasing, which the headline growth rate conflates, and examines what residency directives, utilisation practice, and grid connection constraints mean for vendor planning. Competitive analysis covers twenty participants evaluated consistently on contracted enterprise value, with detailed treatment of domestic content requirements and cloud substitution. Cost structure, margin architecture by category, and the supply origin map behind Indian deployment are analysed in full. Primary research includes 3,800 survey responses and 47 expert interviews.
Six product categories sized and forecast separately
Twenty participants evaluated on contracted enterprise value
Supply origin mapping across seven global geographies
Margin architecture by category and buyer type
Platform and enterprise demand separated with capacity evidence
Residency requirement analysis by regulated sector and data category

Built For The People Who Decide

From boardroom strategy to bench-side execution, this report is read cover-to-cover by leaders shaping the next decade of their industry, turning demand scenarios, market dynamics and valuation benchmarks into decisions.
CXOs/ Presidents/ VPs/ Managers
M&A and Corporate Development
Strategy Teams and R&D Heads
Procurement and Product Directors
Regulatory and Compliance Leaders
Investor Relations and Equity Analysts