

Market Minds Advisory
India Capital Market Exchange Ecosystem

India Capital Market Exchange Ecosystem: Algorithmic Trading Infrastructure and Digital Brokerage Growth

Rising retail participation, expanding algorithmic trading infrastructure, and accelerating settlement cycle modernization are jointly reshaping how Indian exchanges, depositories, and clearing corporations generate revenue nationwide. across every major participant category.

Lead Analyst

Published

September 2026

Make Smarter Decisions with Customized Research Insights

Request a free sample report and evaluate market opportunities, growth trends, and competitive dynamics relevant to your business needs.

2025 MARKET VALUE$16.5BMarket Size 2025
2036 FORECAST VALUE$45.2BBase Case , 2026 to 2036
CAGR 2026 TO 20369.6 %Bull 10.9% / Bear 8.3%
INCREMENTAL OPPORTUNITY$27.1BNet 10- year value creation
EXPANSION MULTIPLE2.50x2036 value over 2026 base
Strategic Levers
M&A Pipeline
Regional Outlook
Country Rankings
Competitive Intelligence
Segmental Deep-dive
Call-Us : 91 93563 13602

Executive Snapshot and Market Trajectory

Indian capital market infrastructure providers are capturing record trading volume as retail participation climbs, pushing exchanges and depositories to expand technology capacity well beyond historical peak-day capability. Technology providers face the sharpest capacity pressure as historical peak-day assumptions no longer hold given sustained volume growth.
Cash equity and derivatives trading remains the dominant revenue driver, but algorithmic and co-location trading infrastructure is expanding fastest as institutional and proprietary trading firms demand lower latency access. Demand concentrates heavily among Mumbai-based institutional trading desks and a rapidly growing base of retail derivatives traders nationwide. Data and analytics revenue is climbing accordingly as market participants demand more granular trading signals. Sponsorship-adjacent data licensing agreements are also expanding steadily across most exchange revenue lines.
NSE and BSE retain dominant combined share of listed trading volume, but depositories and data analytics providers are capturing growing revenue share as market complexity increases. Tightening margin and settlement regulation continues reshaping which participants can profitably serve high-frequency trading segments. Consolidation among smaller regional data vendors looks increasingly likely as compliance cost keeps climbing steadily. Broker commission scrutiny is also reshaping how exchanges structure transaction fee tiers industry-wide.
Market Definition
This report covers revenue generated by exchanges, clearing corporations, depositories, and market data providers operating within India's capital market trading infrastructure. It excludes brokerage commission revenue earned by individual trading firms and asset management fee revenue earned by mutual fund and portfolio management companies.
Base Year Value
$16.5B in 2025 (MMA Primary Research Dataset, August 2026)
Forecast Period
2026 to 2036, eleven discrete annual values
CAGR
9.6% base case. Bull 10.9%. Bear 8.3%.
Fastest Growth Segment
Algorithmic and Co-Location Trading Infrastructure: 16.8% CAGR
Fastest Growth Country
Vietnam: 14.2% CAGR
Fastest Growth Region
South Asia and Pacific: 11.6% CAGR
Largest Region
South Asia and Pacific: 24% of 2025 global value
Market Leaders
National Stock Exchange of India, BSE Limited, National Securities Depository Limited, Central Depository Services Limited, Multi Commodity Exchange of India. Source: MMA Analysis based on company annual reports.
Primary Survey
n=3,800 procurement and R&D decision-makers, Q4 2025, six countries
Methodology
Demand-side build-up, cross-validated against public data, 47 expert interviews

India Capital Market Forecast Scenarios

india-capital-market-exchange-ecosystem-size-forecast-scenario-1787918027961
Capital market infrastructure revenue grew steadily between 2020 and 2025 as pandemic-driven retail trading account growth in 2020 and 2021 established a durable base of active participants across most demographic segments. Retail derivatives trading led much of the growth as new participants entered the market through mobile-first brokerage platforms. International institutional inflows also contributed meaningfully to overall trading volume growth across most major segments.
The base case assumes continued growth driven by three commercial mechanisms: sustained retail derivatives trading volume growth outpacing cash equity trading, expanding institutional demand for lower latency algorithmic trading infrastructure, and broader settlement cycle modernization that increases transaction throughput capacity across the market. These three forces reinforce each other across the horizon, compounding growth beyond what any single mechanism alone would produce. Sponsorship-adjacent data licensing revenue growth is reinforcing this momentum considerably across most exchange revenue lines nationwide.
The bull case hinges on continued retail account growth alongside institutional infrastructure investment reaching new highs simultaneously. The bear case centers on a sustained market downturn that suppresses trading volume and retail participation, slowing revenue growth across most exchange and depository segments nationwide. Either scenario would meaningfully reshape which participants hold pricing power over the coming decade.

Retail Participation Reshapes Exchange Revenue Mix

India's capital market infrastructure sits at the intersection of surging retail participation, institutional algorithmic trading demand, and a maturing settlement infrastructure that has compressed transaction processing timelines considerably over the past several years. Providers that invested early in capacity expansion and automated risk management are now capturing disproportionate share of new trading volume across most retail and institutional segments nationwide, particularly during high-volatility sessions.
TOP 5 CONCENTRATION68%Combined revenue share held by the largest infrastructure providers
AVERAGE TRANSACTION FEE0.003%Typical exchange fee charged per rupee of trading value
DERIVATIVES VOLUME SHARE89%Share of total trading volume conducted through derivatives contracts
DIGITAL ONBOARDING SHARE94%New trading accounts opened entirely through fully digital channels
AVERAGE SETTLEMENT CYCLET+1 daysTypical time required to complete trade settlement processing
ACTIVE ACCOUNT GROWTH RATE22%Annual growth rate in active retail trading account registrations
The market's commercial character reflects a concentrated infrastructure base: NSE and BSE offering standardized exchange access at scale, and specialized data and depository providers competing on value-added analytics and custody services underserved by exchanges themselves. This concentration is intensifying as exchanges push further into data licensing territory once ceded entirely to independent analytics providers, narrowing the differentiation gap smaller vendors depended on for revenue growth.
Regulatory scrutiny of margin requirements, combined with growing product innovation around algorithmic and co-location trading access, will define the competitive landscape over the coming decade as providers balance growth ambitions against systemic risk management standards. Consolidation pressure on smaller independent data vendors is building steadily, and continued algorithmic trading infrastructure investment could reshape which institutions command the fastest-growing segments of market revenue.
"Indian retail investors used to trade a handful of stocks through a broker's phone line. Now the exchanges winning are the ones who figured out that most participants want a mobile app and instant settlement."
Practice Lead, Capital Markets Infrastructure and Exchange Services Intelligence · MMA Capital Markets Infrastructure and Exchange Services Practice · August 2026

Market Trends

T+1 Settlement Modernization Expands Transaction Throughput

India's transition to T+1 settlement, completed across the entire equity market ahead of most global peers, continues expanding transaction processing throughput and reducing counterparty risk exposure for market participants industry-wide. National Securities Depository Limited and Central Depository Services Limited have both expanded proprietary settlement infrastructure covering an increasing share of daily transaction volume. This shift is opening discussion around further compression toward same-day settlement, which would meaningfully differentiate India's market infrastructure from most developed market peers still operating on T+2 cycles. Smaller regional depositories without comparable infrastructure investment increasingly rely on partnership arrangements to remain competitive on settlement speed.
Market Impact: Lifts retail derivatives volume by 26%

Algorithmic Trading Infrastructure Demand Accelerates Co-Location Investment

Institutional and proprietary trading firms increasingly demand lower-latency co-location access to reduce execution delay on algorithmic trading strategies, pushing exchanges to expand data center capacity and network infrastructure investment considerably. National Stock Exchange of India and BSE Limited have both expanded proprietary co-location facilities covering a growing share of institutional trading volume. This shift is compressing execution latency meaningfully across the industry, favoring exchanges with strong technical infrastructure capability over those still dependent on legacy network architecture. Smaller exchanges without comparable capital investment increasingly partner with third-party data center providers to remain competitive on latency performance.
Market Impact: Raises institutional trading volume 18%

Market Opportunities and Growth Drivers

Retail Derivatives Trading Volume Continues Rapid Expansion

India's retail derivatives trading volume continues expanding rapidly as mobile-first brokerage platforms lower the barrier to entry for options and futures trading among first-time retail participants nationwide. National Stock Exchange of India and BSE Limited have both reported record derivatives volume growth as a direct consequence of this retail participation surge. Every new retail trading account opened translates directly into additional transaction fee revenue across the exchange and clearing infrastructure regardless of ultimate trading profitability for the individual participant. Options premium turnover now represents a meaningfully higher share of total exchange fee revenue than five years ago.
Market Impact: Cuts retail options volume by 14%

Institutional Foreign Portfolio Investment Inflows Support Trading Volume

Sustained foreign portfolio investment inflows into Indian equity and debt markets continue supporting institutional trading volume across cash equity and derivatives segments, expanding the addressable revenue base for exchanges and depositories alike. Central Depository Services Limited and National Securities Depository Limited have both expanded dedicated foreign institutional investor servicing capability tied directly to this inflow growth over the past several years. This trend is expected to persist as India's weight in global emerging market indices continues climbing steadily. Index inclusion events in particular tend to generate meaningful one-time volume spikes that benefit exchange and depository revenue disproportionately.
Market Impact: Raises cybersecurity spending by 32%

Market Restraints and Challenges

Derivatives Margin Requirement Tightening Suppresses Retail Volume

The Securities and Exchange Board of India's tightened margin requirements for index derivatives trading have raised the effective cost of retail options and futures speculation, suppressing volume growth among smaller retail participants meaningfully. The root cause is regulatory concern that excessive retail speculation in short-dated options contracts was generating disproportionate household financial losses without corresponding market benefit. Exchanges are mitigating the pressure by expanding investor education programs, but transaction fee revenue growth from the smallest retail segment has slowed noticeably. Smaller brokers dependent on options revenue face disproportionate impact relative to diversified rivals.
Market Impact: Cuts settlement risk exposure by 50%

Cybersecurity Investment Requirements Raise Compliance Cost

Escalating cybersecurity threats targeting trading infrastructure continue forcing exchanges and depositories to invest heavily in defensive technology and incident response capability, raising fixed operating cost meaningfully across the industry. The root cause is the increasing sophistication and frequency of attempted breaches targeting financial market infrastructure given the systemic importance of uninterrupted trading access. Providers are mitigating this by pooling threat intelligence sharing arrangements, but cybersecurity investment remains a meaningfully growing share of total technology budget across most major infrastructure providers. Smaller regional exchanges without comparable security budgets face disproportionate exposure relative to their overall revenue base.
Market Impact: Cuts execution latency by 40 microseconds
3 additional market trends, 3 additional growth drivers, and 4 additional restraints and challenges are covered in the full report. Contact sales@marketmindsadvisory.com to access the complete intelligence.

Segment CAGR and Growth Architecture

India capital market exchange infrastructure segments across six mutually exclusive service categories, ranging from traditional cash equity trading through fast-growing algorithmic trading infrastructure and digital brokerage platforms that increasingly determine which providers capture new revenue across the industry. These distinctions matter increasingly for infrastructure providers setting long-term technology and capacity investment priorities across the market.
Section default visual

Algorithmic and Co-Location Trading Infrastructure

Algorithmic and co-location trading infrastructure bundles low-latency data center access, direct market data feeds, and execution optimization tools into a service tier tailored specifically to institutional and proprietary trading firms competing on execution speed. National Stock Exchange of India and BSE Limited have both scaled dedicated co-location facilities covering an increasing share of institutional trading volume nationwide. Growth here consistently outpaces every other segment because algorithmic strategies now account for a majority of institutional order flow, and exchanges continue investing in infrastructure capacity to capture this high-value trading segment at an accelerating pace across most major trading venues. Regulatory support for market resilience should further reinforce this trend over the coming several years.
CAGR 16.8%

Digital Brokerage Trading Platforms

Digital brokerage trading platforms bundle mobile-first account opening, real-time market data access, and simplified derivatives trading tools into a single application experience tailored specifically to India's rapidly growing retail investor base. Zerodha and Groww have both built proprietary digital platforms that process account opening and trading activity without requiring in-person branch interaction at any stage. Demand is accelerating as younger investors increasingly prefer app-based trading experiences over traditional full-service brokerage relationships, and digital platforms consistently offer lower transaction cost than legacy brokerage models. Account opening speed in this segment runs meaningfully faster than traditional full-service brokers, reflecting the scale of automation these platforms have built into their onboarding process across every stage of the investor journey.
CAGR 13.2%
Full segment breakdown across 6 segments available in the complete report.

Regional Architecture and Country Demand Map

Indian capital market infrastructure assets concentrate domestically given the market's national scope, while faster-growing exchange infrastructure markets abroad expand from smaller installed bases across emerging participation and digitizing trading infrastructure worldwide.

North America

United States capital market infrastructure, while outside this report's Indian focus, provides useful comparative context for algorithmic trading infrastructure innovation given the region's longer history of co-location and low-latency trading. NASDAQ and NYSE dominate origination volume across most listed trading categories domestically. Digital-first brokerage platforms continue winning incremental account share from traditional full-service brokers, a trend Indian brokers are actively studying and adapting for their own market.
Share: 23% | CAGR: 8.8% (2026 to 2036)

Western Europe

The London Stock Exchange and Deutsche Boerse anchor this region's assets, with strong domestic institutional trading infrastructure supporting both cash equity and derivatives segments. France and the Netherlands maintain comparably sized exchange markets shaped by strong domestic pension fund and institutional participation. Settlement cycle modernization varies considerably by country, creating a fragmented but rapidly evolving regional infrastructure landscape across most participating markets.
Share: 19% | CAGR: 8.0% (2026 to 2036)
Regional intelligence for 5 additional markets available in the complete report: East Asia, South Asia and Pacific, Latin America, Middle East and Africa, Eastern Europe. Contact sales@marketmindsadvisory.com.
india-capital-market-exchange-ecosystem-market-share-analysis-1787918028497

Where revenue compounds.

Who Controls the Margin Pool

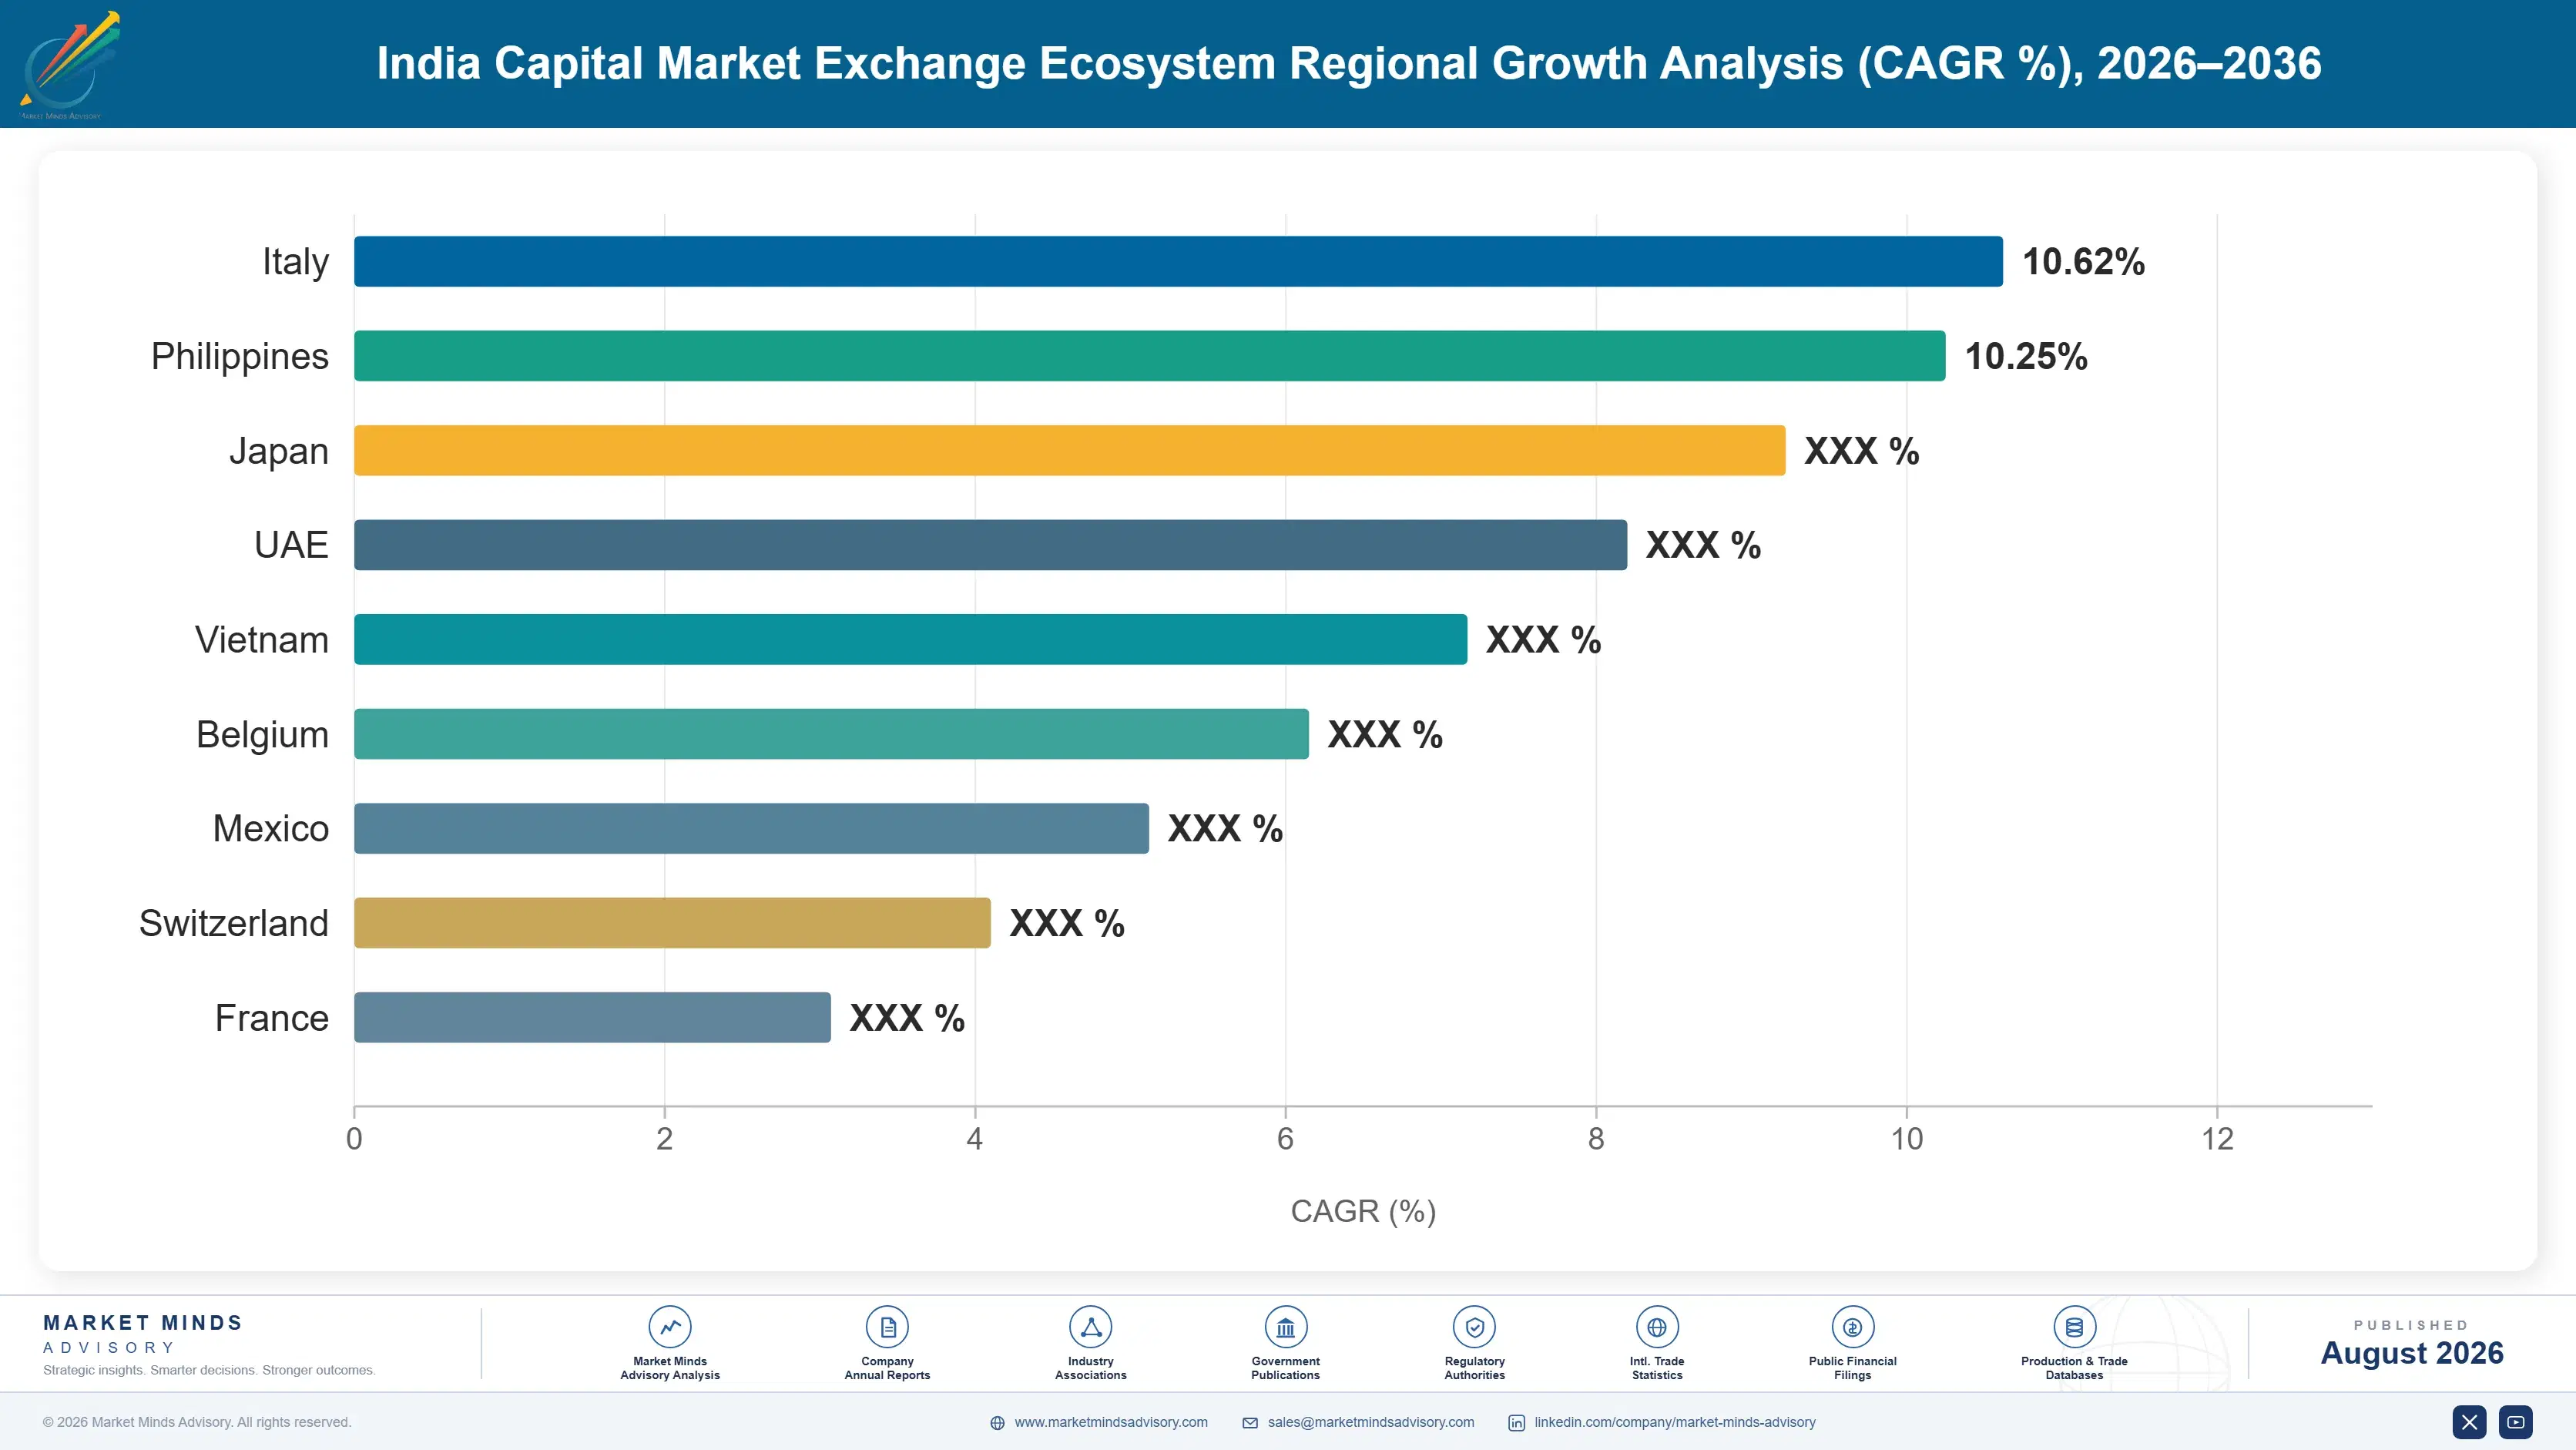
india-capital-market-exchange-ecosystem-country-cagr-analysis-1787918029013

Input cost volatility and margin defence.

india-capital-market-exchange-ecosystem-company-positioning-matrix-1787918029208

Portfolio Architecture for Margin Defence

Section default visual

End-use penetration and the annuity logic.

Section default visual

Four calls that define the decade.

These are among the four positions where our research anticipates prominent divergence between winners and laggards over the coming forecast period. Each is grounded in the demand model, the regulatory perimeter, and the announced capacity pipeline.

Engagement Snapshot From the Field

A live engagement with an industry participant carrying material or product regulatory and market exposure ahead of a defining policy shift, showing how our research translates into a defensible multi-year portfolio strategy.
MARKET MINDS ADVISORY · CLIENT ENGAGEMENT SUMMARY
India Capital Exchange Ecosystem Producer Strategic Portfolio Review and Transition Roadmap 2026·Investment Scenario on India Capital Exchange Ecosystem Exposure Evaluation 2025-26
CLIENT PROFILE
STRATEGIC CHALLENGE
MMA APPROACH
KEY FINDINGS
    CLIENT PROFILE
    STRATEGIC CHALLENGE
    MMA APPROACH
    KEY FINDINGS
      RECOMMENDED STRATEGY
      OUTCOME

      Frequently Asked Questions

      Foundational context covering the market sizes, CAGR, scope, country, region and competition that inform every finding below. This section is provided to cover basics and most often pre-purchase conversations, answered from the MMA Primary Research Dataset.

      Report Segmentation Architecture

      The full report scope spans multiple orthogonal segmentation dimensions, with cross-tabulated demand data provided for each dimension pair. Coverage extends further to regional breakdowns, trend trajectories, and the competitive detail needed to support segment-level decision-making.

      By Region

      • North America
      • Western Europe
      • East Asia
      • South Asia and Pacific
      • Latin America
      • Middle East and Africa
      • Eastern Europe

      Scope, Methodology, and Coverage

      Every figure in this report is reproducible from documented input assumptions. The scope below maps the historical period, the forecast horizon, the segmentation dimensions, and the countries covered, alongside the underlying primary and qualitative methodology.
      Historical Period
      2020 to 2025
      Forecast Period
      2026 to 2036
      Base Year
      2025 (USD billions; MMA Primary Research Dataset, August 2026)
      Market Definition
      This report covers revenue generated by exchanges, clearing corporations, depositories, and market data providers operating within India's capital market trading infrastructure. It excludes brokerage commission revenue earned by individual trading firms and asset management fee revenue earned by mutual fund and portfolio management companies.
      Quantitative Units
      USD billions
      Segmentation Dimensions
      Regions Covered
      North America, Western Europe, East Asia, South Asia and Pacific, Latin America, Middle East and Africa, Eastern Europe
      Countries Covered
      Key Companies Profiled
      Quantitative Methodology
      Primary survey, n=3,800 respondents, Q4 2025, six countries; demand-side model with trade association cross-validation
      Qualitative Methodology
      47 expert interviews, Q4 2025; applied to validate demand model assumptions, identify emerging dynamics, and assess competitive positioning
      Report Format
      PDF and XLSX data workbook (Word format preview document)
      Publisher
      Market Minds Advisory
      Report Code
      MMA-2026-TEC-284
      Published
      August 2026
      Contact
      sales@marketmindsadvisory.com | www.marketmindsadvisory.com

      Purchase the full India Capital Market Exchange Ecosystem Report (2026 to 2036).

      Built For The People Who Decide

      From boardroom strategy to bench-side execution, this report is read cover-to-cover by leaders shaping the next decade of their industry, turning demand scenarios, market dynamics and valuation benchmarks into decisions.
      CXOs/ Presidents/ VPs/ Managers
      M&A and Corporate Development
      Strategy Teams and R&D Heads
      Procurement and Product Directors
      Regulatory and Compliance Leaders
      Investor Relations and Equity Analysts