Market Minds Advisory
In Vitro Diagnostics Market

In Vitro Diagnostics Market: Reimbursement Sets The Price, The Analyser Base Sets Everything Else

A commercial reading of laboratory diagnostics, where a placed analyser locks a decade of reagent revenue, and reimbursement schedules that only ever fall decide what that revenue is actually worth each year.

Lead Analyst

Alice Ballenger

Published

September 2026

Make Smarter Decisions with Customized Research Insights

Request a free sample report and evaluate market opportunities, growth trends, and competitive dynamics relevant to your business needs.

2025 MARKET VALUE$79.6BMarket Size 2025
2036 FORECAST VALUE$151.1BBase Case , 2026 to 2036
CAGR 2026 TO 20366.0 %Bull 7.2% / Bear 4.8%
INCREMENTAL OPPORTUNITY$66.7BNet 10- year value creation
EXPANSION MULTIPLE1.79x2036 value over 2026 base
Strategic Levers
M&A Pipeline
Regional Outlook
Country Rankings
Competitive Intelligence
Segmental Deep-dive
Call-Us : 91 93563 13602

Executive Snapshot and Market Trajectory

Diagnostics is a razor-and-blade business wearing a laboratory coat. The analyser is placed at little or no cost, and the reagents that only run on it produce the revenue for the next eight to ten years. Everything commercial follows from that. Nothing else in the model matters as much.
The market stands at USD 79.6 billion in 2025 and reaches USD 151.11 billion by 2036 at a 6.0% CAGR. Point-of-care and near-patient testing grows fastest at 10.2%, about 1.70 times the overall rate, as testing moves out of central laboratories toward pharmacies, clinics, and physician offices. North America holds 30% of value on test volume and reimbursement levels, while India posts the quickest national growth at 10.8%.
Concentration is high for a medical device category, with the top five holding roughly 58% of reagent and instrument revenue. Two forces are pulling against each other. Laboratory consolidation keeps pushing volume toward large reference networks that buy on cost per reportable result, while point-of-care testing pulls volume the opposite way toward decentralised settings where speed matters more than unit price does. Reimbursement erosion of about 2% a year presses on both.
Market Definition
The in vitro diagnostics market covers reagents, instruments, and consumables used to test human specimens outside the body, spanning immunoassay, clinical chemistry, haematology and coagulation, microbiology and culture-based testing, and non-molecular point-of-care testing. Molecular diagnostics based on nucleic acid amplification and sequencing is excluded and treated as a separate market, as are laboratory information systems, anatomic pathology services, and clinical laboratory service revenue.
Base Year Value
$79.6B in 2025 (MMA Primary Research Dataset, August 2026)
Forecast Period
2026 to 2036, eleven discrete annual values
CAGR
6.0% base case. Bull 7.2%. Bear 4.8%.
Fastest Growth Segment
Point-of-Care and Near-Patient Testing: 10.2% CAGR
Fastest Growth Country
India: 10.8% CAGR
Fastest Growth Region
South Asia and Pacific: 8.4% CAGR
Largest Region
North America: 30% of 2025 global value
Market Leaders
Roche Diagnostics, Abbott, Siemens Healthineers, Danaher, Sysmex. Source: MMA Analysis based on company annual reports.
Primary Survey
n=3,800 procurement and R&D decision-makers, Q4 2025, six countries
Methodology
Demand-side build-up, cross-validated against public data, 47 expert interviews

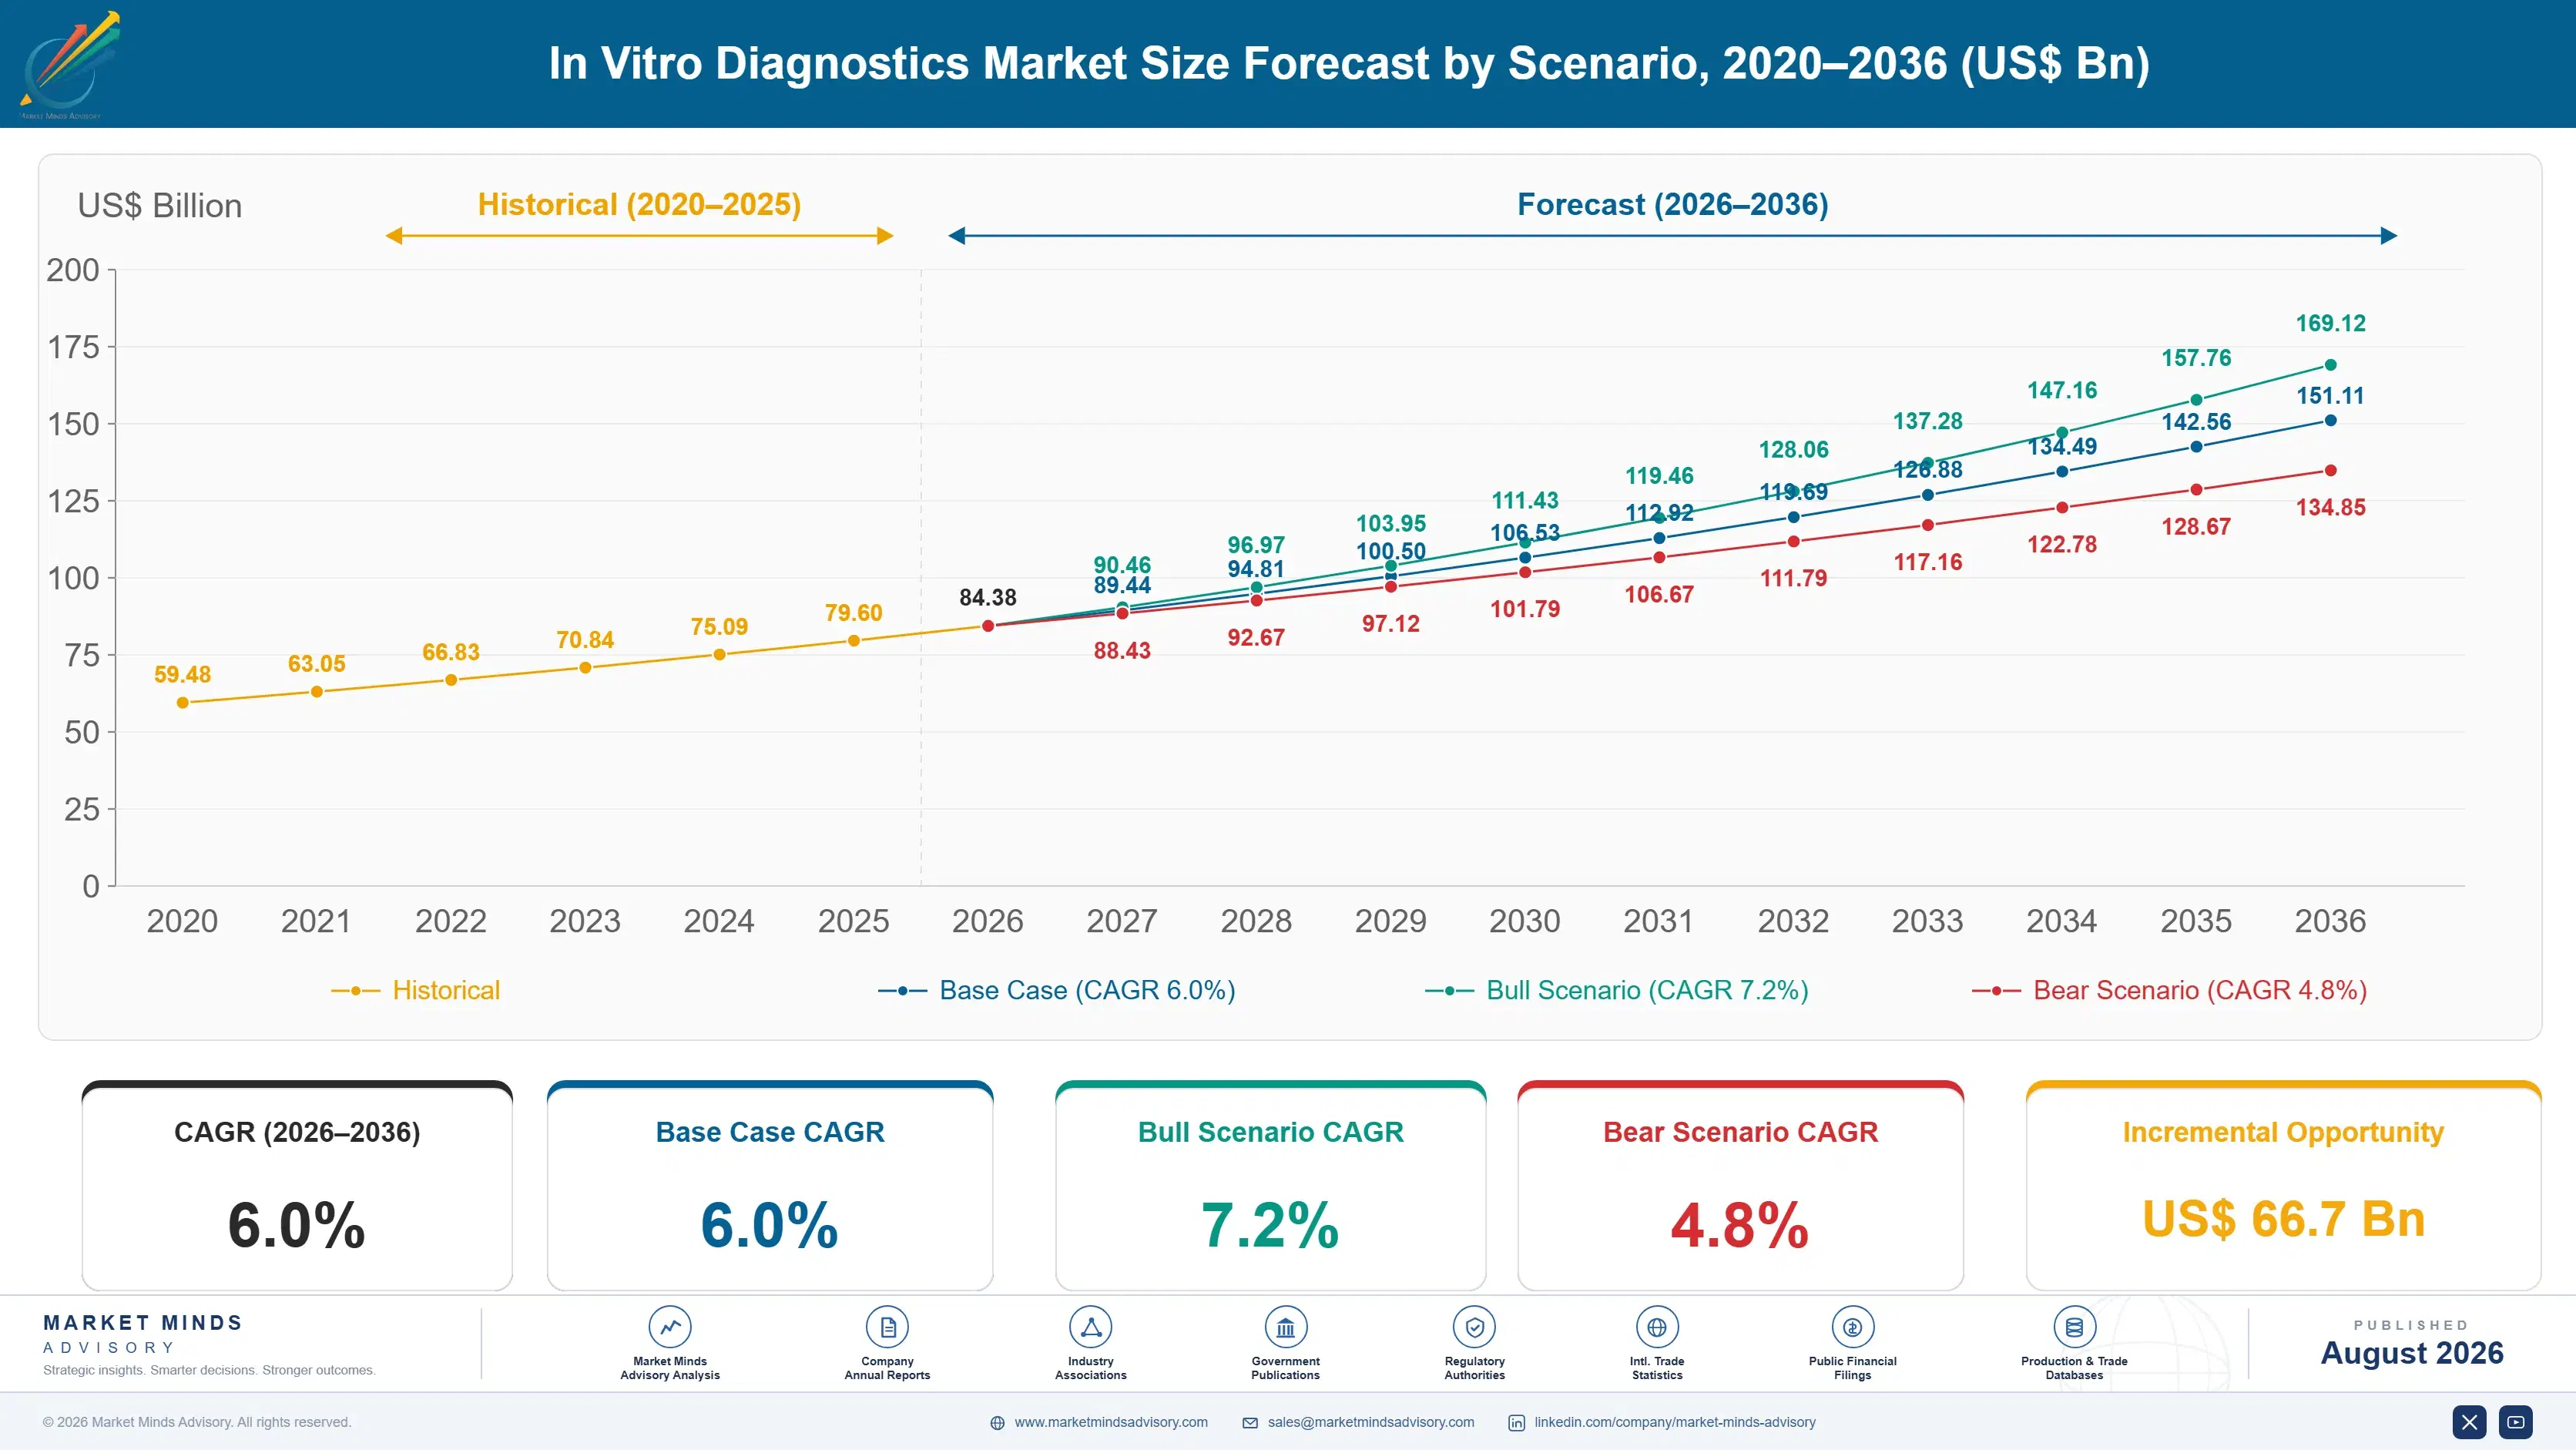
In Vitro Diagnostics Market Forecast Scenarios

in-vitro-diagnostics-market-size-forecast-scenario-1787324606111
The 2020 to 2025 period distorted almost every number in this market. Pandemic testing lifted revenue enormously through 2021, then collapsed as those volumes disappeared, leaving reported growth near 4.9% across the window and hiding the underlying trend entirely. Routine testing recovered to pre-pandemic patterns by 2023. What genuinely changed was decentralisation: point-of-care testing gained acceptance among clinicians and patients that a decade of marketing had not achieved.
Three mechanisms carry the base case to 6.0%. First, the placed analyser base, which converts instrument placements into eight to ten years of locked reagent revenue and makes volume unusually predictable. Second, chronic disease monitoring, where diabetes, cardiac, and renal panels generate repeat testing that grows with prevalence rather than with policy. Third, decentralisation toward point-of-care formats, which adds testing occasions in pharmacies and clinics that central laboratories never captured at all.
The bull case at 7.2% assumes point-of-care testing wins reimbursement parity with central laboratory equivalents, which would remove the main barrier to decentralised volume. The bear case at 4.8% assumes reimbursement schedules keep cutting per-test payment while laboratory consolidation strengthens buyer power, squeezing reagent pricing faster than volume growth can offset it across mature markets.

The Analyser Placement Is The Whole Negotiation

Demand rests on three foundations. The placed analyser base provides the annuity, since reagents run only on the instrument they were validated for and switching means revalidating every assay on the menu. Chronic disease prevalence provides the volume growth, with diabetes, cardiac, and renal panels repeating on schedules set by clinical guidelines. And decentralisation provides the newest source of growth, adding testing occasions outside the laboratory entirely.
MARKET CONCENTRATIONCR5: 58%Unusually concentrated for a medical device category of this breadth
ANALYSER SERVICE LIFE8 to 10 yearsPlacement period across which reagent revenue is effectively locked
REAGENT REVENUE SHAREAbout 76%Consumables against instruments in typical diagnostics manufacturer revenue
CENTRAL LABORATORY SHAREAbout 71%Test volume run in centralised laboratories rather than decentralised settings
REIMBURSEMENT TRENDMinus 2% annuallyTypical direction of per-test payment across developed health systems
INSTRUMENT GROSS MARGINAbout 22%Analyser hardware margin against the reagents that run on it
Commercially, this market runs on two numbers that move in opposite directions. Reagent revenue is roughly 76% of manufacturer sales and carries the margin, while instrument hardware near 22% gross margin is closer to a placement cost than a product. Against that, reimbursement per test falls around 2% annually across developed health systems, so manufacturers must grow volume simply to hold revenue flat.
The decade ahead turns on where testing physically happens. Central laboratories still run about 71% of volume and buy on cost per reportable result, which favours the largest analyser platforms and the deepest assay menus. Point-of-care testing grows at 10.2% and competes on time to result instead. Reimbursement will decide how far that shift actually goes, since payers have been slow to pay laboratory rates for decentralised tests.
"The instrument is not the product and never was. Diagnostics companies give away analysers the way printer companies gave away printers, and every commercial argument in this industry is really an argument about who controls the next placement cycle."
Director, Diagnostics and Laboratory Medicine Practice · MMA Medical Devices / L

Market Trends

Testing Moves Out Of The Central Laboratory

Point-of-care and near-patient testing grows at 10.2% while the market grows at 6.0%, driven by clinicians who want a result during the consultation rather than two days afterwards. Pharmacy testing, urgent care, and physician office laboratories have all expanded their menus considerably beyond glucose and pregnancy testing into cardiac markers, inflammation, and infectious disease panels. Regulatory waivers that allow testing outside accredited laboratories are the practical gatekeeper. Reimbursement remains the constraint, since payers frequently pay less for a decentralised test than the identical central laboratory equivalent. Volume is real; payment parity is not yet.
Market Impact: Placements lock 8 to 10 years
Laboratory Consolidation Strengthens Buyer Power Considerably

Hospital networks and reference laboratory groups have consolidated purchasing into fewer, larger contracts, which changes the negotiation entirely. A network buying for forty sites evaluates cost per reportable result across an entire menu rather than list price per test, and it can credibly threaten to move the whole analyser fleet at contract renewal. That favours manufacturers with the broadest assay menus and the deepest service networks, and it squeezes specialist suppliers with narrow portfolios out of consideration before pricing is even discussed. Narrow portfolios rarely reach the shortlist at all now.
Market Impact: HbA1c repeats 4 times yearly

Market Opportunities and Growth Drivers

Placed Analysers Lock Reagent Revenue For Years

An analyser placed in a laboratory runs for eight to ten years, and the reagents that run on it are validated for that platform alone. Switching supplier means revalidating every assay on the menu, retraining staff, and accepting a period of dual running that no laboratory director wants to explain. Reagents account for roughly 76% of manufacturer revenue against instrument hardware at far lower margin. That arrangement makes diagnostics revenue unusually predictable, and it makes every placement decision worth fighting for. Placement rather than price is therefore the real competitive event in this market.
Market Impact: Payment falls 2% each year

Chronic Disease Testing Repeats On Clinical Schedules

Diabetes, cardiac, renal, and thyroid monitoring generate repeat testing at intervals set by clinical guidelines rather than by patient choice or health system budgets. A diagnosed diabetic patient runs an HbA1c panel several times annually for life, which produces volume that compounds with prevalence and with diagnosis rates together. Ageing populations across developed markets add to it steadily. This is the most reliable volume in diagnostics, and it is why the category holds up through health system funding cycles that cut elsewhere. Diagnosis rates keep improving, which adds patients to those schedules.
Market Impact: Regulation covers 80% of assays

Market Restraints and Challenges

Reimbursement Schedules Only Ever Move Downward

Per-test payment falls roughly 2% annually across developed health systems, and no diagnostics manufacturer has found a way to reverse that direction. The root cause is that payers treat established assays as commodities once multiple suppliers offer them, and clinical laboratory fee schedules are periodically reset against reported market rates that reflect the last round of discounting. Commercially this compresses reagent pricing every year. Manufacturers mitigate through menu expansion into assays still under patent, automation that cuts laboratory labour cost, and pushing volume growth harder than price erosion. None of that reverses the direction of travel.
Market Impact: Point-of-care grows at 10.2%

Regulatory Requalification Costs Have Risen Sharply

The European IVD Regulation reclassified most assays into higher risk categories requiring notified body assessment, where the previous directive allowed self-certification for the large majority. The root cause is a deliberate tightening after diagnostic performance failures, combined with notified body capacity that has never matched submission volume. Commercially this has cost manufacturers heavily and pushed several to withdraw low-volume assays entirely rather than fund the dossiers. Participants mitigate through phased transition provisions, portfolio rationalisation, and prioritising submissions by revenue rather than by clinical breadth. Notified body queues remain the binding practical constraint.
Market Impact: Networks contract across 40 sites
3 additional market trends, 4 additional growth drivers, and 2 additional restraints and challenges are covered in the full report. Contact sales@marketmindsadvisory.com to access the complete intelligence.

Segment CAGR and Growth Architecture

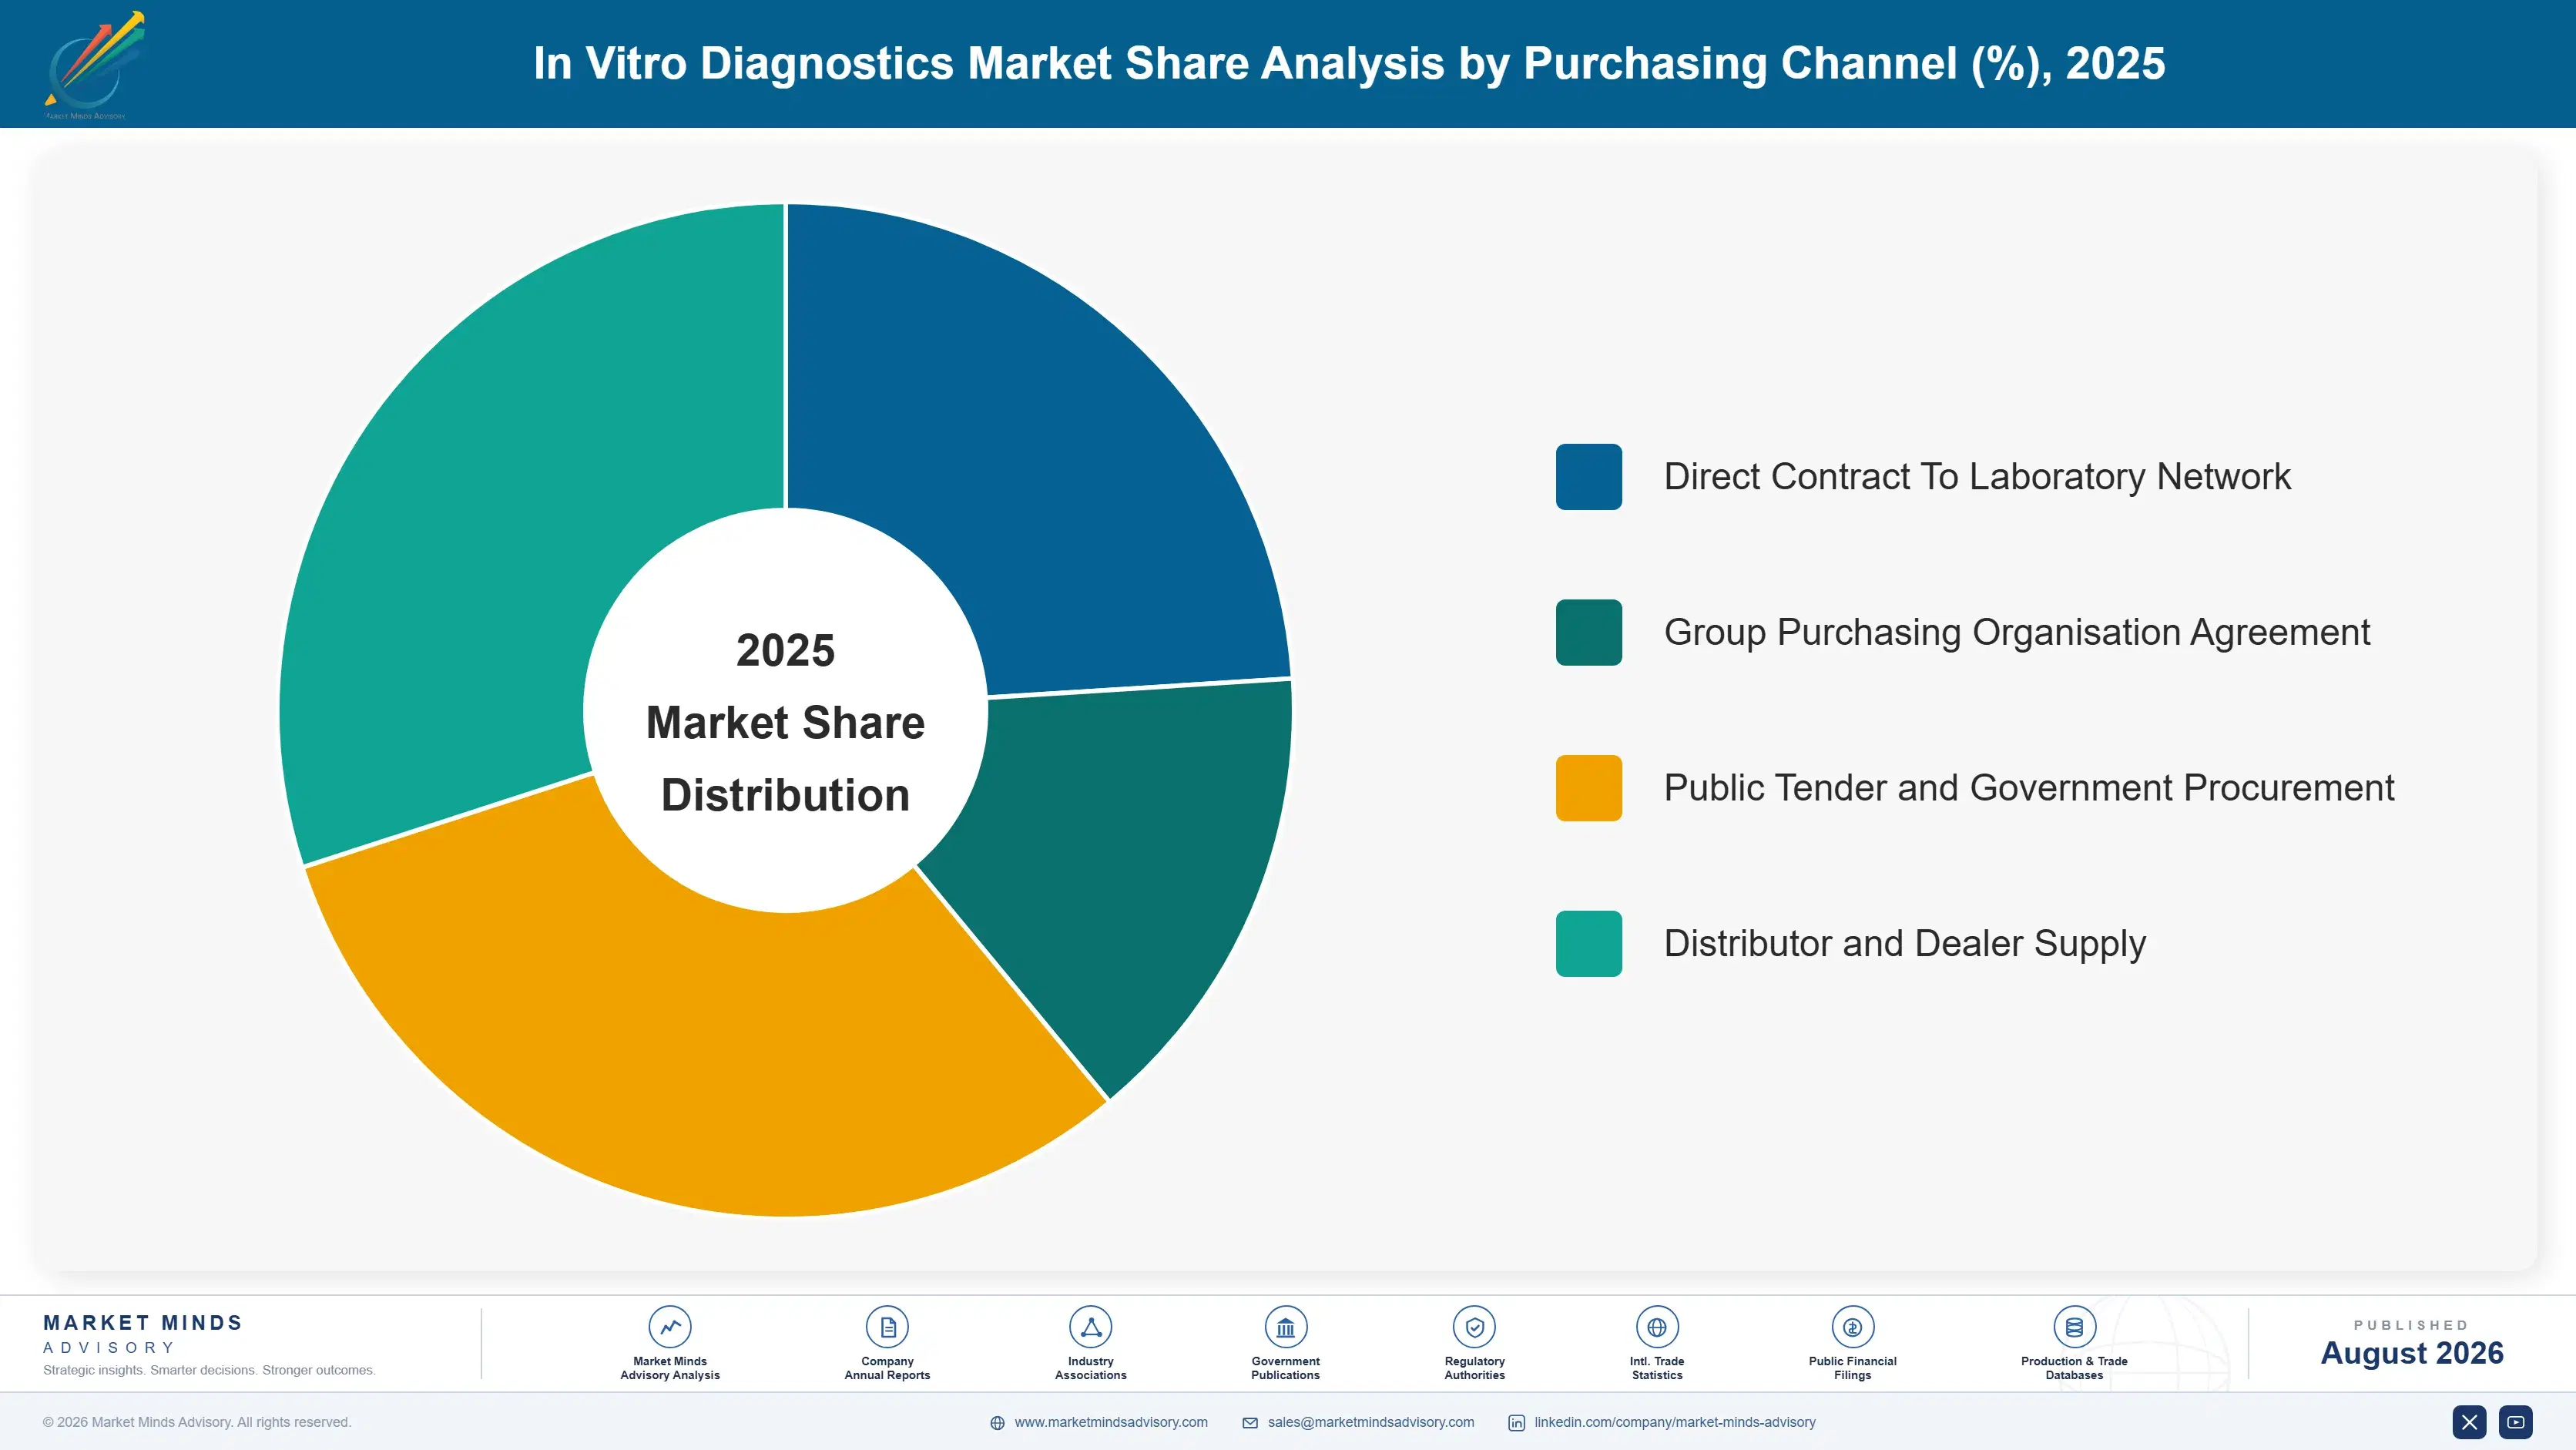
Segmentation follows test technology, a single classification describing the analytical method used to produce the result. Each technology carries its own instrument platform, reagent chemistry, regulatory pathway, and competitive field, so commercial position tracks the method rather than the disease tested for. End-use setting and purchasing channel appear separately within the framework as their own distinct dimensions.
in-vitro-diagnostics-market-market-share-analysis-1787324606645

Point-of-Care and Near-Patient Testing

Point-of-care and near-patient testing grows fastest at 10.2%, about 1.70 times the overall 6.0% rate, and clinical workflow rather than technology explains most of it. A result available during the consultation changes what the clinician can do, where the same result two days later usually changes nothing. Menus have widened well beyond glucose and pregnancy into cardiac markers, inflammation, and infectious disease panels suitable for pharmacy and urgent care settings. Regulatory waivers permitting operation by non-laboratory staff are the practical gatekeeper on every new assay. Reimbursement remains the binding constraint, since payers commonly pay less for decentralised testing than for the identical central laboratory result. Menu additions arrive one waiver at a time.
CAGR 10.2%

Immunoassay

Immunoassay grows at 6.4%, the second-fastest technology and the largest by revenue, covering hormone, cardiac marker, infectious disease serology, tumour marker, and therapeutic drug testing. Growth comes from menu expansion rather than from volume in established assays, since high-sensitivity troponin, procalcitonin, and newer tumour markers command pricing that mature tests lost years ago. The analysers are large, expensive, and typically integrated with clinical chemistry on a single track system, which makes placement decisions particularly consequential for the supplier. Concentration here is higher than anywhere else in diagnostics, because assay menu breadth and automation depth together exclude smaller competitors from serious consideration in large laboratory networks. Placement decisions here typically govern a decade of reagent revenue.
CAGR 6.4%
Full segment breakdown across 5 segments available in the complete report.

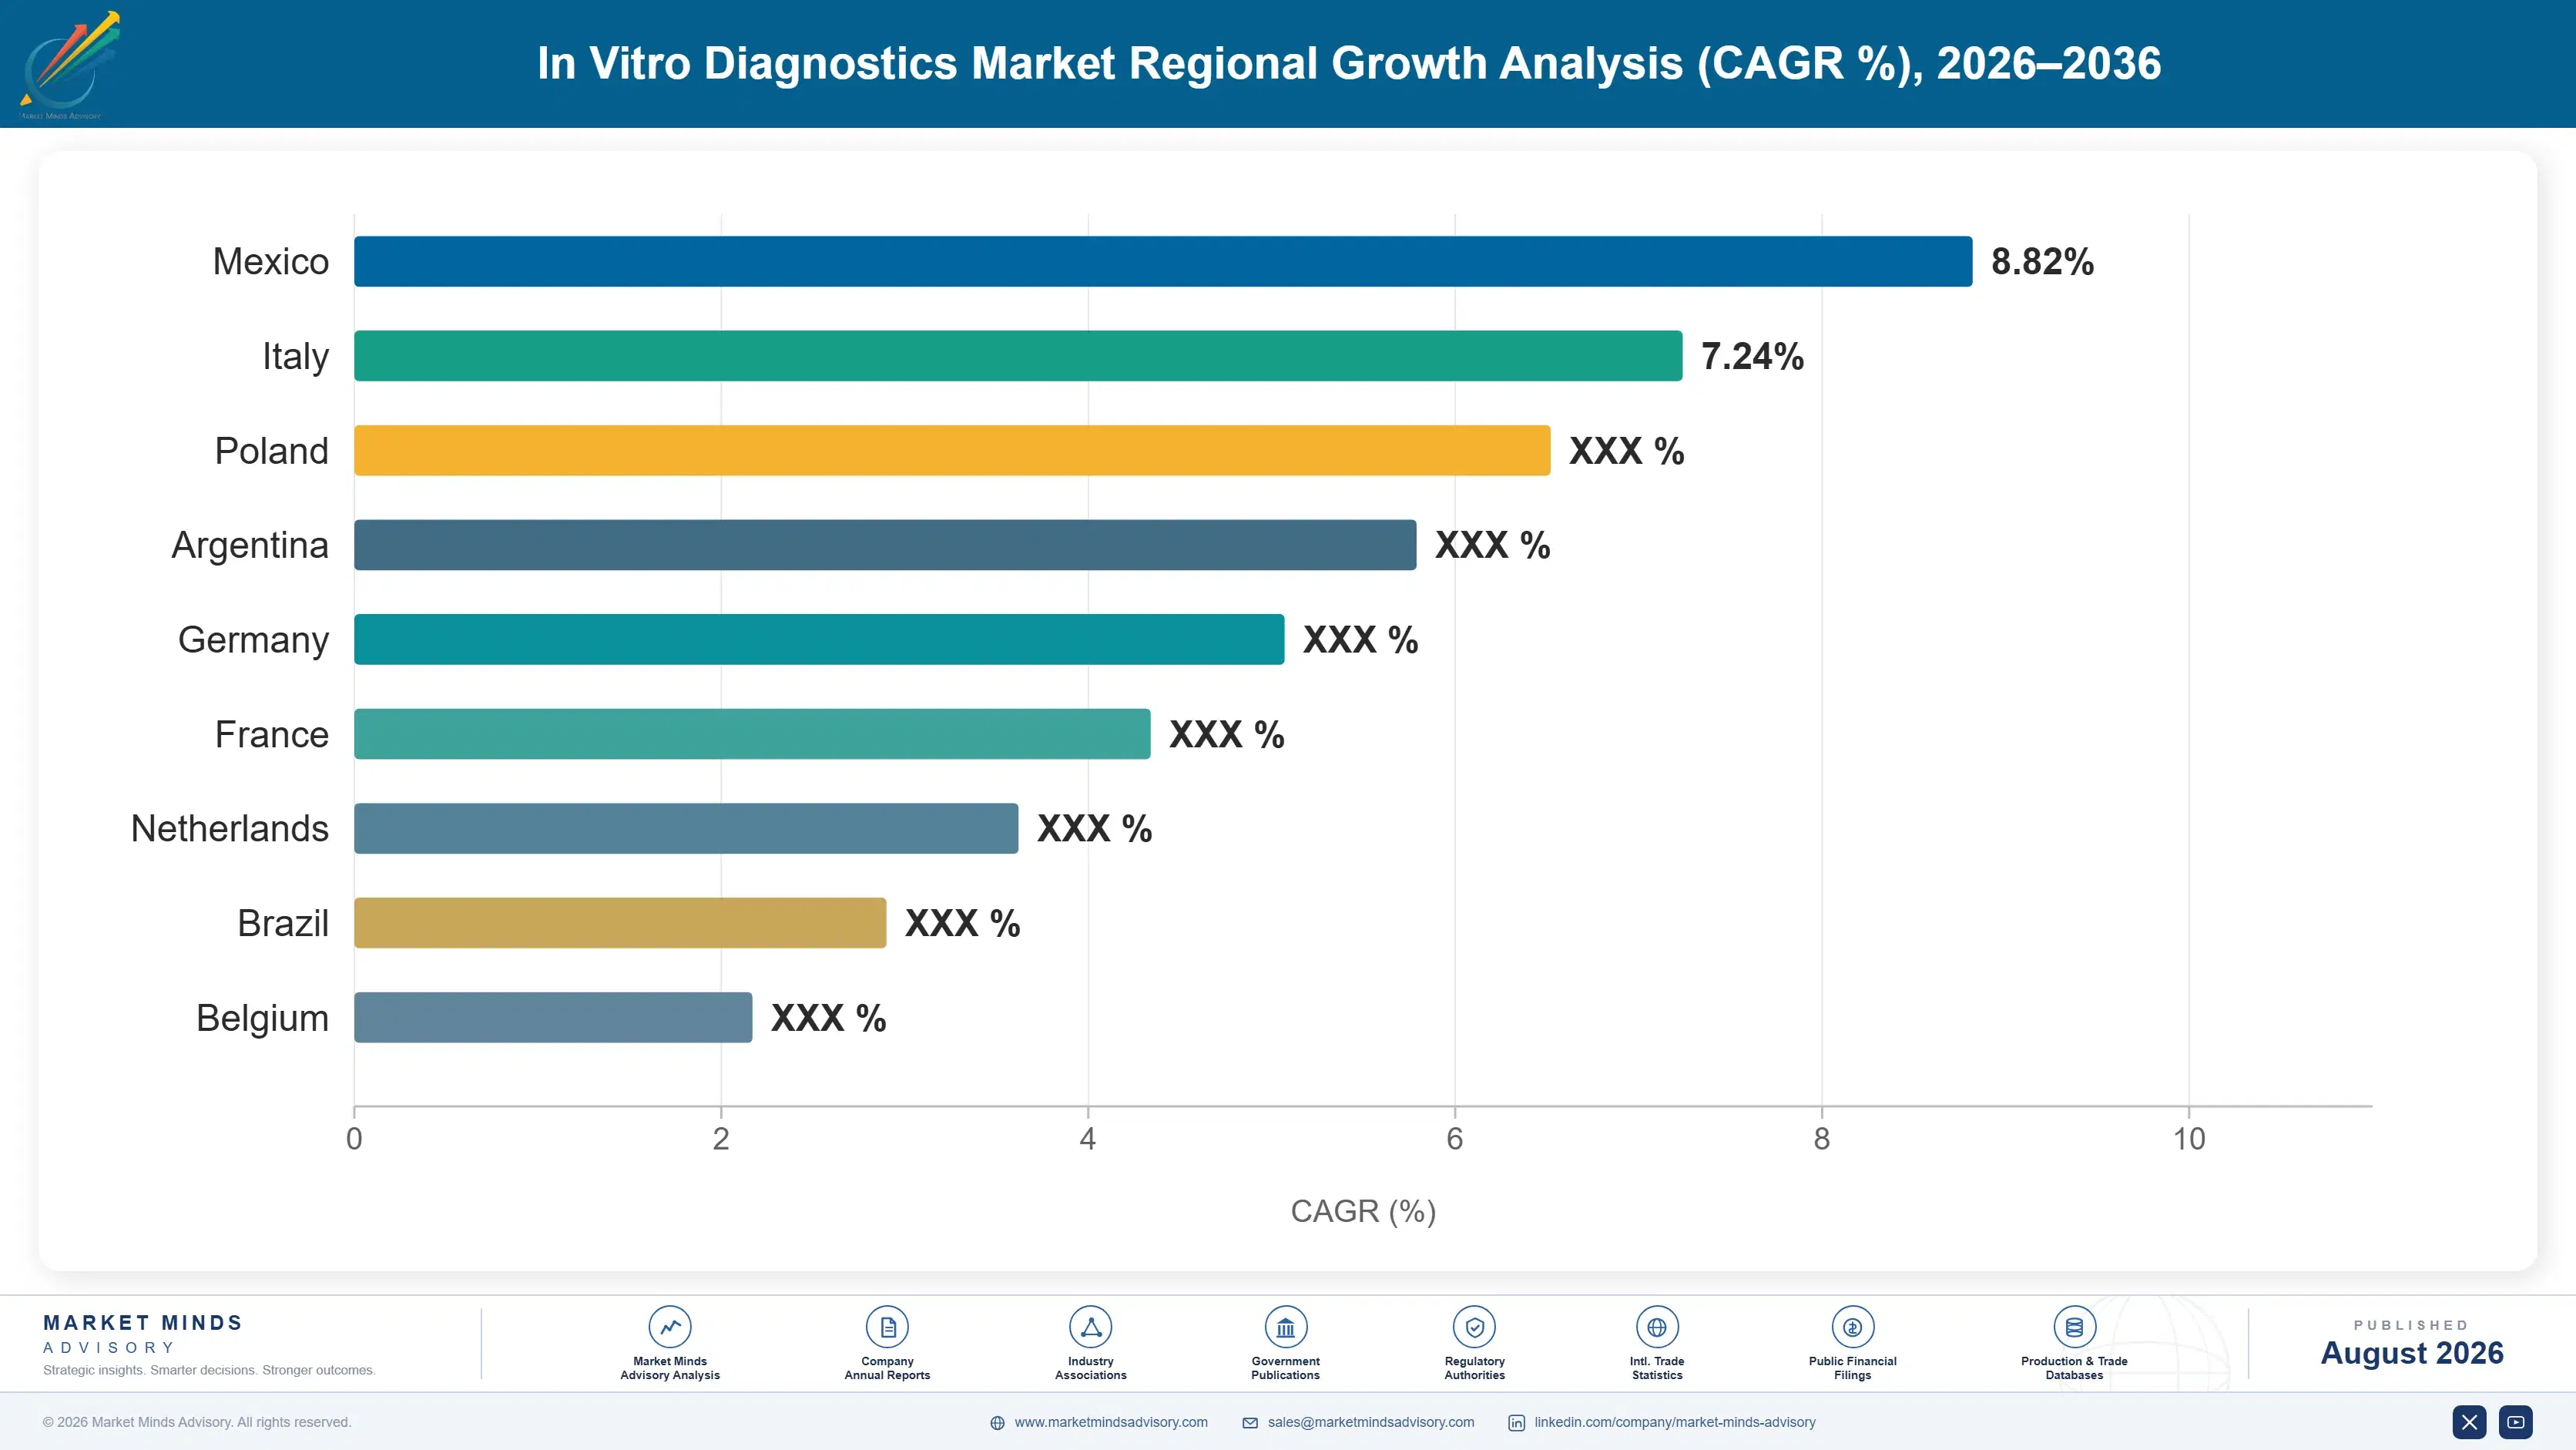
Regional Architecture and Country Demand Map

Health system funding and testing intensity together set this distribution, with reimbursement levels mattering more than population size. North America leads on test volume and payment rates, while South Asia and Pacific grows quickest as diagnostic access expands from a low base. Concentration follows payment, not population.

North America

North America holds 30% of value, and reimbursement rather than population explains the gap between its share and its share of tests. Per-test payment sits well above other regions even after successive fee schedule cuts, and testing intensity per patient is higher than anywhere. Reference laboratory groups and integrated hospital networks buy through consolidated contracts covering dozens of sites, which gives them genuine pricing leverage against suppliers. Regulatory waivers permitting testing outside accredited laboratories have expanded point-of-care menus faster here than in Europe. Growth of 5.4% reflects strong volume against fee schedule pressure that keeps removing part of it every year. Consolidated contracting has also made fleet renewal the only serious opening for a competing supplier.
Share: 30% | CAGR: 5.4% (2026 to 2036)

Western Europe

Regulation has reshaped this market more than demand has. Western Europe holds 24% of value, with the IVD Regulation reclassifying most assays into categories requiring notified body assessment and pushing several manufacturers to withdraw low-volume tests rather than fund the dossiers. Germany, France, and the UK together account for most regional volume, each with its own reimbursement mechanism and tendering practice. Laboratory consolidation is advanced, particularly in Germany and the Netherlands where large private networks dominate routine testing. Growth of 4.5% is the slowest of the seven regions, reflecting flat testing volumes, tight health budgets, and genuine regulatory cost. Notified body queues remain the practical constraint on returning withdrawn assays to the market.
Share: 24% | CAGR: 4.5% (2026 to 2036)
Regional intelligence for 5 additional markets available in the complete report: East Asia, South Asia and Pacific, Latin America, Middle East and Africa, Eastern Europe. Contact sales@marketmindsadvisory.com.
in-vitro-diagnostics-market-country-cagr-analysis-1787324607158

Where Diagnostics Margin Is Actually Defended

Reimbursement falls about 2% a year and no supplier has reversed it, so margin is defended through placement, menu, and workflow rather than price. The four moves below concentrate on the levers manufacturers still control: winning the analyser cycle, widening the menu, selling cost per result, and reaching decentralised settings before reimbursement settles. Price is not among them.

Win The Placement Cycle Before Renewal Opens

An analyser placement locks eight to ten years of reagent revenue, and reagents are roughly 76% of manufacturer sales, which makes the placement decision worth more than any pricing concession made to secure it. Laboratory networks review fleets at contract renewal, and that window is the only moment a competitor can realistically enter. Suppliers who begin the commercial conversation twelve to eighteen months ahead of renewal shape the specification. Those who arrive at tender respond to somebody else's requirements. Fleet renewal comes around perhaps twice a decade, so a missed window costs years rather than quarters.
Market Impact: Every placement locks 8 to 10 years

Widen The Menu Rather Than Cut The Price

Laboratory networks evaluate cost per reportable result across an entire menu, not list price per assay, so a supplier covering more of the menu wins on arithmetic that never appears in a price comparison. Menu breadth also excludes narrow specialists before pricing is discussed at all. With per-test payment falling around 2% annually, adding assays still under patent protection is the only reliable route to holding blended reagent margin as established tests commoditise. Blended margin holds only where part of the menu is still protected, which makes development priority a pricing decision as much as a clinical one.
Market Impact: Menu breadth offsets the 2% annual

Sell Automation Against Laboratory Labour Cost

Laboratory staffing shortages are severe across developed health systems, and labour typically exceeds reagent spend in a routine laboratory's operating cost. Track automation, auto-verification, and consolidated immunoassay and chemistry platforms cut hands-on time per result substantially, which is an argument health system finance directors act on where a reagent discount of 3% or 4% does not. It also raises switching cost further, since the automation is configured around the installed analyser fleet and cannot follow a competitor's instrument. A laboratory saving 4,000 hands-on hours a year is solving a staffing problem no reagent discount touches.
Market Impact: Laboratory labour exceeds reagent s

Reach Decentralised Settings Before Reimbursement Settles

Point-of-care testing grows at 10.2% against a market at 6.0%, and pharmacy chains, urgent care groups, and physician office networks are choosing platforms now while payers are still deciding what to pay for decentralised results. Those placements will prove as sticky as laboratory analysers once menus are validated and staff are trained. Waiting for reimbursement parity means arriving after the installed base is set, which is the same mistake several suppliers made in central laboratories. Once a pharmacy chain validates a menu across 900 sites, the platform is settled for years.
Market Impact: Decentralised testing grows at 10.2

Who Controls the Margin Pool

Concentration is high for a medical device category: the top five hold roughly 58% of reagent and instrument revenue. The gap between leaders and challengers is menu breadth and automation depth rather than assay quality, which is comparable across established suppliers. All participants here are assessed on one basis, revenue from in vitro diagnostic reagents, instruments, and consumables, excluding molecular diagnostics, laboratory services, and information systems.
Competition runs along four dimensions. First, installed analyser base, since every placement removes a laboratory from contention for most of a decade. Second, assay menu breadth, which decides whether a supplier is evaluated at all by consolidated networks. Third, automation and workflow, sold against laboratory labour cost rather than reagent price. Fourth, service network density, because analyser downtime stops a laboratory entirely.

Pressure is building from two directions. Chinese volume-based procurement has cut reagent prices on established assays and let domestic manufacturers take hospital share from multinationals on cost and service response. Decentralisation is opening placements in pharmacies and clinics where the incumbency that protects central laboratory positions does not apply. Rankings should favour suppliers with wide menus and credible point-of-care platforms over those defending central laboratory installed bases alone.
in-vitro-diagnostics-market-company-positioning-matrix-1787324607684

Competitive Moat and Risk Dimensions

ROCHE DIAGNOSTICS

Moat: Menu breadth and integrated automation

Roche offers one of the widest assay menus in diagnostics across immunoassay and clinical chemistry, integrated onto track automation that consolidated laboratory networks specify directly. That combination decides cost per reportable result, which is the metric large buyers actually contract on. Its installed analyser base across major reference and hospital laboratories renews on cycles measured in years rather than quarters.
ROCHE DIAGNOSTICS

Risk: Fee schedules and procurement reform

Revenue is weighted toward developed markets where per-test reimbursement falls roughly 2% annually with no realistic prospect of reversal. Chinese volume-based procurement has cut reagent pricing sharply on established assays where domestic manufacturers now compete credibly on cost and service. The central laboratory strength that protects the core also offers little advantage in decentralised settings that are growing considerably faster.
ABBOTT

Moat: Point-of-care position and reach

Abbott holds a strong position in point-of-care and near-patient testing alongside a full central laboratory portfolio, which covers the fastest-growing part of diagnostics and the largest simultaneously. Its rapid testing platforms are established in pharmacy, urgent care, and physician office settings that laboratory-focused suppliers reach poorly. Emerging market distribution reach is genuinely broader than most competitors hold.
ABBOTT

Risk: Post-pandemic comparison and pricing

Rapid testing revenue peaked during the pandemic and normalised sharply afterwards, which makes underlying growth harder to demonstrate against inflated comparators. Point-of-care reimbursement remains below central laboratory rates for identical results in many health systems, capping realisable pricing. Central laboratory competition against deeper automation portfolios also constrains where the core analyser platforms can win placements.

Players Tracked

Prominent Players

Roche Diagnostics
Abbott
Siemens Healthineers
Danaher
Sysmex

Other Key Players

bioMerieux
Becton Dickinson
Thermo Fisher Scientific
Ortho Clinical Diagnostics
Bio-Rad Laboratories
Mindray Medical
DiaSorin
Werfen
Randox Laboratories
Fujifilm Wako
Nova Biomedical
Trinity Biotech
Quidel
Snibe Diagnostics
Autobio Diagnostics

Recent Developments

JANUARY 2025

European IVD Regulation transition deadlines advance further

Further transition provisions under the IVD Regulation took effect, extending timelines for higher risk classes while notified body capacity remained well short of submission volume. This was European regulation reaching its next phase rather than any commercial transaction, and it kept requalification cost at the centre of portfolio decisions.
Signal: Assay withdrawals decided on European econ
OCTOBER 2024

Chinese volume-based procurement extends to further assay groups

Provincial procurement programmes in China widened centralised tendering to additional immunoassay and chemistry test groups, cutting reagent prices materially on established assays. This was government procurement reform rather than a corporate event, and it strengthened domestic manufacturers competing on cost against multinational suppliers. Multinational pricing came under immediate pressure.
Signal: Procurement reform converts established as
MAY 2024

Pharmacy testing menus widen under expanded regulatory waivers

Additional assays received waivers permitting operation by non-laboratory staff across several markets, extending pharmacy and urgent care testing beyond glucose and pregnancy into cardiac and inflammation markers. These were regulatory clearances rather than transactions, and they expanded the settings where decentralised platforms can be placed.
Signal: Each waiver opens placement opportunities

Antibodies, Enzymes, Plastics, Instrument Electronics

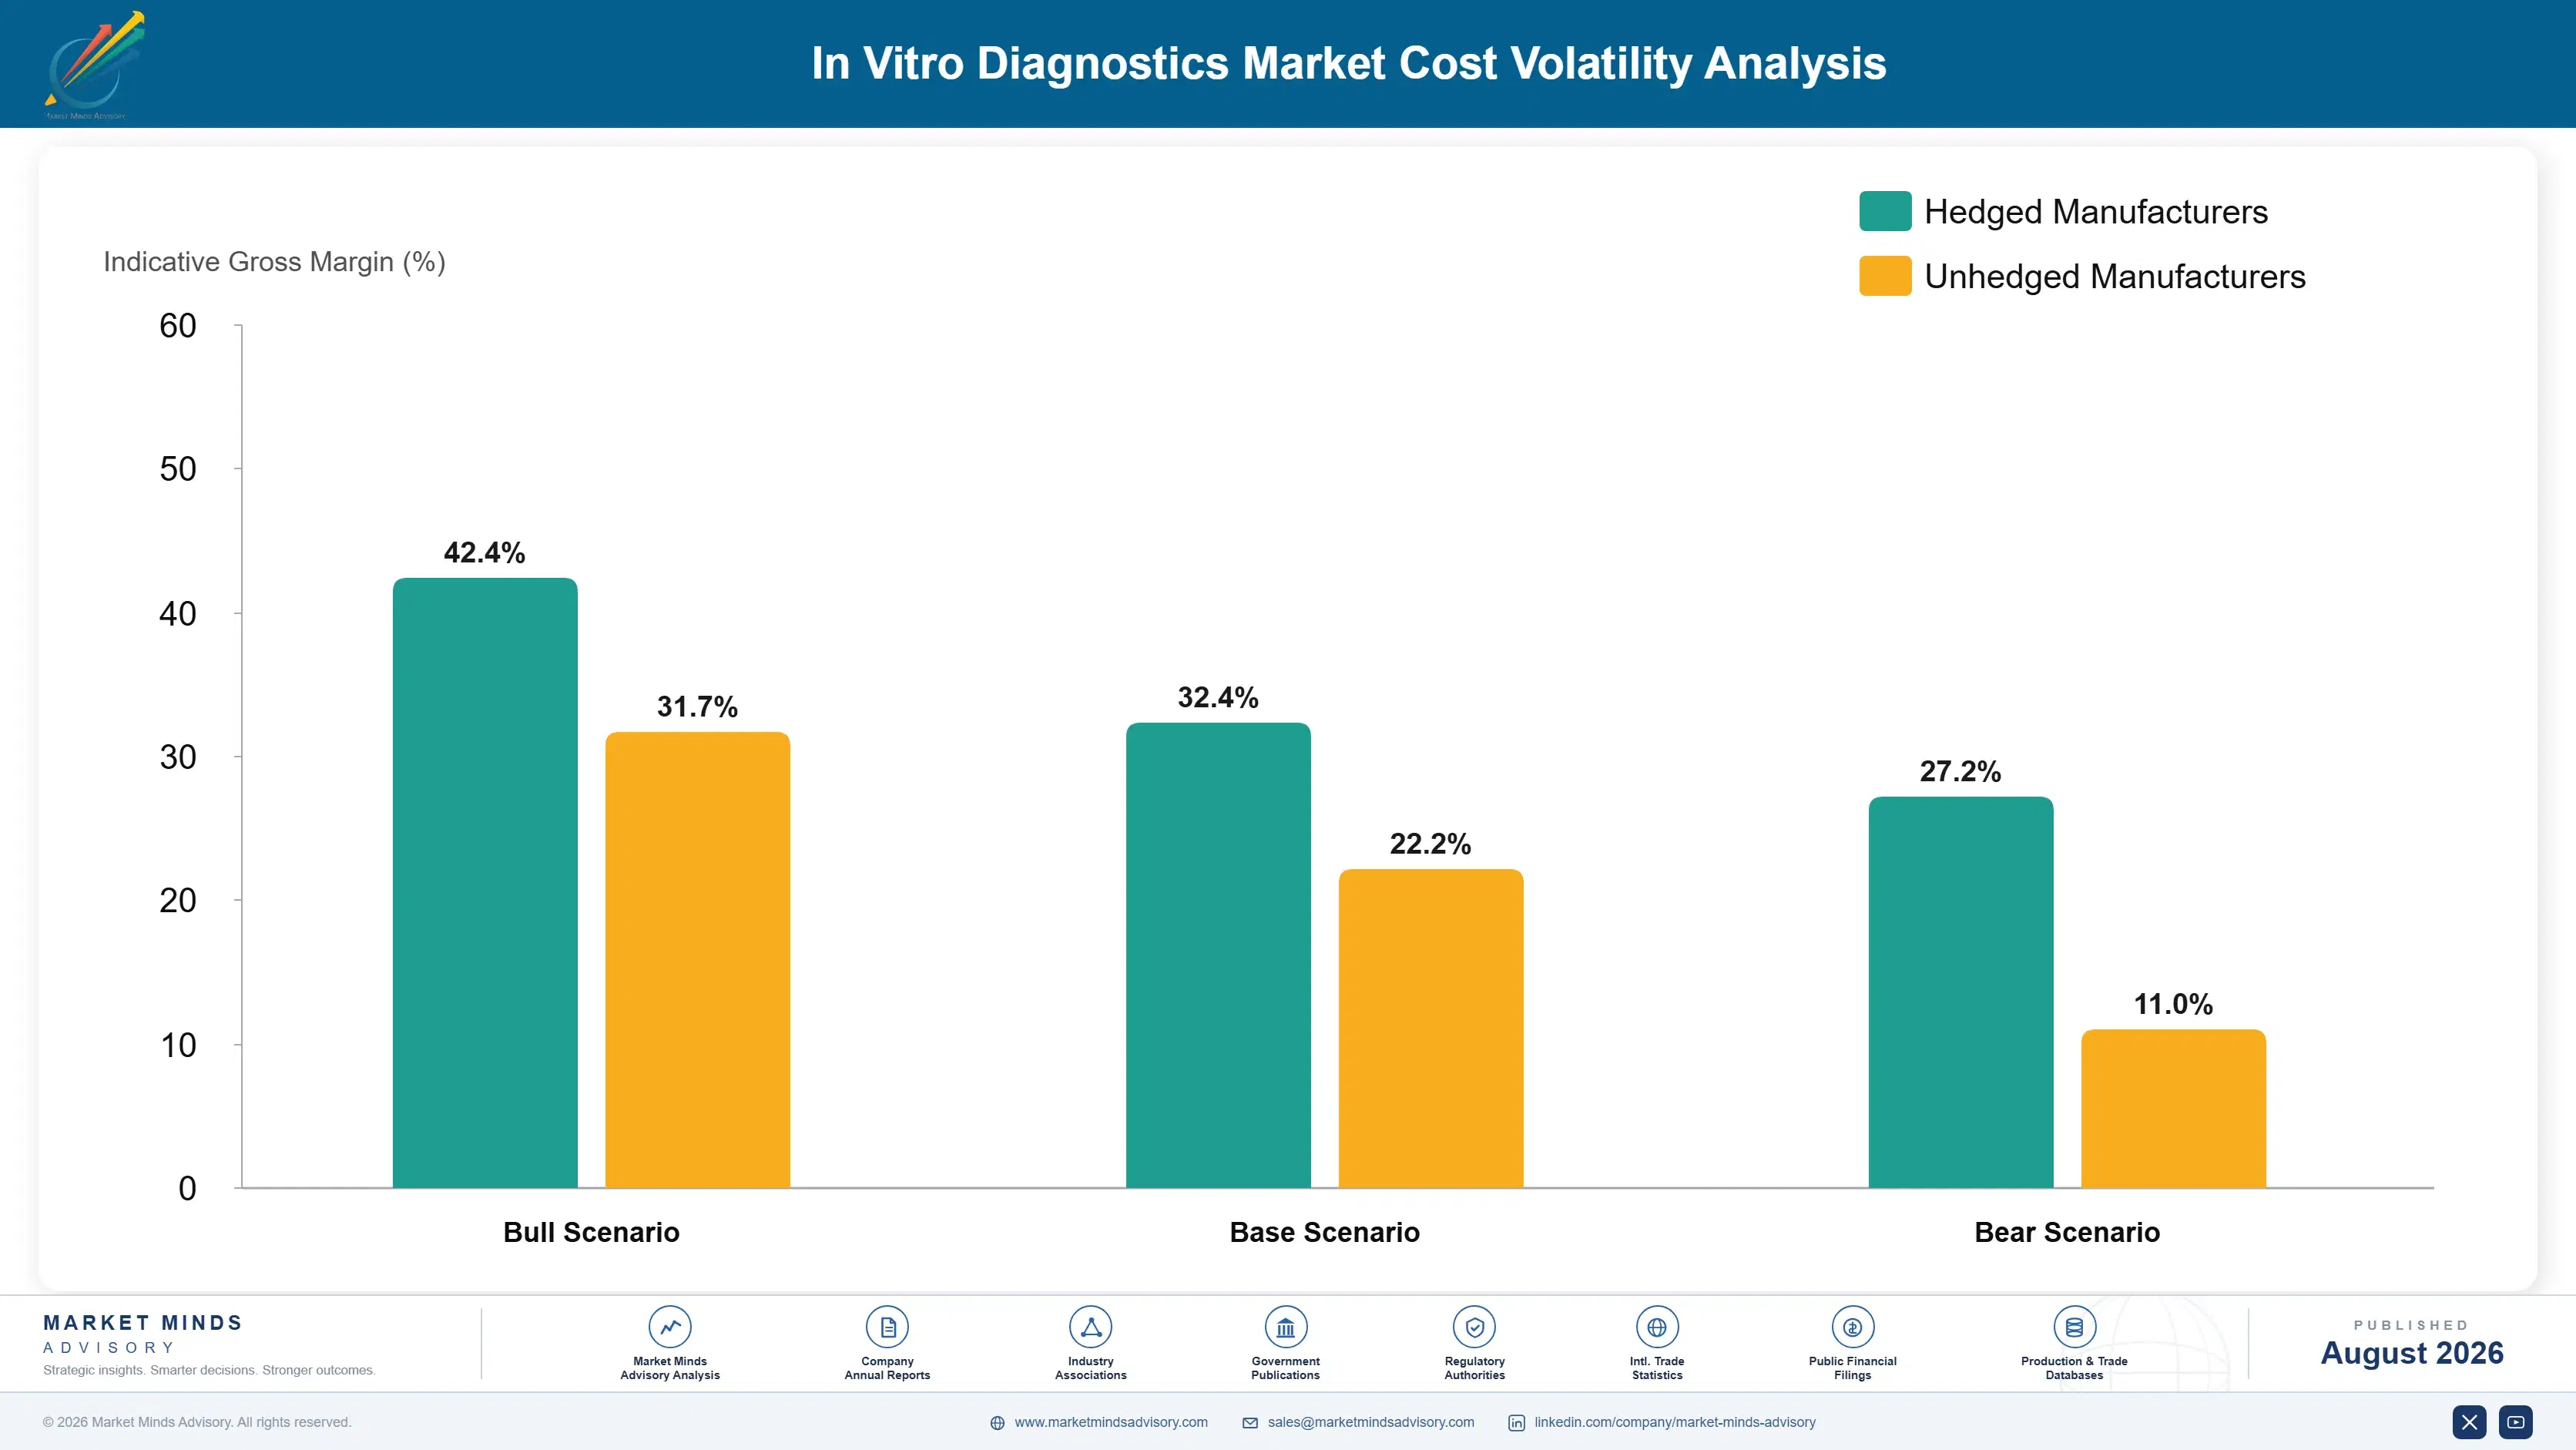
Biological raw materials dominate reagent cost in a way that surprises people who assume chemistry. Antibodies, enzymes, and recombinant proteins account for roughly 34% of reagent cost, sourced from a narrow set of specialists with long qualification cycles. Moulded plastic consumables add 14% to 20%, cold chain logistics 7% to 11%, and instrument electronics and optics take 40% to 55% of analyser build cost.
The 2021 to 2022 semiconductor shortage hit analyser production hard, with lead times on controller boards and optical components extending by months and forcing suppliers to ration placements. Siemens Healthineers and Danaher both disclosed supply constraints across that period, and delayed placements deferred reagent revenue that only begins once an instrument is installed. Cold chain freight costs rose sharply over the same window, compounding reagent delivery economics.

Exposure separates by manufacturing integration, not by size. A supplier producing its own antibodies and critical enzymes controls both cost and continuity, while one buying them qualified from a single specialist carries that supplier's pricing and outage risk with no alternative inside a year. Geography compounds it, since cold chain reliability into emerging markets varies enough that reagent stability specification, not price, decides which products can be sold there.
in-vitro-diagnostics-market-cost-volatility-analysis-1787324607881

Qualify second sources for every critical biological input

Antibody and enzyme qualification takes many months and often requires assay revalidation, which means a single-sourced critical input is an unmanaged risk rather than a procurement choice. Qualifying an alternative costs testing time once and creates continuity permanently. Regulators increasingly expect documented supply continuity planning in technical files, so the compliance case now supports the commercial one directly.

Integrate production of high-value biological materials

Antibodies, enzymes, and recombinant proteins are roughly a third of reagent cost and the element least substitutable at short notice. Producing critical materials internally converts a supplier's pricing decision into an internal cost, and it removes outage exposure that no contract term genuinely covers. The capital requirements are considerable, so this suits high-volume assays rather than long-tail menu items.

Reformulate assays toward ambient-stable reagent chemistry

Cold chain adds 7% to 11% of reagent cost and limits which markets a product can reach reliably at all. Lyophilised and ambient-stable formulations cut shipping cost, reduce wastage from excursions, and open emerging market distribution that refrigerated products serve poorly. Reformulation requires stability studies and regulatory variation filings, so it pays back on assays with genuine emerging market volume.

Portfolio Architecture for Margin Defence

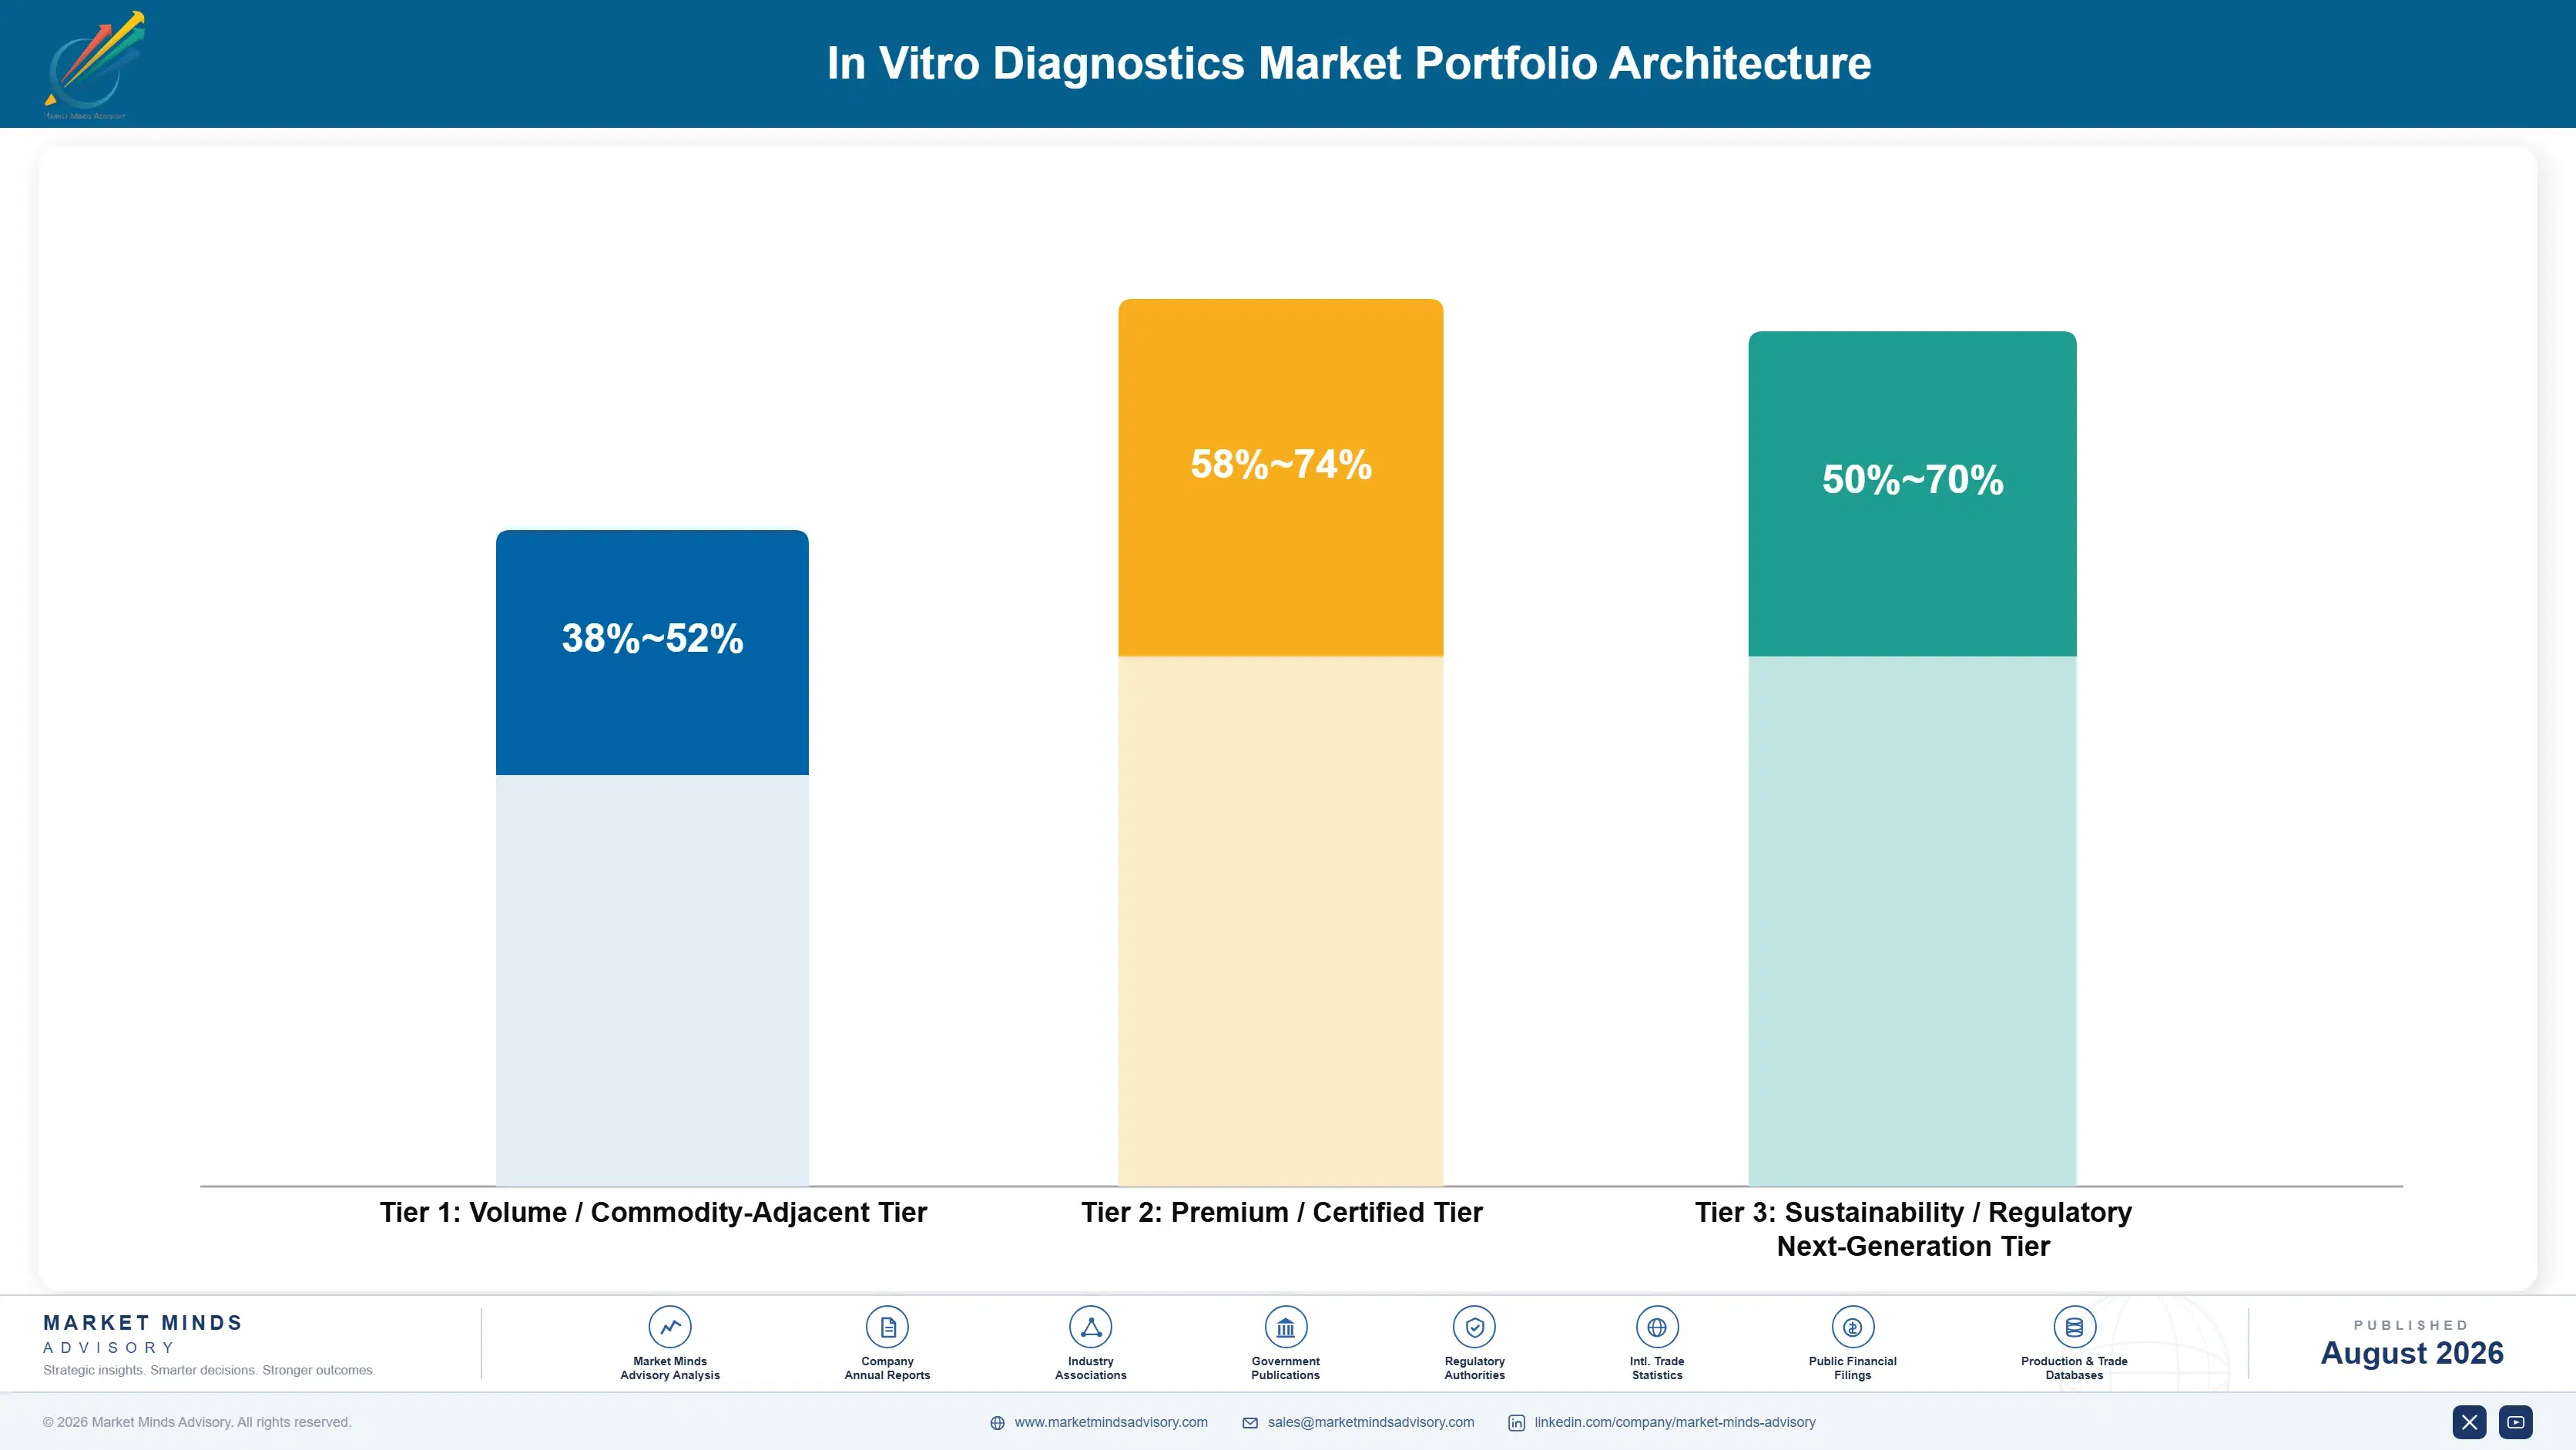
The portfolio splits into three tiers with different economics. Established high-volume assays including basic chemistry and routine haematology form the volume tier, where many suppliers offer equivalent tests and fee schedules have extracted most of the available margin. Specialist immunoassays and regulated panels earn more because menu position and clinical validation limit the field. Point-of-care platforms and newly cleared assays price against clinical utility rather than a competing reag
The tension runs between volume assays filling the analyser and specialist tests earning the return. Routine chemistry and haematology justify the placement, generate the throughput that makes automation worthwhile, and hold the relationship through which everything else sells. Yet they compete against every equivalent reagent under annually falling fee schedules. Suppliers handling this well secure placement with volume assays while directing development toward specialist menu and decentralised platforms.

High-value pools concentrate where clinical validation or platform position limits competition: specialist immunoassays under patent protection, assays with guideline-mandated clinical use, point-of-care tests carrying non-laboratory operation waivers, and automation configured around an installed fleet. All four escape direct reagent price comparison. Basic clinical chemistry sits at the other end, where a dozen suppliers offer equivalent tests and the fee schedule sets the ceiling.

Volume / Commodity-Adjacent Tier

Basic clinical chemistry, routine haematology, and established serology sold under fee schedules that fall annually. The range is wide because manufacturing scale and biological input integration separate suppliers considerably at equivalent selling prices.
Gross Margin: 38-52%

Premium / Certified Tier

Specialist immunoassays, cardiac and tumour markers, and regulated panels carrying clinical validation and guideline position. The range is wide because patent protection on newer assays supports pricing that off-patent equivalents in the same tier have already lost.
Gross Margin: 58-74%

Sustainability / Regulatory / Next-Generation Tier

Point-of-care platforms with non-laboratory operation waivers, decentralised menus, and newly cleared assays. The range is wide because reimbursement for decentralised testing varies enormously between health systems and unrecovered platform cost differs by supplier.
Gross Margin: 50-70%
in-vitro-diagnostics-market-portfolio-architecture-1787324608379

High-value Sub-segments and Strategic Watch-out

Point-of-Care and Near-Patient Testing

High value and high growth at 10.2%, the fastest technology, driven by clinicians wanting results during the consultation. Reimbursement below central laboratory rates for identical results is the binding constraint, and regulatory waivers gate every menu addition. Menus have already widened well beyond glucose and pregnancy testing.
Gross Margin: 50-70%

Immunoassay

High value with solid growth at 6.4%, the largest technology by revenue, expanding through newer cardiac, inflammation, and tumour markers rather than through established assays. Menu breadth and automation depth together decide which suppliers get evaluated at all. Automation depth now matters as much as assay performance does.
Gross Margin: 58-74%

Clinical Chemistry

The volume core, growing at 4.6% and squeezed between falling fee schedules and equivalent reagents from many suppliers. Steady in test volume and essential for justifying the analyser placement, but the ceiling on pricing resets downward every year. It still justifies the placement that everything else depends on.
Gross Margin: 38-52%

Microbiology and Culture-Based Testing

The strategic watch-out, growing at 5.2% on antimicrobial resistance surveillance and automation of a workflow that stayed manual far longer than others. Molecular alternatives outside this scope keep taking identification volume from culture-based methods steadily. Antibiotic susceptibility testing remains the most defensible part of the segment.
Gross Margin: 44-60%

How Laboratory Contracts Actually Hold

Demand commits at analyser placement and repeats as reagent orders for the life of the instrument. A validated menu running on an installed platform represents years of method verification, staff competency records, and accreditation documentation no laboratory director will repeat without cause. Switching means revalidating everything and running two systems through the transition. That protects incumbents strongly, and the only genuine competitive moments are placement decisions at fleet renew
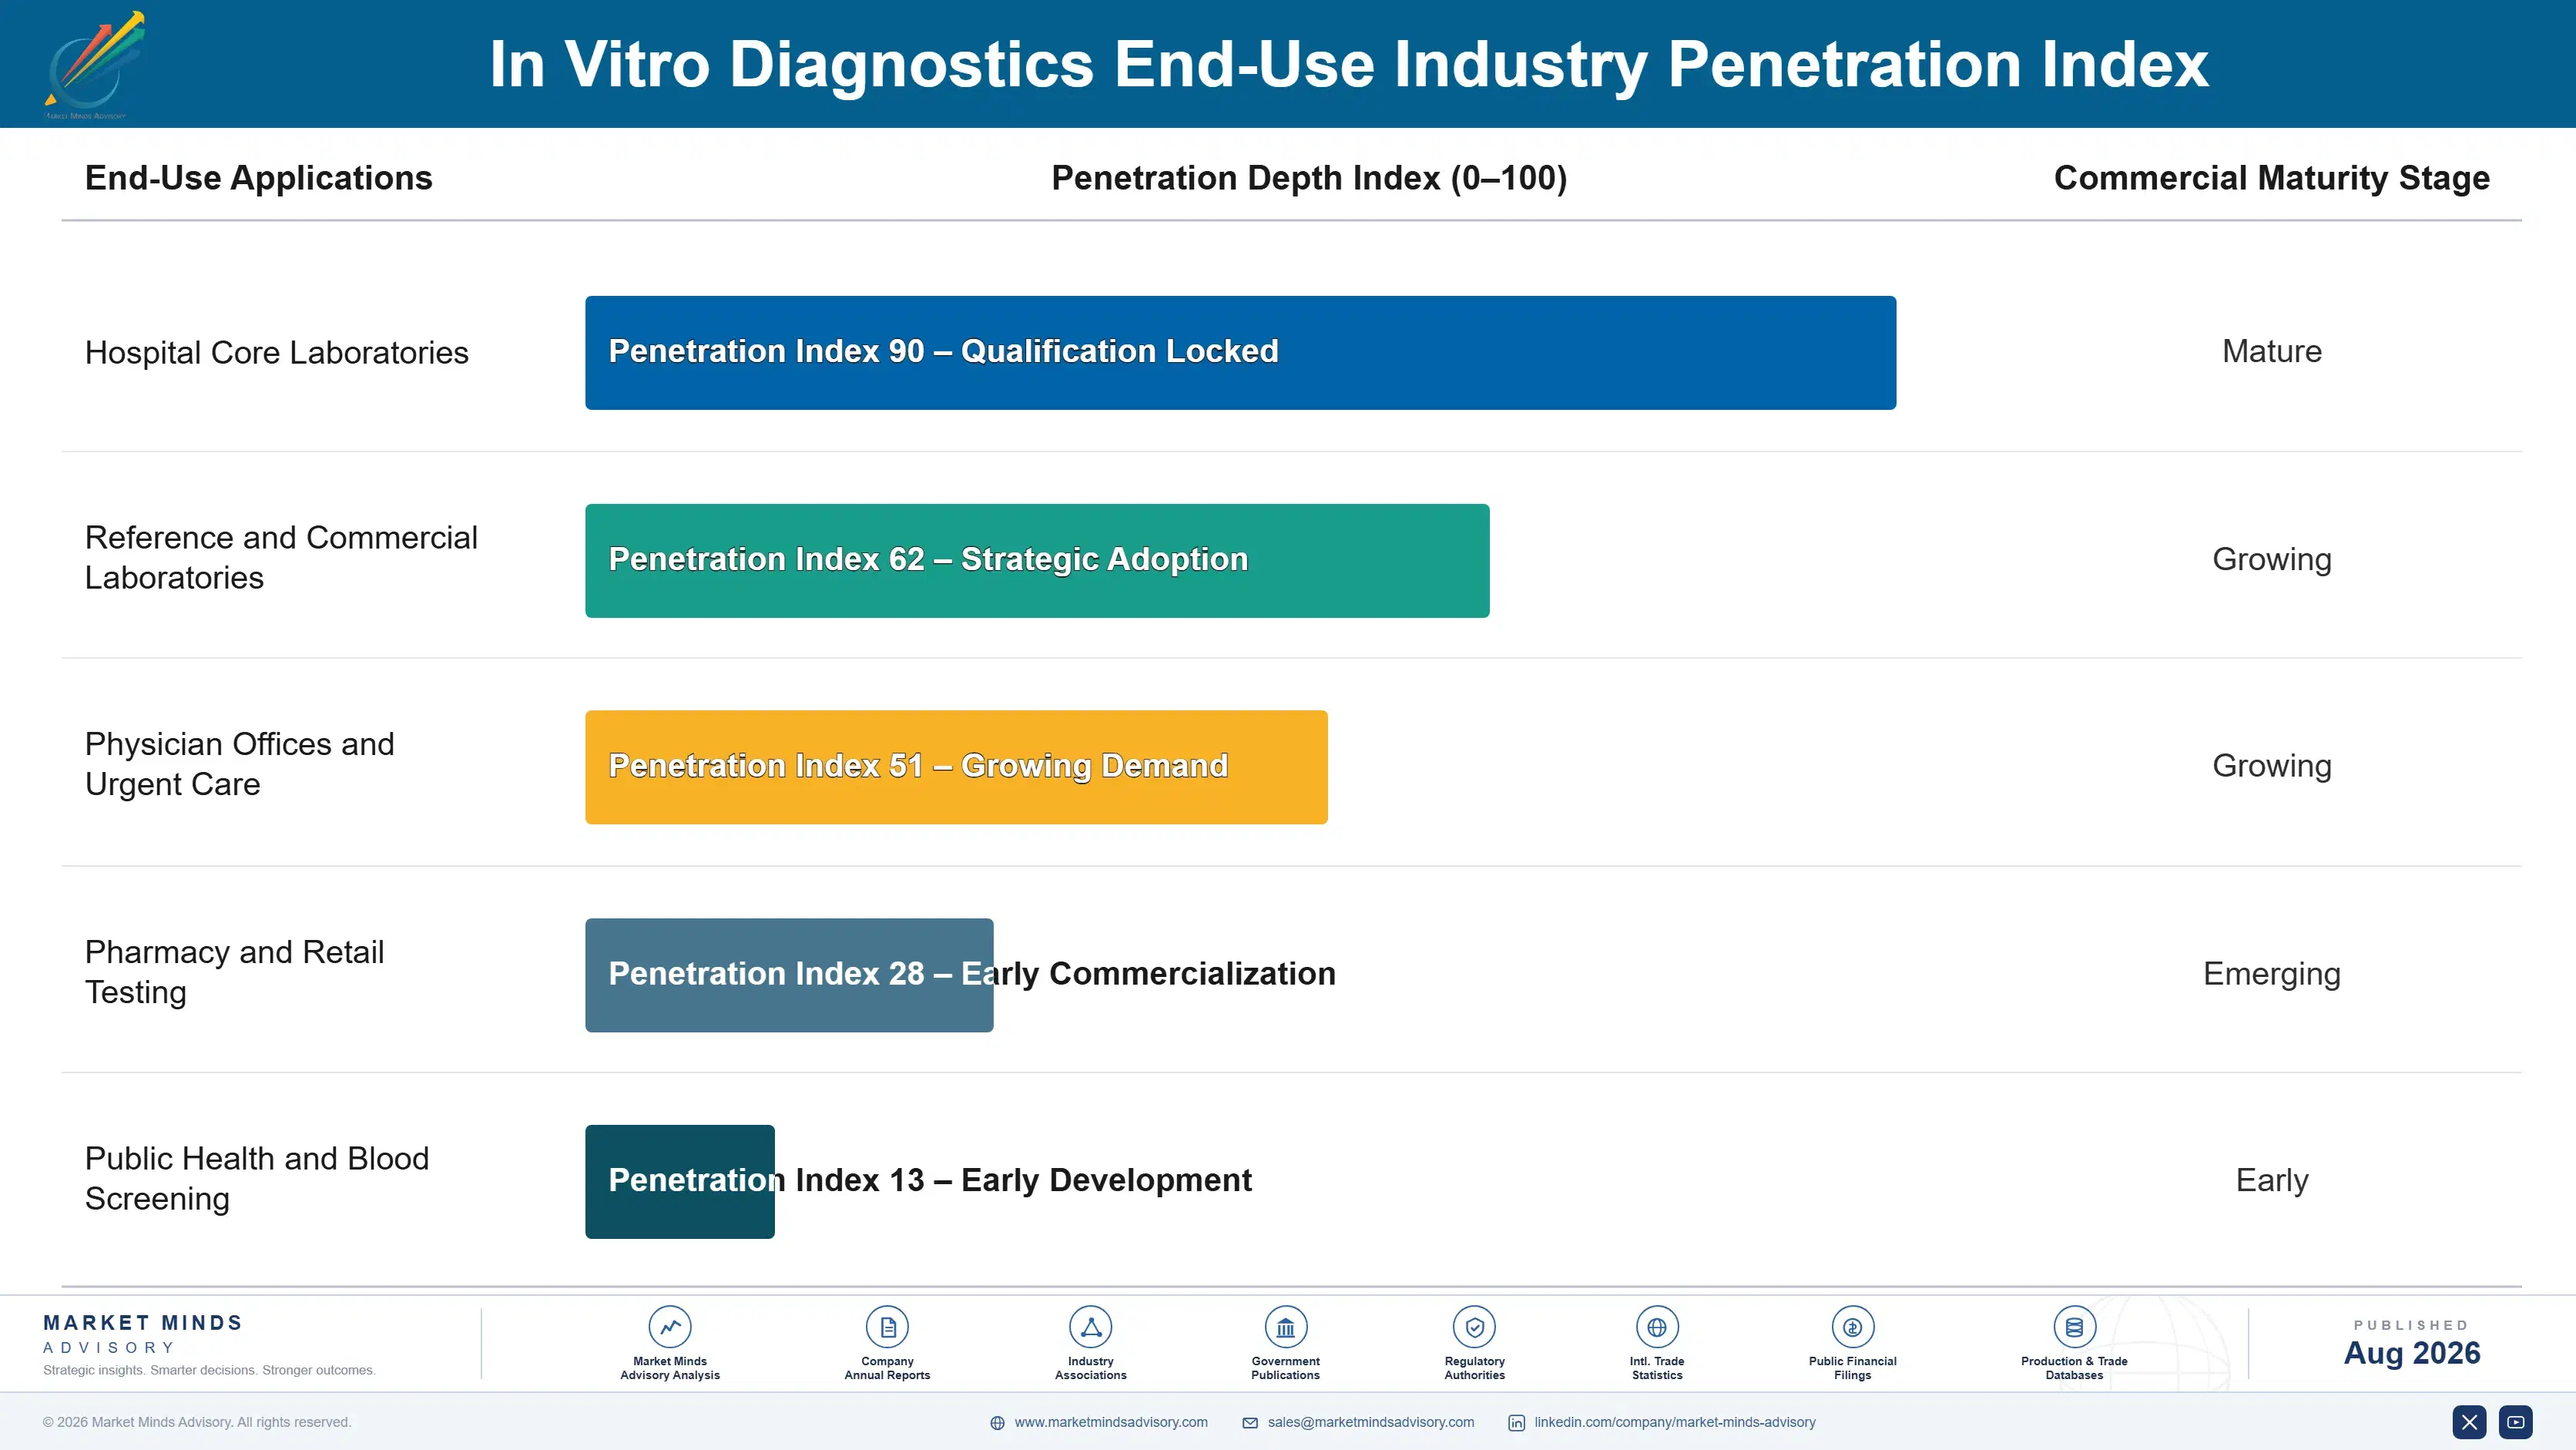
Stickiness varies by testing setting and accreditation depth. Hospital core laboratories stick hardest, because accreditation ties methods to documented performance records. Reference laboratory networks stick nearly as firmly but review whole fleets at renewal, which creates real openings. Physician office and pharmacy testing sticks least, since menus are narrower and validation burden is far lighter, which is why decentralised placements are contested so hard now.

Buyer profiles have shifted from laboratory directors specifying on analytical performance toward procurement teams and health system finance leaders evaluating cost per reportable result. That change rewarded menu breadth and automation over assay quality, since analytical performance is comparable across established suppliers. Laboratory staffing shortages have added a further buyer, with operations leadership weighing hands-on time per result as heavily as reagent price.
in-vitro-diagnostics-market-end-use-penetration-index-1787324608867

Our Call On In Vitro Diagnostics

These are among the four positions where our research anticipates prominent divergence between winners and laggards over the coming forecast period. Each is grounded in the demand model, the regulatory perimeter, and the announced capacity pipeline.
01 / PLACEMENT BEATS PRICING

The analyser decision is worth every concession made

An analyser placement locks eight to ten years of reagent revenue, and reagents are roughly 76% of manufacturer sales, so the placement is worth far more than any discount used to secure it. Fleet renewal, which comes around perhaps twice a decade, is the only moment a competitor can realistically enter an established laboratory. Suppliers who open the conversation twelve to eighteen months ahead of renewal shape the specification, while those arriving at tender simply respond to requirements that somebody else has already written.
02 / MENU BEATS DISCOUNT

Networks buy cost per result, not test price

Consolidated laboratory networks evaluate cost per reportable result across an entire menu rather than list price per assay, which means menu breadth wins contracts that no amount of reagent discounting can reach. Narrow specialists are excluded from the shortlist before pricing is discussed, regardless of how good the individual assay happens to be. With per-test payment falling roughly 2% annually across developed health systems, adding assays still under patent protection is the only dependable way to hold blended reagent margin as established tests commoditise steadily.
03 / DECENTRALISATION REOPENS PLACEMENTS

Pharmacy and clinic platforms are being chosen now

Point-of-care testing grows at 10.2% against a market at 6.0%, and pharmacy chains, urgent care groups, and physician office networks are selecting platforms while payers are still deciding what a decentralised result is worth. Those placements will prove as sticky as laboratory analysers once menus are validated and staff are trained on them. Waiting for reimbursement parity means arriving after the installed base has been set by someone else, which is precisely the mistake several suppliers made in central laboratories.
04 / REIMBURSEMENT NEVER REVERSES

Plan for annual erosion rather than price recovery

Per-test payment falls around 2% each year across developed health systems, and no diagnostics manufacturer has found a way to turn that direction around in three decades of sustained trying. Payers treat established assays as pure commodities the moment multiple suppliers offer them, and fee schedules reset periodically against whatever the last round of discounting produced. Growth planning that assumes any price stability will simply miss, so volume growth, menu expansion, and automation savings must carry the entire result on their own.

Engagement Snapshot From the Field

A live engagement with an industry participant carrying material or product regulatory and market exposure ahead of a defining policy shift, showing how our research translates into a defensible multi-year portfolio strategy.
MARKET MINDS ADVISORY · CLIENT ENGAGEMENT SUMMARY
In Vitro Diagnostics Producer Strategic Portfolio Review and Transition Roadmap 2026·Investment Scenario on In Vitro Diagnostics Exposure Evaluation 2025-26
CLIENT PROFILE
A regional hospital network operating laboratories across twenty-three sites engaged MMA ahead of a fleet renewal covering most of its analyser base. The client reported running four separate immunoassay and chemistry platforms inherited through hospital mergers, with reagent spend of about USD 41 million annually and no consolidated view of cost per reportable result (client-reported, unverified by MMA).
STRATEGIC CHALLENGE
Four platforms across twenty-three sites meant four reagent contracts, four service agreements, four sets of method validations, and no purchasing leverage on any of them. Suppliers had quoted consolidation proposals that all assumed their own platform. The board needed an independent view of what consolidation was actually worth before committing to an eight-year placement it could not reverse.
MMA APPROACH
MMA modelled cost per reportable result across the full menu for each platform option rather than comparing reagent list prices, which the internal analysis had done. We assessed hands-on time per result against the network's own staffing shortages. We then examined menu coverage gaps that would force send-out testing, since those costs sat outside every supplier proposal presented to the board.
KEY FINDINGS
  1. Reagent list price ranked the four platform options differently from cost per reportable result, because menu coverage gaps forced send-out testing that suppliers had excluded.
  2. Automation differences accounted for roughly 4,100 hours of annual hands-on time across the network, worth more than the reagent price gap between options (client-reported, unverified by MMA).
  3. Consolidating to two platforms rather than one preserved competitive tension at the next renewal while capturing most of the available purchasing leverage.
  4. Point-of-care placement at eleven smaller sites removed courier transport and turnaround delay that central consolidation would otherwise have made considerably worse for urgent clinical requests.
CLIENT PROFILE
A regional hospital network operating laboratories across twenty-three sites engaged MMA ahead of a fleet renewal covering most of its analyser base. The client reported running four separate immunoassay and chemistry platforms inherited through hospital mergers, with reagent spend of about USD 41 million annually and no consolidated view of cost per reportable result (client-reported, unverified by MMA).
STRATEGIC CHALLENGE
Four platforms across twenty-three sites meant four reagent contracts, four service agreements, four sets of method validations, and no purchasing leverage on any of them. Suppliers had quoted consolidation proposals that all assumed their own platform. The board needed an independent view of what consolidation was actually worth before committing to an eight-year placement it could not reverse.
MMA APPROACH
MMA modelled cost per reportable result across the full menu for each platform option rather than comparing reagent list prices, which the internal analysis had done. We assessed hands-on time per result against the network's own staffing shortages. We then examined menu coverage gaps that would force send-out testing, since those costs sat outside every supplier proposal presented to the board.
KEY FINDINGS
  1. Reagent list price ranked the four platform options differently from cost per reportable result, because menu coverage gaps forced send-out testing that suppliers had excluded.
  2. Automation differences accounted for roughly 4,100 hours of annual hands-on time across the network, worth more than the reagent price gap between options (client-reported, unverified by MMA).
  3. Consolidating to two platforms rather than one preserved competitive tension at the next renewal while capturing most of the available purchasing leverage.
  4. Point-of-care placement at eleven smaller sites removed courier transport and turnaround delay that central consolidation would otherwise have made considerably worse for urgent clinical requests.
RECOMMENDED STRATEGY
Phase 1: Phase 1 (0 to 6 months): Rebid on cost per reportable result across the full menu, including send-out testing that supplier proposals had excluded entirely. Phase 2: Phase 2 (6 to 18 months): Consolidate to two platforms rather than one, preserving competitive tension at the following renewal cycle. Phase 3: Phase 3 (18 to 30 months): Place point-of-care platforms at smaller sites where courier turnaround, not analytical capacity, was the real constraint.
OUTCOME
The network consolidated to two platforms and reported reagent spend roughly 12% below the prior arrangement, with hands-on laboratory time cut materially at the larger sites. Retaining two suppliers preserved negotiating position for the next renewal, and point-of-care placement at smaller sites cut turnaround time without adding courier cost (client-reported, unverified by MMA).

Frequently Asked Questions

Foundational context covering the market sizes, CAGR, scope, country, region and competition that inform every finding below. This section is provided to cover basics and most often pre-purchase conversations, answered from the MMA Primary Research Dataset.

What is the current size of the In Vitro Diagnostics Market?

The global in vitro diagnostics market is valued at USD 79.6 billion in 2025, covering immunoassay, clinical chemistry, haematology, microbiology, and non-molecular point-of-care testing. Molecular diagnostics is excluded as a separate market.

How large will the In Vitro Diagnostics Market be by 2036?

The market is forecast to reach USD 151.11 billion by 2036 in the base case, about 1.79 times the 2026 level. That represents incremental value of roughly USD 66.73 billion across the decade.

What is the CAGR for the In Vitro Diagnostics Market 2026 to 2036?

The market grows at a 6.0% CAGR in the base case, with bull and bear scenarios at 7.2% and 4.8%. The spread turns mainly on point-of-care reimbursement parity and the pace of fee schedule erosion.

Which segment is growing fastest?

Point-of-care and near-patient testing grows fastest at 10.2%, about 1.70 times the overall rate, as testing moves toward pharmacies and clinics. Immunoassay follows at 6.4% on menu expansion.

Who are the major companies in the In Vitro Diagnostics Market?

Leading suppliers include Roche Diagnostics, Abbott, Siemens Healthineers, Danaher, and Sysmex. Concentration is high for a medical device category, with the top five holding roughly 58% of reagent and instrument revenue.

Which country is growing fastest?

India grows fastest at a 10.8% CAGR, as private diagnostic chains expand collection networks and insurance coverage widens. China and Indonesia follow on hospital capacity and access expansion.

Report Segmentation Architecture

The full report scope spans multiple orthogonal segmentation dimensions, with cross-tabulated demand data provided for each dimension pair. Coverage extends further to regional breakdowns, trend trajectories, and the competitive detail needed to support segment-level decision-making.

By Test Technology

  • Immunoassay
  • Clinical Chemistry
  • Haematology and Coagulation
  • Microbiology and Culture-Based Testing
  • Point-of-Care and Near-Patient Testing

By End-Use Industry

  • Hospital Core Laboratories
  • Reference and Commercial Laboratories
  • Physician Offices and Urgent Care
  • Pharmacy and Retail Testing
  • Public Health and Blood Screening

By Purchasing Channel

  • Direct Contract To Laboratory Network
  • Group Purchasing Organisation Agreement
  • Public Tender and Government Procurement
  • Distributor and Dealer Supply

By Region

  • North America
  • Western Europe
  • East Asia
  • South Asia and Pacific
  • Latin America
  • Middle East and Africa
  • Eastern Europe

Scope, Methodology, and Coverage

Every figure in this report is reproducible from documented input assumptions. The scope below maps the historical period, the forecast horizon, the segmentation dimensions, and the countries covered, alongside the underlying primary and qualitative methodology.
Historical Period
2020 to 2025
Forecast Period
2026 to 2036
Base Year
2025 (USD billions; MMA Primary Research Dataset, August 2026)
Market Definition
The in vitro diagnostics market comprises the manufacture and sale of reagents, instruments, and consumables used to examine specimens taken from the human body, valued at manufacturer selling prices to laboratories, hospitals, distributors, and testing sites. It spans immunoassay, clinical chemistry, haematology and coagulation, microbiology and culture-based testing, and non-molecular point-of-care and near-patient testing, together with calibrators, controls, and the analyser platforms these assays run on. Molecular diagnostics based on nucleic acid amplification, hybridisation, or sequencing is excluded and treated as a separate market, as are laboratory information systems, anatomic pathology and histology services, clinical laboratory service revenue billed to payers, research-use-only reagents, and veterinary diagnostics.
Quantitative Units
USD billions (current prices); test volume in billions of reportable results where applicable
Segmentation Dimensions
By Test Technology; By End-Use Industry; By Purchasing Channel; By Region
Regions Covered
North America, Western Europe, East Asia, South Asia and Pacific, Latin America, Middle East and Africa, Eastern Europe
Countries Covered
USA, China, Germany, France, UK, Japan, South Korea, India, Australia, Canada, Brazil, Mexico, Indonesia, Vietnam, Thailand, Malaysia, UAE, Saudi Arabia, South Africa, Nigeria, Turkey, Poland, Netherlands, Italy, Spain, Sweden, Switzerland, Argentina, Colombia, Singapore, and additional markets relevant to this sector
Key Companies Profiled
Roche Diagnostics, Abbott, Siemens Healthineers, Danaher, Sysmex, bioMerieux, Becton Dickinson, Thermo Fisher Scientific, Ortho Clinical Diagnostics, Bio-Rad Laboratories, Mindray Medical, DiaSorin, Werfen, Randox Laboratories, Fujifilm Wako, Nova Biomedical, Trinity Biotech, Quidel, Snibe Diagnostics, Autobio Diagnostics
Quantitative Methodology
Primary survey, n=3,800 respondents, Q4 2025, six countries; demand-side model with trade association cross-validation
Qualitative Methodology
47 expert interviews, Q4 2025; applied to validate demand model assumptions, identify emerging dynamics, and assess competitive positioning
Report Format
PDF and XLSX data workbook (Word format preview document)
Publisher
Market Minds Advisory
Report Code
MMA-2026-MED-246
Published
August 2026
Contact
sales@marketmindsadvisory.com | www.marketmindsadvisory.com

Purchase the full In Vitro Diagnostics Market Report (2026 to 2036).

The full MMA In Vitro Diagnostics report sizes the market across five test technologies, five end-use settings, four purchasing channels, and seven regions through 2036. It profiles 20 suppliers on a consistent basis of diagnostic reagent, instrument, and consumable revenue, scoring each on installed analyser base, assay menu breadth, automation depth, and service network density. Scenario models quantify how reimbursement erosion, procurement reform, and decentralisation move both volume and achievable margin by technology. The report also includes cost per reportable result benchmarking, analyser placement cycle mapping by network type, point-of-care reimbursement comparison across health systems, and regulatory requalification exposure by assay class.
Five-technology and four-channel market sizing to 2036
Twenty-supplier benchmark on diagnostic reagent and instrument revenue
Cost per reportable result benchmarking across platform options
Analyser placement cycle mapping by laboratory network type
Point-of-care reimbursement comparison across major health systems
Regulatory requalification exposure modelling by assay class

Built For The People Who Decide

From boardroom strategy to bench-side execution, this report is read cover-to-cover by leaders shaping the next decade of their industry, turning demand scenarios, market dynamics and valuation benchmarks into decisions.
CXOs/ Presidents/ VPs/ Managers
M&A and Corporate Development
Strategy Teams and R&D Heads
Procurement and Product Directors
Regulatory and Compliance Leaders
Investor Relations and Equity Analysts