Market Minds Advisory
In Vehicles Payment Market

In Vehicles Payment Market: In Vehicles Payment Market: Charging Friction, Merchant Referral Value and Liability Reality, 2026 to 2036

A decade of announcements produced almost no behaviour change except at the charger, because that is the only place where the phone genuinely fails and the car can authenticate itself instead.

Lead Analyst

Published

September 2026

Make Smarter Decisions with Customized Research Insights

Request a free sample report and evaluate market opportunities, growth trends, and competitive dynamics relevant to your business needs.

2025 MARKET VALUE$0.9BMarket Size 2025
2036 FORECAST VALUE$5.0BBase Case , 2026 to 2036
CAGR 2026 TO 203616.8 %Bull 18.0% / Bear 15.6%
INCREMENTAL OPPORTUNITY$3.9BNet 10- year value creation
EXPANSION MULTIPLE4.72x2036 value over 2026 base
Strategic Levers
M&A Pipeline
Regional Outlook
Country Rankings
Competitive Intelligence
Segmental Deep-dive
Call-Us : 91 93563 13602

Executive Snapshot and Market Trajectory.

This capability has been announced repeatedly for ten years and barely used. Only 3% of drivers pay for fuel from the car, because the phone already works and nobody changes a habit to save four seconds at a pump they have used for years. Convenience was never the obstacle.
Charging is the exception and it is a genuine one. A driver at a public charge point must find the right application, create an account and sometimes carry a specific card, and letting the vehicle authenticate itself removes all of that. Charging authentication grows at 25.2%, half again the market rate of 16.8%, and already accounts for 58% of in-vehicle transactions. Friction here was real, and it was the only place it was.
Five participants enable 36% of measured transaction value, and the economics are much worse than the announcements implied. A manufacturer retains around 0.9% of transaction value while acquiring card data obligations, chargeback liability and fraud exposure it has no capability for. What is genuinely valuable is merchant referral, worth roughly 7.4 times the commission on the same purchase. Knowing where the vehicle stops is the asset here.
Market Definition
The in-vehicle payment market covers transaction initiation, authentication and settlement performed from a vehicle's own systems rather than from a driver's phone or card, spanning charging authentication and payment, parking payment and access, tolling and road charging, fuel purchase, drive-through and retail commerce, and in-car subscription and feature purchase. Sizing is measured at platform, service and commission revenue earned by participants. Card issuance, general mobile wallet transactions, fleet fuel cards, telematics insurance and vehicle finance are excluded.
Base Year Value
$0.9B in 2025 (MMA Primary Research Dataset, September 2026)
Forecast Period
2026 to 2036, eleven discrete annual values
CAGR
16.8% base case. Bull 18.0%. Bear 15.6%.
Fastest Growth Segment
Charging Authentication and Payment: 25.2% CAGR
Fastest Growth Country
Norway: 27.6% CAGR
Fastest Growth Region
South Asia and Pacific: 18.8% CAGR
Largest Region
East Asia: 34% of 2025 global value
Market Leaders
Visa, Mercedes-Benz Mobility, Mastercard, P97 Networks, Parkopedia. Source: MMA Analysis based on company disclosures and measured in-vehicle transaction value enabled.
Primary Survey
n=3,800 procurement and R&D decision-makers, Q4 2025, six countries
Methodology
Demand-side build-up, cross-validated against public data, 47 expert interviews

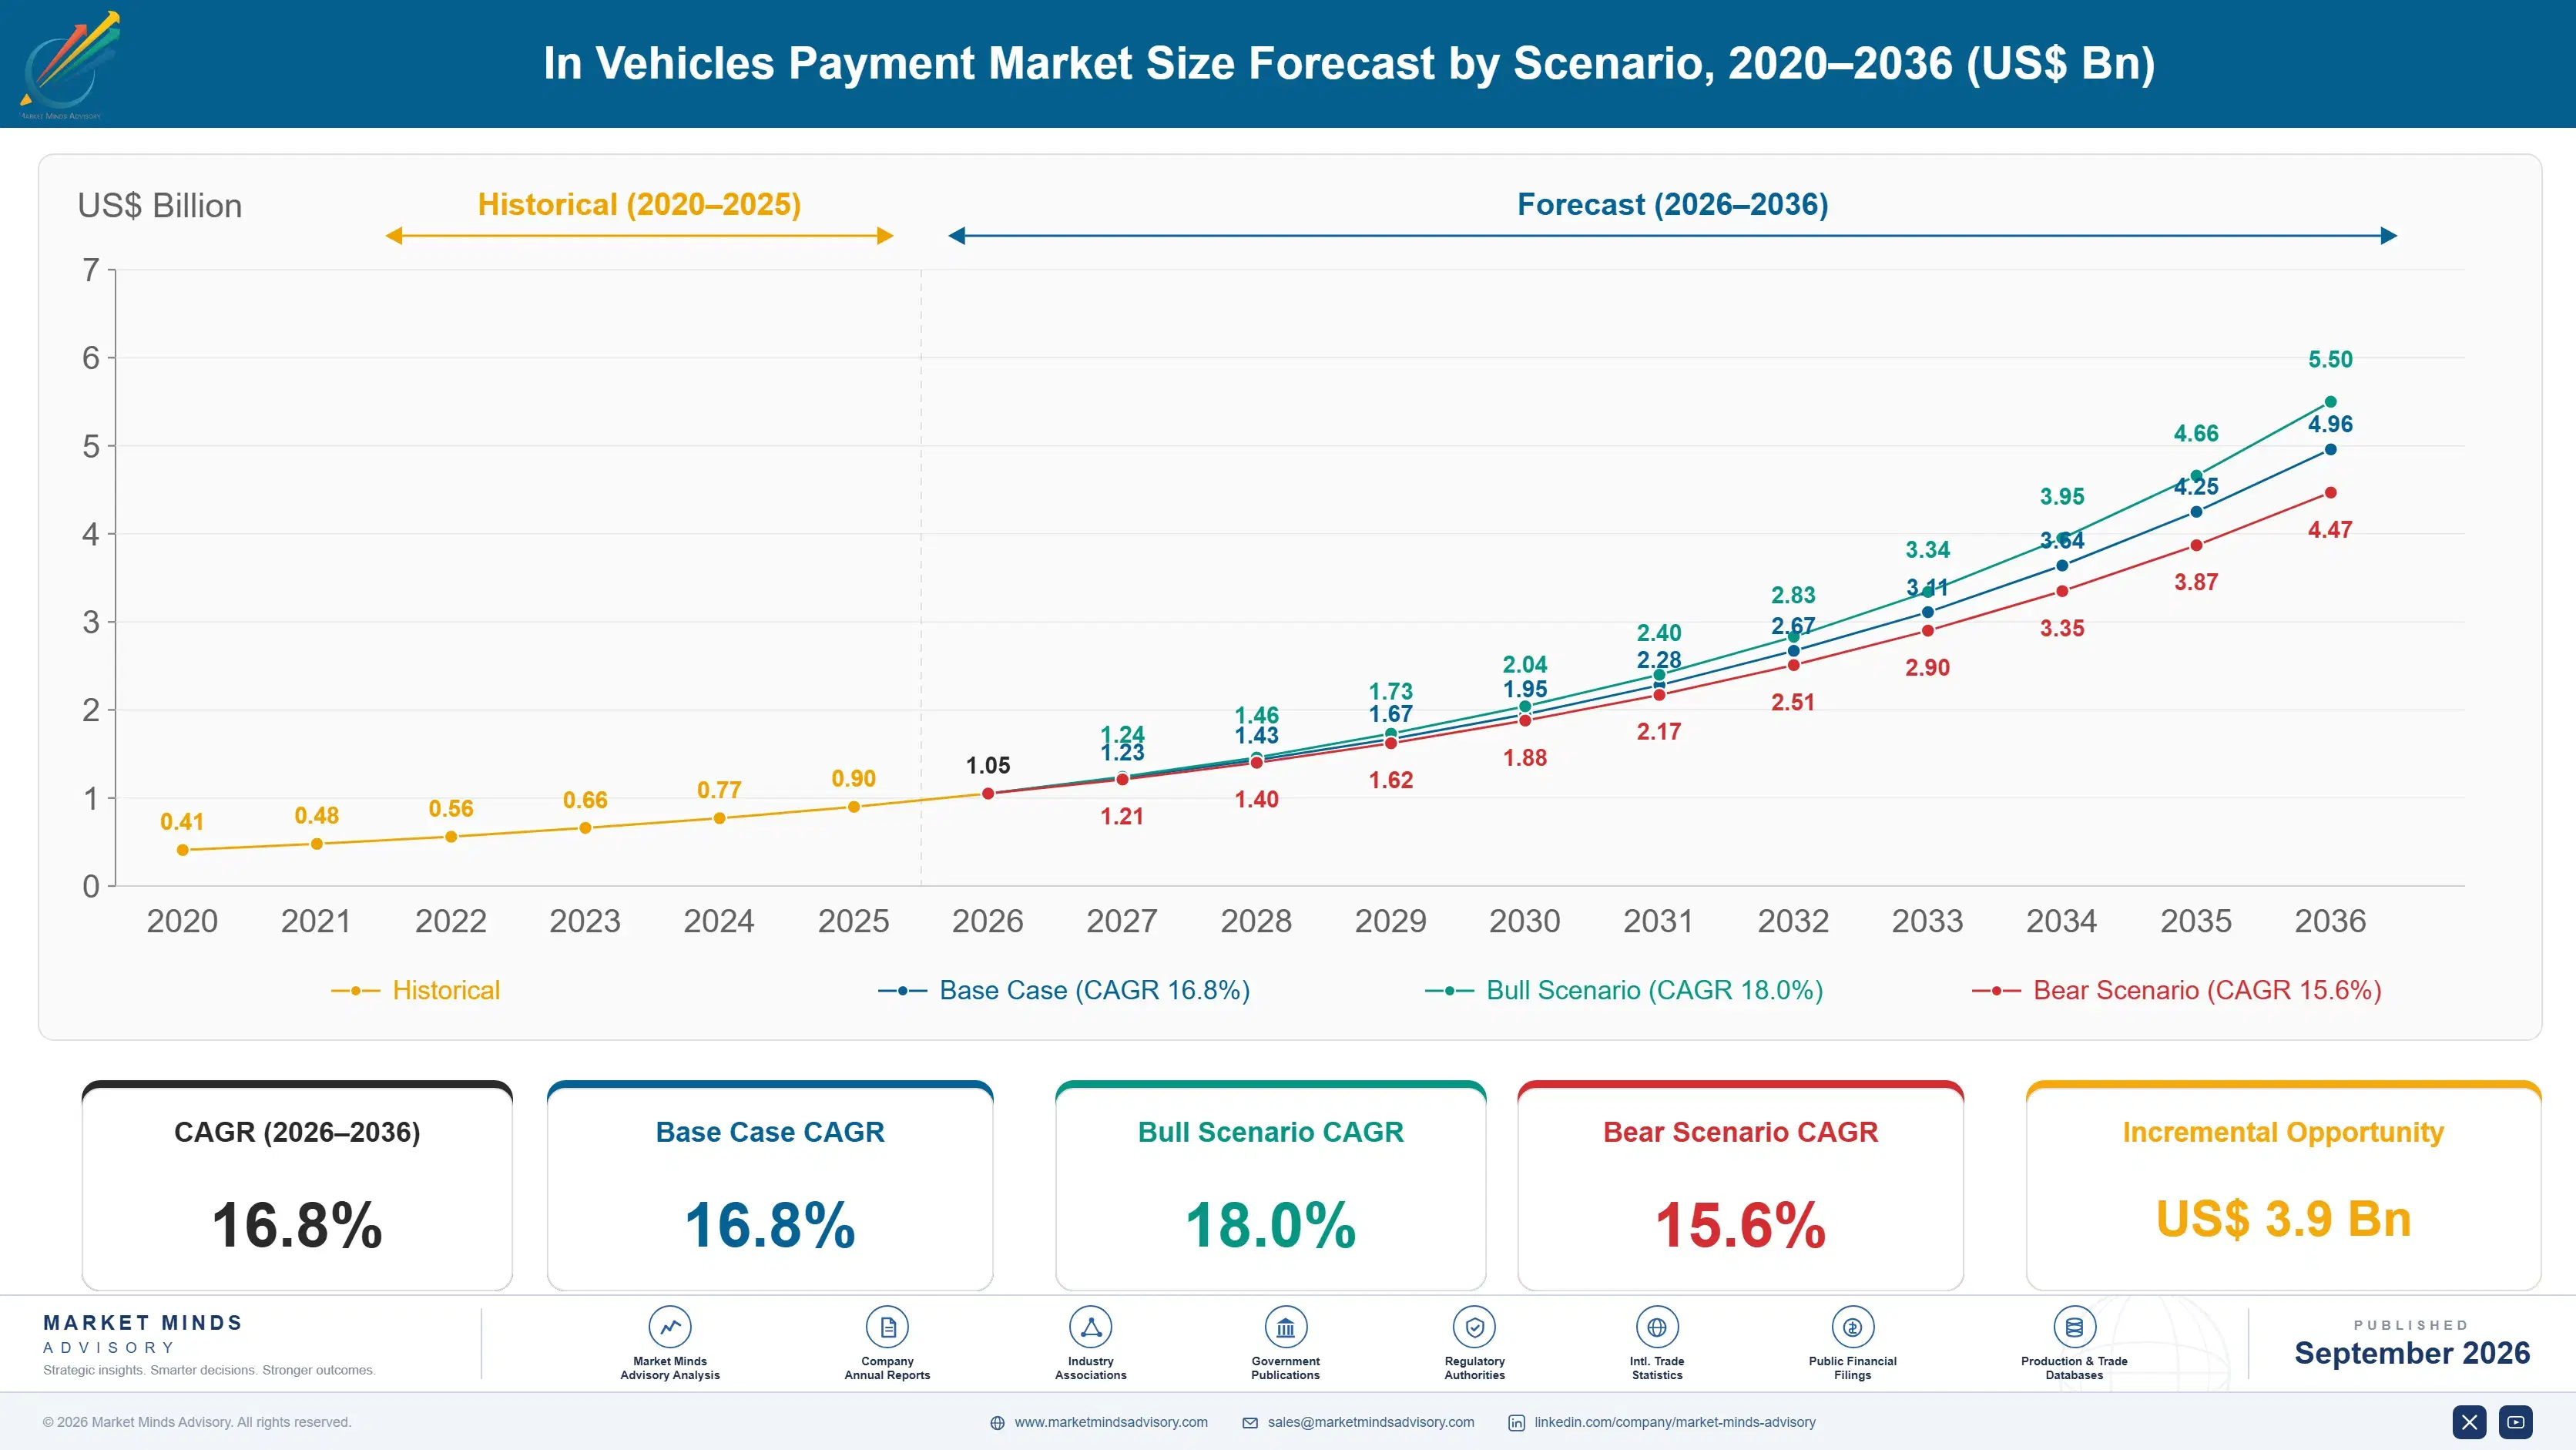
In Vehicles Payment Market Forecast Scenarios

in-vehicles-payment-market-size-forecast-scenario-1788417809202
Between 2020 and 2025 the market compounded at 15.6% from a base so small that individual manufacturer launches moved the annual figure. Almost every announcement in that period concerned fuel, parking or drive-through commerce and produced negligible usage. What actually grew was charging, quietly and without much attention, because electric vehicle drivers encountered a payment problem severe enough to change how they behaved.
The 16.8% base case rests on three commercial mechanisms. Electric vehicle parc growth multiplies the population encountering charging payment friction, and the vehicle authenticating itself is the only clean answer to it. Connected vehicle penetration has reached around 64% of new sales, which builds the installed capability whether or not it gets used. And manufacturers have discovered that merchant referral rather than transaction commission is where the money sits, which changes what they are willing to fund.
The bull case is charging authentication becoming universal across public networks, which would make the vehicle the default payment instrument for a category growing rapidly on its own. The bear case is regulation requiring contactless card acceptance at every public charge point, which restores the card as the simplest option and removes the friction this depends on.

Only The Charger Had A Problem Worth Solving

Paying from the car has been demonstrated at motor shows for a decade and almost nobody does it. Around 3% of drivers use in-car payment at a fuel station, because the phone and the card both already work, and no habit changes to save a few seconds at a pump. Every announcement assumed convenience would drive adoption and convenience was never the problem.
TOP FIVE CONCENTRATION36%Share of measured transaction value enabled by leading participants
CHARGING TRANSACTION SHARE58%Portion of in-vehicle transactions that are charging payments
FUEL PAYMENT TAKE-UP3%Share of drivers using in-car payment at fuel stations
MANUFACTURER COMMISSION0.9%Share of transaction value retained by the vehicle manufacturer
REFERRAL VALUE MULTIPLE7.4xMerchant referral value against transaction commission on identical purchases
CONNECTED VEHICLE PENETRATION64%Portion of new vehicles sold with payment-capable connectivity
Charging is different in a way that matters. A driver arriving at an unfamiliar public charge point has historically needed the operator's application, an account created in advance and occasionally a specific access card, which is a genuine obstacle rather than a minor inconvenience. Letting the vehicle present a credential to the charger removes all of it, and 58% of in-vehicle transactions are now charging payments as a result.
The commercial reality is harsher than the presentations suggested. A manufacturer processing payments acquires card data obligations, chargeback liability, fraud losses and payment registration requirements it has no organisation to handle, in exchange for roughly 0.9% of transaction value. What is genuinely worth having is knowing where the vehicle refuels and charges and steering it toward a partner, which is worth around 7.4 times the commission.
"Every manufacturer wanted to be a payments company until it read the liability terms. The ones doing well handed the transaction to somebody who wanted it and kept the thing that was actually valuable, which is knowing where the car stops and being paid to influence that."
Director, Connected Vehicle Commerce and Mobility Payments Practice · MMA Automotive and Digital Commerce Practice · September 2026

Market Trends

Vehicle Credentials Replace Applications At The Charger

A driver at an unfamiliar public charge point once needed the operator's application, an account created beforehand and sometimes a physical access card, which stopped enough sessions to matter commercially. Standards allowing the vehicle to present a credential directly to the charger remove every step, and the session simply starts when the cable connects. That is the only in-vehicle payment case where the alternative was genuinely difficult rather than merely slower. Charging authentication grows at 25.2% against a market at 16.8%, and it now carries 58% of all in-vehicle transactions.
Market Impact: Grows at 27.6% annually
Referral Value Exceeds Transaction Commission Many Times

Commission on a fuel or charging transaction runs around 0.9% of value and is shared across several participants, which produces very little for anybody. Directing a vehicle toward a particular charging network, fuel brand or retailer is worth roughly 7.4 times that on the same purchase, because the merchant is paying for a customer rather than for a payment. Manufacturers that recognised this stopped negotiating interchange and started negotiating placement, which is a completely different conversation with completely different economics behind it. Manufacturers that recognised this stopped negotiating interchange and started negotiating placement instead.
Market Impact: Reaches 64% of new vehicles

Market Opportunities and Growth Drivers

Electric Parc Growth Multiplies The Charging Population

Every electric vehicle added to the parc creates a driver who will eventually charge somewhere unfamiliar and encounter the payment problem that in-vehicle authentication solves. Norway grows at 27.6%, faster than any country in this market, because electric vehicles dominate new sales there and public charging is routine rather than exceptional. The population encountering the friction expands faster than vehicle sales, since older combustion vehicles leave the parc while electric ones accumulate. This is demand created by a different industry entirely. Older combustion vehicles leave the parc while electric ones accumulate steadily.
Market Impact: Affects 58% of transactions

Connected Vehicle Penetration Builds Latent Capability

Around 64% of new vehicles are sold with connectivity capable of supporting payment, which installs the capability across the parc regardless of whether anybody activates it. That matters because activation later requires no hardware, only a software decision and a commercial agreement. Manufacturers therefore hold an installed base they can monetise at any point without further vehicle cost, which is unusual and explains continued investment despite disappointing usage. The capability arrives whether the business case is proven or not. Activation later needs no hardware, only a software decision and a commercial agreement in place.
Market Impact: Converts only 3% of drivers

Market Restraints and Challenges

Card Acceptance Rules Restore The Simplest Option

Regulation requiring contactless card acceptance at public charge points obliges operators to fit readers, which restores the ordinary bank card as the simplest way to pay and removes the friction that made vehicle authentication worth adopting. The root cause is that consumer protection policy and convenience engineering are pulling in opposite directions with no coordination between them. Commercial impact falls on exactly the segment carrying this market's growth. Participants mitigate by positioning vehicle authentication as faster rather than as necessary, by bundling it with routing and reservation, and by targeting fleets where card issuance is itself the problem.
Market Impact: Carries 58% of transactions

Nobody Changes Payment Habits To Save Seconds

In-car payment for fuel, drive-through and retail reached around 3% take-up because the existing method already works and the saving is trivial. The root cause is that payment friction outside charging was never high enough to justify learning something new. Commercial impact is a large announced addressable market that does not convert, which has damaged credibility with merchants and with manufacturer finance functions alike. Mitigation runs through selecting cases with real friction, through embedding payment inside a trip the driver already wanted, and through abandoning categories that have demonstrably failed.
Market Impact: Worth 7.4 times the commission
4 additional market trends, 3 additional growth drivers, and 2 additional restraints and challenges are covered in the full report. Contact sales@marketmindsadvisory.com to access the complete intelligence.

Segment CAGR and Growth Architecture

Segmentation follows the transaction category, which determines whether a genuine friction problem exists and therefore whether anybody adopts. Charging, parking, tolling, fuel, retail commerce and in-car feature purchase behave completely differently, and the divergence between categories with real obstacles and categories with only mild inconvenience is the defining feature here. Adoption follows friction exactly.
in-vehicles-payment-market-market-share-analysis-1788417809808

Charging Authentication and Payment

This is the only category where the existing alternative was genuinely difficult rather than merely slower. A driver at an unfamiliar charge point needed an application, an account and sometimes a physical card, and letting the vehicle present a credential removes every step so the session starts when the cable connects. It already carries 58% of in-vehicle transactions and grows at 25.2%, half again the market rate of 16.8%. The risk is regulatory rather than competitive, since rules requiring contactless card readers at public charge points restore the simplest alternative and remove the friction this depends upon. Nothing else in this market has produced comparable behaviour change. Regulation rather than competition is the threat.
CAGR 25.2%

Parking Payment and Access

Parking combines payment with entry control, which makes it the one non-charging category with real friction: a barrier, a ticket and a payment machine are three obstacles that vehicle recognition removes together. Operators adopt it to reduce equipment, cash handling and staffing rather than to please drivers, which is a considerably more reliable buyer motivation than convenience ever provides. Growth at 20.4% reflects that operator economics rather than any driver demand. Number plate recognition already handles entry widely, so connecting it to a vehicle-held account is an incremental step rather than a new system. Equipment, cash handling and staffing cost reductions are what actually justify it. Recognition already handles entry widely.
CAGR 20.4%
Full segment breakdown across 6 segments available in the complete report.

Regional Architecture and Country Demand Map

Demand follows connected vehicle parc, electric adoption and charging network structure rather than vehicle sales or retail spending. East Asia leads on connected fleet size and on in-car commerce that is already routine rather than novel. Vehicle sales volume is a poor guide to any of it.

East Asia

China operates the largest connected vehicle parc anywhere and the largest electric vehicle population, which puts East Asia at 34%, above the 30% ceiling of the standard band, and the concentration is genuine rather than an artefact of measurement. In-car commerce is already routine there in a way it is not elsewhere, with established wallets integrated into vehicle interfaces from the factory rather than added afterwards. Domestic manufacturers treat the vehicle interface as a commerce surface deliberately. Korean and Japanese adoption is slower and concentrated in charging and parking applications. Domestic manufacturers treat the vehicle interface as a commerce surface deliberately, which is a design decision rather than an afterthought added later.
Share: 34% | CAGR: 17.8% (2026 to 2036)

Western Europe

Electric vehicle penetration and public charging density are the highest anywhere outside China, which places the region at 28%, marginally above the standard band, and charging authentication carries most of it. Norway grows at 27.6%, faster than any country here, on electric vehicles dominating new sales. Regulation requiring contactless card acceptance at public charge points cuts directly against vehicle authentication and is the principal risk to regional growth. Interchange caps also limit what any participant can earn from the transaction itself rather than from referral. Interchange caps also limit what any participant can earn from the transaction itself rather than from referral, which pushes everybody toward placement revenue. Norway is the extreme case rather than the exception.
Share: 28% | CAGR: 15.4% (2026 to 2036)
Regional intelligence for 5 additional markets available in the complete report: North America, South Asia and Pacific, Middle East and Africa, Latin America, Eastern Europe. Contact sales@marketmindsadvisory.com.
in-vehicles-payment-market-country-cagr-analysis-1788417810394

Where This Actually Makes Money

Four positions carry margin in a market whose announced opportunity has repeatedly failed to appear. Each involves abandoning the transaction economics that attracted everybody in the first place, which is uncomfortable for participants who described this as a payments business to their own boards. Each requires abandoning the transaction economics that attracted everybody here originally.

Sell Merchant Placement Rather Than Payment Commission

Commission on a transaction runs around 0.9% of value shared across several participants and produces very little for anybody, while directing a vehicle toward a particular network, brand or retailer is worth roughly 7.4 times that on the same purchase. The merchant is paying for a customer rather than for a payment, which is an entirely different and much larger budget. Participants negotiating interchange are arguing about the smaller number. Placement requires knowing where vehicles actually stop, which the data provides directly. Placement requires knowing where vehicles actually stop, which the data provides directly.
Market Impact: Earns 7.4 times the transaction commission now available

Concentrate Entirely On Charging Authentication Instead

Charging carries 58% of in-vehicle transactions and grows at 25.2% because the alternative was genuinely difficult, while fuel and retail reached about 3% take-up because the alternative already worked. Effort spent on categories without real friction has consumed a decade and produced almost nothing. Narrowing to charging, and to parking where entry control creates comparable friction, is the discipline that separates participants with usage from those with announcements. It also means abandoning presentations several boards have already approved. It also means abandoning presentations that several boards have already approved and announced publicly.
Market Impact: Focuses on the 58% that genuinely converts today

Hand The Payment Liability To Somebody Who Wants It

Processing payments brings card data compliance, chargeback liability, fraud losses and payment registration that no vehicle manufacturer has an organisation to absorb, in exchange for around 0.9% of value. Transferring all of it to a payment platform that wants the liability keeps the customer relationship and the data, which are the parts worth having. The revenue line is thinner and the risk position is dramatically better. Several manufacturers learned this after launch rather than before it, which was expensive. The revenue line is thinner and the risk position is dramatically better afterwards.
Market Impact: Sheds all the liability for 0.9% of value

Target Fleets Where Control Is The Real Problem

A commercial fleet operator has a genuine payment problem: cards get shared, fuel gets bought for vehicles that are not on the fleet, and reconciliation is manual. Vehicle-bound payment solves control and reconciliation rather than convenience, which is a problem somebody will pay to fix. Take-up among consumer drivers stalled at 3% and fleet economics behave nothing like it. Very few participants have pursued this seriously, because the announcements were all written about consumers. Reconciliation is done by hand every month at most operators, and vehicle-bound payment fixes that directly rather than saving anybody a few seconds.
Market Impact: Beats a 3% consumer take-up rate entirely elsewhere

Who Controls the Margin Pool

Measured on transaction value enabled, the basis used throughout this section, the top five account for 36%. That is fragmented, and it reflects a market assembled from card networks, vehicle manufacturers, charging operators and payment platforms that each hold one piece and none of which controls the whole. The gap between leaders and everyone else is charging network coverage and vehicle installed base rather than any payment capability.
Competition runs on charge point network reach, vehicle parc coverage and increasingly on who holds the merchant relationship rather than on transaction economics that barely exist. Card networks provide settlement and are indifferent to which participant wins. Vehicle manufacturers hold the installed base and have retreated from liability. Payment platforms and charging roaming operators hold the connective work that makes any of it function.

Pressure comes from two directions. Regulation requiring contactless card readers at public charge points restores the simplest alternative and undermines the friction argument entirely. And merchants are learning that referral is what they are buying, which shifts negotiating power toward whoever holds vehicle location data rather than toward whoever processes the payment. Rankings shift where participants moved to placement revenue and away from transaction commission.
in-vehicles-payment-market-company-positioning-matrix-1788417810996

Competitive Moat and Risk Dimensions

VISA

Moat: Settlement reach and acceptance

Universal merchant acceptance means any in-vehicle payment arrangement eventually settles through the same networks regardless of which participant owns the customer relationship, which makes the position indifferent to who wins the layer above. Tokenisation capability supports vehicle-bound credentials without exposing card data to manufacturers. Relationships with both issuers and merchants reach every part of this market.
VISA

Risk: Interchange caps limit earnings

Regulated interchange in major markets caps what can be earned from the transaction itself, and the value in this market has migrated to merchant referral where the company holds no natural position. Account-to-account payment systems in several growth markets bypass card rails entirely. Indifference to the layer above also means very little influence over how the market develops.
MERCEDES-BENZ MOBILITY

Moat: Installed base and charging integration

Vehicle-side integration across a large connected parc gives direct control of the interface where charging authentication happens, which is the only category with genuine adoption. Established charging roaming agreements provide the network coverage that makes the capability useful rather than theoretical. Data on where vehicles actually stop supports the merchant placement revenue that exceeds transaction commission several times over.
MERCEDES-BENZ MOBILITY

Risk: Payment liability and scale limits

Operating payment functions brings compliance, chargeback and fraud obligations that a manufacturer has no organisation to absorb, and the retained commission of around 0.9% does not compensate. Parc coverage is limited to one manufacturer's vehicles, which caps merchant negotiating position against platforms spanning several brands. Regulatory pressure for card acceptance at chargers threatens the one category that works.

Players Tracked

Prominent Players

Visa
Mercedes-Benz Mobility
Mastercard
P97 Networks
Parkopedia

Other Key Players

Stellantis
General Motors
Hyundai Motor Company
BMW Group
Toyota Motor Corporation
Shell
BP Pulse
Ryd
Hubject
ChargePoint
Bosch
Continental
Amazon
Alipay
Adyen

Recent Developments

APRIL 2025

Card acceptance obligations apply to new public charge points

Rules requiring contactless card payment acceptance at newly installed public charge points came into application, a regulatory milestone rather than any commercial transaction. Operators became obliged to fit readers regardless of whether their networks already supported account-based or vehicle-based authentication methods. Existing installations were given longer.
Signal: Consumer protection policy and convenience engineering are pulling against each other with nobody coordinating them at all.
NOVEMBER 2024

Manufacturer extends vehicle charging authentication across European fleet

A vehicle manufacturer enabled certificate-based charging authentication across its European connected fleet, a deployment decision rather than any corporate transaction. Sessions begin when the cable connects without any application, account creation or access card being required from the driver at all. No access card is needed either.
Signal: Charging is the only case where removing the application genuinely changed what drivers actually went on to do.
FEBRUARY 2025

Manufacturer transfers payment operation to specialist platform

A vehicle manufacturer moved in-car payment processing to a specialist payment platform, retaining the customer relationship and the transaction data while transferring compliance, chargeback and fraud liability entirely. The arrangement replaced a merchant of record structure adopted at launch two years earlier. Retained commission fell accordingly.
Signal: Manufacturers are discovering after launch what payment liability actually involves, and then retreating from it quickly.

Processing, Fraud And Integration

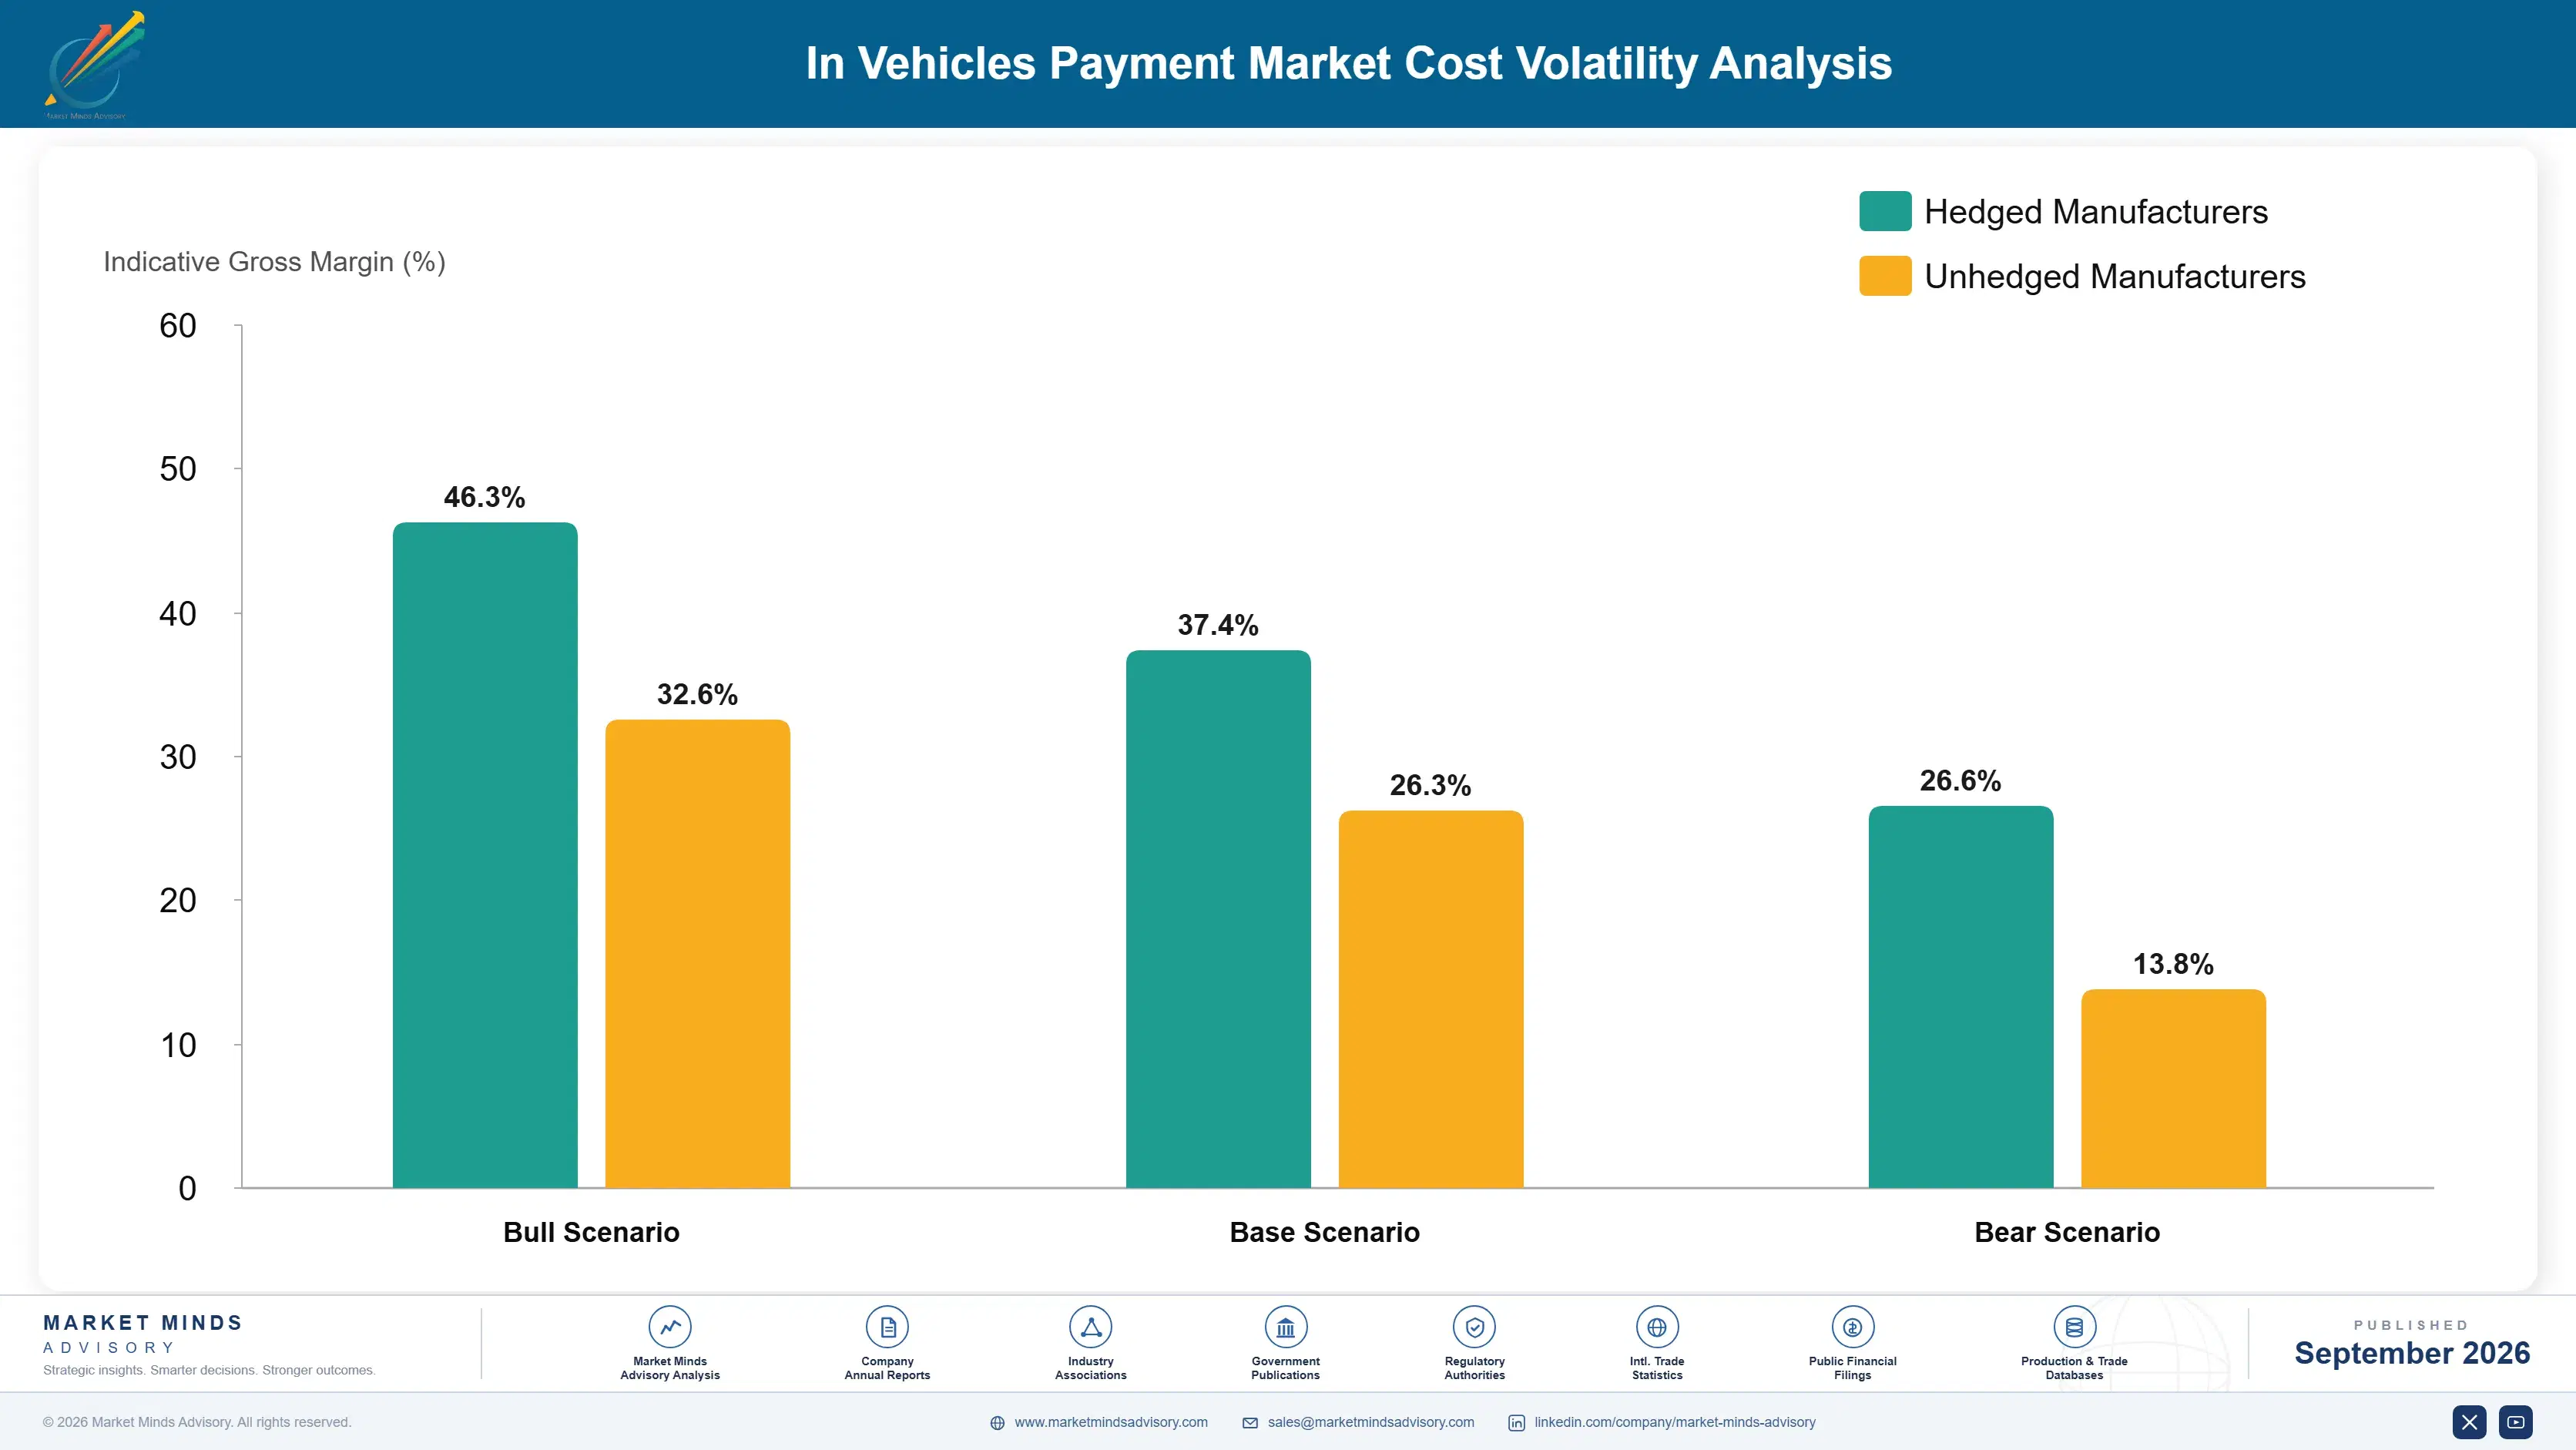
Payment processing and scheme fees account for roughly 34% of participant cost, fraud losses and chargebacks around 17%, compliance and audit near 12%, and integration engineering, merchant acquisition and support the balance. Interchange is capped by regulation in several major markets under European Commission rules, which limits both the cost and the revenue available from the transaction itself and pushes participants toward referral economics instead.
Fraud rates on card-not-present transactions initiated from vehicles ran above expectations during early deployments, since the authentication model was unfamiliar to issuers and declines were common while chargebacks were disputed. Several participants disclosed higher than modelled loss rates in results covering the period. Compliance and audit costs also proved larger than manufacturers had budgeted, because card data scope reaches further into an organisation than anybody expected.

The disadvantage mechanism is liability structure rather than transaction scale. A participant acting as merchant of record carries fraud, chargeback and compliance cost directly, while one referring the transaction to a platform carries none of it and earns a thinner but far cleaner margin. That difference decides profitability more than volume does at these levels. It is why manufacturers retreating from processing improved their economics.
in-vehicles-payment-market-cost-volatility-analysis-1788417811194

Transferring merchant of record status entirely

Moving the merchant of record role to a payment platform removes fraud, chargeback and compliance cost completely while retaining the customer relationship and the transaction data that actually carry value. The commission retained falls, and the risk removed is worth considerably more than the revenue given up at these transaction volumes. The trade is clearly worth making.

Tokenised vehicle credentials narrowing compliance scope

Using network tokenisation so that card data never enters vehicle or manufacturer systems narrows compliance scope dramatically and reduces audit cost accordingly. It requires integration work with card networks that manufacturers rarely have the internal capability to specify, which is why so many began by handling data they should never have touched. Many handled data they should never have touched.

Referral pricing decoupled from transaction value

Pricing merchant placement on referral outcomes rather than as a share of transaction value removes exposure to interchange caps and to payment economics entirely. Merchants accept it readily because they are buying customer acquisition, which they already price exactly that way in every other channel they currently use. Interchange caps stop applying entirely once pricing leaves transaction value behind.

Portfolio Architecture for Margin Defence

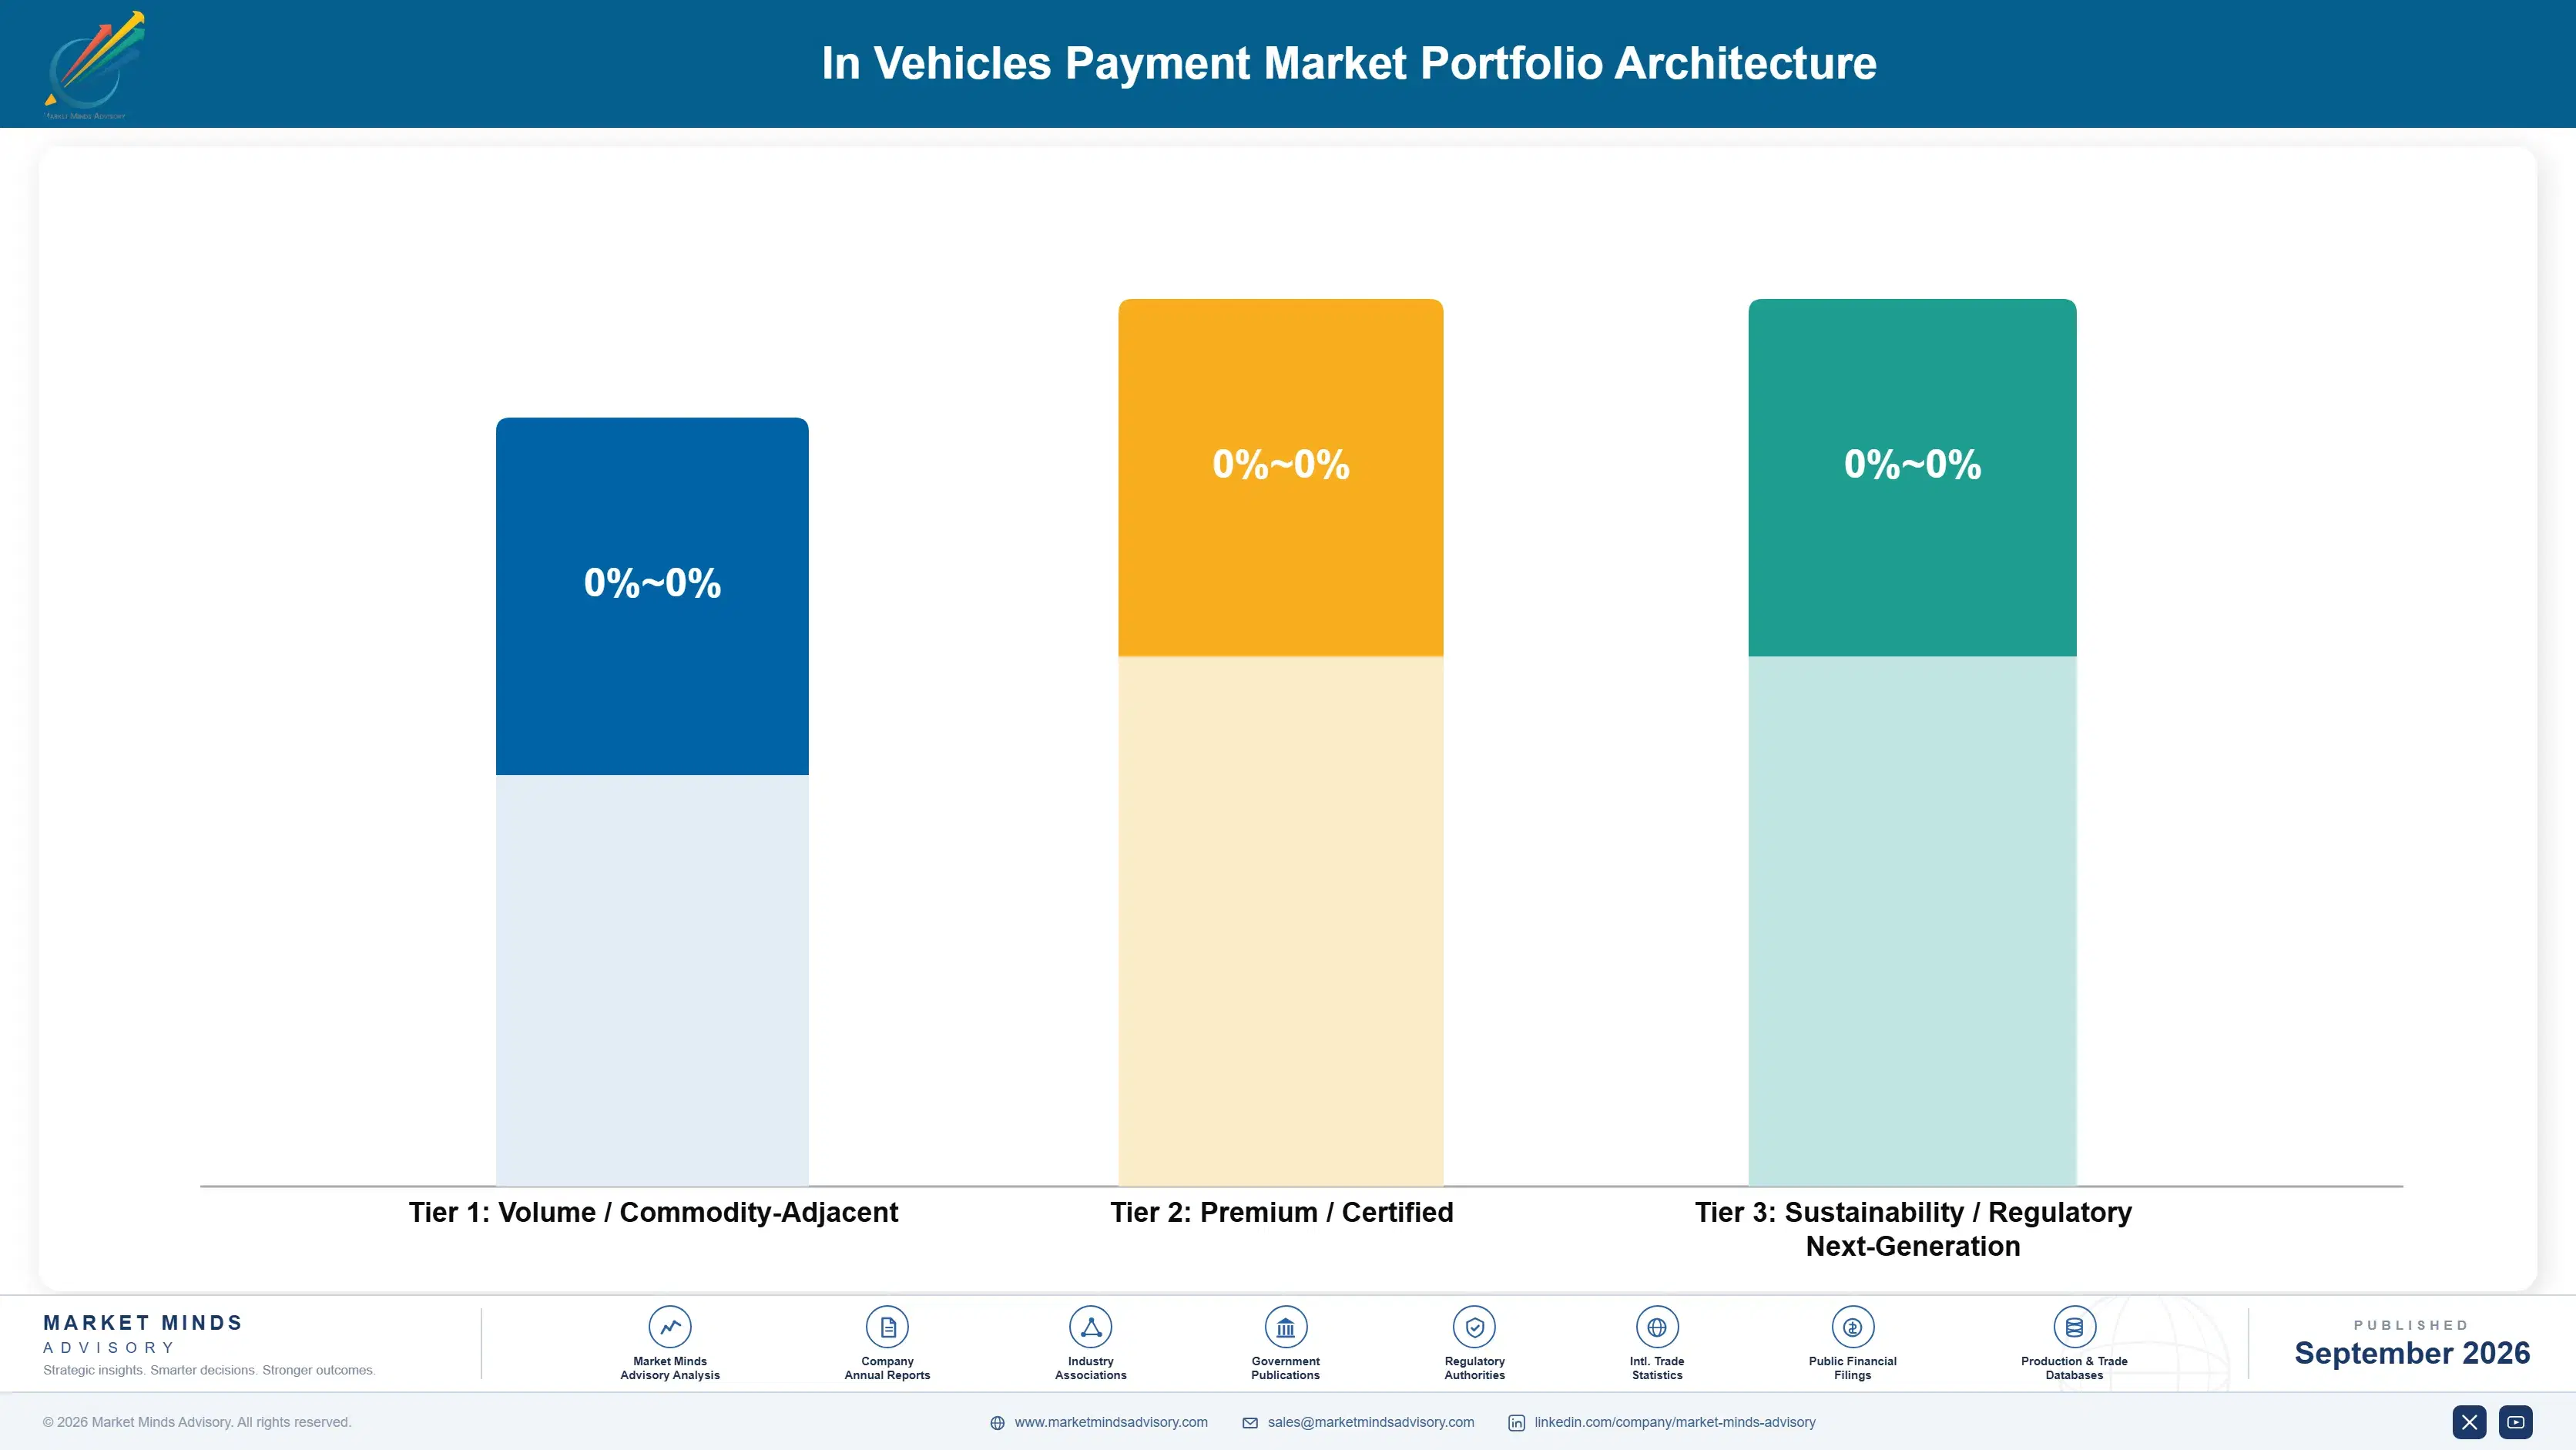
Margin separates by whether a participant carries payment liability. Acting as merchant of record produces around 0.9% of transaction value against fraud, chargeback and compliance cost that consumes most of it, which is why several found it worse than doing nothing. Referring the transaction and selling merchant placement produces roughly 7.4 times as much with none of the cost, because the merchant is buying a customer.
The volume against premium tension barely exists, because the volume is not there. Fuel, drive-through and retail commerce reached around 3% take-up after a decade of promotion, and no pricing or product change revives a category where the existing alternative already works. The genuine choice is between funding categories that have failed and concentrating on charging and parking. Most participants are still funding both.

High-value pools sit where the driver had a real problem or the merchant wants a customer: charging authentication, parking access where entry control is combined, and merchant placement priced on referral. Each is defended by data about where vehicles stop rather than by any payment capability. The pools are narrow against the announced addressable market and carry essentially all of the profit in it.

Volume / Commodity-Adjacent

Merchant of record transaction processing for fuel, retail and drive-through commerce where take-up is minimal. Fraud, chargeback and compliance cost consume most of the retained commission, which makes this close to unprofitable at current volumes.
Gross Margin: 8 to 16%

Premium / Certified

Charging authentication and parking access services where genuine friction drives adoption and platforms earn service fees rather than transaction shares. The 12 point range reflects whether the participant holds network coverage or resells somebody else's.
Gross Margin: 26 to 38%

Sustainability / Regulatory / Next-Generation

Merchant placement and referral revenue priced on customer acquisition rather than transaction value, and fleet control services. The 20 point range reflects how completely referral pricing escapes the payment economics that constrain everything else.
Gross Margin: 44 to 64%
in-vehicles-payment-market-portfolio-architecture-1788417811761

High-value Sub-segments and Strategic Watch-out

Merchant Placement And Referral

Worth roughly 7.4 times transaction commission on identical purchases, because the merchant is buying a customer rather than a payment. Defended by knowing where vehicles actually stop rather than by any payment capability at all. Merchants already price customer acquisition this way in every other channel they use.
Gross Margin: 48 to 64%

Charging Authentication Services

Carries 58% of in-vehicle transactions on the only friction problem drivers genuinely wanted solved. Regulation requiring card readers at public charge points is the single real threat to the position rather than any competitor. Electric parc growth expands the affected population faster than vehicle sales do.
Gross Margin: 34 to 46%

Fleet Control And Reconciliation

Solves a genuine control and reconciliation problem for operators rather than a convenience one for drivers, which is a problem somebody will actually pay to fix. Almost nobody has pursued it, because every announcement addressed consumers. Every announcement addressed consumers rather than operators. Nobody asked the operators.
Gross Margin: 38 to 52%

Consumer Fuel And Retail Payment

Reached around 3% take-up after a decade of promotion because the phone and the card both already worked perfectly well. Continued funding here is the clearest misallocation visible anywhere in this market. No interface change has ever moved that number in a decade of concerted trying.
Gross Margin: 8 to 16%

Who Actually Enables The Transaction

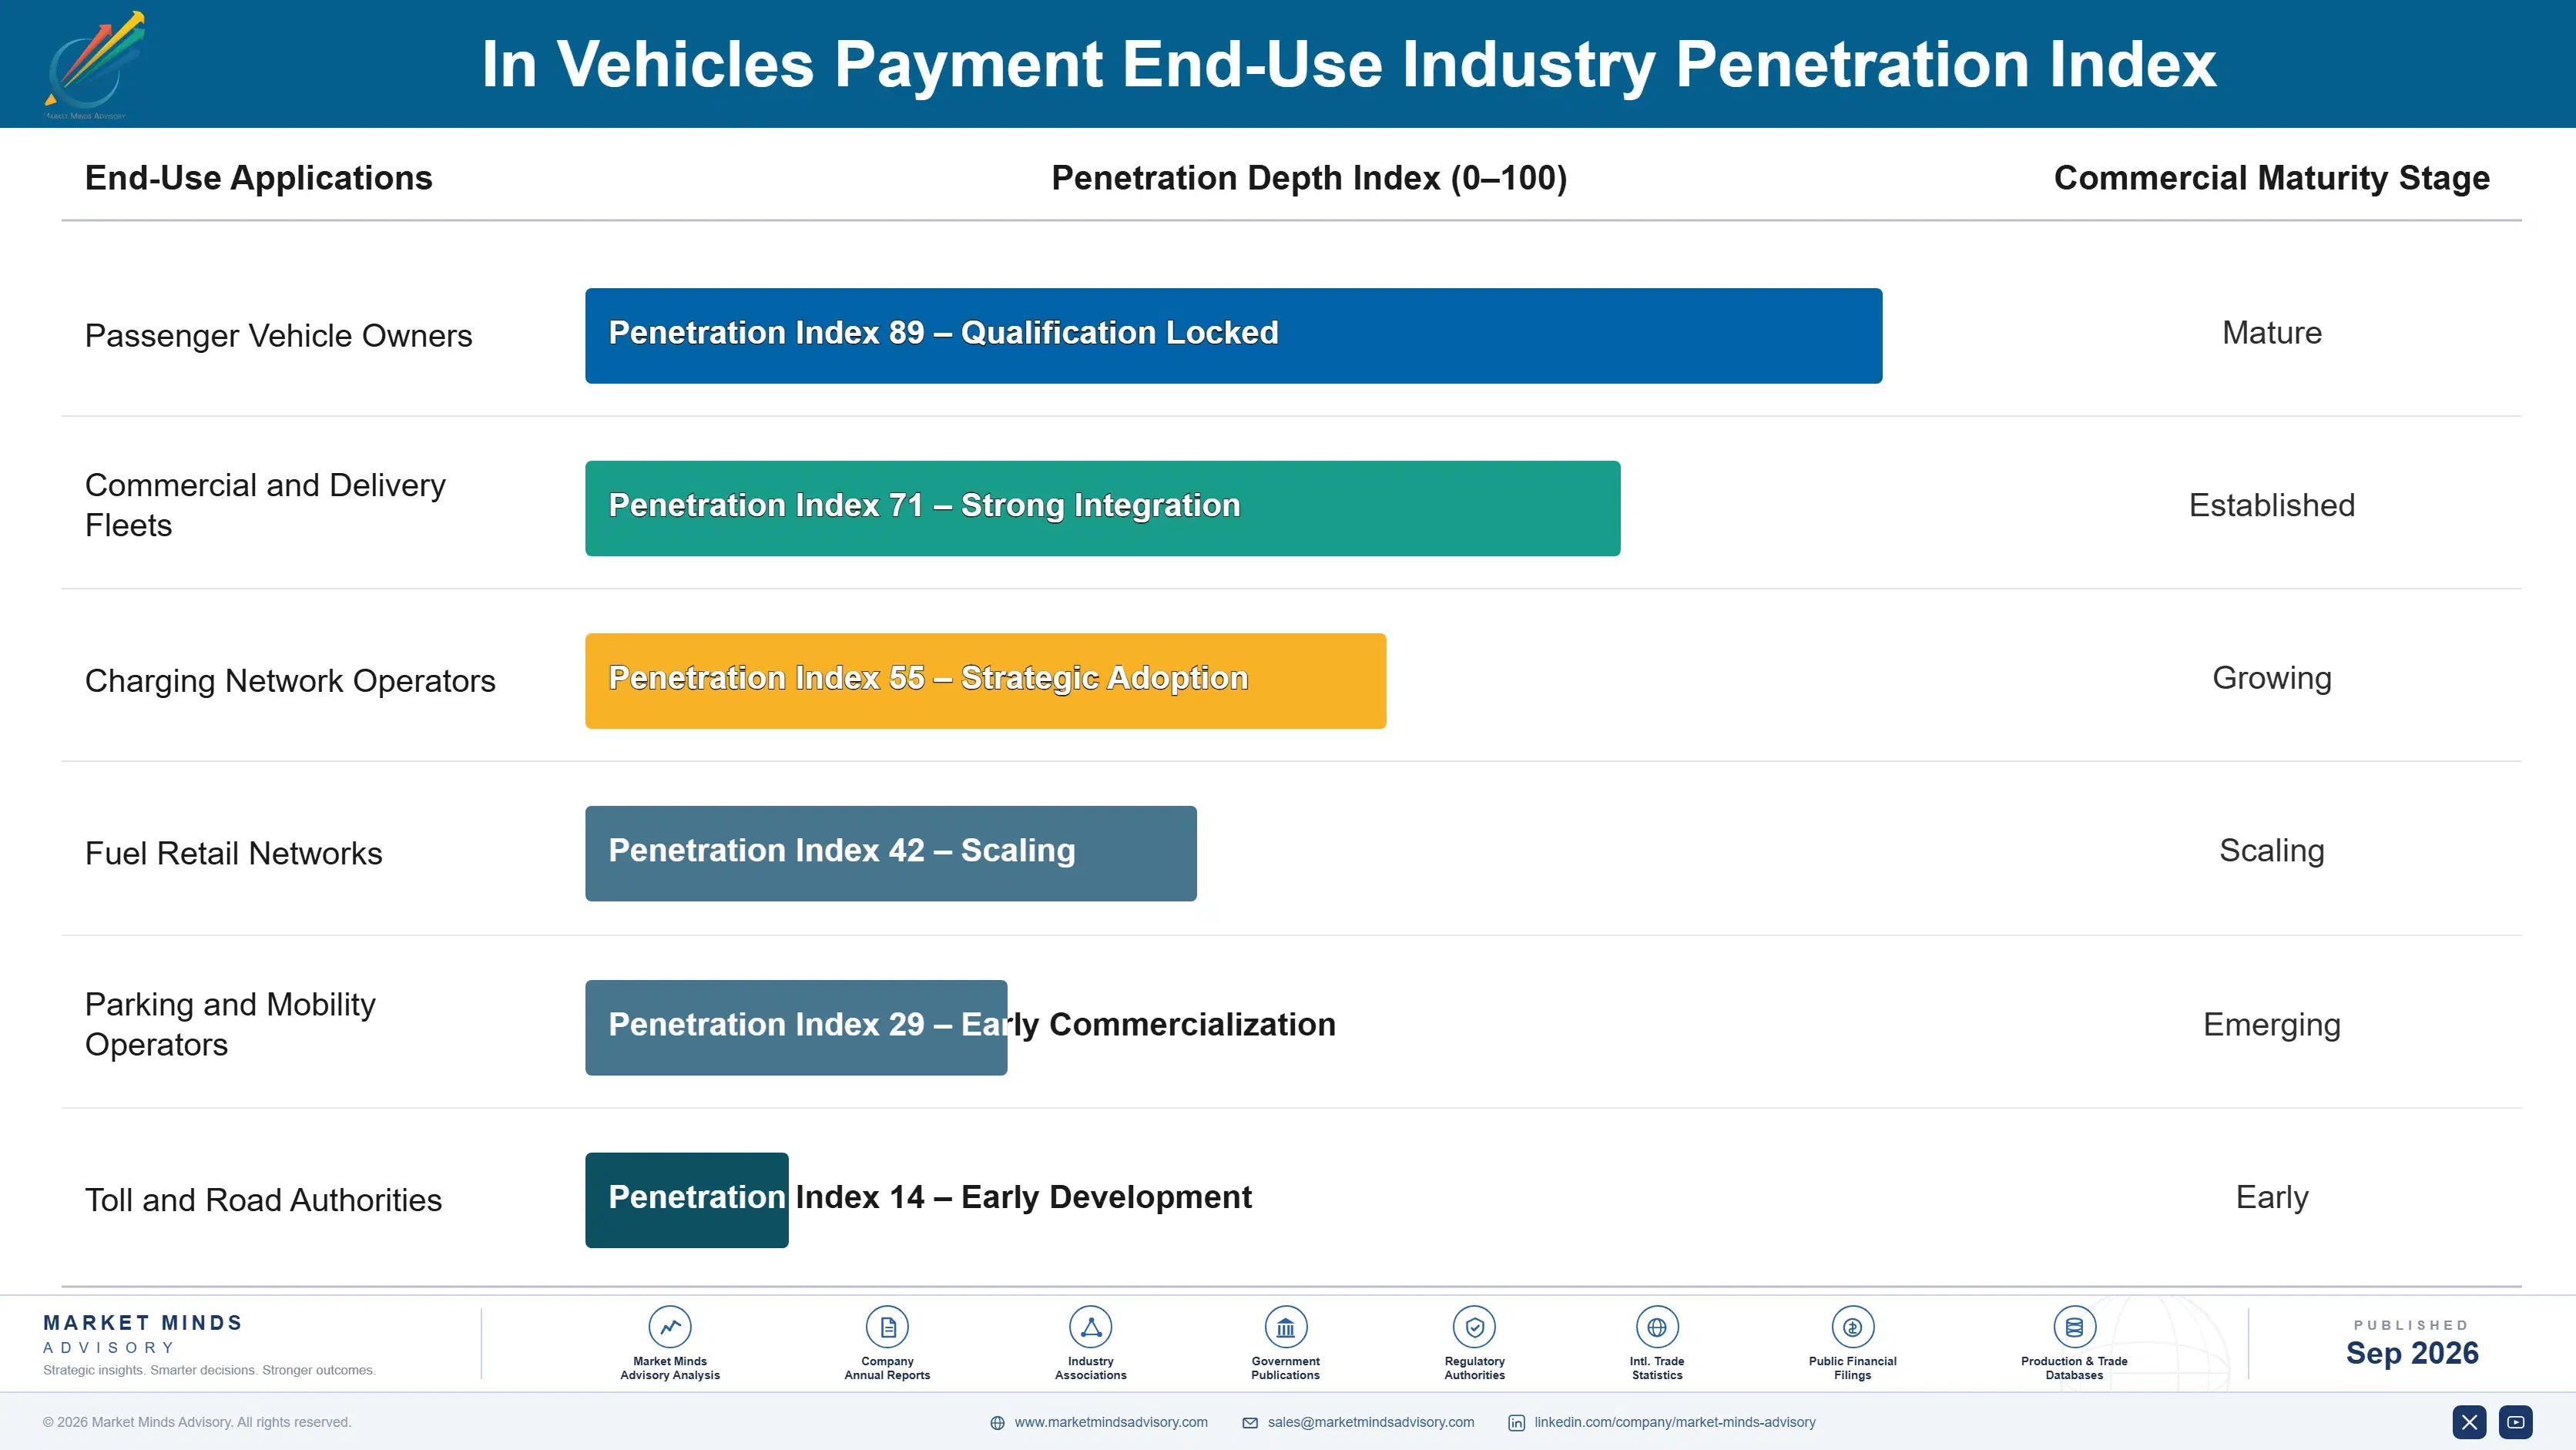
Annuity economics come from the vehicle rather than from the driver, since a capability activated on a connected vehicle persists for that vehicle's life and generates transactions without further sale. Around 64% of new vehicles arrive capable, so the installed base grows regardless of whether anybody uses it. That produces an unusual position where the addressable base expands automatically and conversion of it remains entirely unproven.
Adoption depth varies sharply by category and by driver. Electric vehicle drivers adopt charging authentication readily because it removes a problem they encounter weekly and remember badly. Fleet operators would adopt control and reconciliation enthusiastically and have rarely been asked. Ordinary drivers do not adopt fuel or retail payment at all, and no amount of interface improvement has changed that in ten years of trying.

The buyer profile has moved from the driver to the merchant, which nobody intended. This was conceived as a consumer convenience funded by transaction economics, and the money now comes from merchants paying for vehicle traffic directed toward them. That makes the customer a charging network, a fuel brand or a retailer rather than a car owner, and the product an acquisition channel rather than a payment method.
in-vehicles-payment-market-end-use-penetration-index-1788417812280

Where Participants Should Compete

These are among the four positions where our research anticipates prominent divergence between winners and laggards over the coming forecast period. Each is grounded in the demand model, the regulatory perimeter, and the announced capacity pipeline.
01 / REFERRAL REVENUE PRIORITY

Sell customer acquisition, not payment commission

Transaction commission runs around 0.9% of value shared across several participants and produces almost nothing for anybody involved, while directing a vehicle toward a particular network, brand or retailer is worth roughly seven times as much on the very same purchase. The merchant is buying a customer rather than buying a payment, which is an entirely different and considerably larger budget. Participants still negotiating interchange are arguing carefully about the smaller of the two available numbers, and losing either way.
02 / CATEGORY FOCUS DISCIPLINE

Fund charging and parking, abandon the rest

Charging already carries 58% of all in-vehicle transactions and grows at 25.2% because the alternative was genuinely difficult, while fuel and retail commerce reached about 3% take-up because the phone and the card both already worked perfectly well. A full decade of effort on categories without any real friction has produced almost nothing measurable at all. Narrowing to charging and to parking, where entry control creates genuinely comparable obstacles, means abandoning presentations that several boards have already approved and announced publicly.
03 / LIABILITY TRANSFER DECISION

Give the payment away and keep the data

Processing payments brings card data compliance, chargeback liability, fraud losses and payment registration obligations that no vehicle manufacturer has any organisation capable of absorbing, in exchange for only around 0.9% of transaction value. Transferring the whole of that to a platform which genuinely wants the liability retains the customer relationship and the data, which are in fact the only parts worth having here at all. Several manufacturers learned this after launch rather than before, at considerable and entirely avoidable expense.
04 / FLEET SEGMENT PURSUIT

Solve control for fleets, not convenience for drivers

A commercial fleet operator has a genuine and expensive problem, since cards get shared, fuel gets bought for vehicles outside the fleet, and reconciliation is done by hand every single month. Vehicle-bound payment here addresses control and reconciliation rather than any convenience at all, which is genuinely something an operator will pay to have fixed properly. Consumer take-up stalled at 3%, while fleet economics behave nothing like that at all, and almost nobody has pursued that segment seriously at any point.

Engagement Snapshot From the Field

A live engagement with an industry participant carrying material or product regulatory and market exposure ahead of a defining policy shift, showing how our research translates into a defensible multi-year portfolio strategy.
MARKET MINDS ADVISORY · CLIENT ENGAGEMENT SUMMARY
In Vehicles Payment Producer Strategic Portfolio Review and Transition Roadmap 2026·Investment Scenario on In Vehicles Payment Exposure Evaluation 2025-26
CLIENT PROFILE
A European vehicle manufacturer operating connected services across several brands and more than twenty markets, with annual group revenue reported at approximately USD 68 billion (client-reported, unverified by MMA). In-car payment had launched three years earlier covering fuel, parking and charging, with the manufacturer acting as merchant of record across all three of those categories.
STRATEGIC CHALLENGE
Usage was far below the launch business case in every category except charging, and the payment operation was losing money once fraud and compliance costs were included honestly. Management could not establish whether the problem was the interface, the merchant coverage, or something more fundamental about the proposition itself. Nobody had tested it.
MMA APPROACH
MMA analysed transaction data by category against the friction each one actually removed, quantified fraud, chargeback and compliance cost against retained commission, and priced merchant referral against transaction economics using placement rates from comparable digital channels rather than from payment benchmarks. Fleet operator requirements were assessed separately alongside the consumer analysis.
KEY FINDINGS
  1. Fuel and retail payment reached around 3% of eligible drivers, and usage did not improve with interface changes because the existing alternative already worked perfectly well for everybody.
  2. Charging carried 58% of all transactions on a fraction of the promotional spend, because the alternative there was genuinely difficult rather than merely a few seconds slower.
  3. Merchant of record status was producing about 0.9% of value against fraud, chargeback and compliance costs that consumed considerably more than that in every market examined.
  4. Merchant placement was worth roughly 7.4 times transaction commission on identical purchases, and the group had never once priced or sold it separately to anybody.
CLIENT PROFILE
A European vehicle manufacturer operating connected services across several brands and more than twenty markets, with annual group revenue reported at approximately USD 68 billion (client-reported, unverified by MMA). In-car payment had launched three years earlier covering fuel, parking and charging, with the manufacturer acting as merchant of record across all three of those categories.
STRATEGIC CHALLENGE
Usage was far below the launch business case in every category except charging, and the payment operation was losing money once fraud and compliance costs were included honestly. Management could not establish whether the problem was the interface, the merchant coverage, or something more fundamental about the proposition itself. Nobody had tested it.
MMA APPROACH
MMA analysed transaction data by category against the friction each one actually removed, quantified fraud, chargeback and compliance cost against retained commission, and priced merchant referral against transaction economics using placement rates from comparable digital channels rather than from payment benchmarks. Fleet operator requirements were assessed separately alongside the consumer analysis.
KEY FINDINGS
  1. Fuel and retail payment reached around 3% of eligible drivers, and usage did not improve with interface changes because the existing alternative already worked perfectly well for everybody.
  2. Charging carried 58% of all transactions on a fraction of the promotional spend, because the alternative there was genuinely difficult rather than merely a few seconds slower.
  3. Merchant of record status was producing about 0.9% of value against fraud, chargeback and compliance costs that consumed considerably more than that in every market examined.
  4. Merchant placement was worth roughly 7.4 times transaction commission on identical purchases, and the group had never once priced or sold it separately to anybody.
RECOMMENDED STRATEGY
Phase 1: Phase one: transfer merchant of record status to a payment platform immediately and retain only the customer relationship and the transaction data. Phase 2: Phase two: stop funding fuel and retail commerce entirely and redirect the whole effort to charging authentication and parking access instead. Phase 3: Phase three: build a merchant placement offer priced on customer acquisition and sell it to charging networks, fuel brands and retailers directly.
OUTCOME
Within ten months the client had transferred payment liability, closed two of the commerce categories entirely, and reported connected commerce contribution moving from an outright loss to a positive 14% margin (client-reported, unverified by MMA). Merchant placement revenue now exceeds all of the transaction commission combined.

Frequently Asked Questions

Foundational context covering the market sizes, CAGR, scope, country, region and competition that inform every finding below. This section is provided to cover basics and most often pre-purchase conversations, answered from the MMA Primary Research Dataset.

What is the current size of the In Vehicles Payment Market?

The market was valued at USD 0.9 billion in 2025 and reaches USD 1.05 billion in 2026. Charging authentication rather than retail commerce accounts for most of that activity.

How large will the In Vehicles Payment Market be by 2036?

MMA forecasts USD 4.96 billion by 2036, an increase of USD 3.91 billion over the 2026 base. That represents an expansion multiple of 4.72 times.

What is the CAGR for the In Vehicles Payment Market 2026 to 2036?

The base case CAGR is 16.8%, with a bull case of 18.0% and a bear case of 15.6%. The historical rate between 2020 and 2025 was 15.6%.

Which segment is growing fastest?

Charging authentication and payment grows at 25.2%, half again the market rate of 16.8%. It is the only category where the existing alternative was genuinely difficult.

Who are the major companies in the In Vehicles Payment Market?

Visa, Mercedes-Benz Mobility, Mastercard, P97 Networks and Parkopedia lead on measured transaction value enabled. Together they account for roughly 36% of a fragmented global market.

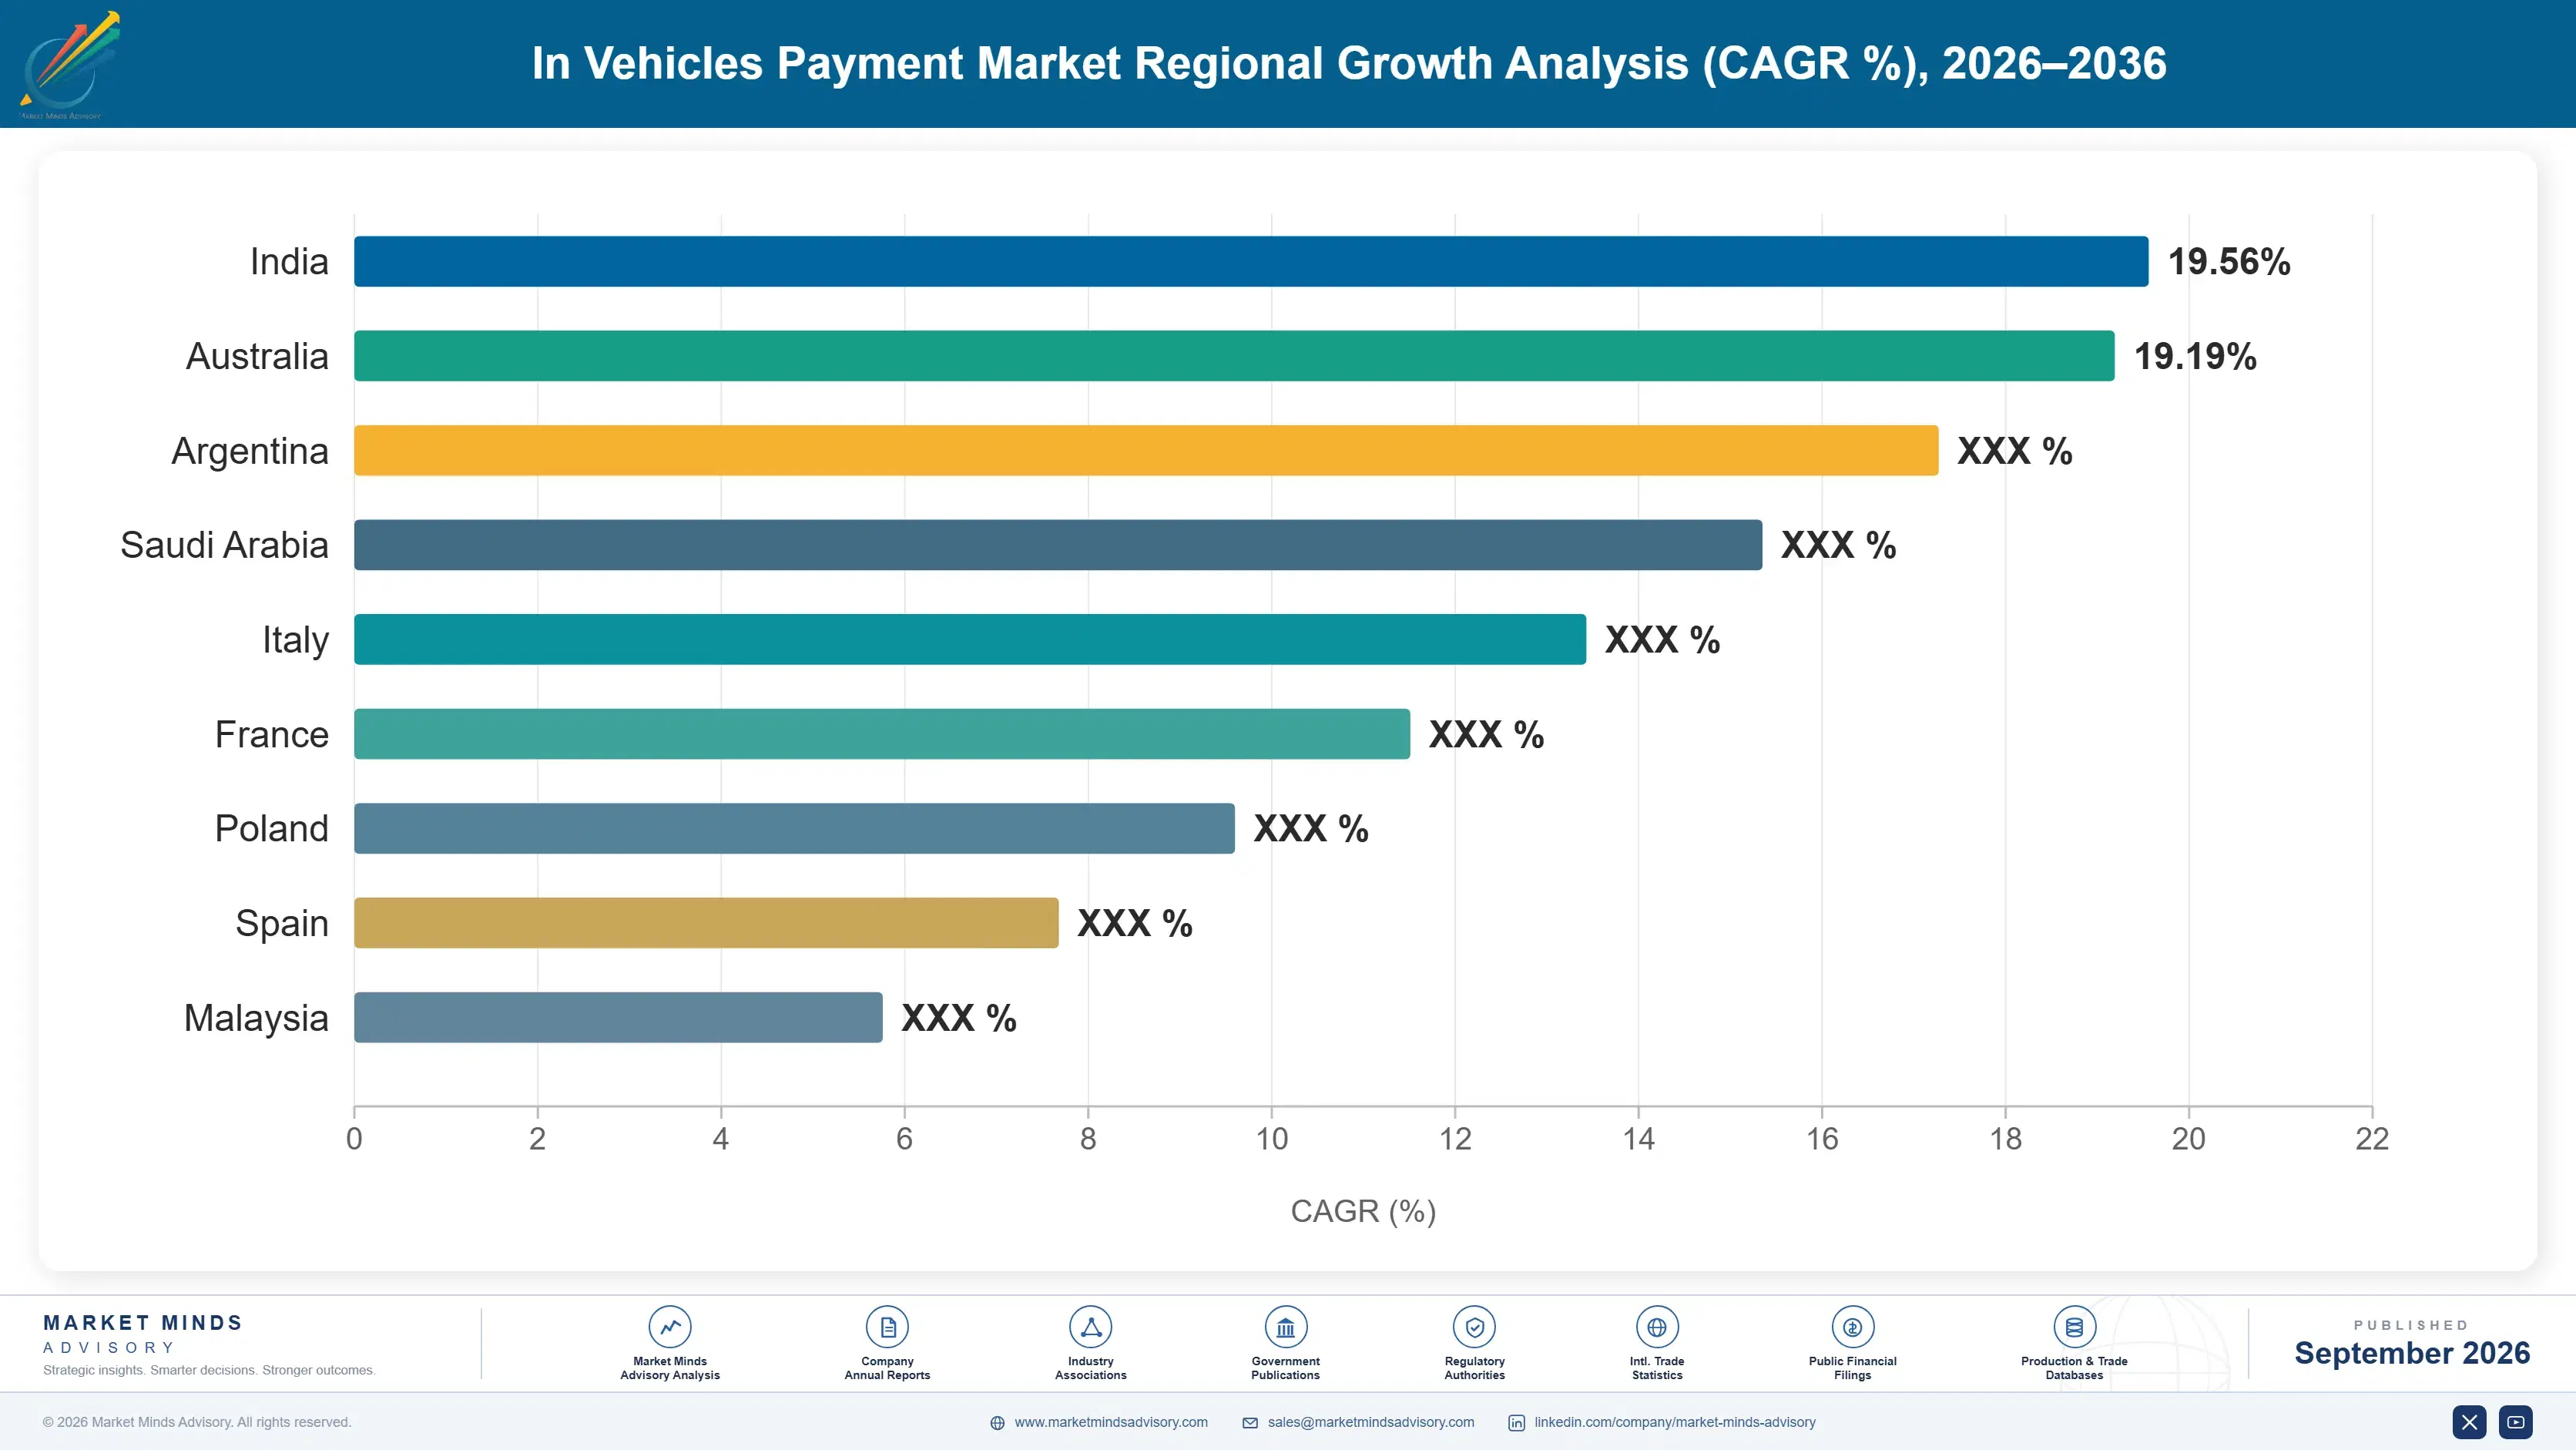
Which country is growing fastest?

Norway grows fastest at 27.6%, because electric vehicles dominate new sales there and public charging is a routine weekly activity rather than an exceptional one.

Report Segmentation Architecture

The full report scope spans multiple orthogonal segmentation dimensions, with cross-tabulated demand data provided for each dimension pair. Coverage extends further to regional breakdowns, trend trajectories, and the competitive detail needed to support segment-level decision-making.

By Transaction Category

  • Charging Authentication and Payment
  • Parking Payment and Access
  • Tolling and Road Charging
  • Fuel Purchase
  • Drive-Through and Retail Commerce
  • In-Car Subscription and Feature Purchase

By End-Use Industry

  • Passenger Vehicle Owners
  • Commercial and Delivery Fleets
  • Charging Network Operators
  • Fuel Retail Networks
  • Parking and Mobility Operators
  • Toll and Road Authorities

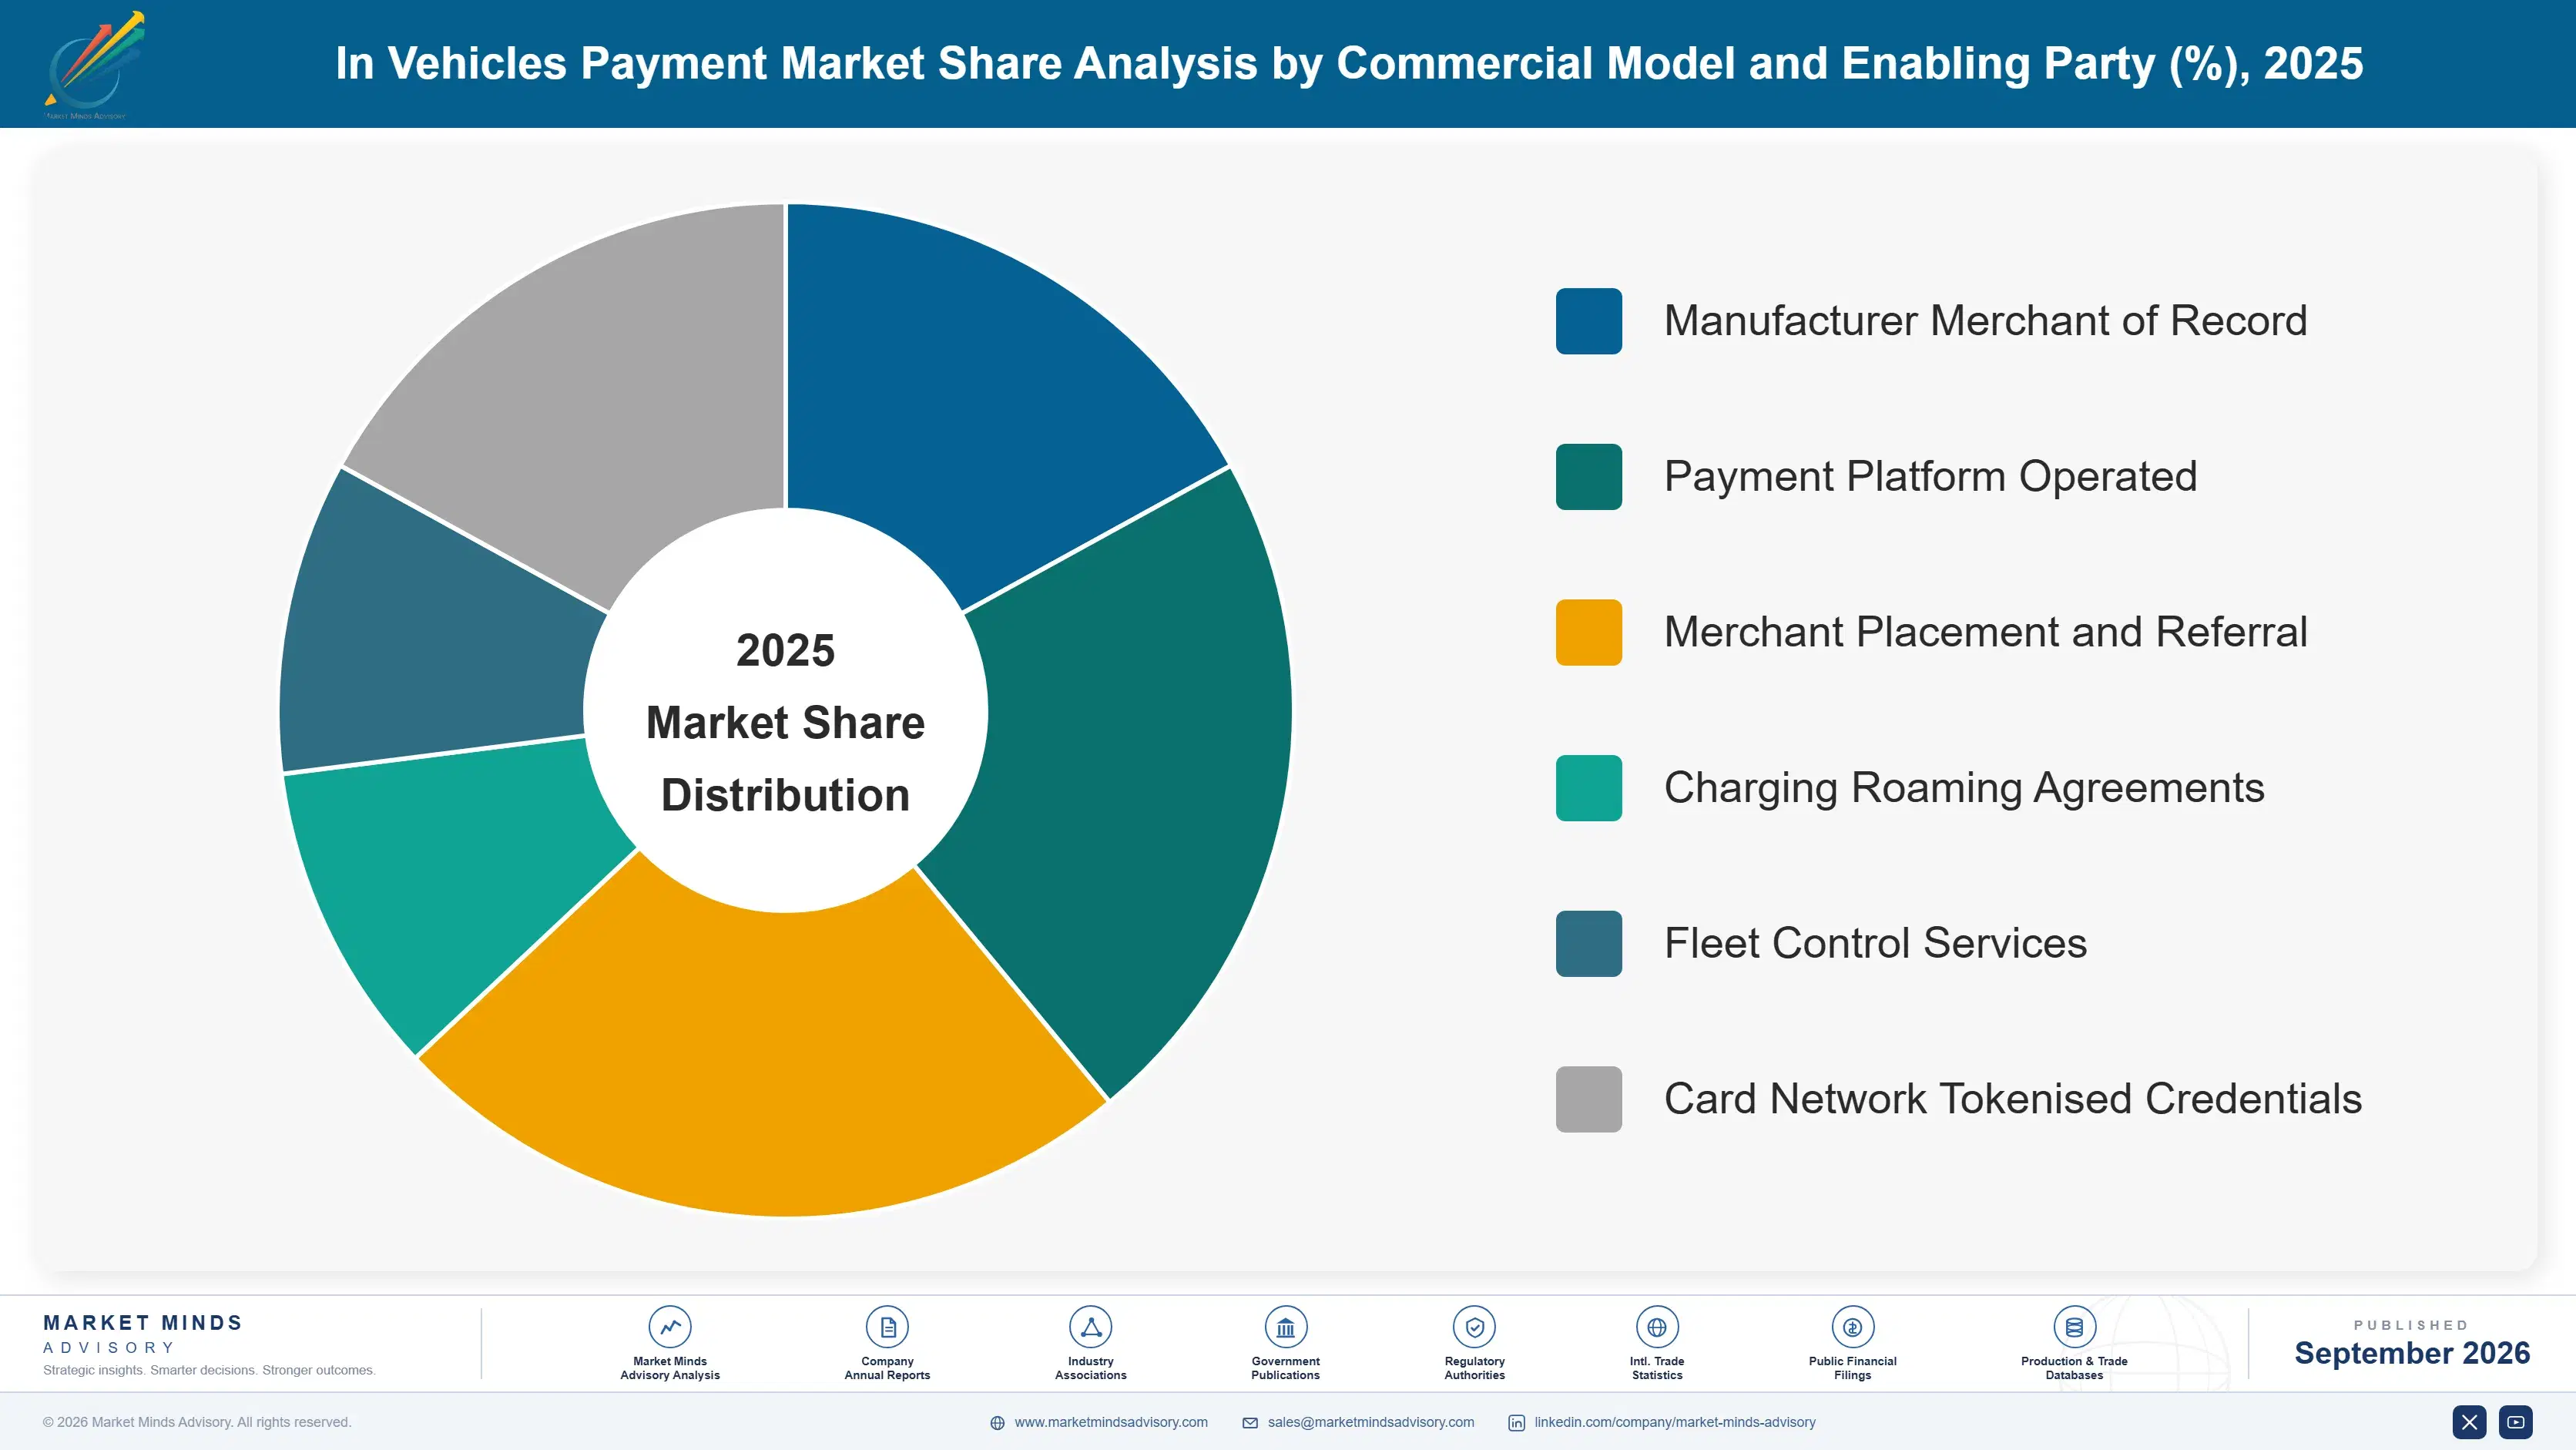
By Commercial Model and Enabling Party

  • Manufacturer Merchant of Record
  • Payment Platform Operated
  • Merchant Placement and Referral
  • Charging Roaming Agreements
  • Fleet Control Services
  • Card Network Tokenised Credentials

By Region

  • East Asia
  • Western Europe
  • North America
  • South Asia and Pacific
  • Middle East and Africa
  • Latin America
  • Eastern Europe

Scope, Methodology, and Coverage

Every figure in this report is reproducible from documented input assumptions. The scope below maps the historical period, the forecast horizon, the segmentation dimensions, and the countries covered, alongside the underlying primary and qualitative methodology.
Historical Period
2020 to 2025
Forecast Period
2026 to 2036
Base Year
2025 (USD billions; MMA Primary Research Dataset, September 2026)
Market Definition
The in-vehicle payment market covers transaction initiation, authentication and settlement performed from a vehicle's own systems rather than from a driver's phone or card, spanning charging authentication and payment, parking payment and access, tolling and road charging, fuel purchase, drive-through and retail commerce, and in-car subscription and feature purchase. Sizing is measured at platform, service and commission revenue earned by participants. Card issuance, general mobile wallet transactions, fleet fuel cards, telematics insurance and vehicle finance are excluded.
Quantitative Units
USD millions at participant platform, service and commission revenue, with supporting transaction counts and enabled vehicle parc by region
Segmentation Dimensions
Transaction category, end-use industry, commercial model and enabling party, region
Regions Covered
East Asia, Western Europe, North America, South Asia and Pacific, Middle East and Africa, Latin America, Eastern Europe
Countries Covered
China, Japan, South Korea, India, Australia, Singapore, Norway, Germany, Netherlands, United Kingdom, France, Poland, United States, Canada, Mexico, Brazil, United Arab Emirates, Saudi Arabia
Key Companies Profiled
Visa, Mercedes-Benz Mobility, Mastercard, P97 Networks, Parkopedia, Stellantis, General Motors, Hyundai Motor Company, BMW Group, Toyota Motor Corporation, Shell, BP Pulse, Ryd, Hubject, ChargePoint, Bosch, Continental, Amazon, Alipay, Adyen
Quantitative Methodology
Primary survey, n=3,800 respondents, Q4 2025, six countries; demand-side model with trade association cross-validation
Qualitative Methodology
47 expert interviews, Q4 2025; applied to validate demand model assumptions, identify emerging dynamics, and assess competitive positioning
Report Format
PDF and XLSX data workbook (Word format preview document)
Publisher
Market Minds Advisory
Report Code
MMA-2026-AUT-121
Published
September 2026
Contact
sales@marketmindsadvisory.com | www.marketmindsadvisory.com

Purchase the full In Vehicles Payment Market Report (2026 to 2036).

The full report separates categories with genuine friction from categories with mild inconvenience, which is the distinction that explains why a decade of announcements produced adoption in exactly one place. It sizes six transaction categories with individual growth rates, seven regions built from connected parc and charging network structure, and the referral economics that exceed transaction commission several times over. Competitive analysis covers twenty participants on a consistent transaction value basis, with vehicle installed base and merchant relationships treated as the decisive variables. Input cost modelling breaks out processing, fraud and compliance exposure by liability structure.
Six transaction categories with individual growth rates
Take-up compared against friction actually removed
Referral economics measured against transaction commission
Liability structures compared across participant types
Twenty participants on consistent transaction value basis
Processing, fraud and compliance cost exposure

Built For The People Who Decide

From boardroom strategy to bench-side execution, this report is read cover-to-cover by leaders shaping the next decade of their industry, turning demand scenarios, market dynamics and valuation benchmarks into decisions.
CXOs/ Presidents/ VPs/ Managers
M&A and Corporate Development
Strategy Teams and R&D Heads
Procurement and Product Directors
Regulatory and Compliance Leaders
Investor Relations and Equity Analysts