Market Minds Advisory
In-flight Internet Market

In-flight Internet Market: In-flight Internet Market: Free Service Economics, Orbit Displacement and Certification Friction, 2026 to 2036

Airlines stopped selling connectivity and started buying it, which turned a revenue line into a consumption cost and made delivered price per gigabyte the only number that now matters to anybody.

Lead Analyst

Published

September 2026

Make Smarter Decisions with Customized Research Insights

Request a free sample report and evaluate market opportunities, growth trends, and competitive dynamics relevant to your business needs.

2025 MARKET VALUE$4.2BMarket Size 2025
2036 FORECAST VALUE$14.1BBase Case , 2026 to 2036
CAGR 2026 TO 203611.6 %Bull 12.8% / Bear 10.4%
INCREMENTAL OPPORTUNITY$9.4BNet 10- year value creation
EXPANSION MULTIPLE3.00x2036 value over 2026 base
Strategic Levers
M&A Pipeline
Regional Outlook
Country Rankings
Competitive Intelligence
Segmental Deep-dive
Call-Us : 91 93563 13602

Executive Snapshot and Market Trajectory.

The commercial model inverted and almost every assumption inverted with it. Airlines spent two decades selling wifi to passengers who mostly refused, and now give it away, which took take-up past 54% and turned the airline from a reseller into a buyer of bulk capacity. Nobody modelled that reversal.
That makes delivered cost per gigabyte the whole question, currently around USD 12 to the aircraft, and it arrived exactly as low earth orbit constellations cut that cost by an order of magnitude while removing the latency that made video calling impossible. Constellation services grow at 17.4%, half again the market rate of 11.6%, and geostationary capital committed against fifteen year satellite lives became uncompetitive overnight. Capital committed for fifteen years cannot be repriced.
Five providers hold 76% of measured service revenue, and what protects the incumbents is not commercial terms but aircraft certification. Approving an antenna on a type takes around 24 months and installation removes the aircraft from service for about 4 days, so switching costs schedule rather than money. That friction has kept business with providers beaten on price for years. Schedule rather than money is the switching cost here.
Market Definition
The in-flight internet market covers broadband connectivity services delivered to commercial passenger aircraft in flight together with the onboard equipment enabling them, spanning geostationary Ku-band and Ka-band services, low earth orbit constellation services, multi-orbit hybrid services, air-to-ground network services, and onboard systems and antenna hardware. Sizing is measured at service and equipment revenue. Business and general aviation connectivity, maritime and land mobility services, inflight entertainment content, cabin systems without connectivity and satellite construction are excluded.
Base Year Value
$4.2B in 2025 (MMA Primary Research Dataset, September 2026)
Forecast Period
2026 to 2036, eleven discrete annual values
CAGR
11.6% base case. Bull 12.8%. Bear 10.4%.
Fastest Growth Segment
Low Earth Orbit Constellation Services: 17.4% CAGR
Fastest Growth Country
India: 19.6% CAGR
Fastest Growth Region
South Asia and Pacific: 14.0% CAGR
Largest Region
North America: 34% of 2025 global value
Market Leaders
Viasat, Starlink Aviation, Panasonic Avionics, SES, Gogo. Source: MMA Analysis based on company annual reports and measured service and equipment revenue.
Primary Survey
n=3,800 procurement and R&D decision-makers, Q4 2025, six countries
Methodology
Demand-side build-up, cross-validated against public data, 47 expert interviews

In-flight Internet Market Forecast Scenarios

in-flight-internet-market-size-forecast-scenario-1788415753433
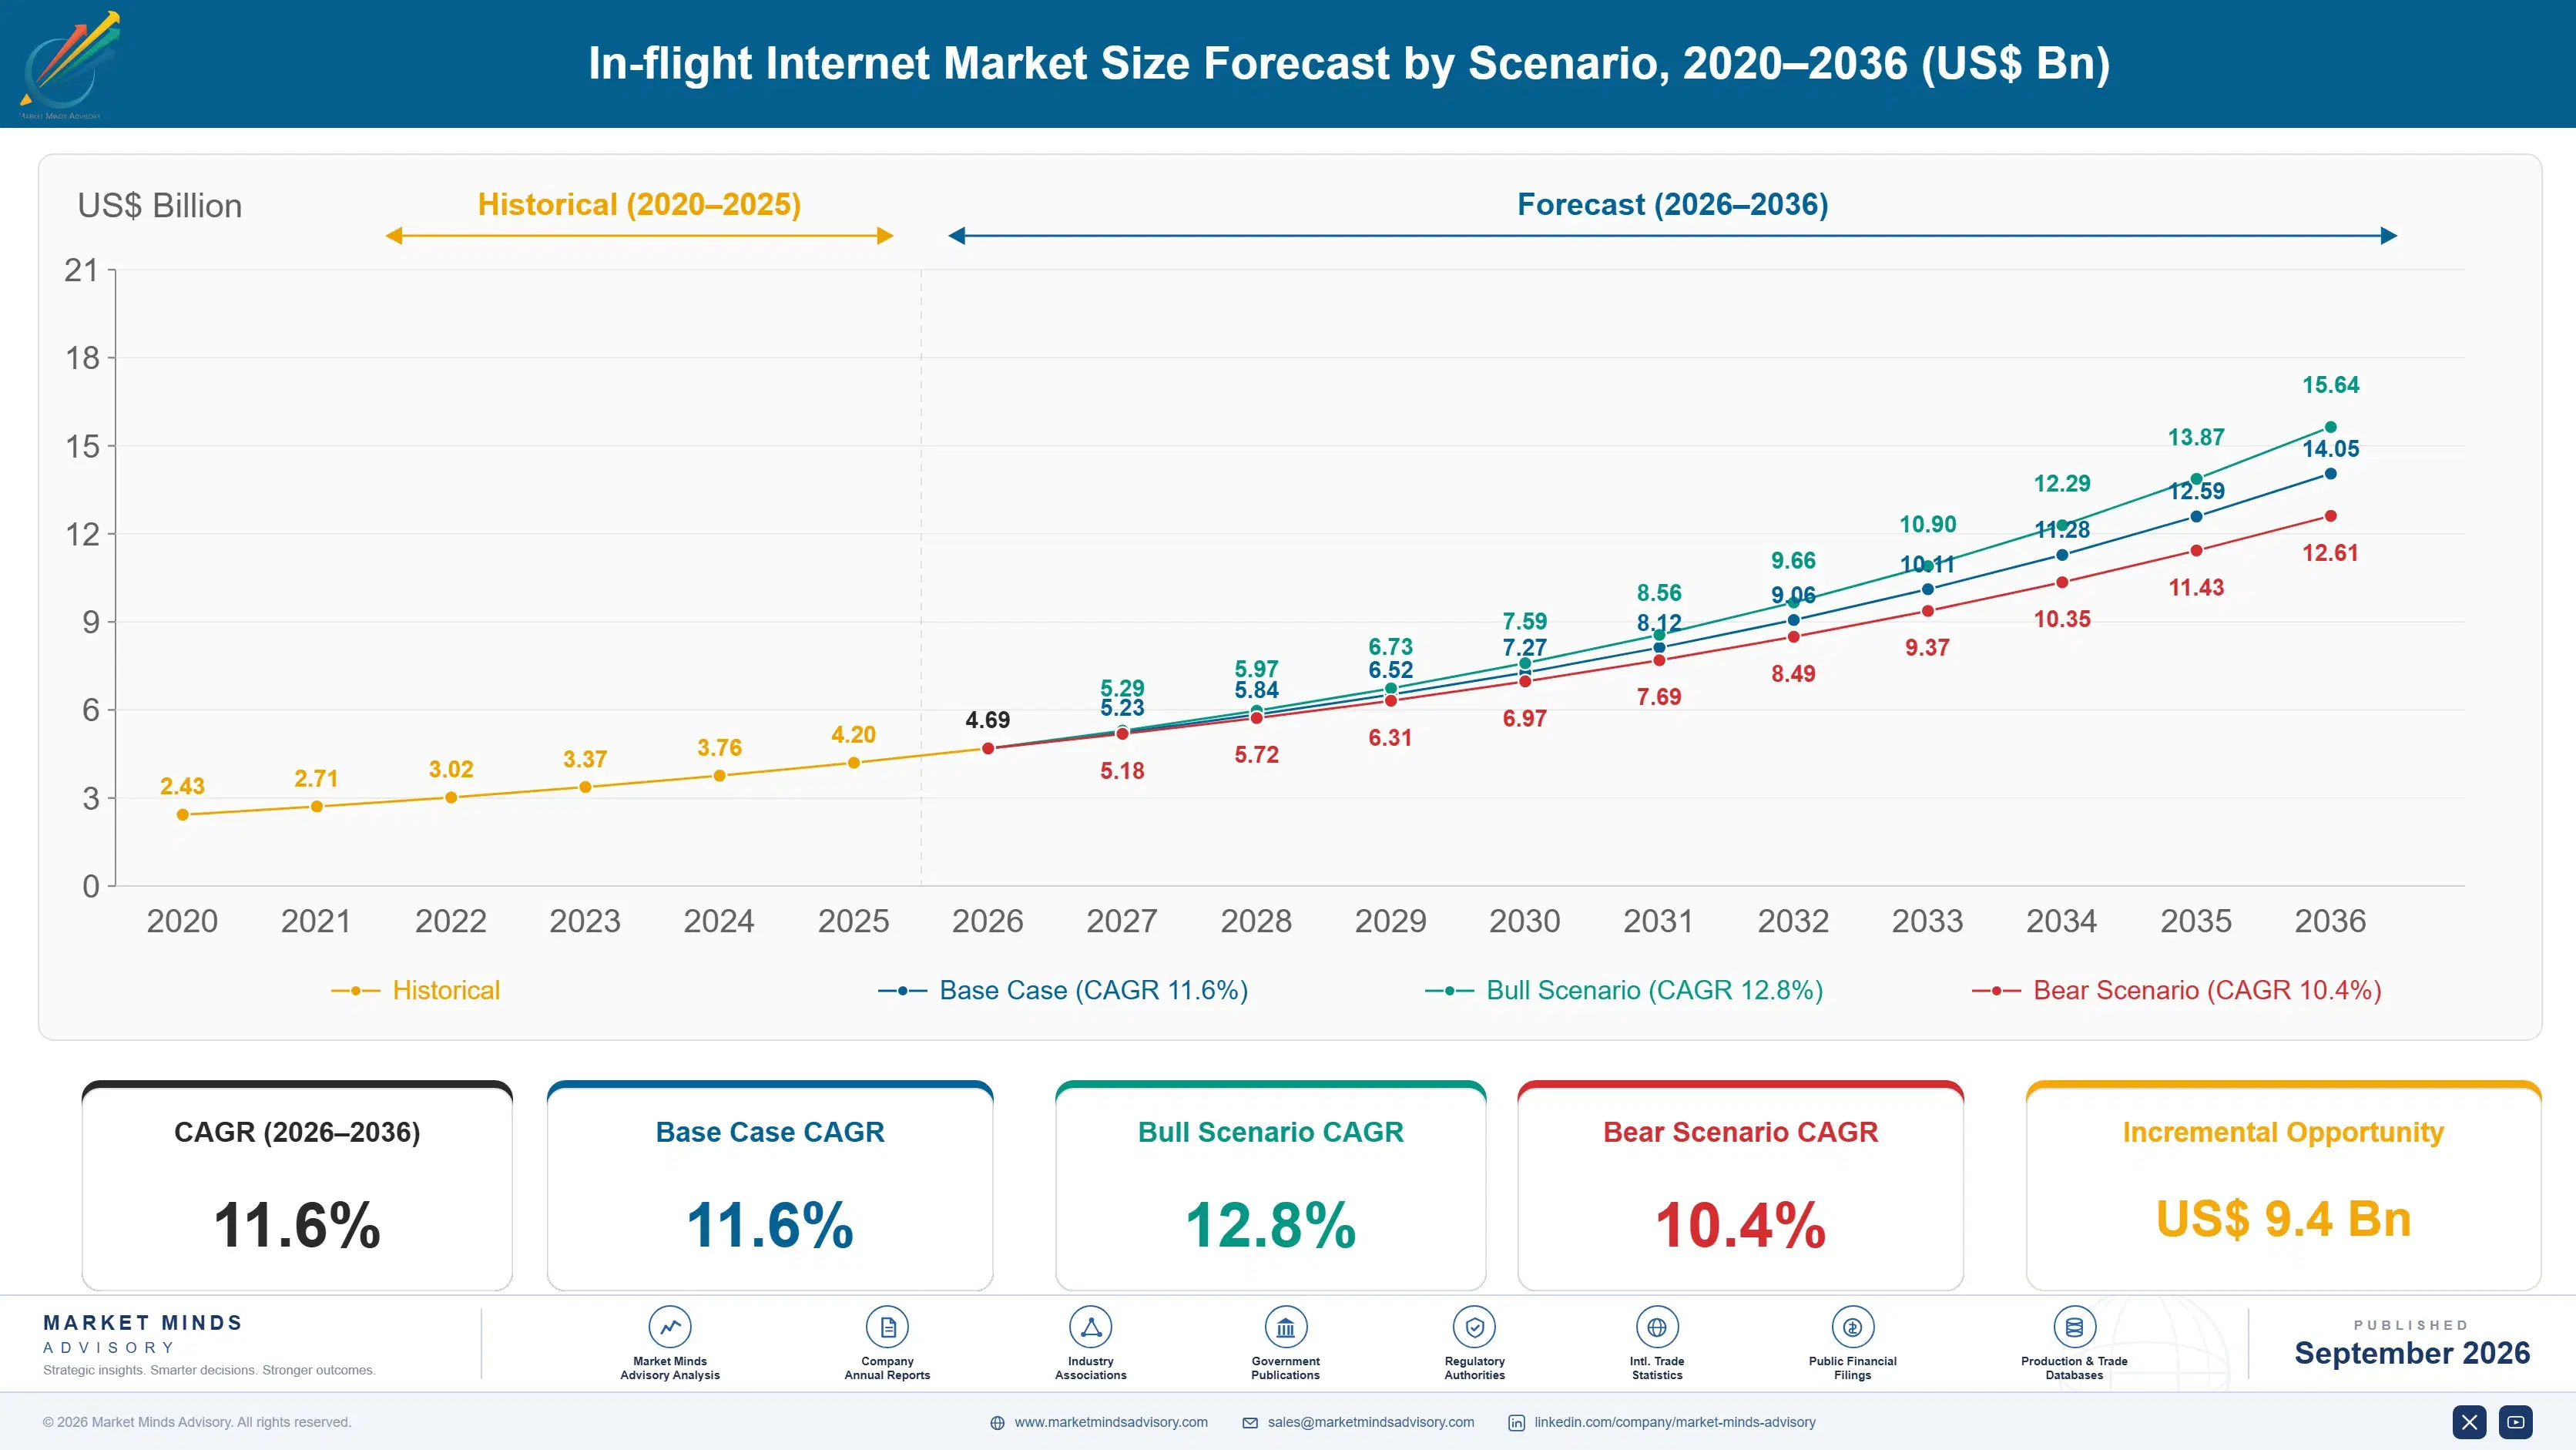
Between 2020 and 2025 the market compounded at 10.4% across a period that began with aircraft parked and ended with connectivity treated as a competitive necessity. The change of substance was commercial rather than technical. Carriers that made connectivity free discovered take-up rising several times over, which converted a modest ancillary revenue line into a substantial and growing cost line that finance functions began examining closely.
The 11.6% base case rests on three commercial mechanisms. Free service is spreading across fleets because a carrier whose competitor offers it cannot easily charge, and each conversion multiplies data consumption rather than adding a little to it. Constellation capacity has cut delivered cost enough that serving that consumption is affordable. And connectivity is moving from passenger amenity into operational systems carrying engine data, flight bag updates and crew applications on the same equipment.
The bull case is operational and safety-adjacent traffic growing enough that connectivity becomes a fleet system procured on reliability rather than a cabin amenity procured on price. The bear case is capacity pricing falling faster than consumption grows, which would shrink service revenue in a market where volume expands while the value of each gigabyte carried collapses beneath it.

Free Wifi Made The Airline The Customer

Connectivity was sold to passengers for twenty years and most of them declined, because it was slow, expensive and unreliable enough that paying felt foolish. Airlines making it free found take-up rising past 54%, which is the outcome everybody wanted and the commercial reversal nobody modelled. The carrier stopped earning a small ancillary margin and started buying bulk capacity to serve consumption it had actively encouraged.
TOP FIVE CONCENTRATION76%Share of measured service revenue held by leading providers
TAKE-UP UNDER FREE SERVICE54%Portion of passengers connecting when the service is free
CERTIFICATION DURATION24 monthsTime to certify an antenna on a new aircraft type
INSTALLATION DOWNTIME4 daysDays an aircraft is out of service per installation
DELIVERED COST PER GIGABYTEUSD 12Delivered cost of data to the aircraft in flight
EQUIPPED NARROWBODY SHARE61%Portion of narrowbody fleet fitted with broadband connectivity
That put delivered cost per gigabyte, currently around USD 12 to the aircraft, at the centre of every conversation, and it happened just as low earth orbit constellations cut that cost dramatically while removing the latency that made real-time applications impossible. Geostationary operators holding capital committed against satellites with fifteen year design lives found themselves uncompetitive on cost and performance simultaneously, which is a genuine capital destruction event.
What has slowed the resulting reallocation is the aircraft rather than the contract. Certifying an antenna on a type takes around 24 months and the installation removes an aircraft from revenue service for roughly 4 days, which is a schedule cost airlines weigh far more heavily than any monthly service fee. Incumbents beaten decisively on price have therefore retained fleets for years, and will continue to.
"The moment an airline stops charging for wifi it becomes a telecommunications buyer with no telecommunications expertise, negotiating gigabytes against a supplier that understands the cost stack far better than it does. That asymmetry is where most of the value in this market currently sits."
Director, Aviation Connectivity and Satellite Services Practice · MMA Technology and Aviation Practice · September 2026

Market Trends

Free Service Turns Revenue Into A Consumption Cost

A carrier charging for connectivity earns a small margin on modest take-up. A carrier giving it away sees take-up pass 54% and buys bulk capacity to serve every one of those sessions, which converts an ancillary revenue line into an operating cost that scales with passengers carried. Sponsorship through loyalty enrolment or a telecommunications partner offsets some of it and rarely all. Once one carrier on a route offers free service the others cannot easily charge, so the conversion spreads competitively rather than by any individual choice, and the cost follows every carrier that makes it.
Market Impact: Equips 61% of narrowbody fleets
Constellation Capacity Broke The Geostationary Economics

Low earth orbit constellations reduced delivered cost per gigabyte by roughly an order of magnitude and cut latency to a level where video calling and cloud applications work properly in the cabin. Geostationary operators had committed capital against satellites with fifteen year design lives that could not be repriced or redeployed, and found themselves uncompetitive on cost and performance at the same moment. Constellation services grow at 17.4% against a market at 11.6%. The incumbents' response has largely been to resell constellation capacity alongside their own. Incumbents have largely responded by reselling constellation capacity alongside their own.
Market Impact: Grows at 19.6% annually

Market Opportunities and Growth Drivers

Competitive Pressure Spreads Free Service Across Fleets

A carrier whose competitor offers free connectivity on the same route cannot comfortably continue charging, so conversion spreads by competitive necessity rather than by any individual commercial calculation. Narrowbody equipping has reached around 61% of fleets and continues, since short-haul passengers now expect what long-haul passengers received first. Each conversion multiplies data consumption several times over rather than adding to it incrementally. The result is demand growth that has almost nothing to do with passenger numbers and everything to do with commercial positioning. Passenger numbers explain almost none of this growth.
Market Impact: Costs 4 days per aircraft

Indian Fleet Orders Create A Connectivity Market From Nothing

Indian carriers hold among the largest aircraft order books anywhere, and connectivity regulation that once prohibited in-flight service domestically has been resolved, which creates a market where essentially none existed. Growth of 19.6% makes India the fastest growing country in this market. New aircraft arrive with provision fitted at the factory rather than requiring retrofit certification and downtime, which removes the friction that slows conversion in mature fleets. Providers establishing positions now are doing so before the aircraft are delivered. Providers establishing positions now are doing so before the aircraft have even been delivered.
Market Impact: Falls below USD 12 per gigabyte

Market Restraints and Challenges

Certification And Downtime Block Provider Switching

Changing connectivity provider on an existing fleet requires antenna certification on each aircraft type, taking around 24 months, followed by installation removing each aircraft from service for roughly 4 days. The root cause is that anything attached to an aircraft exterior requires airworthiness approval regardless of how commercially straightforward the change appears. Commercial impact is incumbency that survives being beaten on price by a wide margin. Mitigation runs through certifying antennas on common types in advance of any contract, through installation during scheduled heavy maintenance, and through terminals designed to work across multiple networks.
Market Impact: Lifts take-up past 54%

Capacity Pricing Falls Faster Than Consumption Grows

Delivered cost per gigabyte has fallen sharply and continues falling as constellation capacity expands, while consumption grows with take-up but not always fast enough to offset the price decline in revenue terms. The root cause is that satellite capacity is a supply-driven commodity once the constellation exists. Commercial impact is service revenue that can shrink while data carried rises, which providers consistently fail to explain to investors. Participants mitigate by contracting on service levels rather than volume, by bundling operational data services, and by moving toward equipment and managed service revenue.
Market Impact: Cuts cost by 10 times
3 additional market trends, 4 additional growth drivers, and 2 additional restraints and challenges are covered in the full report. Contact sales@marketmindsadvisory.com to access the complete intelligence.

Segment CAGR and Growth Architecture

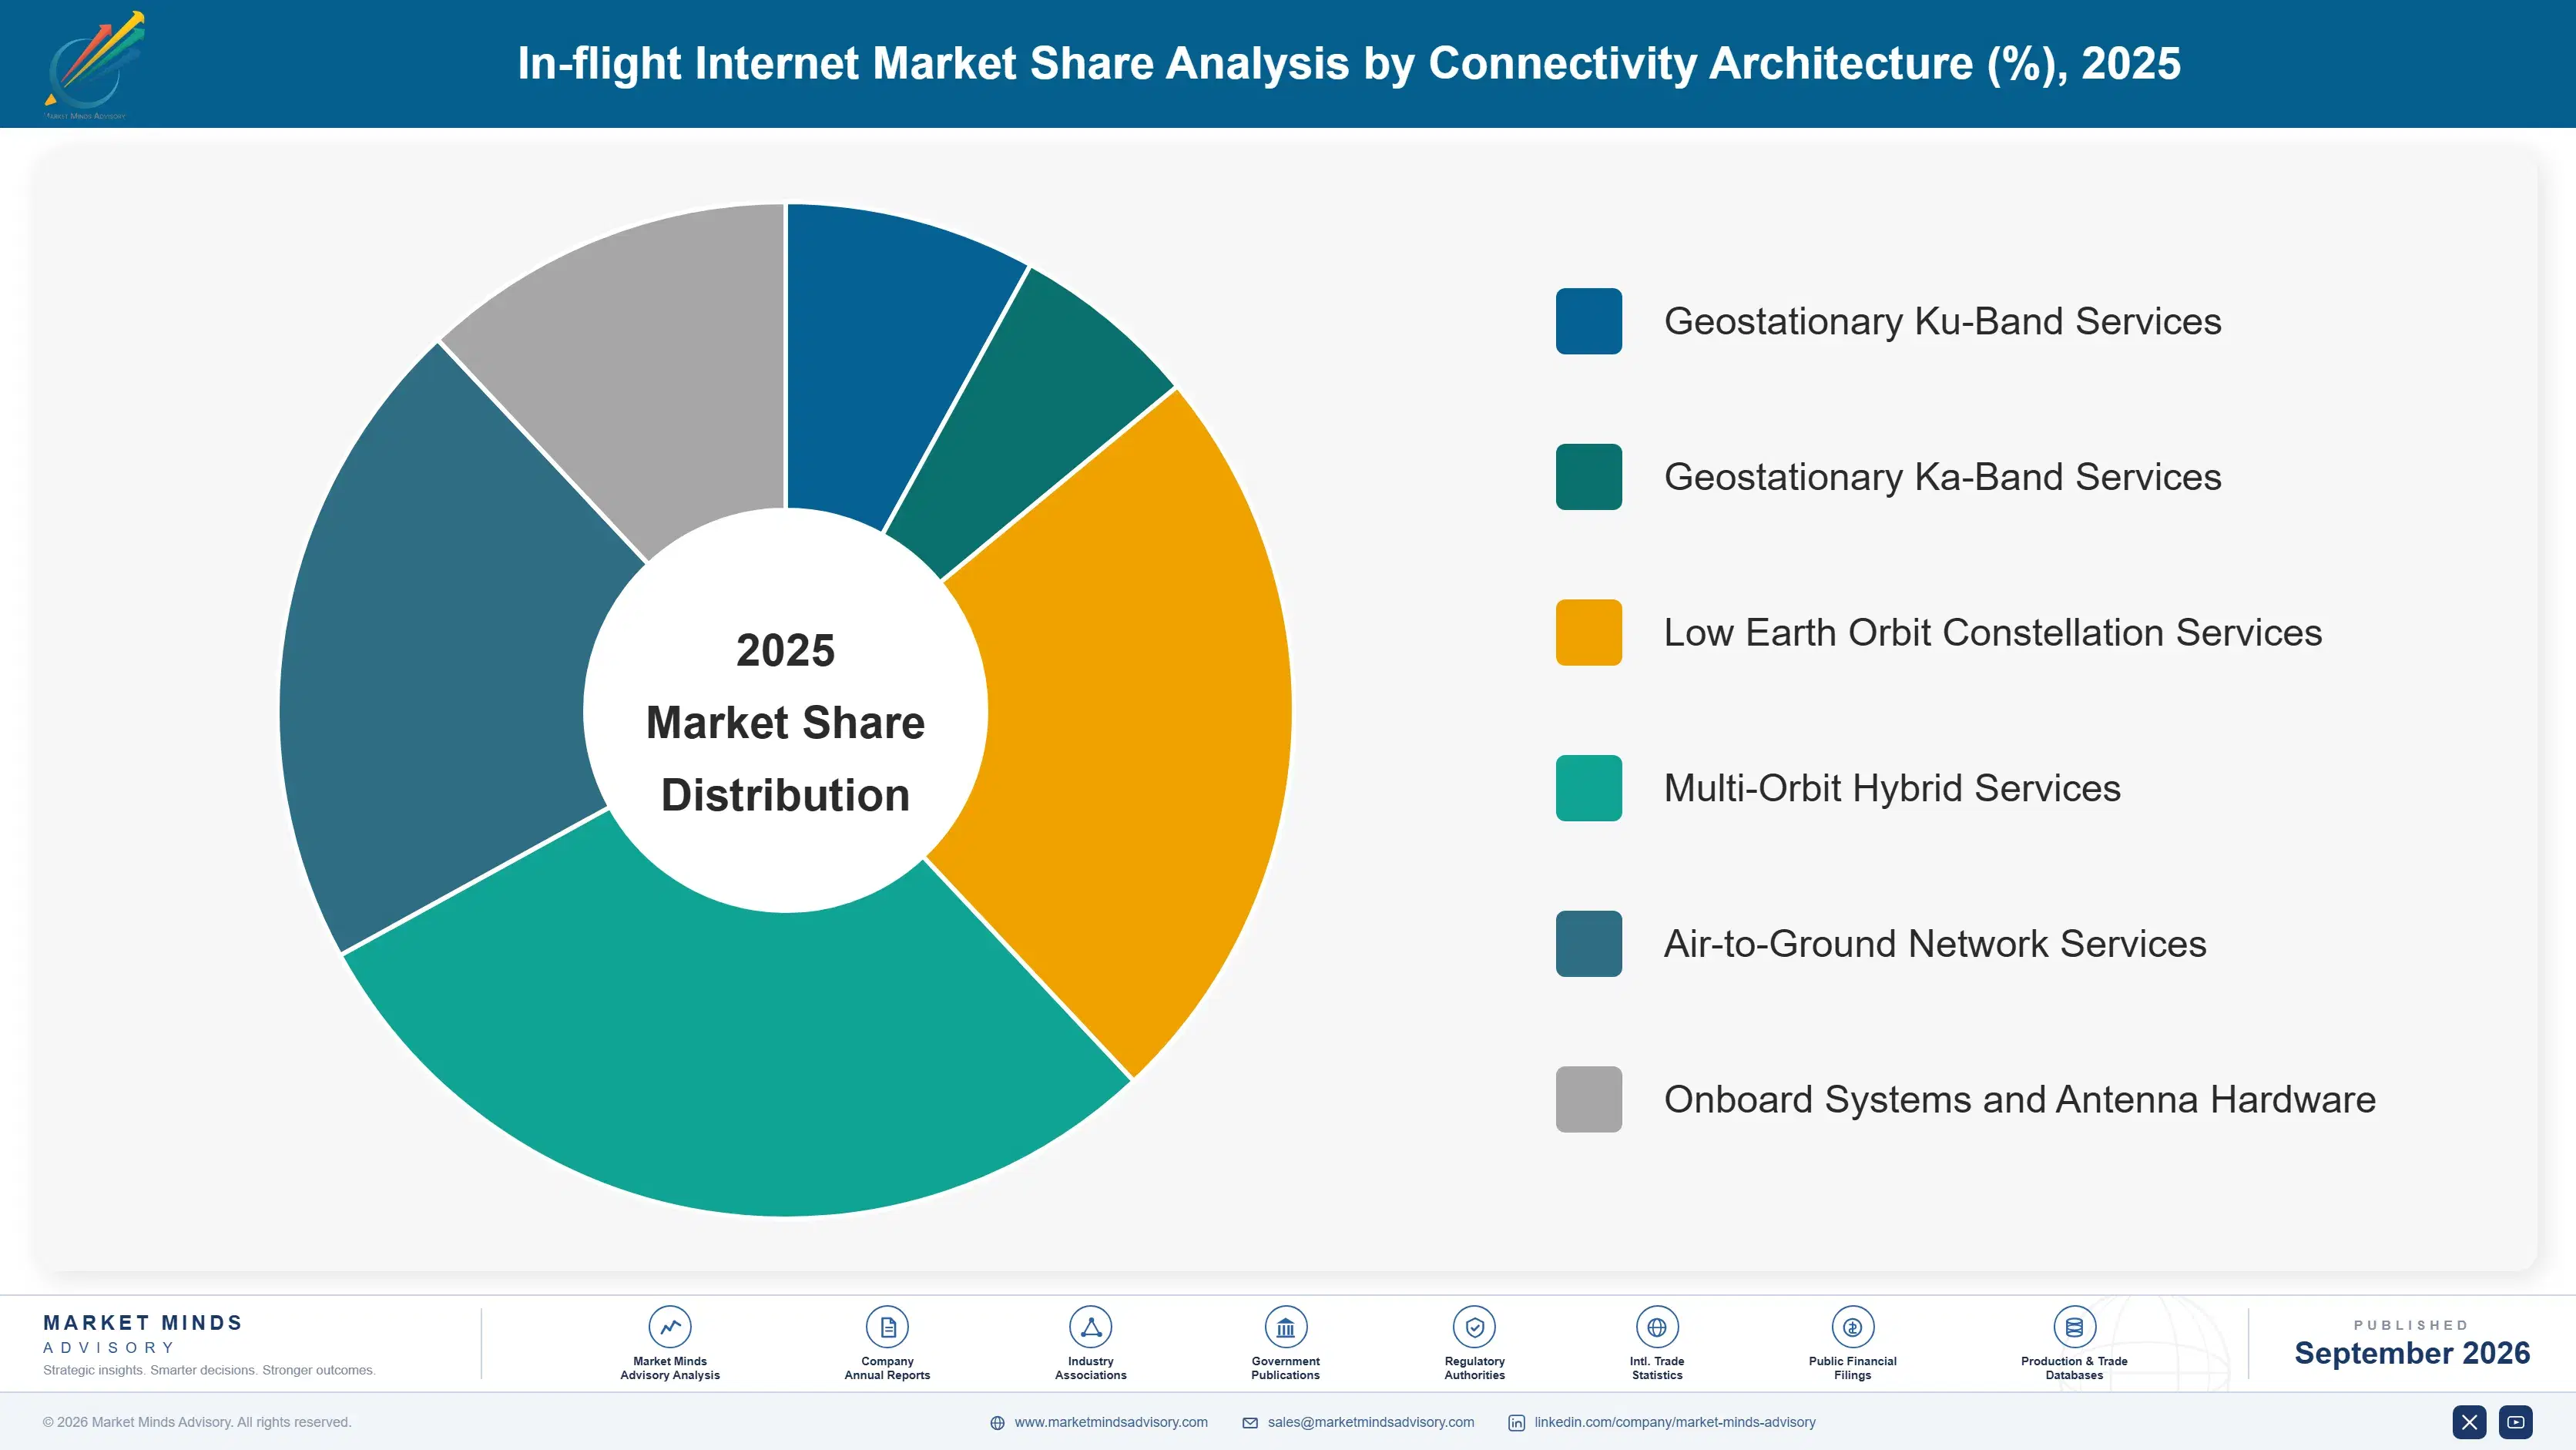
Segmentation follows connectivity architecture, which determines delivered cost, latency, coverage and the antenna required on the aircraft. Geostationary Ku-band and Ka-band, low earth orbit constellations, multi-orbit hybrids, air-to-ground networks and onboard hardware each behave differently, and the divergence between orbits is now the defining feature of this market. Substitution between orbits requires new equipment aboard.
in-flight-internet-market-market-share-analysis-1788415753967

Low Earth Orbit Constellation Services

Constellations reduced delivered cost per gigabyte by roughly an order of magnitude and cut latency to a level where video calls and cloud applications function properly in a cabin, which is what passengers had been promised for a decade and never received. That combination arrived exactly as airlines converted to free service and became buyers of bulk capacity rather than resellers of a premium. Growth at 17.4% is half again the market rate of 11.6%. Antenna certification remains the practical constraint on how fast fleets can actually convert, which is why adoption lags the commercial logic by years rather than quarters. Adoption lags the commercial logic by years rather than by quarters.
CAGR 17.4%

Multi-Orbit Hybrid Services

Hybrid services combine geostationary and low earth orbit capacity through a terminal able to work with both, which lets a provider use whichever is cheaper or better at any moment and gives an airline redundancy across independent networks. That matters more as connectivity carries operational traffic where an outage has consequences beyond passenger complaint. Growth at 15.0% reflects incumbents reselling constellation capacity alongside their own rather than conceding the market. Terminal cost and complexity are higher, and the commercial logic depends on capacity pricing differences that may not persist as constellations mature. Redundancy across independent networks matters more as connectivity carries operational traffic where an outage has consequences beyond passenger complaint.
CAGR 15.0%
Full segment breakdown across 6 segments available in the complete report.

Regional Architecture and Country Demand Map

Demand follows equipped fleet size and route length rather than passenger numbers or economic size. North America holds the largest equipped narrowbody fleet and adopted free service earliest, which put it ahead of markets with more passengers. Passenger volume is a poor guide to any of it.

North America

The largest equipped narrowbody fleet anywhere sits here and the free service model originated with carriers competing on it directly, which puts the region at 34%, above the standard band ceiling of 32%. Domestic route structures with high frequency and short sectors made connectivity a visible differentiator between carriers flying identical aircraft on identical routes. Air-to-ground networks developed here and still carry meaningful traffic. Fleet-wide conversion decisions taken by the largest carriers move a substantial share of world demand in a single announcement. Fleet-wide conversion decisions taken by the largest carriers move a substantial share of world demand in a single announcement, which makes the region unusually lumpy. Air-to-ground networks developed here and still carry meaningful traffic.
Share: 34% | CAGR: 10.6% (2026 to 2036)

South Asia and Pacific

Indian carriers hold among the largest aircraft order books in the world and domestic connectivity regulation has been resolved, creating a market from essentially nothing, and India grows at 19.6%, faster than any country here; the region at 20% therefore sits well above the standard band ceiling of 12%. New aircraft arriving with factory-fitted provision avoid retrofit friction entirely. Australian and Southeast Asian carriers are equipping steadily. Long overwater sectors across the region make satellite coverage rather than ground networks the only viable option available. Long overwater sectors across the region make satellite coverage rather than any ground network the only viable option available to carriers operating there. Australian and Southeast Asian carriers are equipping steadily alongside.
Share: 20% | CAGR: 14.0% (2026 to 2036)
Regional intelligence for 5 additional markets available in the complete report: Western Europe, Middle East and Africa, East Asia, Latin America, Eastern Europe. Contact sales@marketmindsadvisory.com.
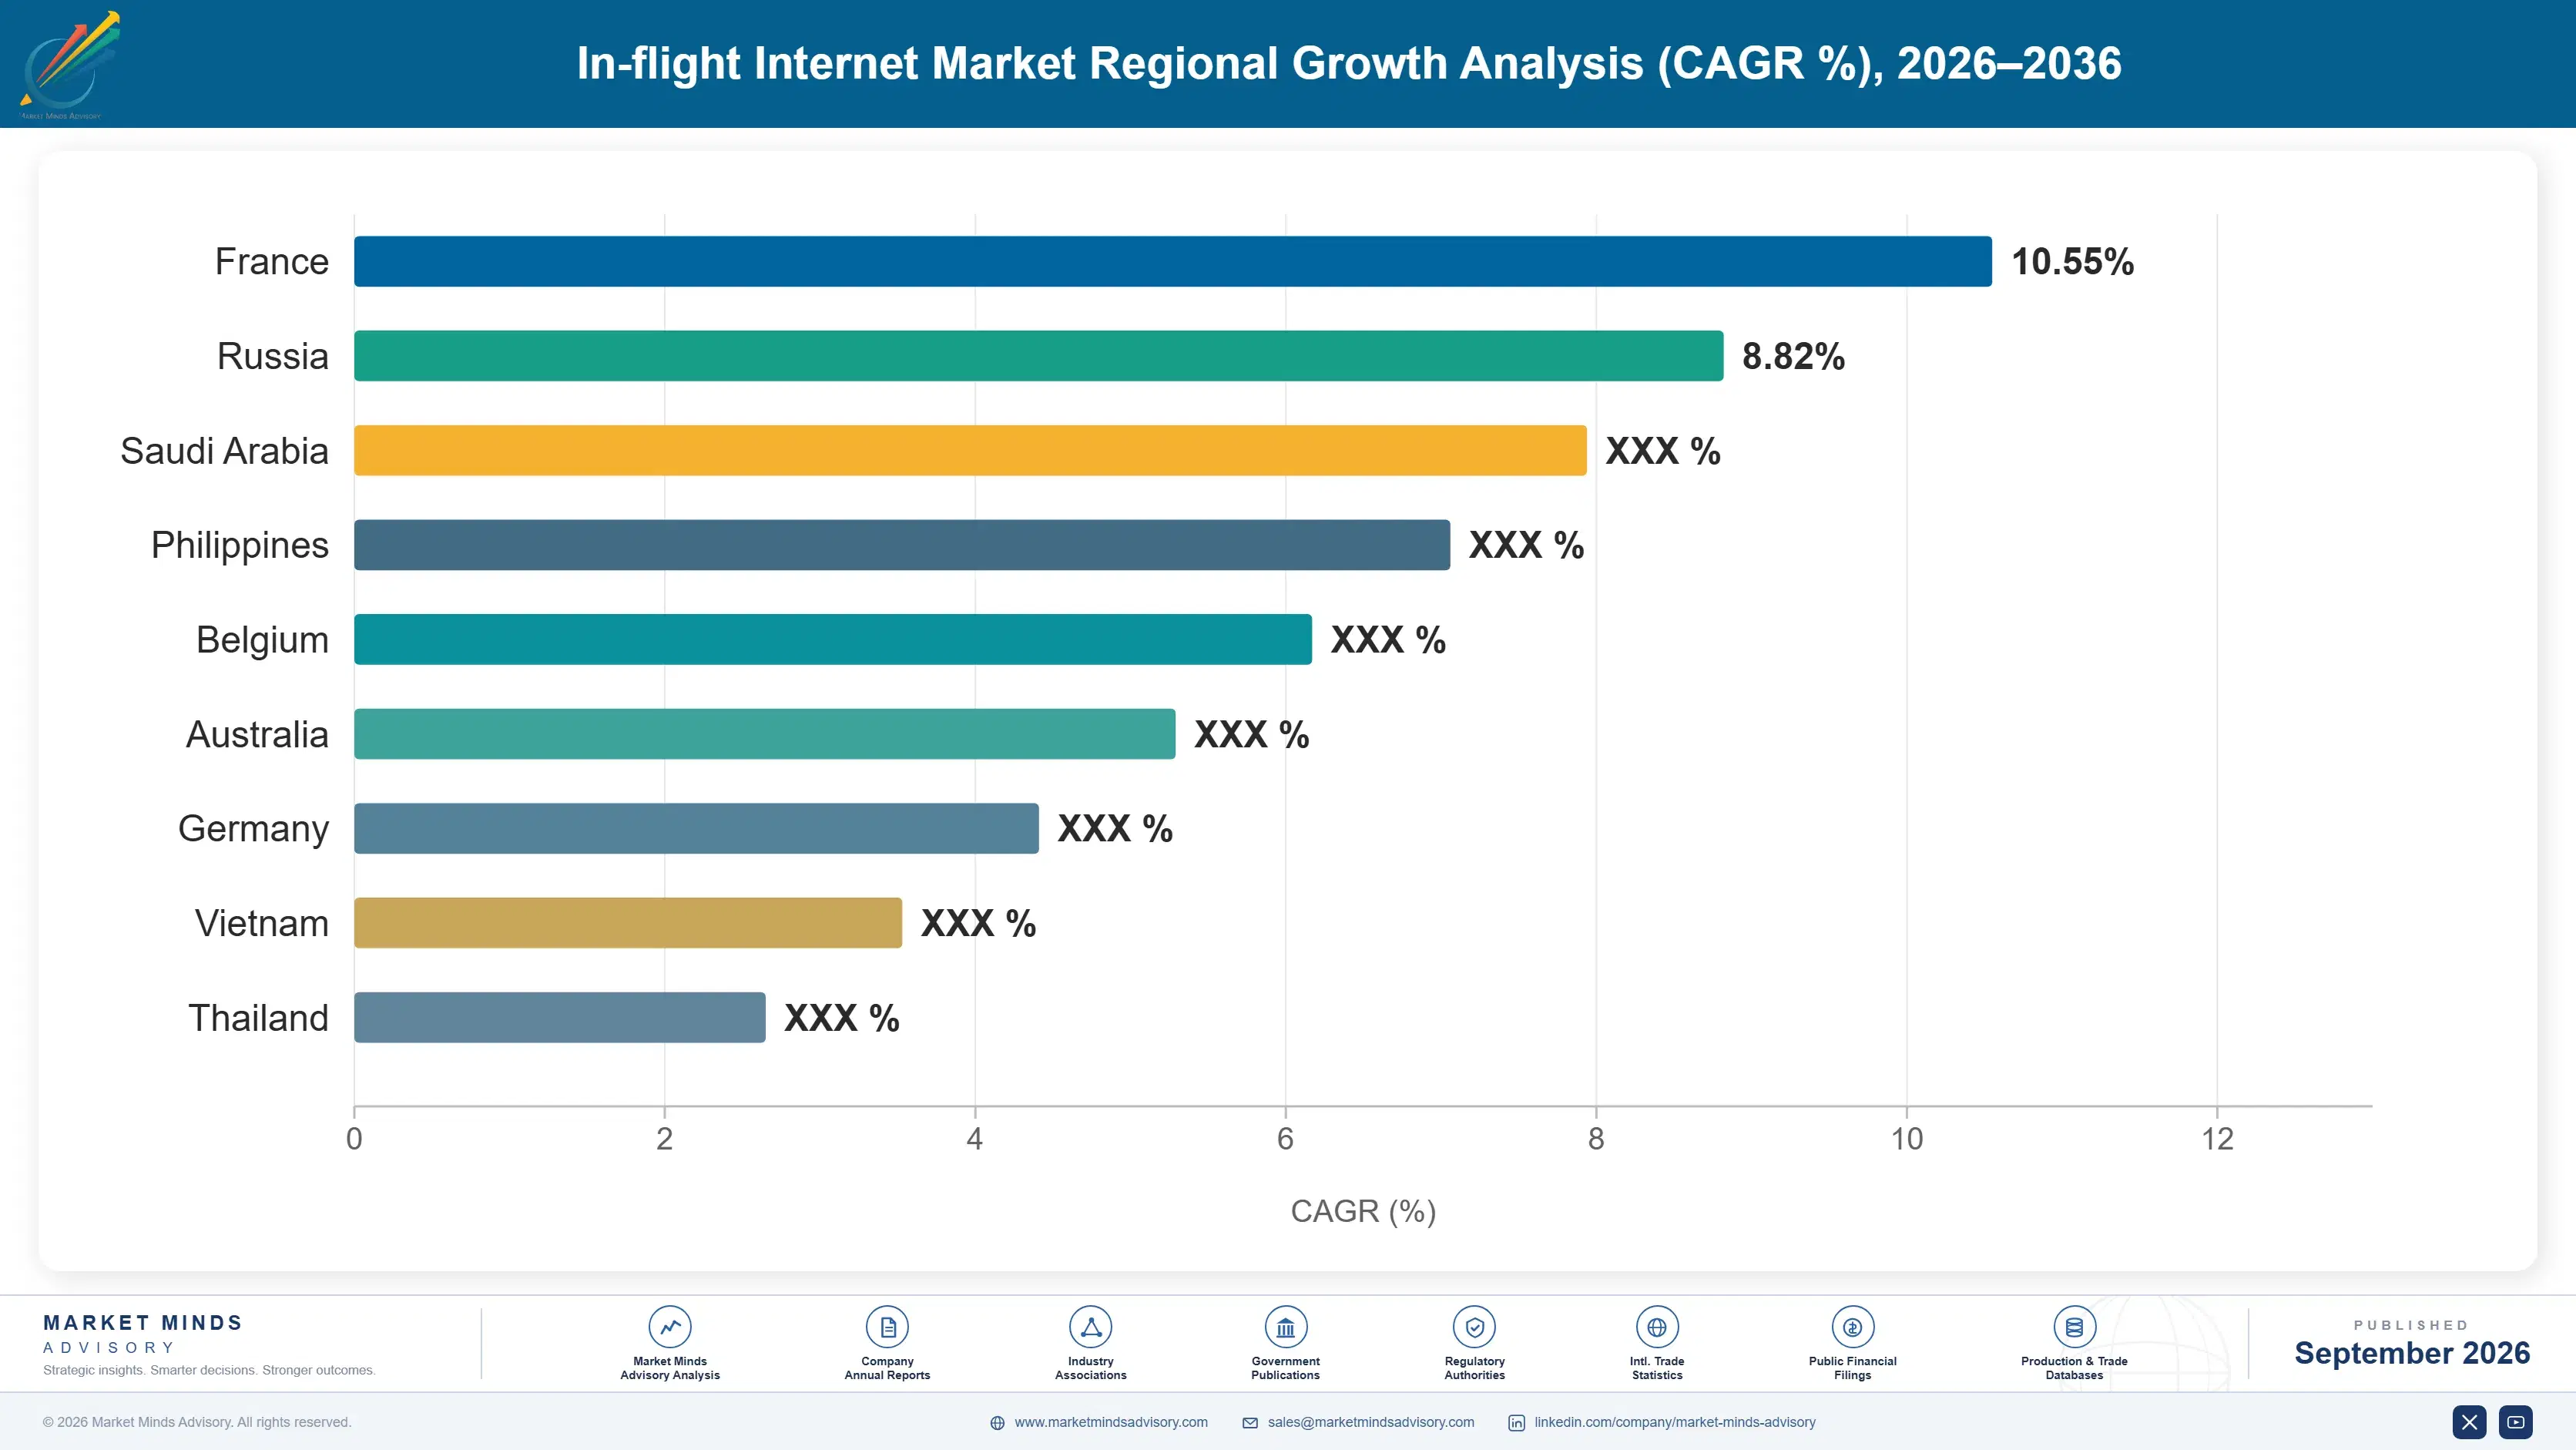
in-flight-internet-market-country-cagr-analysis-1788415754487

Where Connectivity Revenue Actually Holds

Four positions carry margin in a market where the price of the underlying commodity is collapsing and the customer has just become a buyer rather than a reseller. Each involves selling something other than gigabytes, because gigabytes are exactly what is getting cheaper. Gigabytes are exactly what is getting cheaper here. None of them sells data.

Certify Antennas Before Any Contract Exists

Antenna certification on an aircraft type takes around 24 months and installation costs roughly 4 days out of revenue service, which is why incumbents retain fleets long after losing on price. A provider holding certification on the common types before a tender can offer conversion without that delay, which converts the industry's main friction into a competitive weapon. It requires capital committed against business not yet won. Almost nobody does it, which is precisely why it works so well when somebody does. Finance functions resist funding it until a competitor has already done so.
Market Impact: Removes 24 months from any given fleet conversion

Sell Operational Capability Not Passenger Amenity

Engine data, flight bag updates, weather routing and crew applications across 4 operational functions ride the same equipment, and once flight operations depend on the link the buyer moves from cabin experience to operations and engineering. That buyer contracts on reliability rather than price, commits for longer and switches far more reluctantly. Providers positioning as operational infrastructure escape the gigabyte price argument entirely. It requires service levels and support that passenger connectivity never demanded of anybody. Service levels and support of a kind passenger connectivity never demanded are required. Price stops being the argument.
Market Impact: Reaches all 4 operational functions aboard the aircraft

Reach Airframe Manufacturers Not Just Airlines

Factory-fitted provision arrives certified and installed with no separate approval and no time out of service, which removes the 4 days of downtime and the certification programme entirely. That moves the competitive decision to aircraft order time, years before service begins, and rewards providers holding airframe relationships over those holding airline relationships alone. Order books stretching a decade make these positions unusually durable once won. Most providers still organise their commercial effort entirely around carriers. Most providers still organise commercial effort entirely around carriers rather than airframers. Airframers decide years earlier.
Market Impact: Avoids the 4 days out of revenue service

Contract On Service Levels Rather Than Volume

Delivered cost per gigabyte is falling below USD 12 and will keep falling as constellation capacity expands, so revenue contracted per gigabyte shrinks even as data carried rises. Contracting on availability, throughput commitments and passenger experience outcomes decouples revenue from a collapsing commodity price. Airlines prefer it too, since they are buying an outcome rather than a quantity they cannot forecast. Providers still quoting per gigabyte are pricing themselves down alongside their own supply cost. Providers still quoting per gigabyte price themselves down alongside their own supply cost. Airlines prefer buying outcomes.
Market Impact: Escapes the USD 12 per gigabyte commodity price

Who Controls the Margin Pool

Measured on service and equipment revenue, the basis used throughout this section, the top five hold 76%. Concentration reflects the capital required to operate satellite capacity and the certification portfolio required to install on aircraft, neither of which a new entrant assembles quickly. The gap between leaders and everyone else is delivered cost position and antenna certification coverage rather than any service capability difference.
Competition runs on delivered cost per gigabyte, certification coverage across aircraft types and increasingly on whether a provider can support operational traffic to airline standards. Constellation operators compete on cost and latency from a permanently advantaged position. Geostationary incumbents compete on installed base, certification portfolio and increasingly by reselling constellation capacity themselves. Equipment suppliers compete on multi-network terminals. Equipment suppliers compete on terminals able to work across several networks at once.

Pressure comes from two directions. Constellation capacity keeps reducing the price of the commodity every provider sells, which shrinks revenue per unit of traffic carried. And airframe factory fitment moves the decision years earlier and to a different customer entirely. Rankings shift where providers certified antennas ahead of demand and moved into operational services rather than defending passenger connectivity contracts on price.
in-flight-internet-market-company-positioning-matrix-1788415755007

Competitive Moat and Risk Dimensions

VIASAT

Moat: Installed base and certification portfolio

A very large installed fleet combined with antenna certifications across most commercial aircraft types gives revenue that continues while competitors work through approval programmes taking two years per type. Owned satellite capacity provides cost control that resellers lack. Long airline relationships and operational support experience reach the flight operations buyer that passenger connectivity providers do not.
VIASAT

Risk: Geostationary capital exposure

Capital committed against satellites with fifteen year design lives cannot be repriced or redeployed when constellation capacity undercuts it by an order of magnitude, which is a genuine impairment rather than a competitive setback. Reselling constellation capacity alongside owned capacity concedes the cost argument. Airline contracts renegotiated in this environment reset pricing downward regardless of service quality.
STARLINK AVIATION

Moat: Delivered cost and latency position

Constellation economics deliver capacity at roughly a tenth of geostationary cost with latency low enough for video calling and cloud applications, which is the combination airlines converting to free service actually need. Rapid antenna certification progress across common types is removing the friction that protected incumbents. Vertical integration from satellite manufacture through launch to service is unmatched by anybody.
STARLINK AVIATION

Risk: Aviation support and certification depth

Airline operational support, maintenance integration and the certification portfolio across older aircraft types take years to build regardless of technical advantage, and carriers evaluate these seriously. Operational traffic requires service commitments that consumer-derived architectures were not designed around. Capacity shared with terrestrial and maritime users creates contention questions airlines increasingly ask about explicitly.

Players Tracked

Prominent Players

Viasat
Starlink Aviation
Panasonic Avionics
SES
Gogo

Other Key Players

Anuvu
Thales InFlyt Experience
Honeywell Aerospace
Collins Aerospace
Safran Passenger Innovations
Astronics
Eutelsat OneWeb
Telesat
Hughes Network Systems
Kymeta
Get SAT
Gilat Satellite Networks
Satcom Direct
AeroMobile
ThinKom Solutions

Recent Developments

MARCH 2025

Major carrier completes fleetwide free connectivity rollout

A large network carrier completed installation of free passenger connectivity across its mainline fleet, a deployment decision rather than any corporate transaction. Loyalty programme enrolment was used to offset part of the cost, with take-up rising several times over compared with the previous paid arrangement.
Signal: Free service multiplies consumption rather than merely adding to it, which changes the cost base entirely.
SEPTEMBER 2024

Airline moves fleet connectivity to constellation provider

A carrier awarded fleet connectivity to a low earth orbit constellation provider, replacing an incumbent geostationary service, an award decision rather than any merger or acquisition. Antenna certification and installation scheduling were reported as the principal constraints on how quickly the transition could proceed. Hangar capacity limited the pace.
Signal: Certification and hangar slots rather than commercial terms determine how fast any fleet can actually switch.
JANUARY 2025

Supplemental certification granted for narrowbody antenna installation

Airworthiness authorities granted supplemental type certification for a connectivity antenna on a widely operated narrowbody type, a regulatory approval rather than any commercial event. The certification programme had run for approximately two years before approval was finally granted. Installation approvals followed. The type is very widely operated across the world.
Signal: A certificate on a common narrowbody type is worth more commercially than almost any airline contract.

Satellite Capacity And Aircraft Equipment

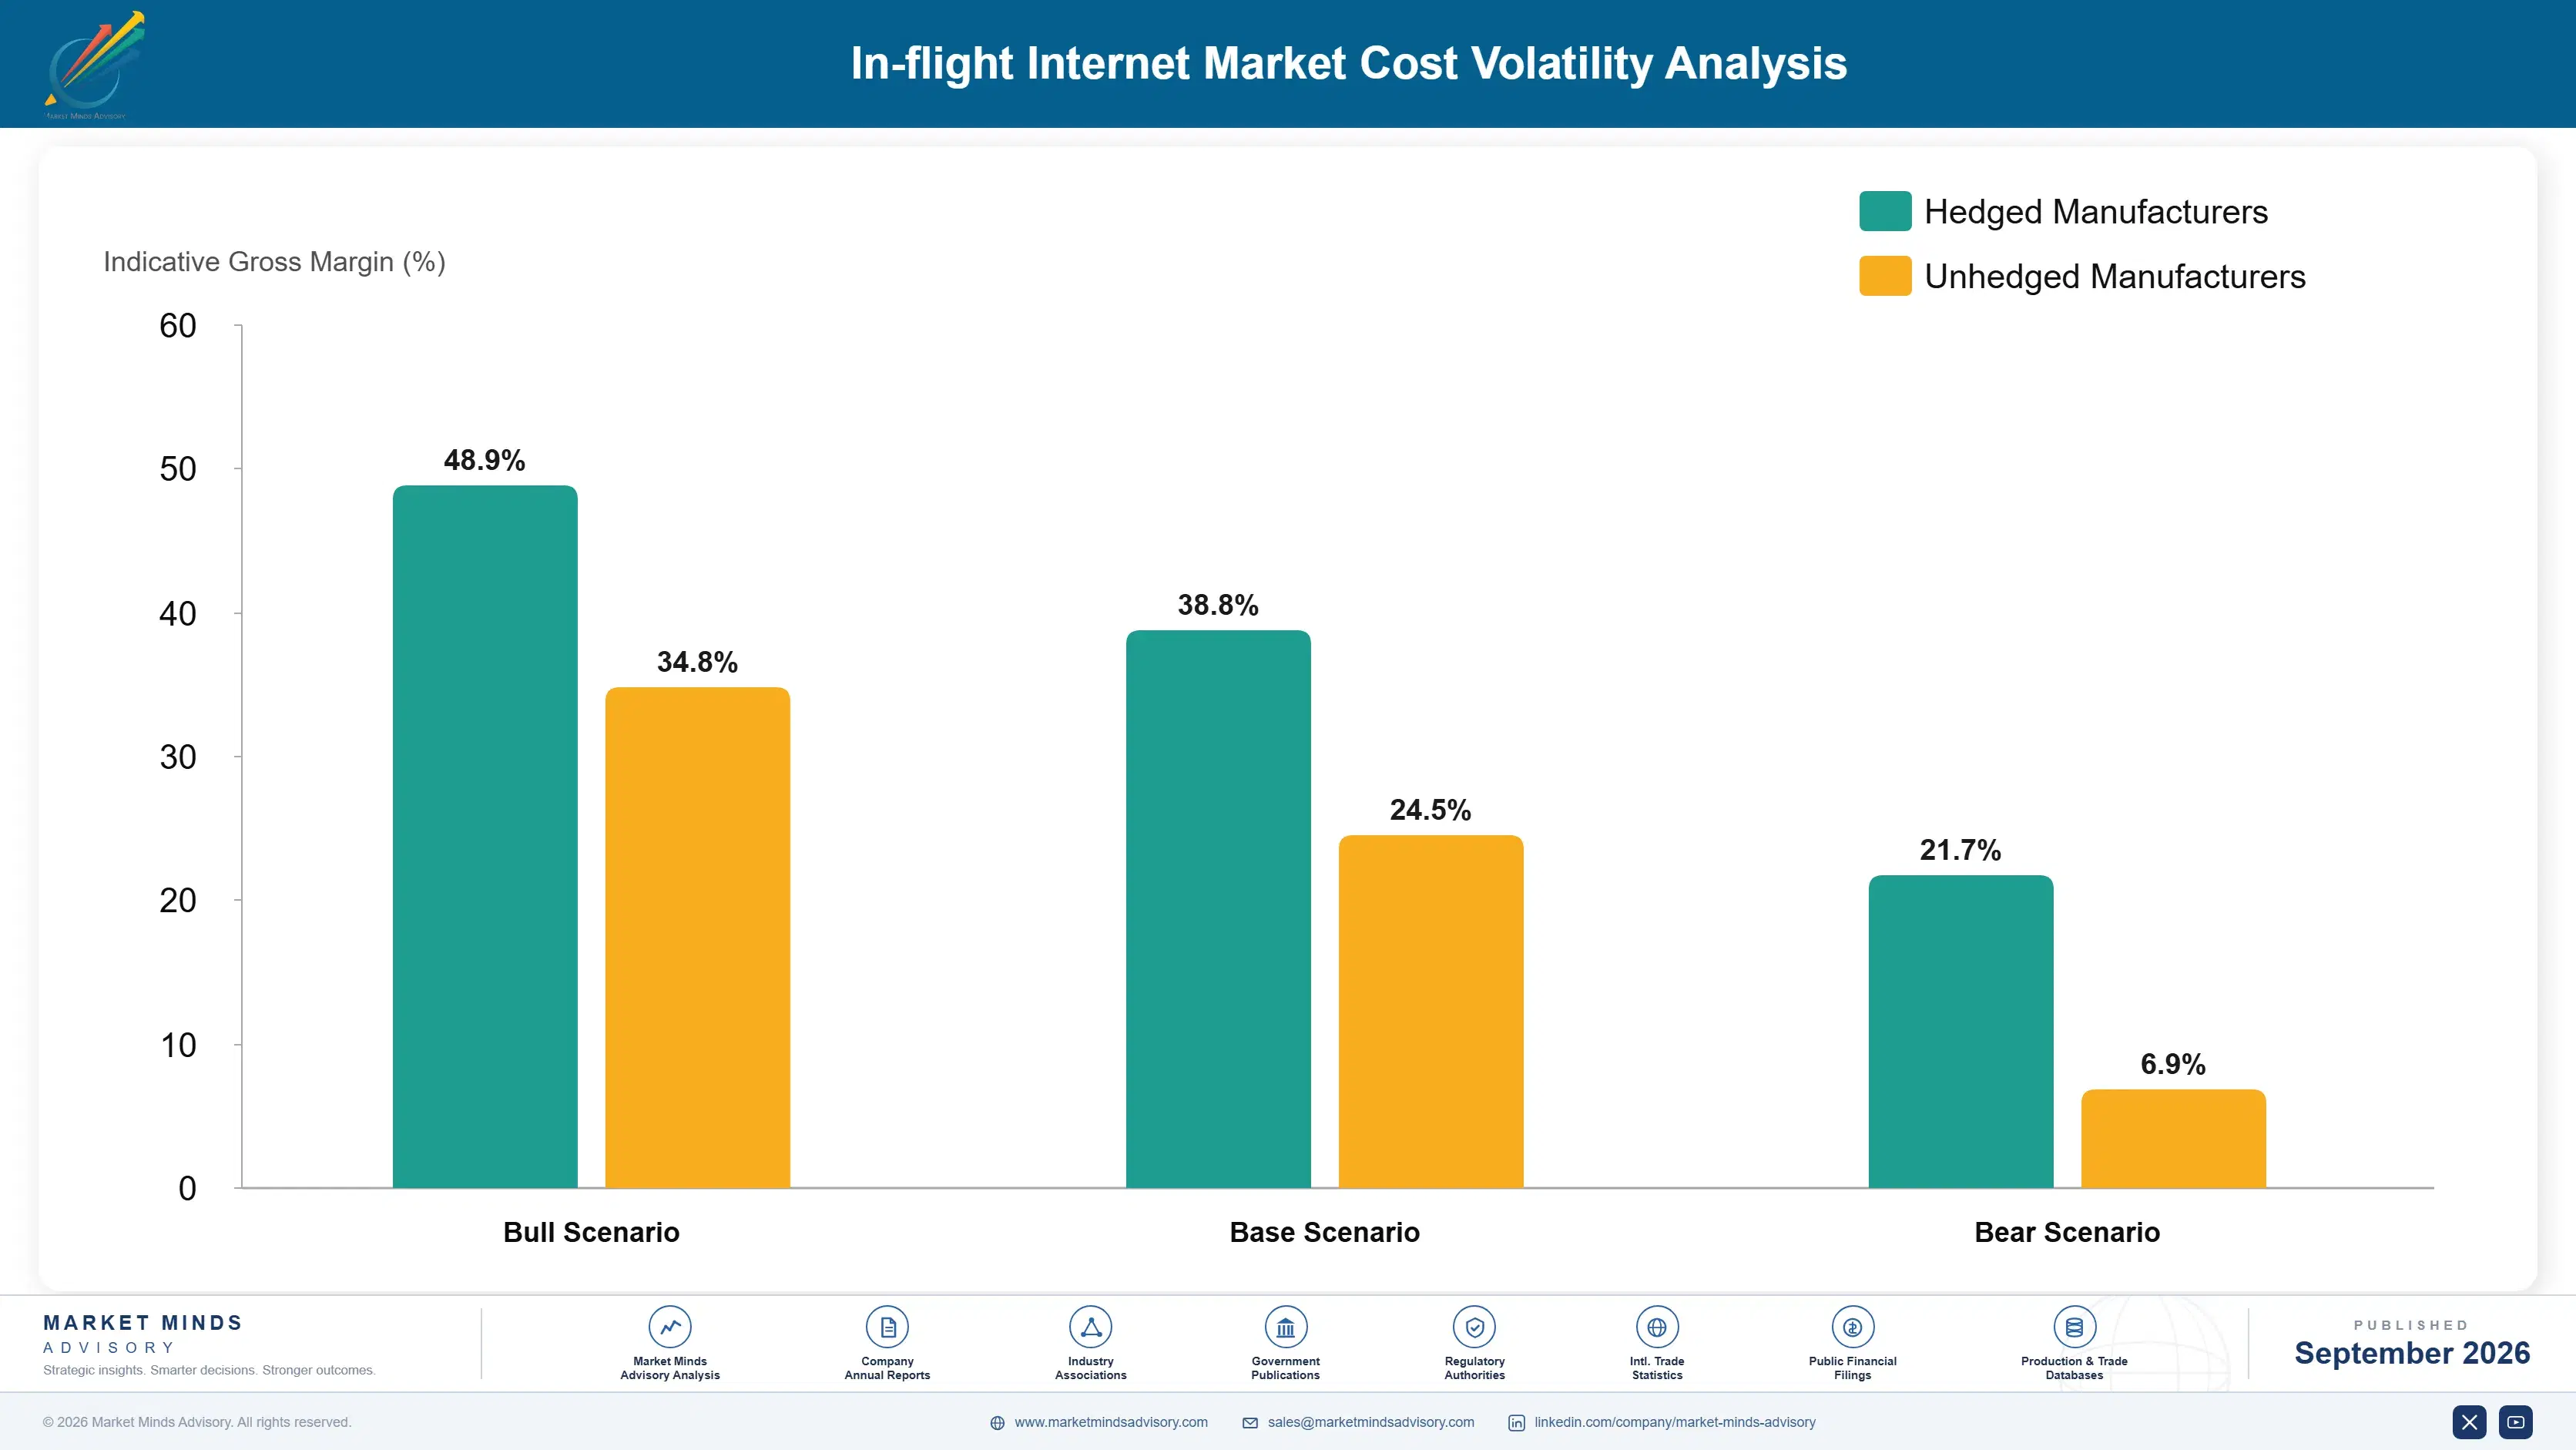
Satellite capacity accounts for roughly 46% of delivered service cost, onboard terminal and antenna hardware around 21%, certification and installation engineering near 14%, and ground network, support and overhead the balance. Capacity is bought wholesale from satellite operators or produced from owned fleets, and IATA operational cost reporting shows connectivity moving from an ancillary line into recognised operating cost across member carriers.
Wholesale capacity pricing has fallen sharply as constellation supply arrived, which benefits resellers and impairs operators who committed capital against long-lived satellites that cannot be repriced. Several geostationary operators disclosed impairments and restructured obligations across the period. Terminal hardware costs fell more slowly, since antenna engineering for aircraft remains difficult and the volumes involved are small by any electronics standard. Volumes remain small by electronics standards.

The disadvantage mechanism is asset ownership rather than operational scale. A provider reselling capacity buys at falling market prices and passes savings through, while one operating owned satellites carries committed capital that market pricing has stranded. Certification portfolios behave oppositely, since they appreciate as fleets seek to convert. The combination explains why incumbents hold business they cannot price competitively and lose it slowly rather than suddenly.
in-flight-internet-market-cost-volatility-analysis-1788415755204

Reselling constellation capacity alongside owned fleets

Buying constellation capacity wholesale and offering it alongside owned geostationary service lets an operator compete on delivered price without abandoning its installed base or its certifications. It concedes the cost argument publicly, which is uncomfortable, and it preserves revenue that would otherwise transfer entirely to the competitor supplying the capacity. Revenue is preserved either way.

Certification programmes funded ahead of contracts

Approving antennas on common aircraft types before any airline commits removes the two year delay from a conversion decision and turns the industry's principal friction into a selling advantage. It commits capital against business not yet won, which finance functions resist consistently until a competitor has already done it first. Somebody always moves first.

Installation scheduled into heavy maintenance visits

Fitting equipment while an aircraft is already out of service for scheduled maintenance removes the four days of additional downtime that dominate an airline's evaluation. It constrains rollout pace to the maintenance calendar rather than to commercial urgency, which providers find frustrating and carriers generally insist upon regardless. Rollout pace follows the maintenance calendar rather than commercial urgency.

Portfolio Architecture for Margin Defence

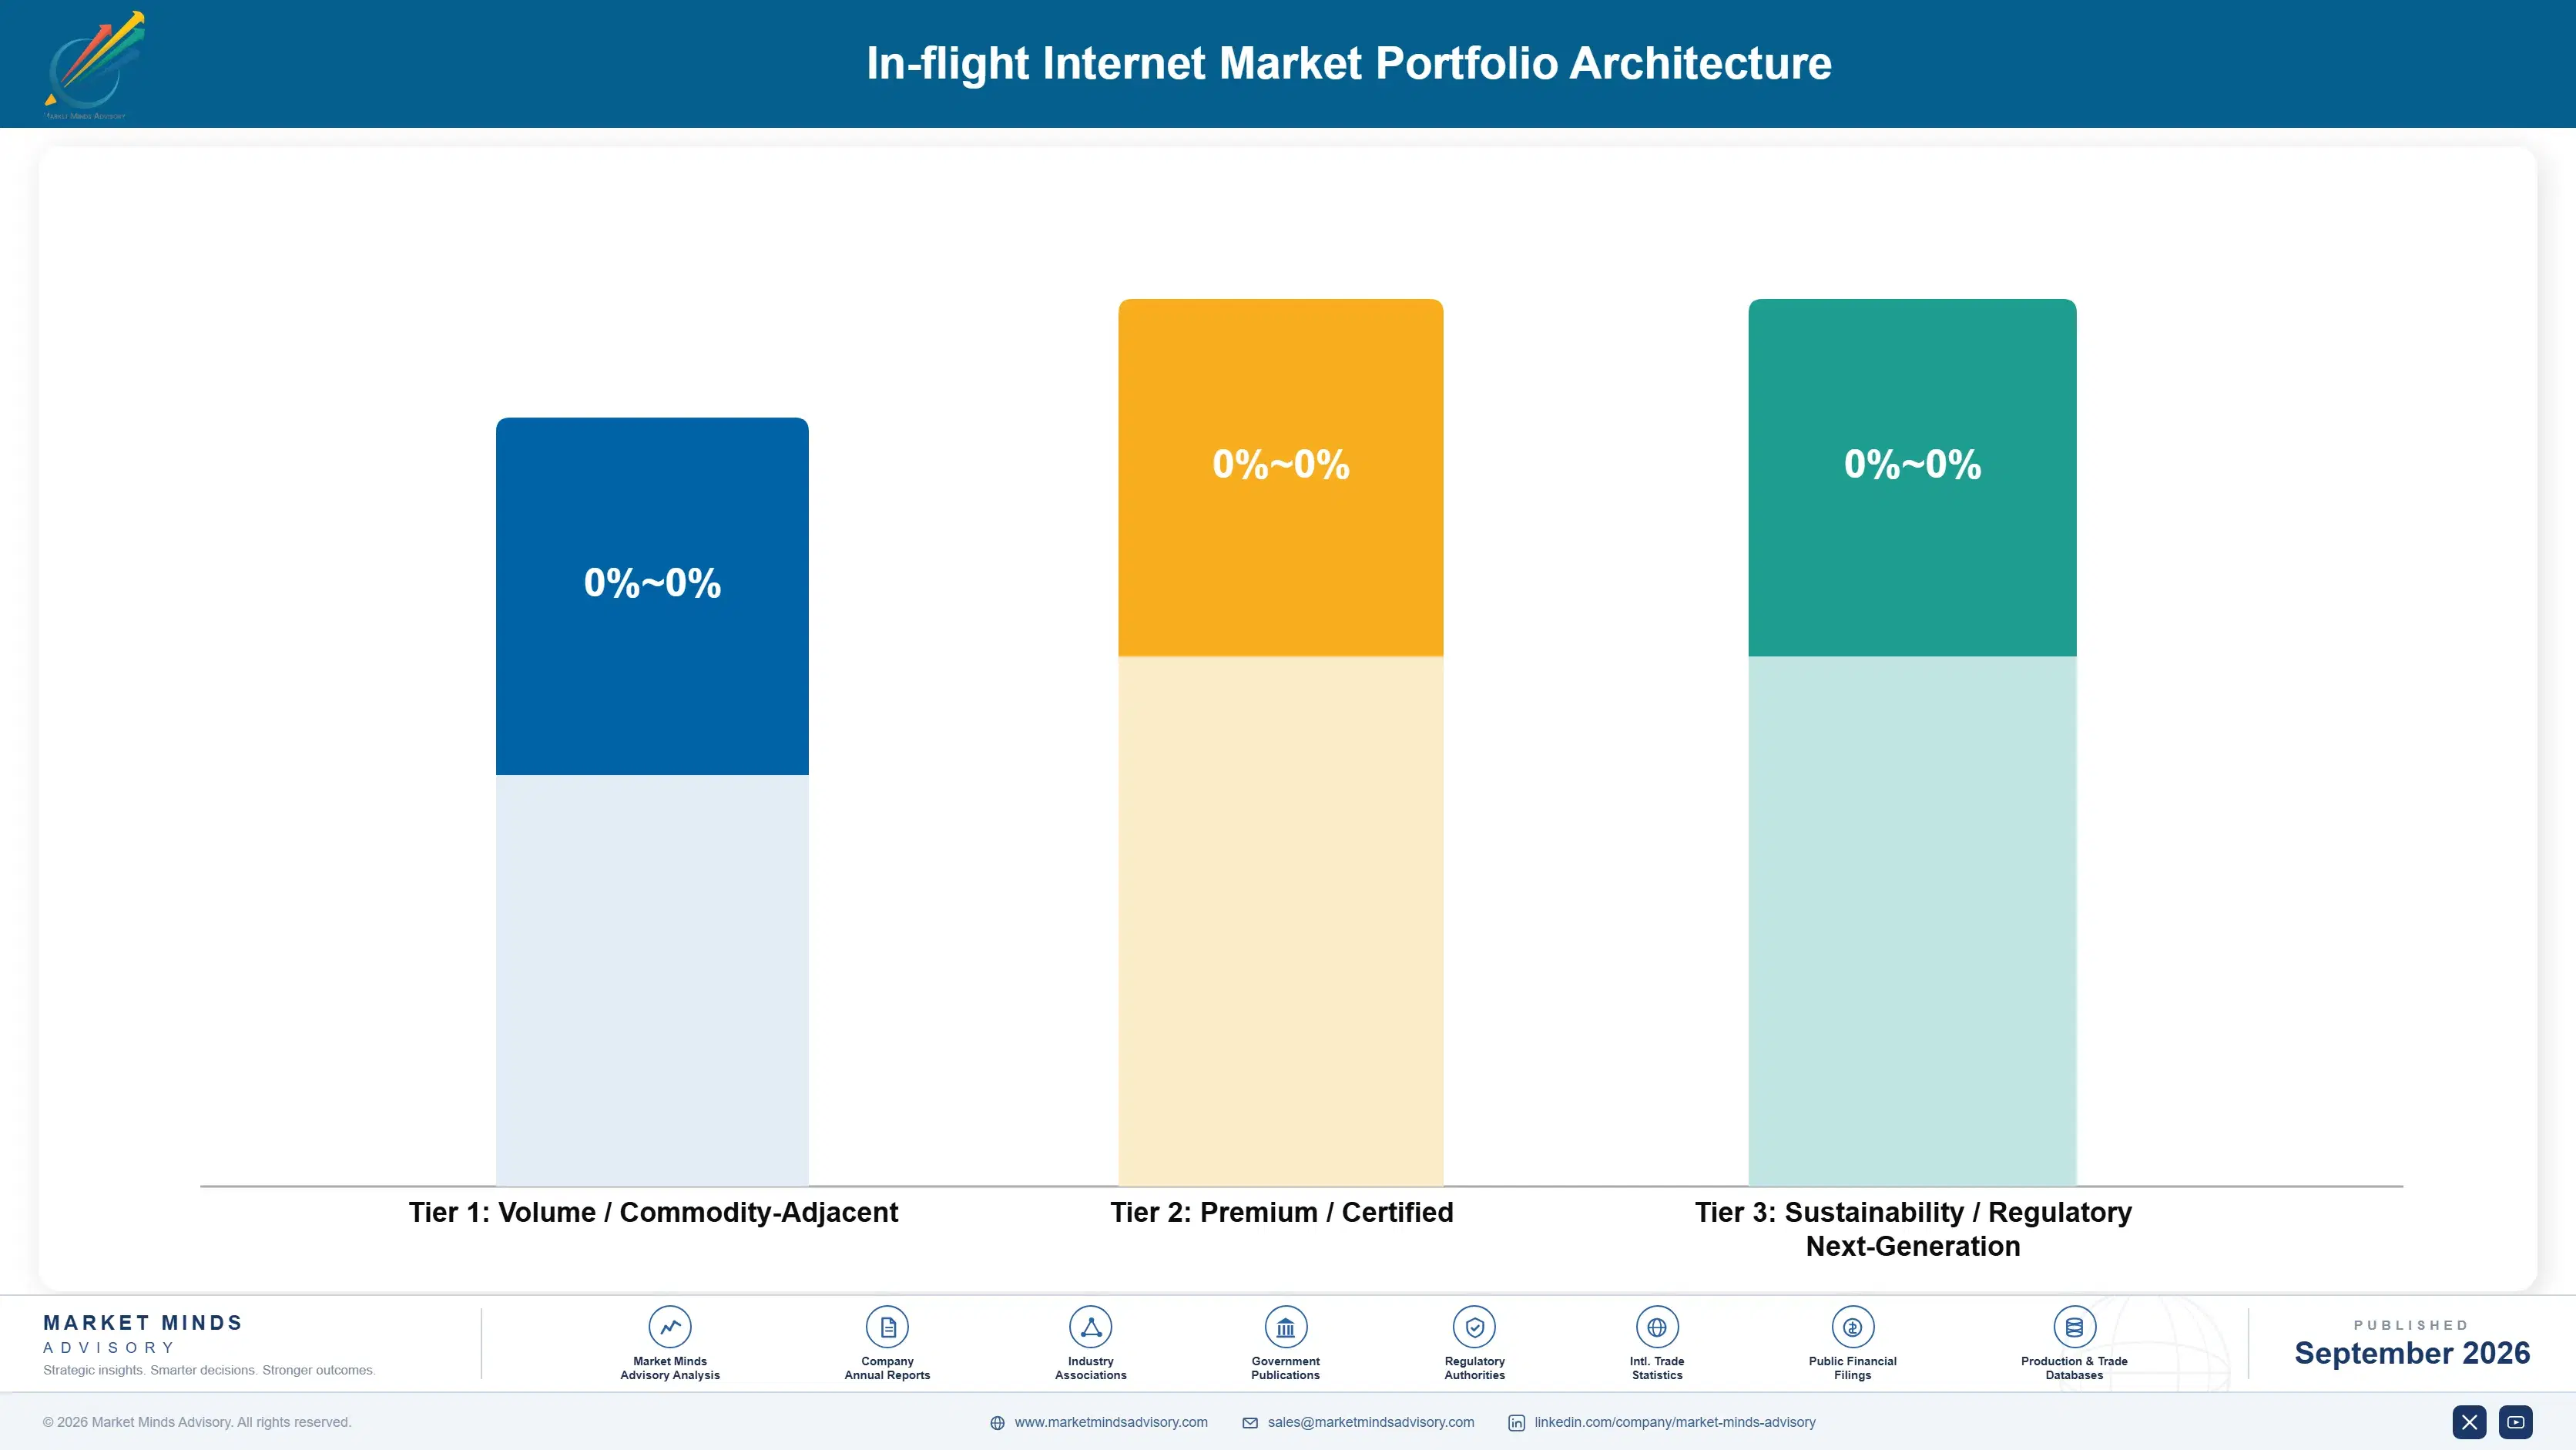
Margin separates by whether revenue is priced against a commodity. Capacity sold per gigabyte tracks a wholesale price falling as constellation supply expands, and no provider escapes that by negotiating harder. Service contracted on availability and passenger experience outcomes, and equipment sold with certification attached, are priced against what the airline is buying rather than against what a gigabyte currently costs in a wholesale market.
The volume against premium tension runs through capacity ownership. Owned satellite capacity provides control and margin when pricing is firm and becomes stranded capital when it is not, which is precisely the position geostationary operators occupy now. Reselling preserves competitiveness and concedes the cost advantage to the supplier. Neither position is comfortable, and the providers doing best hold certification portfolios that appreciate while capacity depreciates.

High-value pools sit where the airline is buying something other than data: certification coverage that shortens conversion, operational service supporting flight operations, and factory fitment positions secured at aircraft order. Each is defended by time or by relationship rather than by capacity cost. The pools carry margin that per-gigabyte service is steadily losing and will continue to lose.

Volume / Commodity-Adjacent

Wholesale capacity resold per gigabyte into airline contracts priced against a falling market. Returns depend on capacity purchase terms rather than on any service capability, and the price direction is consistently downward.
Gross Margin: 16 to 26%

Premium / Certified

Managed connectivity services contracted on availability and experience outcomes with equipment and support included. The 12 point range reflects whether the provider owns capacity or resells it and how much certification coverage it holds.
Gross Margin: 30 to 42%

Sustainability / Regulatory / Next-Generation

Operational connectivity supporting flight operations, certification portfolios that shorten fleet conversion, and factory fitment positions. The 16 point range reflects how completely operational dependency changes contracting away from price. Few providers hold it.
Gross Margin: 40 to 56%
in-flight-internet-market-portfolio-architecture-1788415755702

High-value Sub-segments and Strategic Watch-out

Operational Flight Services

Moves procurement from cabin experience to flight operations, where contracts are written on reliability rather than price and switching becomes far harder. Escapes the gigabyte price argument entirely. Reliability rather than price sets the contract, and switching becomes considerably harder afterwards. It escapes commodity pricing entirely.
Gross Margin: 44 to 56%

Certification Coverage Positions

Appreciates as fleets seek to convert, since a certificate held in advance removes two years from any conversion decision. Requires capital committed against business that has not yet been won by anybody. Certification portfolios appreciate while satellite capacity depreciates, which is an unusual combination. Capital precedes the business.
Gross Margin: 38 to 50%

Factory Fitment Programmes

Secured at aircraft order years before service begins, removing certification and downtime entirely from the decision. Rewards airframe relationships that most providers have never bothered to build properly. Order books stretching a decade make these positions unusually durable once secured properly. Relationships take years to build.
Gross Margin: 34 to 46%

Per-Gigabyte Capacity Resale

Priced against a wholesale commodity falling faster than volume grows, which shrinks revenue while data carried rises. Necessary to serve fleets already contracted and permanently unattractive on its own returns. No provider escapes the price direction by negotiating harder with its own suppliers. Volume grows and revenue does not.
Gross Margin: 16 to 26%

How Fleet Contracts Get Decided

Annuity economics here are exceptionally strong and exceptionally hard to win. A fleet contract runs for years and renews far more often than not, because switching requires antenna certification taking around 24 months and installation removing each aircraft from service for roughly 4 days. That protects incumbents beaten decisively on price and makes each loss slow rather than sudden, which flatters providers whose position is eroding.
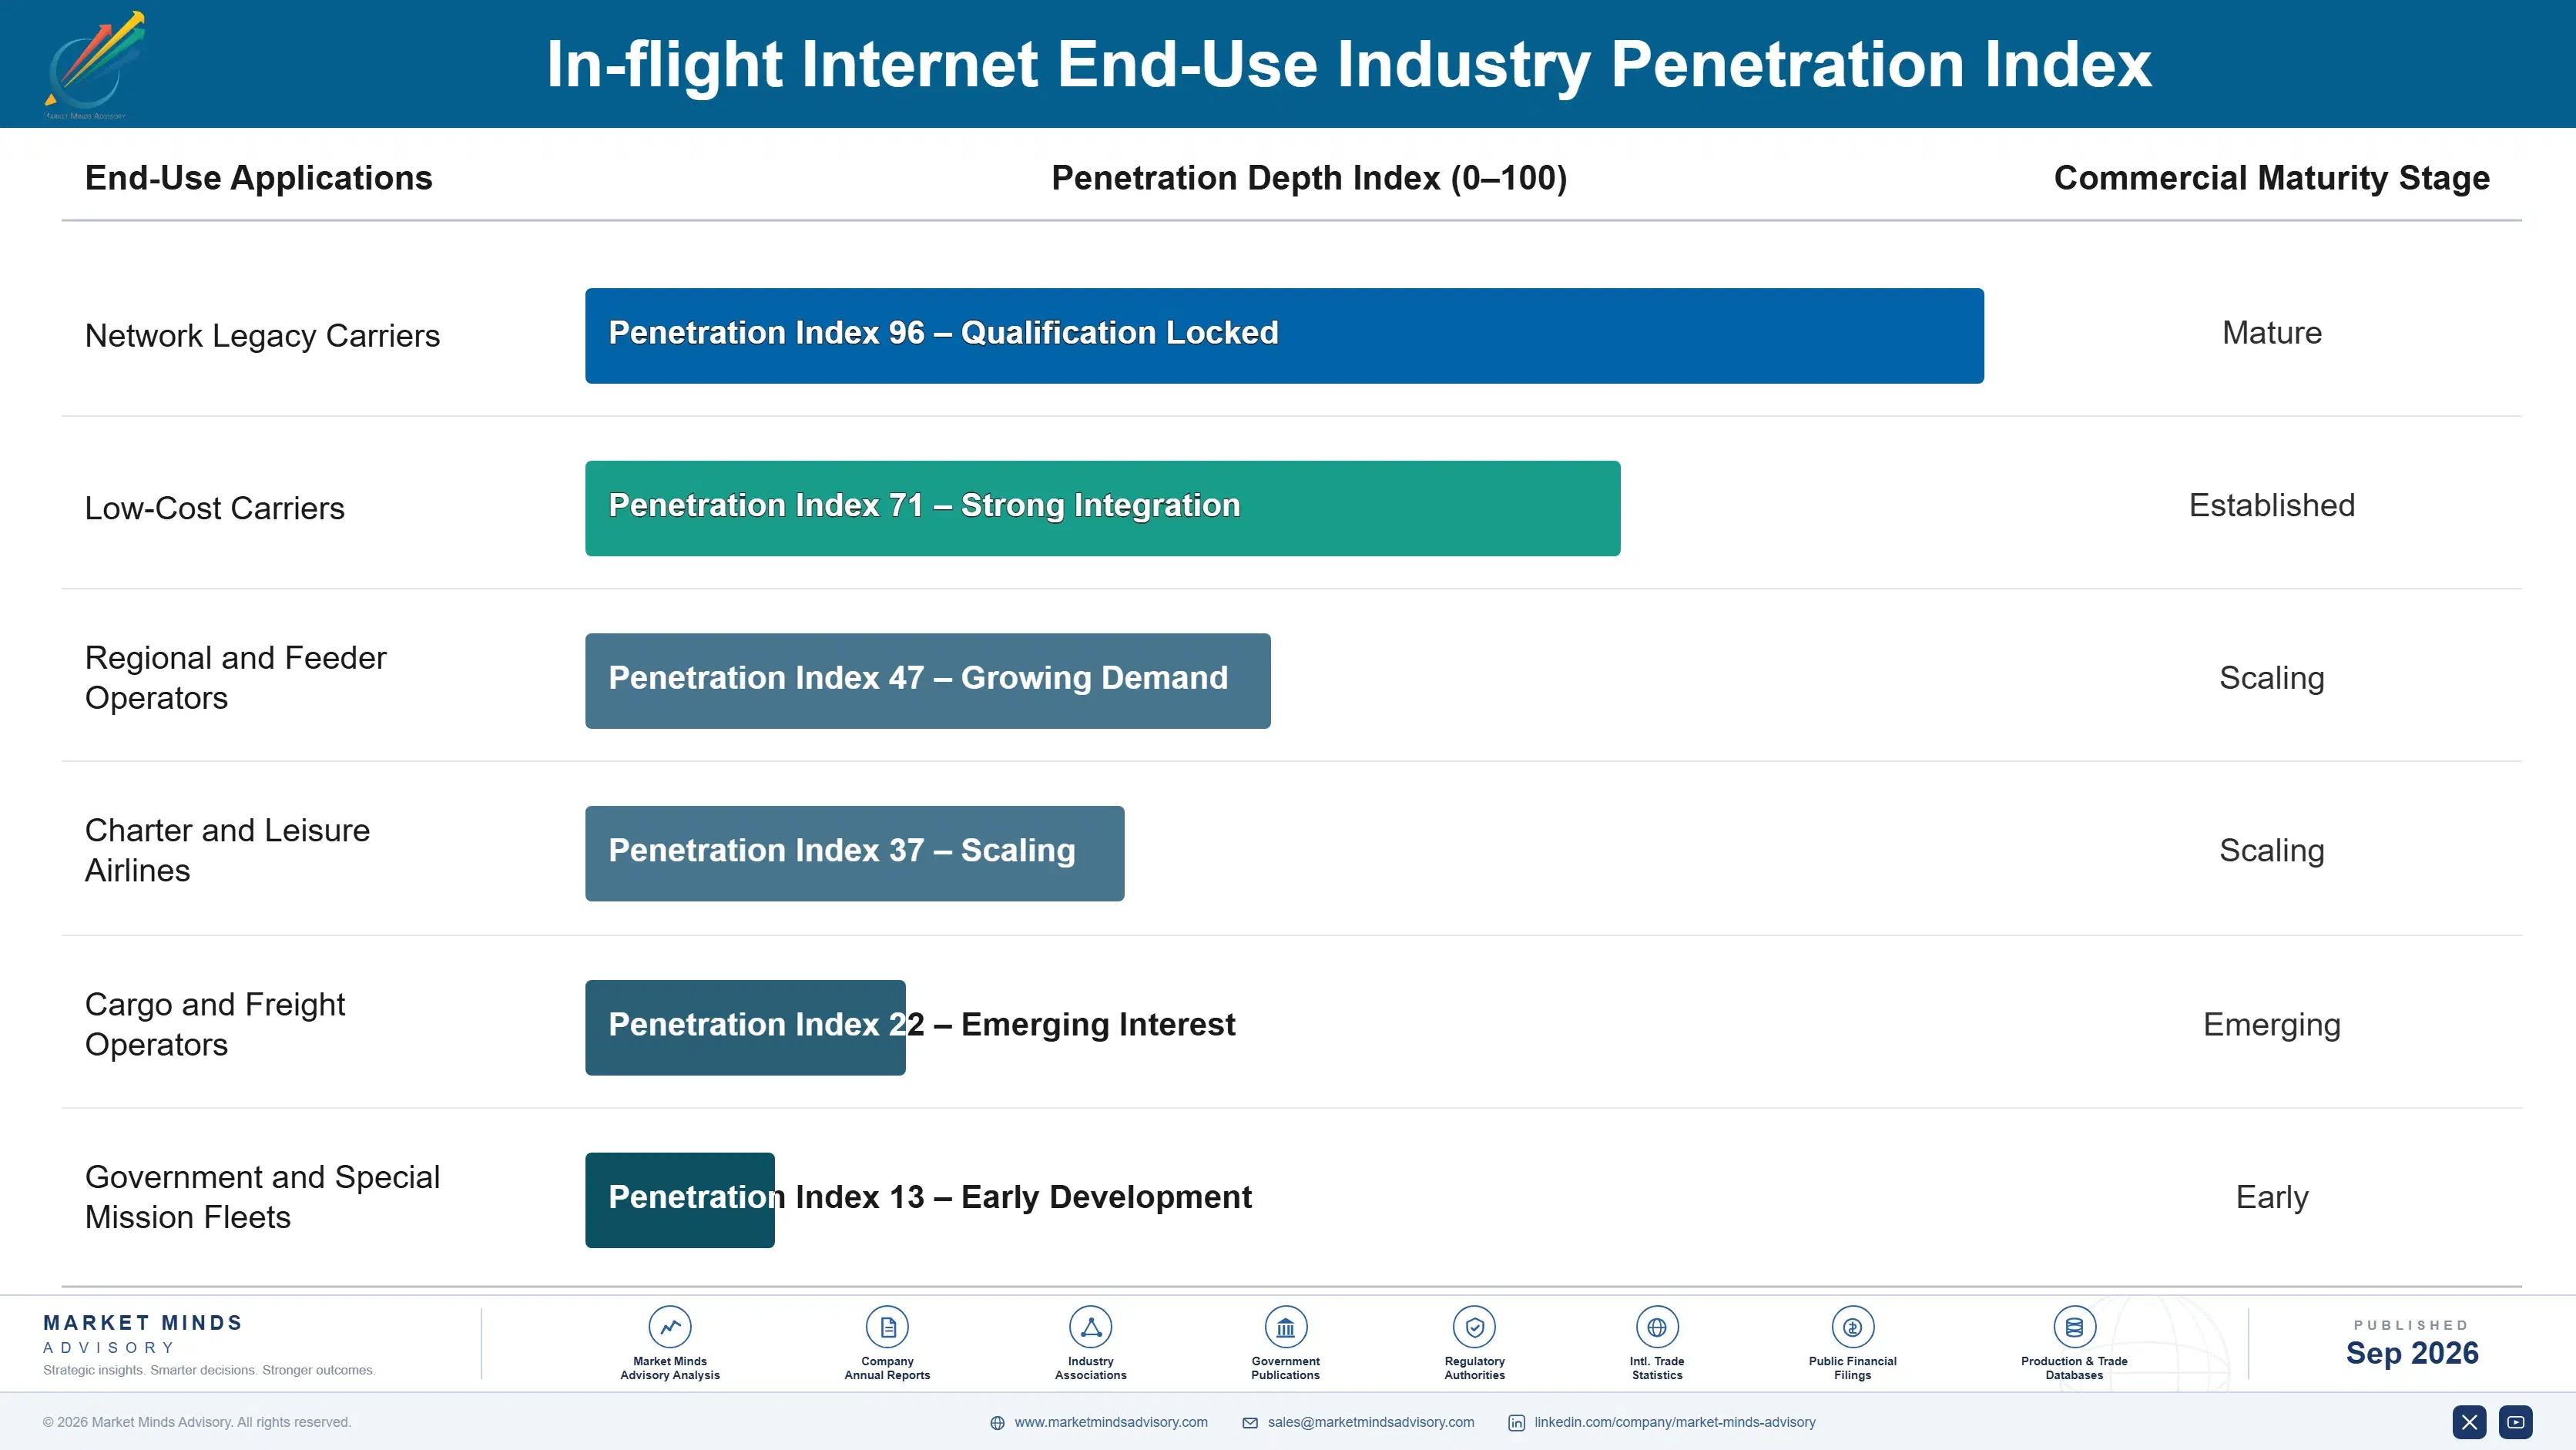
Adoption depth varies sharply by carrier type. Network carriers competing on product specify deeply, evaluate passenger experience data and increasingly demand operational traffic support. Low-cost carriers evaluate on delivered cost alone and convert only when competitive pressure forces it. Carriers taking new aircraft specify at order and effectively decide years ahead, which removes them from any competitive process running at the time of service.

The buyer profile has moved twice. Connectivity was bought by ancillary revenue teams selling a product to passengers, then by cabin experience teams giving it away, and increasingly by flight operations and engineering as the link carries operational traffic. Each move raised the reliability requirement and lengthened the commitment. Providers organised around ancillary revenue conversations are addressing a function that no longer holds the decision anywhere.
in-flight-internet-market-end-use-penetration-index-1788415756198

Where Providers Should Compete

These are among the four positions where our research anticipates prominent divergence between winners and laggards over the coming forecast period. Each is grounded in the demand model, the regulatory perimeter, and the announced capacity pipeline.
01 / CERTIFICATION AHEAD OF DEMAND

Approve antennas before anybody puts work out to tender

Antenna certification on an aircraft type takes around twenty four months and installation costs roughly four days out of revenue service, which is exactly why incumbents keep fleets long after losing decisively on price. A provider already holding certification on the common types can offer conversion without that delay, turning this industry's principal friction into a competitive weapon instead. It requires capital committed against business not yet won, which is precisely why almost nobody in this market actually does it.
02 / OPERATIONAL POSITIONING SHIFT

Become flight infrastructure, not a cabin amenity

Engine data, flight bag updates, weather routing and crew applications all increasingly ride on exactly the same equipment installed for passengers, and once flight operations come to depend on that link, the buyer moves from cabin experience across to operations and engineering entirely. That buyer contracts on reliability rather than on price alone, commits for considerably longer and switches far more reluctantly afterwards. Providers positioning this way escape the gigabyte price argument that is otherwise entirely inescapable for everybody else.
03 / AIRFRAME RELATIONSHIP BUILDING

Win the decision at aircraft order, not at tender

Factory-fitted provision arrives already certified and installed, with no separate approval programme and no time at all out of revenue service, which removes both the certification delay and the four days of downtime from the airline's decision entirely and permanently. That moves the competitive moment to aircraft order time, years before any of the service actually begins, and rewards providers holding airframe relationships over those holding only airline ones. Most providers still organise their commercial effort entirely around carriers rather than manufacturers.
04 / CONTRACT BASIS CHANGE

Sell availability rather than gigabytes carried

Delivered cost per gigabyte is already falling below twelve dollars and will keep falling as constellation capacity keeps expanding, so any revenue contracted per gigabyte shrinks even while the volume of data carried rises steadily. Contracting instead on availability, throughput commitments and passenger experience outcomes decouples that revenue from a collapsing commodity price altogether. Airlines much prefer it as well, since they are buying an outcome rather than buying a quantity that nobody involved can forecast at all reliably in advance.

Engagement Snapshot From the Field

A live engagement with an industry participant carrying material or product regulatory and market exposure ahead of a defining policy shift, showing how our research translates into a defensible multi-year portfolio strategy.
MARKET MINDS ADVISORY · CLIENT ENGAGEMENT SUMMARY
In-flight Internet Producer Strategic Portfolio Review and Transition Roadmap 2026·Investment Scenario on In-flight Internet Exposure Evaluation 2025-26
CLIENT PROFILE
A European network carrier operating a mixed narrowbody and widebody aircraft fleet across both long-haul and short-haul route networks, with annual revenue reported at approximately USD 12 billion (client-reported, unverified by MMA). Connectivity was being sold to passengers on both fleets under a legacy geostationary contract signed several years before constellation services existed at all.
STRATEGIC CHALLENGE
Competitors offering free connectivity were winning comparison on product while the carrier earned very little from charging for it, and management could not establish what free service would actually cost. The incumbent contract had years to run and switching appeared to require fleet downtime nobody would authorise. Nobody had modelled it.
MMA APPROACH
MMA modelled consumption under free service against the carrier's own paid take-up data, priced capacity across geostationary and constellation options at realistic contracted volumes, and established which antenna certifications already existed on the carrier's aircraft types and which would require new programmes. Maintenance schedules were examined directly. Competitor product positions were compared.
KEY FINDINGS
  1. Take-up under free service would rise past 54% against the carrier's paid rate, which multiplied capacity requirement rather than increasing it modestly as internal estimates had assumed.
  2. Constellation capacity at contracted volumes cost roughly a tenth of the incumbent geostationary rate, which made free service affordable where it had appeared prohibitive under existing pricing.
  3. Certification already existed for a constellation antenna on two of the carrier's four fleet types, removing twenty four months from conversion on the majority of aircraft.
  4. Installation could be scheduled entirely within existing heavy maintenance visits, avoiding the four days of additional downtime per aircraft that had blocked the decision internally.
CLIENT PROFILE
A European network carrier operating a mixed narrowbody and widebody aircraft fleet across both long-haul and short-haul route networks, with annual revenue reported at approximately USD 12 billion (client-reported, unverified by MMA). Connectivity was being sold to passengers on both fleets under a legacy geostationary contract signed several years before constellation services existed at all.
STRATEGIC CHALLENGE
Competitors offering free connectivity were winning comparison on product while the carrier earned very little from charging for it, and management could not establish what free service would actually cost. The incumbent contract had years to run and switching appeared to require fleet downtime nobody would authorise. Nobody had modelled it.
MMA APPROACH
MMA modelled consumption under free service against the carrier's own paid take-up data, priced capacity across geostationary and constellation options at realistic contracted volumes, and established which antenna certifications already existed on the carrier's aircraft types and which would require new programmes. Maintenance schedules were examined directly. Competitor product positions were compared.
KEY FINDINGS
  1. Take-up under free service would rise past 54% against the carrier's paid rate, which multiplied capacity requirement rather than increasing it modestly as internal estimates had assumed.
  2. Constellation capacity at contracted volumes cost roughly a tenth of the incumbent geostationary rate, which made free service affordable where it had appeared prohibitive under existing pricing.
  3. Certification already existed for a constellation antenna on two of the carrier's four fleet types, removing twenty four months from conversion on the majority of aircraft.
  4. Installation could be scheduled entirely within existing heavy maintenance visits, avoiding the four days of additional downtime per aircraft that had blocked the decision internally.
RECOMMENDED STRATEGY
Phase 1: Phase one: convert the two already certified fleet types to constellation service and to free passenger connectivity in the same programme. Phase 2: Phase two: schedule all installation work within planned heavy maintenance visits rather than seeking any additional aircraft downtime from the operations function. Phase 3: Phase three: negotiate the remaining contract on availability and experience outcomes rather than on any per-gigabyte volume basis at all.
OUTCOME
Within eleven months the carrier had converted two fleet types, launched free connectivity across them, and reported connectivity cost per passenger carried down 38% despite take-up rising sharply (client-reported, unverified by MMA). The remaining fleet types are now in certification and the conversion programme continues.

Frequently Asked Questions

Foundational context covering the market sizes, CAGR, scope, country, region and competition that inform every finding below. This section is provided to cover basics and most often pre-purchase conversations, answered from the MMA Primary Research Dataset.

What is the current size of the In-flight Internet Market?

The market was valued at USD 4.2 billion in 2025 and reaches USD 4.69 billion in 2026. Free service adoption and constellation capacity are both driving that growth.

How large will the In-flight Internet Market be by 2036?

MMA forecasts USD 14.05 billion by 2036, an increase of USD 9.36 billion over the 2026 base. That represents an expansion multiple of 3.00 times.

What is the CAGR for the In-flight Internet Market 2026 to 2036?

The base case CAGR is 11.6%, with a bull case of 12.8% and a bear case of 10.4%. The historical rate between 2020 and 2025 was 10.4%.

Which segment is growing fastest?

Low earth orbit constellation services grow at 17.4%, half again the market rate of 11.6%. They cut delivered cost by roughly an order of magnitude and fixed latency.

Who are the major companies in the In-flight Internet Market?

Viasat, Starlink Aviation, Panasonic Avionics, SES and Gogo lead on measured service and equipment revenue. Together they account for roughly 76% of an unusually concentrated market.

Which country is growing fastest?

India grows fastest at 19.6%, on among the largest aircraft order books anywhere combined with domestic connectivity regulation that has now been resolved. Regulation had blocked it before.

Report Segmentation Architecture

The full report scope spans multiple orthogonal segmentation dimensions, with cross-tabulated demand data provided for each dimension pair. Coverage extends further to regional breakdowns, trend trajectories, and the competitive detail needed to support segment-level decision-making.

By Connectivity Architecture

  • Geostationary Ku-Band Services
  • Geostationary Ka-Band Services
  • Low Earth Orbit Constellation Services
  • Multi-Orbit Hybrid Services
  • Air-to-Ground Network Services
  • Onboard Systems and Antenna Hardware

By End-Use Industry

  • Network Legacy Carriers
  • Low-Cost Carriers
  • Regional and Feeder Operators
  • Charter and Leisure Airlines
  • Cargo and Freight Operators
  • Government and Special Mission Fleets

By Commercial Model and Fitment Route

  • Passenger Paid Service
  • Airline Funded Free Service
  • Sponsored and Loyalty Funded Service
  • Factory Fitment at Aircraft Order
  • Retrofit Under Supplemental Certification
  • Operational Data Services

By Region

  • North America
  • South Asia and Pacific
  • Western Europe
  • Middle East and Africa
  • East Asia
  • Latin America
  • Eastern Europe

Scope, Methodology, and Coverage

Every figure in this report is reproducible from documented input assumptions. The scope below maps the historical period, the forecast horizon, the segmentation dimensions, and the countries covered, alongside the underlying primary and qualitative methodology.
Historical Period
2020 to 2025
Forecast Period
2026 to 2036
Base Year
2025 (USD billions; MMA Primary Research Dataset, September 2026)
Market Definition
The in-flight internet market covers broadband connectivity services delivered to commercial passenger aircraft in flight together with the onboard equipment enabling them, spanning geostationary Ku-band and Ka-band services, low earth orbit constellation services, multi-orbit hybrid services, air-to-ground network services, and onboard systems and antenna hardware. Sizing is measured at service and equipment revenue. Business and general aviation connectivity, maritime and land mobility services, inflight entertainment content, cabin systems without connectivity and satellite construction are excluded.
Quantitative Units
USD billions at service and equipment revenue, with supporting equipped aircraft counts and data carried by region
Segmentation Dimensions
Connectivity architecture, end-use industry, commercial model and fitment route, region
Regions Covered
North America, South Asia and Pacific, Western Europe, Middle East and Africa, East Asia, Latin America, Eastern Europe
Countries Covered
United States, Canada, Mexico, Brazil, Chile, United Kingdom, Germany, France, Spain, Poland, India, Singapore, Australia, Japan, China, South Korea, United Arab Emirates, Qatar
Key Companies Profiled
Viasat, Starlink Aviation, Panasonic Avionics, SES, Gogo, Anuvu, Thales InFlyt Experience, Honeywell Aerospace, Collins Aerospace, Safran Passenger Innovations, Astronics, Eutelsat OneWeb, Telesat, Hughes Network Systems, Kymeta, Get SAT, Gilat Satellite Networks, Satcom Direct, AeroMobile, ThinKom Solutions
Quantitative Methodology
Primary survey, n=3,800 respondents, Q4 2025, six countries; demand-side model with trade association cross-validation
Qualitative Methodology
47 expert interviews, Q4 2025; applied to validate demand model assumptions, identify emerging dynamics, and assess competitive positioning
Report Format
PDF and XLSX data workbook (Word format preview document)
Publisher
Market Minds Advisory
Report Code
MMA-2026-TEC-721
Published
September 2026
Contact
sales@marketmindsadvisory.com | www.marketmindsadvisory.com

Purchase the full In-flight Internet Market Report (2026 to 2036).

The full report treats the shift from passenger paid to airline funded service as the defining commercial event, which is the framing that explains why demand grew while the price of the underlying commodity collapsed. It sizes six connectivity architectures with individual growth rates, seven regions built from equipped fleet size and route structure, and the certification friction that keeps incumbents in fleets they cannot price competitively. Competitive analysis covers twenty providers on a consistent service and equipment revenue basis, with certification coverage and delivered cost position treated as the decisive variables. Input cost modelling breaks out capacity, terminal and certification exposure by asset ownership.
Six connectivity architectures with individual growth rates
Free service take-up modelled against paid rates
Antenna certification coverage mapped by aircraft type
Delivered cost per gigabyte tracked across orbits
Twenty providers on consistent service revenue basis
Capacity, terminal and certification cost exposure

Built For The People Who Decide

From boardroom strategy to bench-side execution, this report is read cover-to-cover by leaders shaping the next decade of their industry, turning demand scenarios, market dynamics and valuation benchmarks into decisions.
CXOs/ Presidents/ VPs/ Managers
M&A and Corporate Development
Strategy Teams and R&D Heads
Procurement and Product Directors
Regulatory and Compliance Leaders
Investor Relations and Equity Analysts