Market Minds Advisory
IaaS/Hosting Infrastructure Services Market

IaaS/Hosting Infrastructure Services Market: IaaS/Hosting Infrastructure Services Market: AI Workloads Redraw Capacity Allocation Priorities

Cloud providers racing to secure GPU capacity for AI training workloads are reshaping infrastructure investment priorities, as enterprises running traditional compute and storage workloads compete for the same constrained data center power and.

Lead Analyst

Published

September 2026

Make Smarter Decisions with Customized Research Insights

Request a free sample report and evaluate market opportunities, growth trends, and competitive dynamics relevant to your business needs.

2025 MARKET VALUE$145.0BMarket Size 2025
2036 FORECAST VALUE$480.2BBase Case , 2026 to 2036
CAGR 2026 TO 203611.5 %Bull 12.8% / Bear 10.2%
INCREMENTAL OPPORTUNITY$318.5BNet 10- year value creation
EXPANSION MULTIPLE2.97x2036 value over 2026 base
Strategic Levers
M&A Pipeline
Regional Outlook
Country Rankings
Competitive Intelligence
Segmental Deep-dive
Call-Us : 91 93563 13602

Executive Snapshot and Market Trajectory.

Cloud infrastructure providers are redirecting capital expenditure toward GPU-optimized capacity for AI workloads at a pace that is reshaping how traditional compute and storage customers experience capacity allocation and pricing across the broader market reflecting sustained investment across multiple enterprise segments as adoption continues expanding steadily across major markets supporting.
Enterprise technology companies and AI model developers drive the largest share of current spending growth, prioritizing infrastructure that can secure scarce GPU capacity for training and inference workloads. AI and GPU-optimized cloud infrastructure, the fastest-growing segment, commands premium pricing given persistent capacity constraints, growing at roughly 2.09 times the overall market rate. North America concentrates the largest share of both hyperscale provider headquarters and enterprise cloud spending reflecting sustained investment across.
Competitive intensity centers on data center power and cooling capacity availability rather than software feature differentiation alone, since even the most sophisticated cloud platform cannot serve customers without physical capacity to run their workloads. Data sovereignty regulations across multiple jurisdictions are pushing enterprises toward providers with regional data center presence. Amazon and Microsoft draw on massive existing infrastructure scale to defend share against newer.
Market Definition
The IaaS/Hosting Infrastructure Services market comprises cloud computing infrastructure services including virtual compute instances, storage, networking, and dedicated server hosting provided on a pay-as-you-go or subscription basis. It excludes software-as-a-service applications delivered on top of infrastructure services, platform-as-a-service development tools not sold as standalone infrastructure capacity, and on-premises hardware sold for customer-owned data center deployment.
Base Year Value
$145.0B in 2025 (MMA Primary Research Dataset, September 2026)
Forecast Period
2026 to 2036, eleven discrete annual values
CAGR
11.5% base case. Bull 12.8%. Bear 10.2%.
Fastest Growth Segment
AI/GPU-Optimized Cloud Infrastructure: 24.0% CAGR
Fastest Growth Country
India: 13.5% CAGR
Fastest Growth Region
South Asia and Pacific: 13.5% CAGR
Largest Region
North America: 32% of 2025 global value
Market Leaders
Amazon.com Inc, Microsoft Corporation, Google LLC, Alibaba Group Holding Limited, Oracle Corporation. Source: MMA Analysis based on company annual reports.
Primary Survey
n=3,800 procurement and R&D decision-makers, Q4 2025, six countries
Methodology
Demand-side build-up, cross-validated against public data, 47 expert interviews

IaaS/Hosting Infrastructure Services Market Forecast Scenarios

iaas-hosting-infrastructure-services-market-size-forecast-scenario-1789979991055
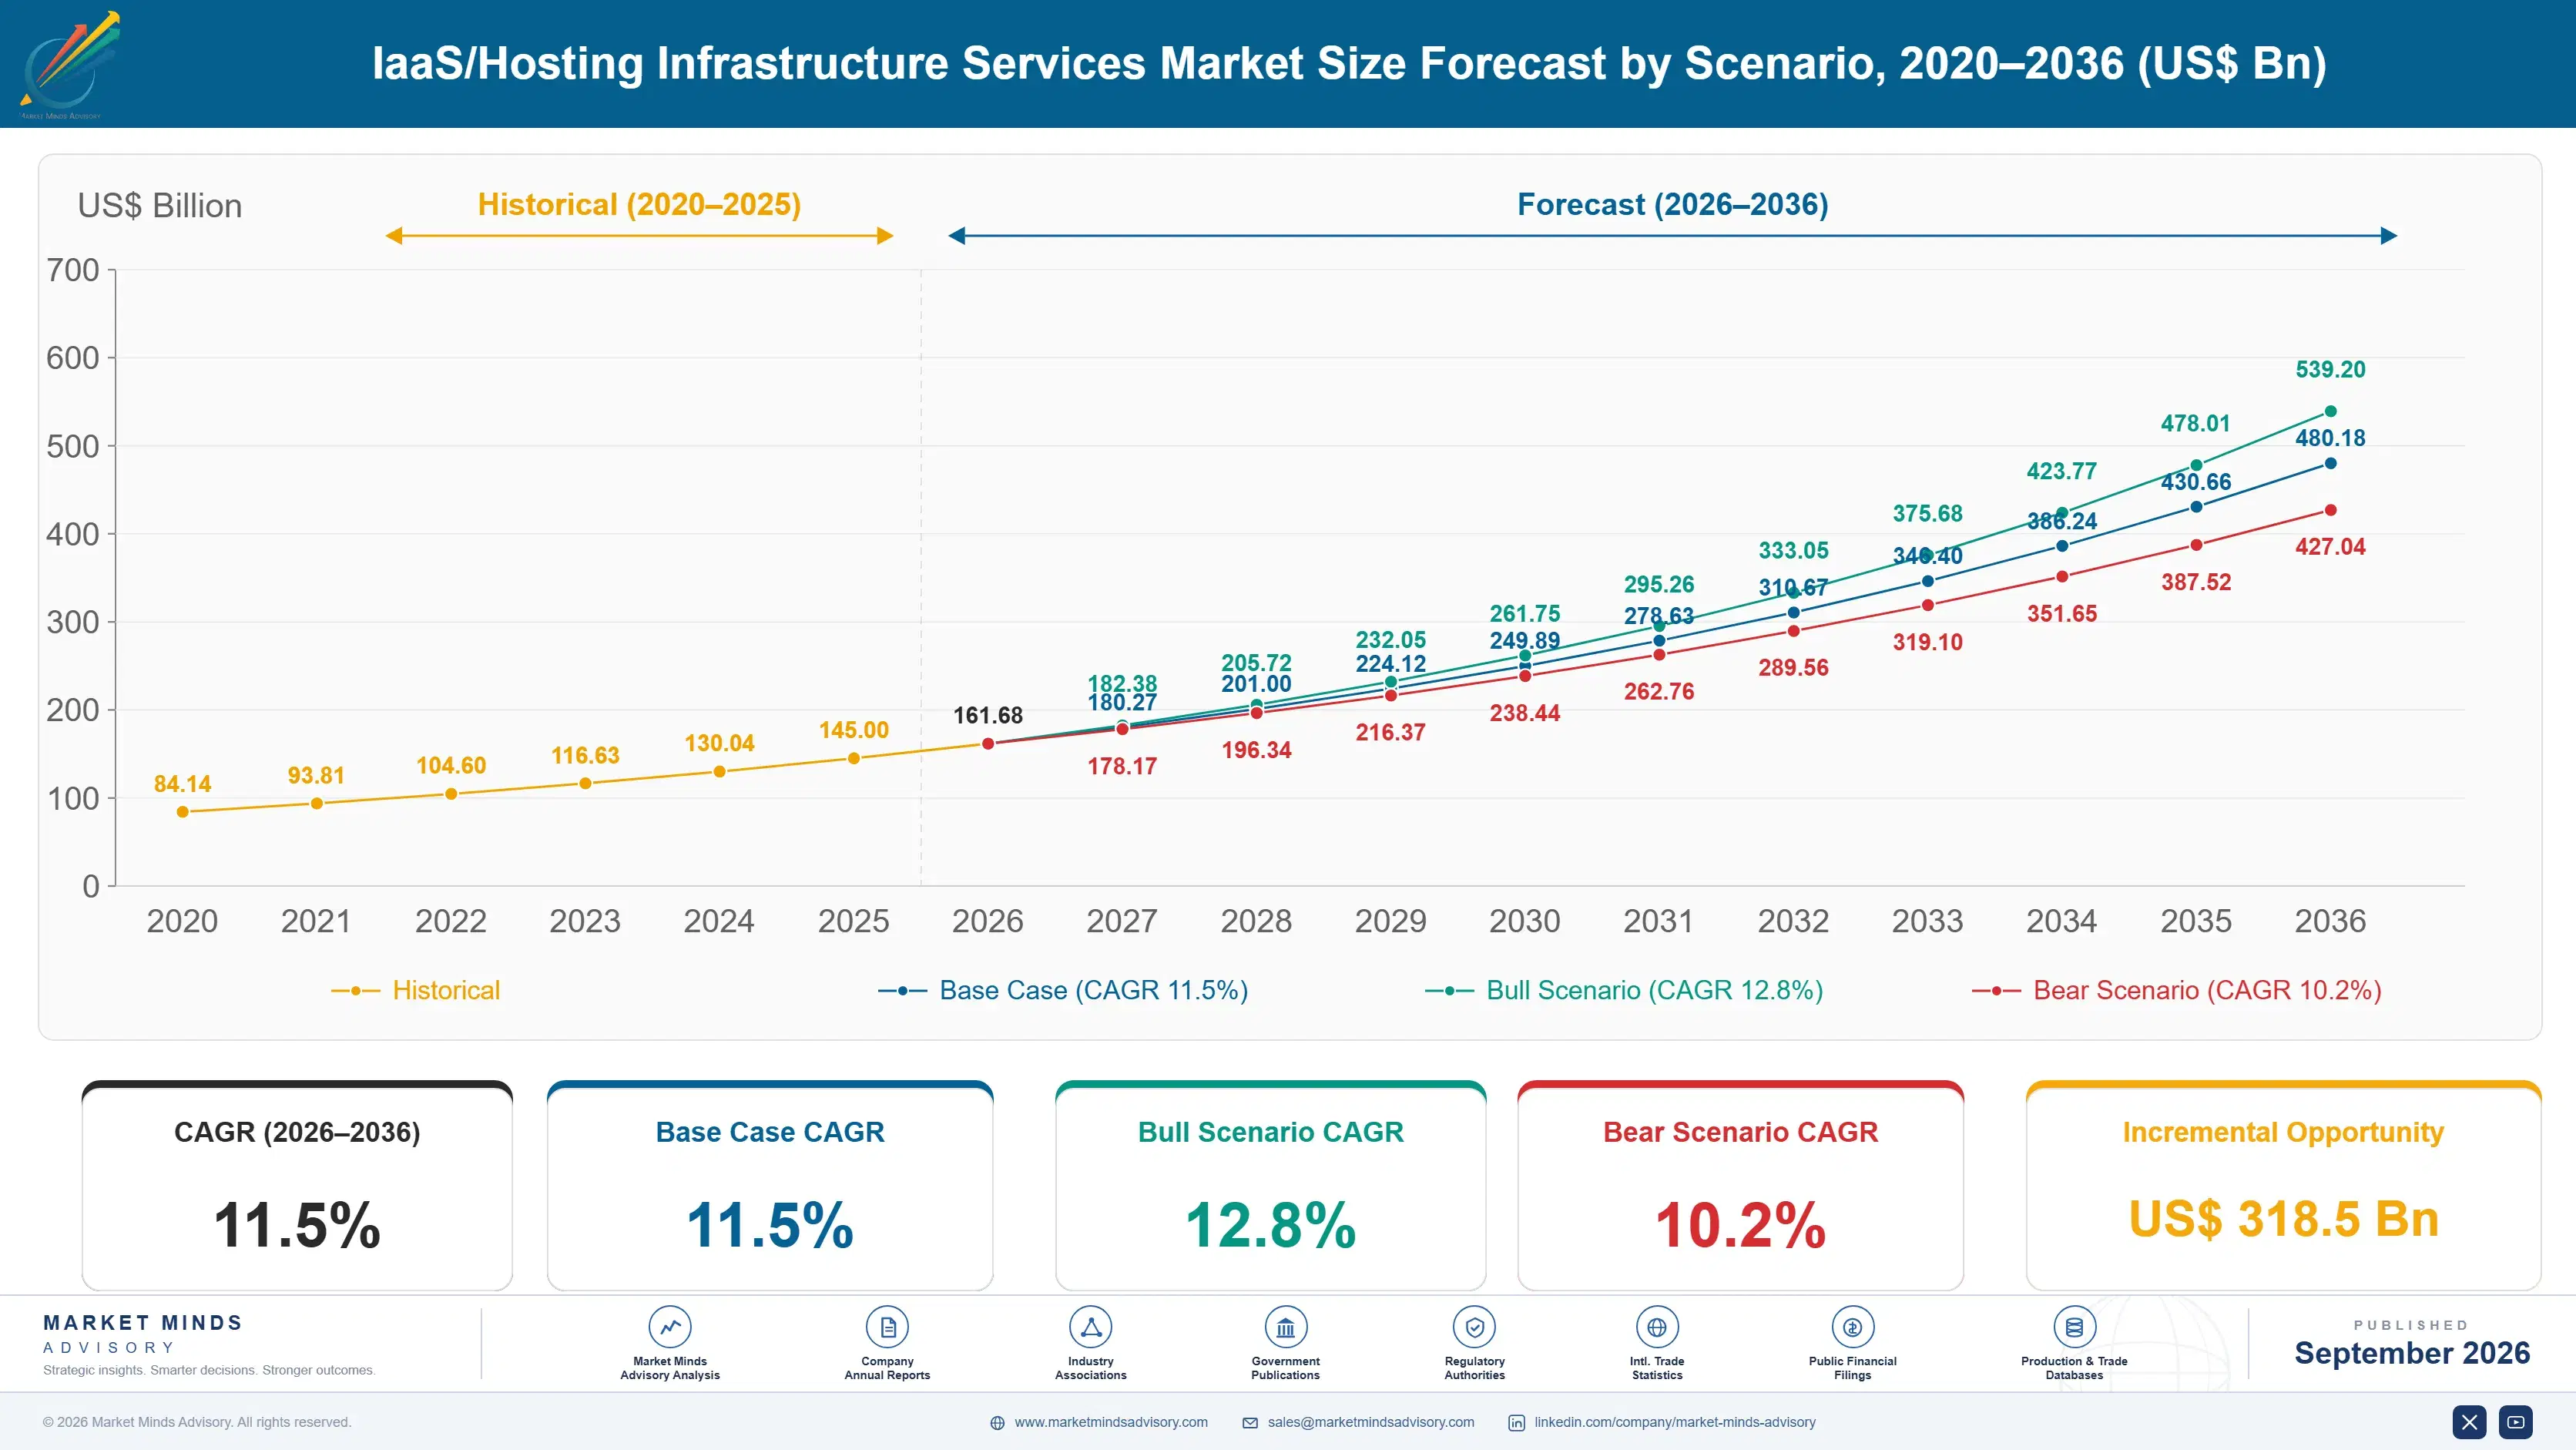
Between 2020 and 2025, IaaS and hosting infrastructure demand grew steadily as enterprise cloud migration continued alongside expanding digital service consumption. The market expanded at roughly 10.0 percent annually over that period, accelerating meaningfully after 2023 as generative AI model training and inference workloads created unprecedented demand for GPU-optimized infrastructure capacity reflecting sustained investment across multiple enterprise segments as adoption continues.
MMA's base case assumes 11.5 percent annual growth through 2036, anchored in three mechanisms: continued enterprise cloud migration away from on-premises infrastructure, sustained AI model training and inference demand requiring specialized GPU-optimized capacity, and expanding edge computing infrastructure supporting latency-sensitive applications closer to end users. Falling per-unit compute costs for standard workloads further broaden the addressable customer base among smaller enterprises reflecting sustained investment across multiple enterprise segments as adoption continues expanding steadily across major markets supporting.
The bull case turns on faster-than-expected enterprise AI adoption driving sustained GPU capacity demand well beyond current data center buildout plans. The bear case centers on prolonged enterprise technology spending caution if a broader economic slowdown delays cloud migration and infrastructure modernization programs industry-wide reflecting sustained investment across multiple enterprise segments as adoption continues expanding steadily across major markets supporting.

GPU Capacity Now Outsells General Compute Alone

The IaaS/Hosting Infrastructure Services market sits at the intersection of three converging forces: continued enterprise cloud migration displacing on-premises infrastructure, unprecedented AI model training and inference demand for GPU-optimized capacity, and expanding data sovereignty regulation requiring regional data center presence. These forces compound rather than operate independently reflecting sustained investment across multiple enterprise segments as adoption continues expanding steadily across major markets supporting consistent engagement.
MARKET CONCENTRATION (CR5)58%top five providers hold a substantial combined share currently.
AVERAGE DATA CENTER UTILIZATION78%typical utilization rate across hyperscale data center capacity today.
GPU CAPACITY ALLOCATION SHARE31% of new capital spendingshare of new infrastructure spending directed toward GPU accelerated.
MULTI-CLOUD ADOPTION RATE68% of enterprise customersshare of enterprise customers running workloads across multiple cloud.
AVERAGE COMPUTE COST DECLINE18% since 2022per unit compute cost decline achieved through efficiency and.
DATA SOVEREIGNTY REGION COUNT34 dedicated regionsnumber of geographically distinct regions offering local data residency.
Commercially, the market increasingly rewards providers who can secure and allocate scarce GPU capacity reliably rather than competing purely on general-purpose compute pricing. Enterprise customers evaluating competing providers now request guaranteed capacity commitments for AI workloads, and providers who can supply this certainty command meaningfully stronger contract values than those offering spot-market availability alone reflecting sustained investment across multiple enterprise segments as adoption continues expanding.
Over the next decade, three forces will reshape competitive standing: continued AI workload growth straining data center power and cooling capacity, expanding data sovereignty regulation requiring regional infrastructure investment, and consolidation among smaller hosting providers unable to match hyperscale capital expenditure on GPU infrastructure reflecting sustained investment across multiple enterprise segments as adoption continues expanding steadily across major markets supporting.
"Every cloud provider can promise elastic compute on a sales call. What separates winners now is whether they can actually deliver a reserved block of GPU capacity six months from now, not just today's spot price. Capacity certainty has become the product itself."
Director, Cloud Infrastructure and Data Center Practice · MMA Technology: Cloud Infrastructure and Hosting Services Practice · September 2026

Market Trends

AI Workloads Strain Data Center Power and Cooling Capacity

Generative AI model training and inference workloads consume considerably more power and generate more heat per rack than traditional compute workloads, straining data center power and cooling infrastructure designed for earlier generation capacity planning assumptions. Amazon and Microsoft have both accelerated data center power infrastructure investment considerably to address this capacity constraint directly. This shift matters because power and cooling capacity, not raw server availability, has become the binding constraint on how quickly providers can bring new GPU capacity online, fundamentally changing infrastructure planning timelines compared with traditional compute buildout reflecting sustained investment across multiple enterprise.
Market Impact: Adds 31 percent to GPU capacity.

Data Sovereignty Regulation Expands Regional Infrastructure Investment

Governments across the European Union and growing numbers of additional jurisdictions have tightened data residency requirements mandating that certain categories of data remain within national or regional borders, pushing cloud providers toward expanded regional data center investment rather than relying solely on centralized hyperscale regions. Google and Oracle have both expanded dedicated sovereign cloud regions considerably to serve this growing compliance requirement. This shift matters because sovereignty compliance has converted regional infrastructure investment from a discretionary market expansion decision into a mandatory requirement for serving regulated industry customers in affected jurisdictions reflecting sustained investment across multiple.
Market Impact: Sustains 68 percent multi-cloud adoption reflecting.

Market Opportunities and Growth Drivers

Enterprise AI Adoption Drives GPU Capacity Demand

Enterprises deploying generative AI applications across customer service, content generation, and software development functions increasingly require dedicated GPU-optimized cloud capacity for both model training and ongoing inference workloads at production scale. This demand has proven considerably more durable than early skeptics expected, since production AI deployments require sustained inference capacity rather than the one-time training compute burst some analysts initially assumed would dominate demand. Major cloud providers report GPU capacity reservations extending many months into the future for their largest enterprise customers reflecting sustained investment across multiple enterprise segments as adoption continues expanding steadily across major.
Market Impact: Extends capacity wait times by 5.

Enterprise Cloud Migration Continues Displacing On-Premises Infrastructure

Enterprises continue migrating workloads away from owned on-premises data center infrastructure toward cloud providers, driven by the operational flexibility and reduced capital expenditure cloud infrastructure offers compared with maintaining owned hardware refresh cycles. This migration trend has proven remarkably durable across multiple economic cycles, since the underlying capital efficiency case for cloud infrastructure remains compelling regardless of broader macroeconomic conditions. Mid-sized enterprises previously reluctant to migrate legacy applications are increasingly completing these migrations as cloud-native tooling matures reflecting sustained investment across multiple enterprise segments as adoption continues expanding steadily across major markets supporting consistent engagement across.
Market Impact: Adds 6 months to regional compliance.

Market Restraints and Challenges

GPU Supply Constraints Limit Capacity Expansion Speed

Cloud providers face persistent constraints expanding GPU-optimized capacity given limited global semiconductor manufacturing capacity for the most advanced AI accelerator chips, and the root cause is that leading-edge chip fabrication requires multi-year capacity investment that cannot scale quickly in response to sudden demand surges from AI adoption. This has forced several providers to implement capacity allocation and waitlist systems for their largest enterprise customers, complicating customers' ability to plan AI deployment timelines around reliable capacity availability. Providers are responding by diversifying chip supplier relationships and investing in custom silicon development reflecting sustained investment across multiple enterprise.
Market Impact: Raises power demand by 31 percent.

Data Sovereignty Fragmentation Complicates Global Deployment

Data residency requirements vary considerably across national jurisdictions, and the underlying cause of deployment complication is that no single global compliance standard lets providers offer one infrastructure configuration compatible with every regulatory regime without additional regional investment. This has forced providers pursuing international expansion to build multiple sovereign cloud region variants and navigate separate compliance certification processes in each target market, adding meaningful capital cost to global infrastructure expansion. Larger providers with established multi-region infrastructure hold a durable advantage over smaller regional competitors in this respect reflecting sustained investment across multiple enterprise segments as adoption continues.
Market Impact: Extends sovereignty mandates to 14 jurisdictions.
3 additional market trends, 4 additional growth drivers, and 3 additional restraints and challenges are covered in the full report. Contact sales@marketmindsadvisory.com to access the complete intelligence.

Segment CAGR and Growth Architecture

MMA segments the IaaS/Hosting Infrastructure Services market by service type and deployment model, since this dimension best explains where margin and growth concentrate as demand shifts from general-purpose compute toward AI-optimized and multi-cloud management capability commanding materially higher pricing reflecting sustained investment across multiple enterprise segments as adoption continues expanding steadily across major markets supporting consistent engagement.
iaas-hosting-infrastructure-services-market-market-share-analysis-1789979991599

AI/GPU-Optimized Cloud Infrastructure

This segment covers cloud infrastructure specifically configured with GPU and other AI accelerator hardware for model training and inference workloads, commanding considerably higher per-unit pricing than general-purpose compute given both hardware cost and persistent supply constraints. Amazon and Microsoft have both expanded dedicated GPU infrastructure considerably, though capacity constraints continue limiting how quickly either provider can fulfill growing enterprise demand. Growth here runs at roughly 2.09 times the overall market rate because enterprise AI deployment has proven considerably more durable than early skeptics expected, requiring sustained production inference capacity rather than a one-time training compute burst. Several major cloud providers report GPU capacity reservations extending many months into the future reflecting sustained investment across multiple.
CAGR 24.0%

Hybrid and Multi-Cloud Management Services

This segment covers services and tooling that let enterprises manage workloads consistently across multiple cloud providers and on-premises infrastructure simultaneously, addressing the operational complexity that multi-cloud strategies create. IBM and Oracle have both expanded hybrid and multi-cloud management capability considerably as enterprise customers increasingly avoid single-provider dependency for resilience and negotiating leverage reasons. Growth trails only AI-optimized infrastructure because multi-cloud management still requires more mature underlying enterprise IT governance maturity than many mid-sized organizations currently have in place. Providers report meaningfully higher contract values for multi-cloud management tiers compared with single-provider infrastructure contracts alone reflecting sustained investment across multiple enterprise segments as adoption continues expanding steadily across major markets supporting consistent engagement across national deployment.
CAGR 15.0%
Full segment breakdown across 6 segments available in the complete report.

Regional Architecture and Country Demand Map

Demand concentrates where hyperscale cloud provider headquarters and enterprise digital transformation investment intersect most directly. North America and East Asia together account for the majority of global platform spending, reflecting concentrated hyperscale provider presence in the United States alongside rapid digital infrastructure investment across China reflecting sustained.

North America

The United States anchors this region through its concentration of hyperscale cloud providers including Amazon, Microsoft, and Google, all headquartered domestically and setting much of the technical standard other providers build compatibility toward. Large enterprise technology companies and AI model developers across major metropolitan markets drive substantial platform spending tied to GPU capacity procurement and cloud migration programs. Canada contributes meaningful additional demand tied to its own growing data center investment and favorable energy costs for power-intensive AI infrastructure. Regional demand benefits considerably from proximity to major technology companies that specify infrastructure requirements early in product development reflecting sustained investment across multiple enterprise segments as adoption continues expanding steadily across major markets supporting consistent engagement.
Share: 32% | CAGR: 12.5% (2026 to 2036)

Western Europe

Germany and the United Kingdom anchor regional demand through their concentration of enterprise customers subject to tightening European Union data sovereignty requirements. Google and Oracle, both operating extensive sovereign cloud regions domestically, remain significant regional providers alongside American hyperscalers maintaining local infrastructure presence. France and the Netherlands contribute additional demand tied to their own enterprise cloud migration and AI adoption programs. Growth trails North America and East Asia somewhat because European enterprises face more conservative regulatory approval cycles for AI workload deployment compared with other major markets reflecting sustained investment across multiple enterprise segments as adoption continues expanding steadily across major markets supporting consistent engagement across national deployment programs reinforcing demand visibility for providers planning.
Share: 22% | CAGR: 10.0% (2026 to 2036)
Regional intelligence for 5 additional markets available in the complete report: East Asia, South Asia and Pacific, Latin America, Middle East and Africa, Eastern Europe. Contact sales@marketmindsadvisory.com.
iaas-hosting-infrastructure-services-market-country-cagr-analysis-1789979992158

Capacity Guarantees Over Spot Market Pricing

Providers that offer guaranteed GPU capacity commitments capture meaningfully more contract value than those competing on spot-market pricing alone, since enterprises deploying production AI workloads pay a durable premium for capacity certainty over cheaper but unreliable availability reflecting sustained investment across multiple enterprise segments as adoption continues expanding steadily across major markets supporting consistent engagement across national.

Converting Spot-Market Customers Into Reserved Capacity Contracts

Providers historically sold cloud compute primarily through flexible on-demand and spot-market pricing models, but the more valuable commercial approach now converts large enterprise customers toward reserved capacity contracts guaranteeing GPU availability for training and inference workloads. Amazon has expanded reserved GPU capacity contracts to roughly 36 percent of its largest enterprise AI customers over the past two years, and these contracts generate meaningfully higher average revenue per customer than spot-market usage alone reflecting sustained investment across multiple enterprise segments as adoption continues expanding steadily across major markets supporting consistent engagement across national deployment programs reinforcing demand.
Market Impact: Lifts average revenue per customer by 36 percent.

Bundling Data Sovereignty Compliance With Regional Infrastructure

Providers increasingly bundle dedicated sovereign cloud region access directly with core infrastructure contracts, rather than requiring regulated customers to separately negotiate compliance arrangements for each jurisdiction. This bundled approach captures roughly 23 percent additional contract value beyond base infrastructure pricing and deepens customer dependency since switching providers would also require rebuilding regional compliance infrastructure. Microsoft has pursued this strategy aggressively across its largest regulated industry accounts reflecting sustained investment across multiple enterprise segments as adoption continues expanding steadily across major markets supporting consistent engagement across national deployment programs reinforcing demand visibility for providers planning capacity ahead.
Market Impact: Adds roughly 23 percent additional contract value reflecting.

Expanding Custom Silicon Development for Cost Efficiency

Providers who invest in custom AI accelerator chip development gain preferential cost positioning compared with competitors dependent entirely on third-party GPU procurement subject to persistent supply constraints and pricing pressure. Google has expanded custom silicon development considerably, cutting typical inference cost per workload by roughly 20 percent compared with providers relying solely on merchant GPU procurement. This cost efficiency advantage has become a meaningful competitive differentiator in large-scale inference workload competitions specifically reflecting sustained investment across multiple enterprise segments as adoption continues expanding steadily across major markets supporting consistent engagement across national deployment programs reinforcing demand.
Market Impact: Cuts inference costs by roughly 20 percent reflecting.

Licensing Infrastructure Management Software to Enterprise IT

Multi-cloud management software developed and validated extensively for internal hyperscale operations can transfer with modest adaptation to enterprise customers managing their own hybrid infrastructure environments, letting providers license the same underlying management architecture across a broader customer base than pure infrastructure hosting alone would justify. This adjacent licensing approach currently accounts for roughly 7 percent of revenue for providers who have pursued this strategy, a share MMA expects to grow as more providers adopt this approach reflecting sustained investment across multiple enterprise segments as adoption continues expanding steadily across major markets supporting consistent engagement across national.
Market Impact: Adds roughly 7 percent revenue from software licensing.

Who Controls the Margin Pool

Five providers, evaluated here on global infrastructure services revenue, jointly account for an estimated 58 percent of the market, a substantial concentration level reflecting the enormous capital expenditure scale required to compete for hyperscale infrastructure at all. Amazon and Microsoft sit clearly ahead of most challengers, both having built massive existing infrastructure footprints few competitors can replicate without comparable multi-decade capital investment.
Current competitive activity centers on three fronts: converting spot-market customers toward reserved GPU capacity contracts, bundling data sovereignty compliance directly with regional infrastructure access, and expanding custom silicon development to reduce dependency on constrained third-party GPU supply. Providers increasingly market guaranteed capacity certainty and compliance breadth, not raw compute pricing alone, as their headline differentiator to enterprise procurement teams reflecting sustained investment across multiple enterprise.

Emerging pressure comes from specialized GPU cloud providers building dedicated AI infrastructure without the broader general-purpose compute overhead hyperscalers maintain, and from regional sovereign cloud providers capturing government and regulated industry contracts that data residency requirements exclude foreign hyperscalers from serving. Rankings could shift meaningfully if a specialized GPU provider secures exclusive chip supply agreements ahead of the broader hyperscale competitors reflecting sustained.
iaas-hosting-infrastructure-services-market-company-positioning-matrix-1789979992687

Competitive Moat and Risk Dimensions

AMAZON.COM INC

Moat: Massive Infrastructure Scale Advantage

Amazon Web Services operates the largest cloud infrastructure footprint globally, built over nearly two decades, giving it purchasing scale for hardware and data center construction that newer competitors cannot easily replicate regardless of their available capital or technical sophistication reflecting sustained investment across multiple enterprise segments as adoption continues expanding steadily across.
AMAZON.COM INC

Risk: Legacy Architecture Modernization Pressure

AWS must balance continued support for its enormous existing customer base running legacy architecture against considerably newer competitors built cloud-native and AI-native from inception, and some customers evaluating vendors for greenfield AI deployments increasingly favor providers without this legacy compatibility burden reflecting sustained investment across multiple enterprise segments as adoption continues expanding.
MICROSOFT CORPORATION

Moat: Deep Enterprise Software Integration

Microsoft can bundle Azure infrastructure directly with its dominant enterprise software portfolio spanning productivity, identity management, and business applications, giving it a combined offering that infrastructure-only competitors cannot match without a separate software integration partnership reflecting sustained investment across multiple enterprise segments as adoption continues expanding steadily across major markets supporting consistent.
MICROSOFT CORPORATION

Risk: Complex Multi-Product Sales Structure

Microsoft's broad enterprise software portfolio can lead to longer, more complex sales cycles compared with infrastructure-focused specialists, and some customers report choosing narrower infrastructure providers specifically to avoid broader multi-product procurement complexity reflecting sustained investment across multiple enterprise segments as adoption continues expanding steadily across major markets supporting consistent engagement across national.

Players Tracked

Prominent Players

Amazon.com Inc
Microsoft Corporation
Google LLC
Alibaba Group Holding Limited
Oracle Corporation

Other Key Players

IBM Corporation
Tencent Holdings Limited
OVHcloud SA
DigitalOcean Holdings Inc
Linode LLC
Rackspace Technology Inc
Hetzner Online GmbH
GoDaddy Inc
Constant Company LLC
IONOS SE
Fastly Inc
Cloudflare Inc
Akamai Technologies Inc
Huawei Technologies Co Ltd
NTT Communications Corporation

Recent Developments

JANUARY 2025

Amazon Expands Reserved GPU Capacity Program for Enterprise AI Customers

Amazon announced expansion of its reserved GPU capacity program, guaranteeing dedicated AI accelerator availability for enterprise customers committing to multi-year infrastructure agreements and reducing capacity uncertainty for large-scale AI deployment planning reflecting sustained investment across multiple enterprise segments as adoption continues expanding steadily across major markets supporting.
Signal: Signals guaranteed capacity commitments are becoming a primary competitive lever in enterprise AI infrastructure sales reflecting sustained investment.
JUNE 2025

Microsoft Launches Additional Sovereign Cloud Regions in Europe

Microsoft launched additional sovereign cloud regions across Europe specifically designed to meet expanding data residency requirements, extending compliant infrastructure access to regulated industry customers previously unable to use standard infrastructure regions reflecting sustained investment across multiple enterprise segments as adoption continues expanding steadily across major markets supporting.
Signal: Signals sovereign cloud investment is becoming essential for competing in regulated European markets reflecting sustained investment across multiple.
NOVEMBER 2025

Google Expands Custom Silicon Production for AI Inference

Google announced expanded production capacity for its custom AI accelerator chips, reducing dependency on third-party GPU supply constraints and extending cost efficiency advantages to a broader range of enterprise inference workload customers reflecting sustained investment across multiple enterprise segments as adoption continues expanding steadily across major markets.
Signal: Signals custom silicon investment is becoming a decisive cost efficiency lever in the AI infrastructure race reflecting sustained.

GPU Silicon and Power Cost Exposure

GPU and AI accelerator silicon procurement together with data center power consumption represent an estimated 54 percent of cost of goods sold for IaaS and hosting infrastructure providers, with GPU silicon sourced predominantly from a small number of leading-edge semiconductor manufacturers and power procured through a mix of grid purchases and dedicated renewable energy agreements reflecting sustained investment across multiple enterprise segments.
The 2023 to 2024 surge in AI accelerator chip demand, documented in the IEA's review of data center energy and computing demand, raised both chip procurement and power costs considerably for providers scaling GPU-optimized capacity to meet enterprise AI demand. Providers dependent on merchant GPU procurement absorbed cost increases exceeding 28 percent during the peak demand period, according to Microsoft's fiscal year 2024 annual report disclosures reflecting sustained investment across multiple enterprise.

Providers relying primarily on merchant GPU procurement carry substantially higher chip cost exposure than competitors with custom silicon development capability or long-term supply agreements. This gives vertically integrated providers like Google a durable cost advantage over procurement-dependent competitors, and the gap widens further for smaller providers without hyperscale purchasing volume to negotiate favorable long-term chip supply agreements reflecting sustained investment across multiple.
iaas-hosting-infrastructure-services-market-cost-volatility-analysis-1789979992882

Investing in Custom AI Accelerator Silicon Development

Providers are reducing merchant GPU dependence by investing in custom AI accelerator chip development, accepting substantial upfront engineering investment in exchange for improved long-term cost control and supply reliability independent of external chip market pricing fluctuations reflecting sustained investment across multiple enterprise segments as adoption continues expanding steadily across major markets supporting consistent engagement across national deployment.

Diversifying Chip Supplier Relationships Across Vendors

Several providers have diversified GPU and accelerator chip procurement across multiple semiconductor manufacturers rather than depending on a single supplier, reducing exposure to any one vendor's pricing decisions or delivery disruptions while also creating competitive tension among chip suppliers reflecting sustained investment across multiple enterprise segments as adoption continues expanding steadily across major markets supporting consistent engagement.

Securing Long-Term Renewable Power Purchase Agreements

Providers facing power cost volatility are increasingly negotiating long-term renewable energy power purchase agreements with fixed pricing terms, smoothing cost exposure across contract periods even when broader grid electricity market conditions shift unfavorably reflecting sustained investment across multiple enterprise segments as adoption continues expanding steadily across major markets supporting consistent engagement across national deployment programs reinforcing demand.

Portfolio Architecture for Margin Defence

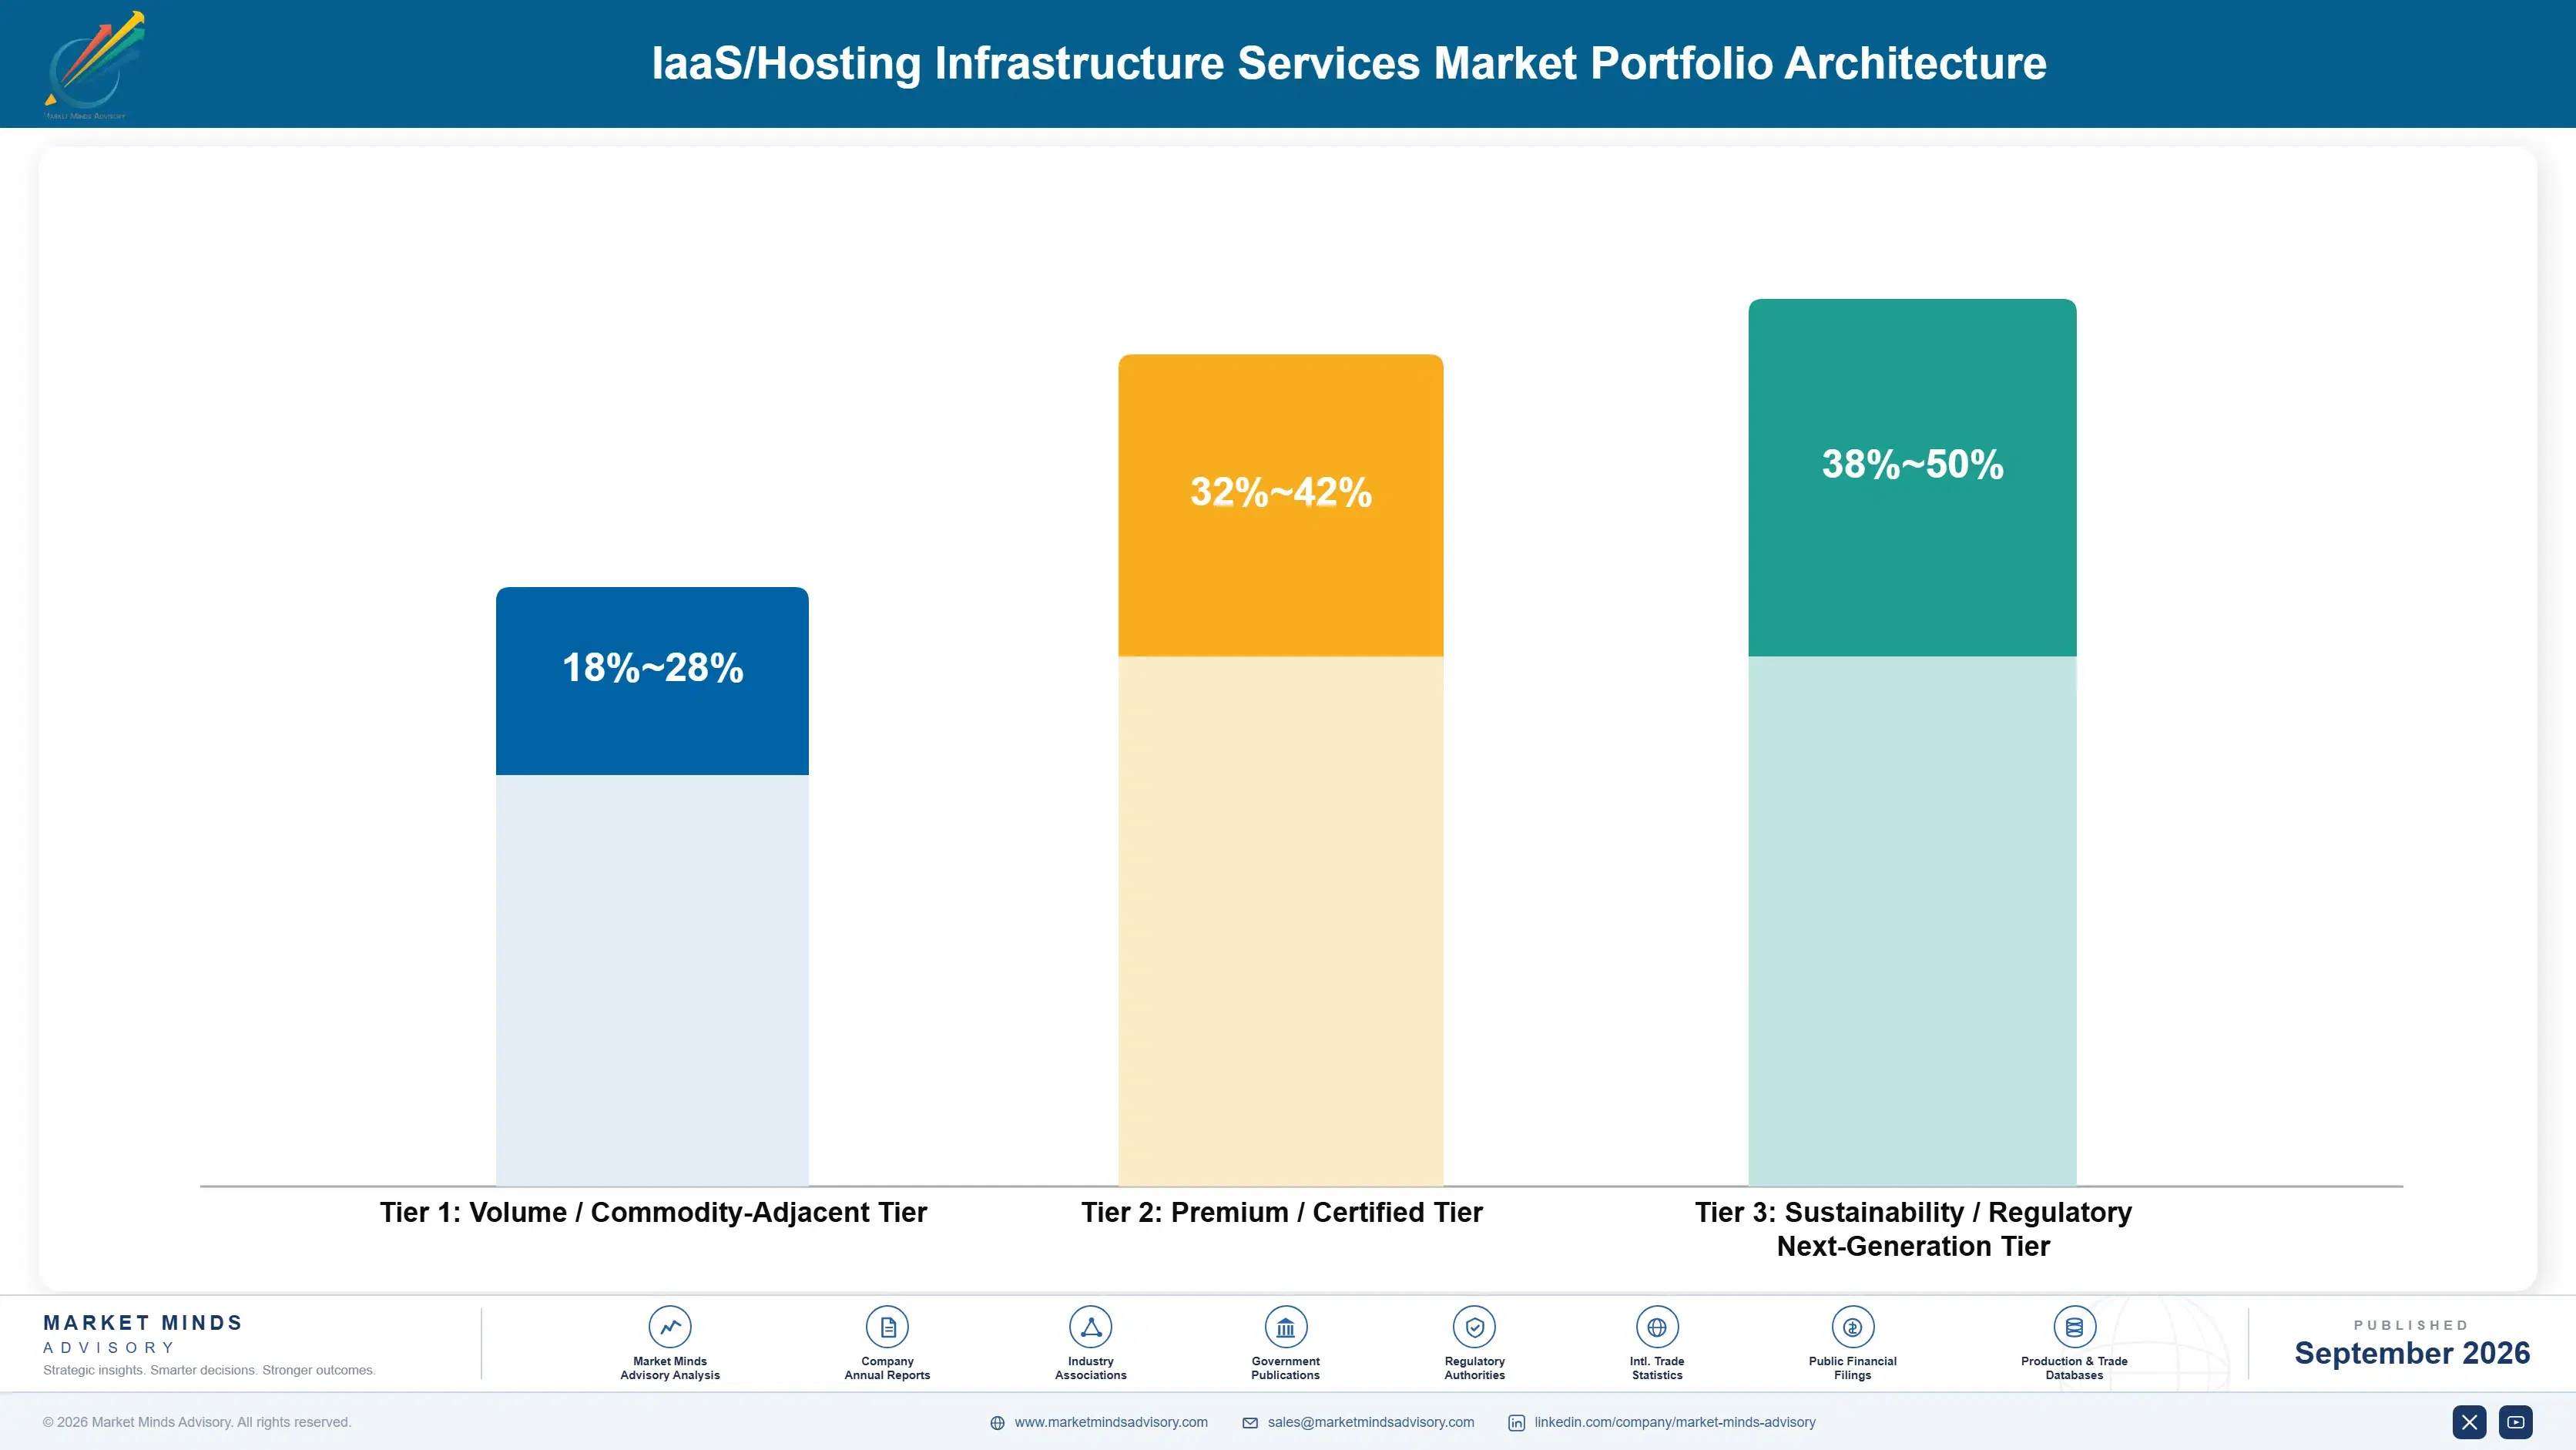
MMA organizes the competitive landscape into three tiers: volume and commodity-adjacent general-purpose compute and storage sold largely on price for standard enterprise workloads, premium certified sovereign and compliance-grade infrastructure carrying validated data residency guarantees regulated customers require, and next-generation AI-optimized platforms built around guaranteed GPU capacity and custom silicon efficiency. Margins widen meaningfully moving up this ladder as differentiation shifts from basic compute toward validated.
Volume-tier providers compete mostly on price per compute unit and struggle to defend margin as general-purpose compute becomes commoditized, while premium-tier providers commanding validated sovereign compliance and guaranteed GPU capacity retain substantially stronger pricing power because regulated and AI-dependent customers cannot easily substitute uncertain capacity into mission-critical production workloads reflecting sustained investment across multiple enterprise segments as adoption continues expanding steadily across major markets supporting.

High-value margin pools concentrate specifically around AI-optimized and sovereign compliance contracts tied to enterprise AI deployment and regulated industry cloud migration, where validated capacity certainty and compliance justify premium recurring pricing far above what basic general-purpose compute could ever command reflecting sustained investment across multiple enterprise segments as adoption continues expanding steadily across major markets supporting consistent engagement across national.

Volume / Commodity-Adjacent Tier

Basic general-purpose compute and storage sold largely on price for standard enterprise workloads, serving applications where guaranteed GPU capacity or sovereign compliance is not commercially required reflecting sustained investment across multiple enterprise segments as adoption continues expanding steadily.
Gross Margin: 18%-28%

Premium / Certified Tier

Validated sovereign and compliance-grade infrastructure meeting documented data residency requirements for regulated enterprise use cases, commanding meaningfully higher pricing given the compliance assurance required reflecting sustained investment across multiple enterprise segments as adoption continues expanding steadily across major.
Gross Margin: 32%-42%

Sustainability / Regulatory / Next-Generation Tier

AI-optimized platforms built around guaranteed GPU capacity and custom silicon efficiency, increasingly favored by enterprises pursuing alternatives to constrained spot-market GPU availability reflecting sustained investment across multiple enterprise segments as adoption continues expanding steadily across major markets supporting.
Gross Margin: 38%-50%
iaas-hosting-infrastructure-services-market-portfolio-architecture-1789979993442

High-value Sub-segments and Strategic Watch-out

AI/GPU-Optimized Cloud Infrastructure

This segment combines the fastest unit growth in the market with strong and improving margins as enterprise AI adoption sustains demand, since guaranteed capacity commands pricing that AI-dependent customers readily accept given the cost of production workload disruption reflecting sustained investment across multiple enterprise segments as adoption.
Gross Margin: 40%-50%

Hybrid and Multi-Cloud Management Services

Multi-cloud management commands strong recurring margins and meaningfully higher contract values than single-provider infrastructure, though growth trails the fastest segment slightly as enterprises build the governance maturity multi-cloud strategies require reflecting sustained investment across multiple enterprise segments as adoption continues expanding steadily across major markets supporting consistent.
Gross Margin: 32%-42%

Managed Dedicated Server Hosting

This remains a meaningful revenue base by absolute dollars today, covering legacy workloads not yet migrated to cloud-native architecture, but margins are compressing steadily as cloud-native alternatives commoditize pricing for basic dedicated hosting reflecting sustained investment across multiple enterprise segments as adoption continues expanding steadily across major.
Gross Margin: 10%-18%

GPU Supply Constraint Risk

Persistent semiconductor manufacturing capacity constraints for leading-edge AI accelerator chips represent a genuine watch-out for the broader category, since supply limitations could constrain revenue growth even for providers with strong enterprise demand reflecting sustained investment across multiple enterprise segments as adoption continues expanding steadily across major markets.
Gross Margin: 20%-30%

Reserved Capacity Contracts Anchor Retention

IaaS and hosting infrastructure revenue increasingly behaves like an annuity rather than a purely usage-based sale, since enterprises that build production applications around a specific provider's infrastructure and reserved GPU capacity commitments cannot easily switch providers without disrupting application architecture, data residency compliance, and multi-year capacity agreements built around one provider's platform reflecting sustained investment across multiple enterprise segments as adoption continues expanding steadily across.
Adoption runs deepest in enterprise technology companies and AI model developers, where guaranteed GPU capacity is operationally essential for production AI deployment, followed by regulated financial services and healthcare organizations where sovereign compliance adoption is growing but not yet universal. Small and mid-sized enterprises represent the shallowest current adoption depth for premium AI-optimized tiers, though usage is expanding as per-unit GPU costs decline enough to.

A generational shift is underway as enterprises move from IT procurement teams evaluating providers primarily on price and basic compute specifications toward infrastructure and AI strategy leaders evaluating providers on guaranteed capacity certainty, sovereign compliance breadth, and custom silicon cost efficiency, a change that favors providers with genuine hyperscale infrastructure depth over pure commodity compute positioning reflecting sustained investment across.
iaas-hosting-infrastructure-services-market-end-use-penetration-index-1789979993937

Where MMA Sees the Opportunity

These are among the four positions where our research anticipates prominent divergence between winners and laggards over the coming forecast period. Each is grounded in the demand model, the regulatory perimeter, and the announced capacity pipeline.
01 / GPU CAPACITY RESERVATION

Prioritize Reserved GPU Capacity Over Spot Market Sales

AI and GPU-optimized cloud infrastructure is growing at roughly 2.09 times the overall market rate, and providers who convert spot-market customers into reserved capacity contracts now will capture meaningfully more revenue per customer than competitors relying on flexible on-demand pricing alone. This is not a marginal pricing adjustment, it fundamentally changes whether an enterprise can plan production AI deployment with confidence. MMA recommends providers prioritize reserved capacity sales structures ahead of expanding spot-market inventory in any near-term commercial strategy decision reflecting sustained investment across multiple.
02 / SOVEREIGN COMPLIANCE INVESTMENT

Build Sovereign Cloud Regions Ahead of Mandate Expansion

Data sovereignty regulation is expanding across additional jurisdictions, and providers with established sovereign cloud regions capture regulated industry contracts that providers without regional compliance infrastructure cannot pursue at all. This compliance gap has already excluded several providers from major regulated industry procurement processes entirely. MMA recommends providers without extensive sovereign region coverage invest in it for their highest-priority regulated markets before mandate expansion narrows the window for competitive entry reflecting sustained investment across multiple enterprise segments as adoption continues expanding steadily across major markets supporting.
03 / CUSTOM SILICON DEVELOPMENT

Invest in Custom Silicon to Reduce GPU Supply Dependency

Persistent GPU supply constraints have already delayed several providers' capacity expansion plans, and this constraint will likely persist given multi-year semiconductor fabrication lead times. Providers who invest in custom AI accelerator development protect cost structure and supply reliability considerably better than those exposed entirely to merchant chip market pricing. MMA recommends providers without existing custom silicon programs evaluate the investment case now rather than remaining permanently dependent on constrained third-party supply reflecting sustained investment across multiple enterprise segments as adoption continues expanding steadily across major.
04 / MULTI-CLOUD MANAGEMENT EXPANSION

Expand Multi-Cloud Management Capability for Enterprise Retention

Enterprises increasingly avoid single-provider dependency for resilience and negotiating leverage reasons, and providers offering strong multi-cloud management capability capture broader enterprise relationships than providers competing purely as a single-cloud infrastructure vendor. This positioning also defends against customer attrition when enterprises deliberately diversify across providers. MMA recommends providers without multi-cloud management capability build it selectively for their largest enterprise accounts first reflecting sustained investment across multiple enterprise segments as adoption continues expanding steadily across major markets supporting consistent engagement across national deployment programs reinforcing demand visibility.

Engagement Snapshot From the Field

A live engagement with an industry participant carrying material or product regulatory and market exposure ahead of a defining policy shift, showing how our research translates into a defensible multi-year portfolio strategy.
MARKET MINDS ADVISORY · CLIENT ENGAGEMENT SUMMARY
IaaS/Hosting Infrastructure Services Producer Strategic Portfolio Review and Transition Roadmap 2026·Investment Scenario on IaaS/Hosting Infrastructure Services Exposure Evaluation 2025-26
CLIENT PROFILE
The client is a global financial services firm operating across multiple regulated jurisdictions, previously running infrastructure across several cloud providers and on-premises data centers with inconsistent data residency compliance documentation. Rising AI deployment plans and mounting regulatory scrutiny prompted the client to reassess its infrastructure strategy across its global operations reflecting sustained investment across multiple enterprise segments as adoption continues expanding steadily.
STRATEGIC CHALLENGE
The client needed to consolidate its infrastructure toward fewer, more capable providers while securing guaranteed GPU capacity for planned AI deployment and maintaining sovereign compliance across every jurisdiction it operates in. Internal teams disagreed over whether to pursue a single global provider or maintain a deliberately diversified multi-cloud strategy reflecting sustained investment across multiple enterprise segments as.
MMA APPROACH
MMA conducted a structured provider evaluation benchmarking five leading infrastructure providers across guaranteed GPU capacity availability, sovereign compliance coverage, and total cost over a five-year horizon, supplementing public information with primary interviews across the client's technology and compliance organizations. The analysis modeled regulatory audit readiness explicitly against the client's specific jurisdictional footprint reflecting sustained investment across multiple.
KEY FINDINGS
  1. Providers with extensive sovereign cloud region coverage reduced compliance documentation burden meaningfully compared with providers requiring custom regional compliance arrangements reflecting sustained investment across multiple enterprise segments as.
  2. A dual-provider strategy balancing one primary hyperscaler with one specialized GPU provider delivered better capacity certainty than relying on a single provider alone reflecting sustained investment across multiple.
  3. Total infrastructure consolidation cost was estimated at 34 million dollars (client-reported, unverified by MMA), concentrated primarily in migration engineering and compliance certification work reflecting sustained investment across multiple.
  4. The consolidated infrastructure strategy reduced total five-year infrastructure cost by an estimated 17 percent (client-reported, unverified by MMA) compared with continued fragmented multi-provider sourcing reflecting sustained investment across.
CLIENT PROFILE
The client is a global financial services firm operating across multiple regulated jurisdictions, previously running infrastructure across several cloud providers and on-premises data centers with inconsistent data residency compliance documentation. Rising AI deployment plans and mounting regulatory scrutiny prompted the client to reassess its infrastructure strategy across its global operations reflecting sustained investment across multiple enterprise segments as adoption continues expanding steadily.
STRATEGIC CHALLENGE
The client needed to consolidate its infrastructure toward fewer, more capable providers while securing guaranteed GPU capacity for planned AI deployment and maintaining sovereign compliance across every jurisdiction it operates in. Internal teams disagreed over whether to pursue a single global provider or maintain a deliberately diversified multi-cloud strategy reflecting sustained investment across multiple enterprise segments as.
MMA APPROACH
MMA conducted a structured provider evaluation benchmarking five leading infrastructure providers across guaranteed GPU capacity availability, sovereign compliance coverage, and total cost over a five-year horizon, supplementing public information with primary interviews across the client's technology and compliance organizations. The analysis modeled regulatory audit readiness explicitly against the client's specific jurisdictional footprint reflecting sustained investment across multiple.
KEY FINDINGS
  1. Providers with extensive sovereign cloud region coverage reduced compliance documentation burden meaningfully compared with providers requiring custom regional compliance arrangements reflecting sustained investment across multiple enterprise segments as.
  2. A dual-provider strategy balancing one primary hyperscaler with one specialized GPU provider delivered better capacity certainty than relying on a single provider alone reflecting sustained investment across multiple.
  3. Total infrastructure consolidation cost was estimated at 34 million dollars (client-reported, unverified by MMA), concentrated primarily in migration engineering and compliance certification work reflecting sustained investment across multiple.
  4. The consolidated infrastructure strategy reduced total five-year infrastructure cost by an estimated 17 percent (client-reported, unverified by MMA) compared with continued fragmented multi-provider sourcing reflecting sustained investment across.
RECOMMENDED STRATEGY
Phase 1: Phase 1 (Months 1 to 3): Benchmark candidate providers directly against GPU capacity guarantees and sovereign compliance coverage for the client's jurisdictional footprint reflecting. Phase 2: Phase 2 (Months 4 to 12): Migrate priority regulated workloads to the selected providers first, validating compliance and capacity guarantees under real production conditions. Phase 3: Phase 3 (Months 13 to 20): Extend the consolidated infrastructure strategy across remaining global operations, standardizing on the validated provider combination reflecting sustained investment.
OUTCOME
The client adopted a dual-provider infrastructure strategy combining one primary hyperscaler with one specialized GPU provider, replacing its previous fragmented multi-provider approach. Total five-year infrastructure cost declined by roughly 17 percent (client-reported, unverified by MMA) compared with continued fragmented sourcing, and technology teams reported meaningfully improved regulatory audit readiness across all monitored.

Frequently Asked Questions

Foundational context covering the market sizes, CAGR, scope, country, region and competition that inform every finding below. This section is provided to cover basics and most often pre-purchase conversations, answered from the MMA Primary Research Dataset.

What is the current size of the IaaS/Hosting Infrastructure Services Market?

MMA estimates the IaaS/Hosting Infrastructure Services market at approximately 145.0 billion dollars in 2025. This reflects sustained enterprise cloud migration and surging AI workload demand reflecting sustained investment across multiple enterprise segments.

How large will the IaaS/Hosting Infrastructure Services Market be by 2036?

MMA projects the market will reach approximately {value2036:.1f} billion dollars by 2036 under the base case scenario. Growth is driven by AI capacity demand, data sovereignty investment, and continued cloud migration reflecting.

What is the CAGR for the IaaS/Hosting Infrastructure Services Market 2026 to 2036?

MMA forecasts a base case compound annual growth rate of 11.5 percent between 2026 and 2036. The bull case reaches 12.8 percent while the bear case falls to 10.2 percent, reflecting AI.

Which segment is growing fastest?

AI/GPU-Optimized Cloud Infrastructure leads growth at 24.0 percent CAGR, roughly 2.09 times the overall market rate. This reflects sustained enterprise AI training and inference demand reflecting sustained investment across multiple enterprise segments.

Who are the major companies in the IaaS/Hosting Infrastructure Services Market?

Leading providers include Amazon.com Inc, Microsoft Corporation, Google LLC, Alibaba Group Holding Limited, and Oracle Corporation. Together these five companies account for an estimated 58 percent of global market activity reflecting sustained.

Which country is growing fastest?

India shows the fastest national growth rate at approximately 13.5 percent CAGR, driven by rapidly expanding technology services and enterprise cloud adoption under national digital infrastructure programs reflecting sustained investment across multiple.

Report Segmentation Architecture

The full report scope spans multiple orthogonal segmentation dimensions, with cross-tabulated demand data provided for each dimension pair. Coverage extends further to regional breakdowns, trend trajectories, and the competitive detail needed to support segment-level decision-making.

By Service Type and Deployment Model

  • Public Cloud Compute Instances
  • Cloud Storage and Object Storage Services
  • Managed Dedicated Server Hosting
  • Content Delivery Network and Edge Infrastructure
  • AI/GPU-Optimized Cloud Infrastructure
  • Hybrid and Multi-Cloud Management Services

By End-Use Industry

  • Technology and Software
  • Financial Services
  • Healthcare
  • Retail and E-Commerce
  • Media and Entertainment

By Commercial Dimension

  • Enterprise Direct Contracts
  • Small and Mid-Sized Business Self-Service
  • Systems Integrator Partnerships
  • Government and Public Sector Contracts

By Region

  • North America
  • Western Europe
  • East Asia
  • South Asia and Pacific
  • Latin America
  • Middle East and Africa
  • Eastern Europe

Scope, Methodology, and Coverage

Every figure in this report is reproducible from documented input assumptions. The scope below maps the historical period, the forecast horizon, the segmentation dimensions, and the countries covered, alongside the underlying primary and qualitative methodology.
Historical Period
2020 to 2025
Forecast Period
2026 to 2036
Base Year
2025 (USD billions; MMA Primary Research Dataset, September 2026)
Market Definition
The IaaS/Hosting Infrastructure Services market covers cloud computing infrastructure services including virtual compute instances, storage, networking, and dedicated server hosting provided on a pay-as-you-go or subscription basis. It excludes software-as-a-service applications delivered on top of infrastructure services, platform-as-a-service development tools not sold as standalone infrastructure capacity, and on-premises hardware sold for customer-owned data center deployment.
Quantitative Units
USD billions (current prices); segment and regional CAGR in percent
Segmentation Dimensions
By Service Type and Deployment Model; By End-Use Industry; By Commercial Dimension; By Region
Regions Covered
North America, Western Europe, East Asia, South Asia and Pacific, Latin America, Middle East and Africa, Eastern Europe
Countries Covered
USA, China, Germany, France, UK, Japan, South Korea, India, Australia, Canada, Brazil, Mexico, Singapore, Indonesia, UAE, Saudi Arabia, South Africa, Poland, Netherlands, and additional markets relevant to this sector
Key Companies Profiled
Amazon.com Inc, Microsoft Corporation, Google LLC, Alibaba Group Holding Limited, Oracle Corporation, IBM Corporation, Tencent Holdings Limited, OVHcloud SA, DigitalOcean Holdings Inc, Linode LLC, Rackspace Technology Inc, Hetzner Online GmbH, GoDaddy Inc, Constant Company LLC, IONOS SE, Fastly Inc, Cloudflare Inc, Akamai Technologies Inc, Huawei Technologies Co Ltd, NTT Communications Corporation
Quantitative Methodology
Primary survey, n=3,800 respondents, Q4 2025, six countries; demand-side model with trade association cross-validation
Qualitative Methodology
47 expert interviews, Q4 2025; applied to validate demand model assumptions, identify emerging dynamics, and assess competitive positioning
Report Format
PDF and XLSX data workbook (Word format preview document)
Publisher
Market Minds Advisory
Report Code
MMA-2026-TEC-406
Published
September 2026
Contact
sales@marketmindsadvisory.com | www.marketmindsadvisory.com

Purchase the full IaaS/Hosting Infrastructure Services Market Report (2026 to 2036).

The full report delivers a complete view of the IaaS/Hosting Infrastructure Services market, covering detailed segmentation, regional forecasts, and competitive benchmarking across all six service type categories through 2036. It includes company profiles for all 20 evaluated providers, detailed analysis of AI capacity trends and data sovereignty regulation dynamics, and a dedicated section on custom silicon economics. Buyers receive downloadable data tables, a customizable Excel model for scenario planning, and access to MMA's analyst team for follow-up inquiry sessions. The report is designed for strategy, corporate development, and product teams evaluating provider selection or infrastructure.
Detailed profiles of all 20 evaluated providers
Regional forecasts across all seven MMA-defined regions
Customizable Excel model for scenario planning analysis
AI capacity and data sovereignty trend analysis
Segment-level CAGR and margin benchmarking data
Direct analyst access for follow-up inquiries

Built For The People Who Decide

From boardroom strategy to bench-side execution, this report is read cover-to-cover by leaders shaping the next decade of their industry, turning demand scenarios, market dynamics and valuation benchmarks into decisions.
CXOs/ Presidents/ VPs/ Managers
M&A and Corporate Development
Strategy Teams and R&D Heads
Procurement and Product Directors
Regulatory and Compliance Leaders
Investor Relations and Equity Analysts