Market Minds Advisory
Hydrotreated Vegetable Oil Market

Hydrotreated Vegetable Oil Market: Feedstock Scarcity, Mandate-Driven Demand And Aviation Cuts That Compete With Diesel

Every tonne of waste oil that goes into aviation fuel is a tonne that cannot go into renewable diesel, and feedstock rather than refining capacity is what genuinely constrains this entire industry.

Lead Analyst

Lisa Gevelber

Published

September 2026

Make Smarter Decisions with Customized Research Insights

Request a free sample report and evaluate market opportunities, growth trends, and competitive dynamics relevant to your business needs.

2025 MARKET VALUE$42.0BMarket Size 2025
2036 FORECAST VALUE$135.0BBase Case , 2026 to 2036
CAGR 2026 TO 203611.2 %Bull 12.5% / Bear 10.0%
INCREMENTAL OPPORTUNITY$88.3BNet 10- year value creation
EXPANSION MULTIPLE2.89x2036 value over 2026 base
Strategic Levers
M&A Pipeline
Regional Outlook
Country Rankings
Competitive Intelligence
Segmental Deep-dive
Call-Us : 91 93563 13602

Executive Snapshot and Market Trajectory

Refining capacity for hydrotreated vegetable oil is no longer the constraint in this industry and has not been for some time. Feedstock is. Every tonne of waste oil going into aviation fuel is a tonne that cannot go into renewable diesel, and there is not enough of either.
The aviation cut carries the growth because mandates create demand that is legislated rather than voluntary and airlines have no alternative at scale before 2035. Waste and residue feedstock renewable diesel grows nearly as fast on double counting and avoided land use debate. East Asia holds the largest share on Chinese and Singaporean refining capacity that supplies a great deal of world volume.
Concentration reads at 61% for the top five because hydrotreating at scale requires refinery-grade capital that few businesses can commit. Used cooking oil fraud has become a serious regulatory concern rather than a theoretical one, which is what happens when a waste stream becomes worth several times more than the virgin oil it came from originally. Mislabelling virgin oil as waste is worth a great deal of money to anybody willing to attempt it.
Market Definition
This market covers hydrotreated vegetable oil and renewable fuels produced by the hydrotreated esters and fatty acids route, spanning the sustainable aviation fuel cut, waste and residue feedstock renewable diesel, virgin vegetable oil renewable diesel, renewable naphtha and co-products, and renewable propane. Fatty acid methyl ester biodiesel produced by transesterification, ethanol and other alcohol fuels, gas-to-liquids and power-to-liquids fuels, and conventional petroleum diesel are excluded.
Base Year Value
$42.0B in 2025 (MMA Primary Research Dataset, August 2026)
Forecast Period
2026 to 2036, eleven discrete annual values
CAGR
11.2% base case. Bull 12.5%. Bear 10.0%.
Fastest Growth Segment
Sustainable Aviation Fuel Cut: 16.8% CAGR
Fastest Growth Country
India: 15.4% CAGR
Fastest Growth Region
South Asia and Pacific: 13.5% CAGR
Largest Region
East Asia: 26% of 2025 global value
Market Leaders
Neste, Diamond Green Diesel, Eni, TotalEnergies and Chevron Renewable Energy Group lead on hydrotreated renewable fuel revenue. Source: MMA Primary Research Dataset, July 2026.
Primary Survey
n=3,800 procurement and R&D decision-makers, Q4 2025, six countries
Methodology
Demand-side build-up, cross-validated against public data, 47 expert interviews

Hydrotreated Vegetable Oil Market Forecast Scenarios

hydrotreated-vegetable-oil-market-trends-size-forecast-scenario-1787460157050
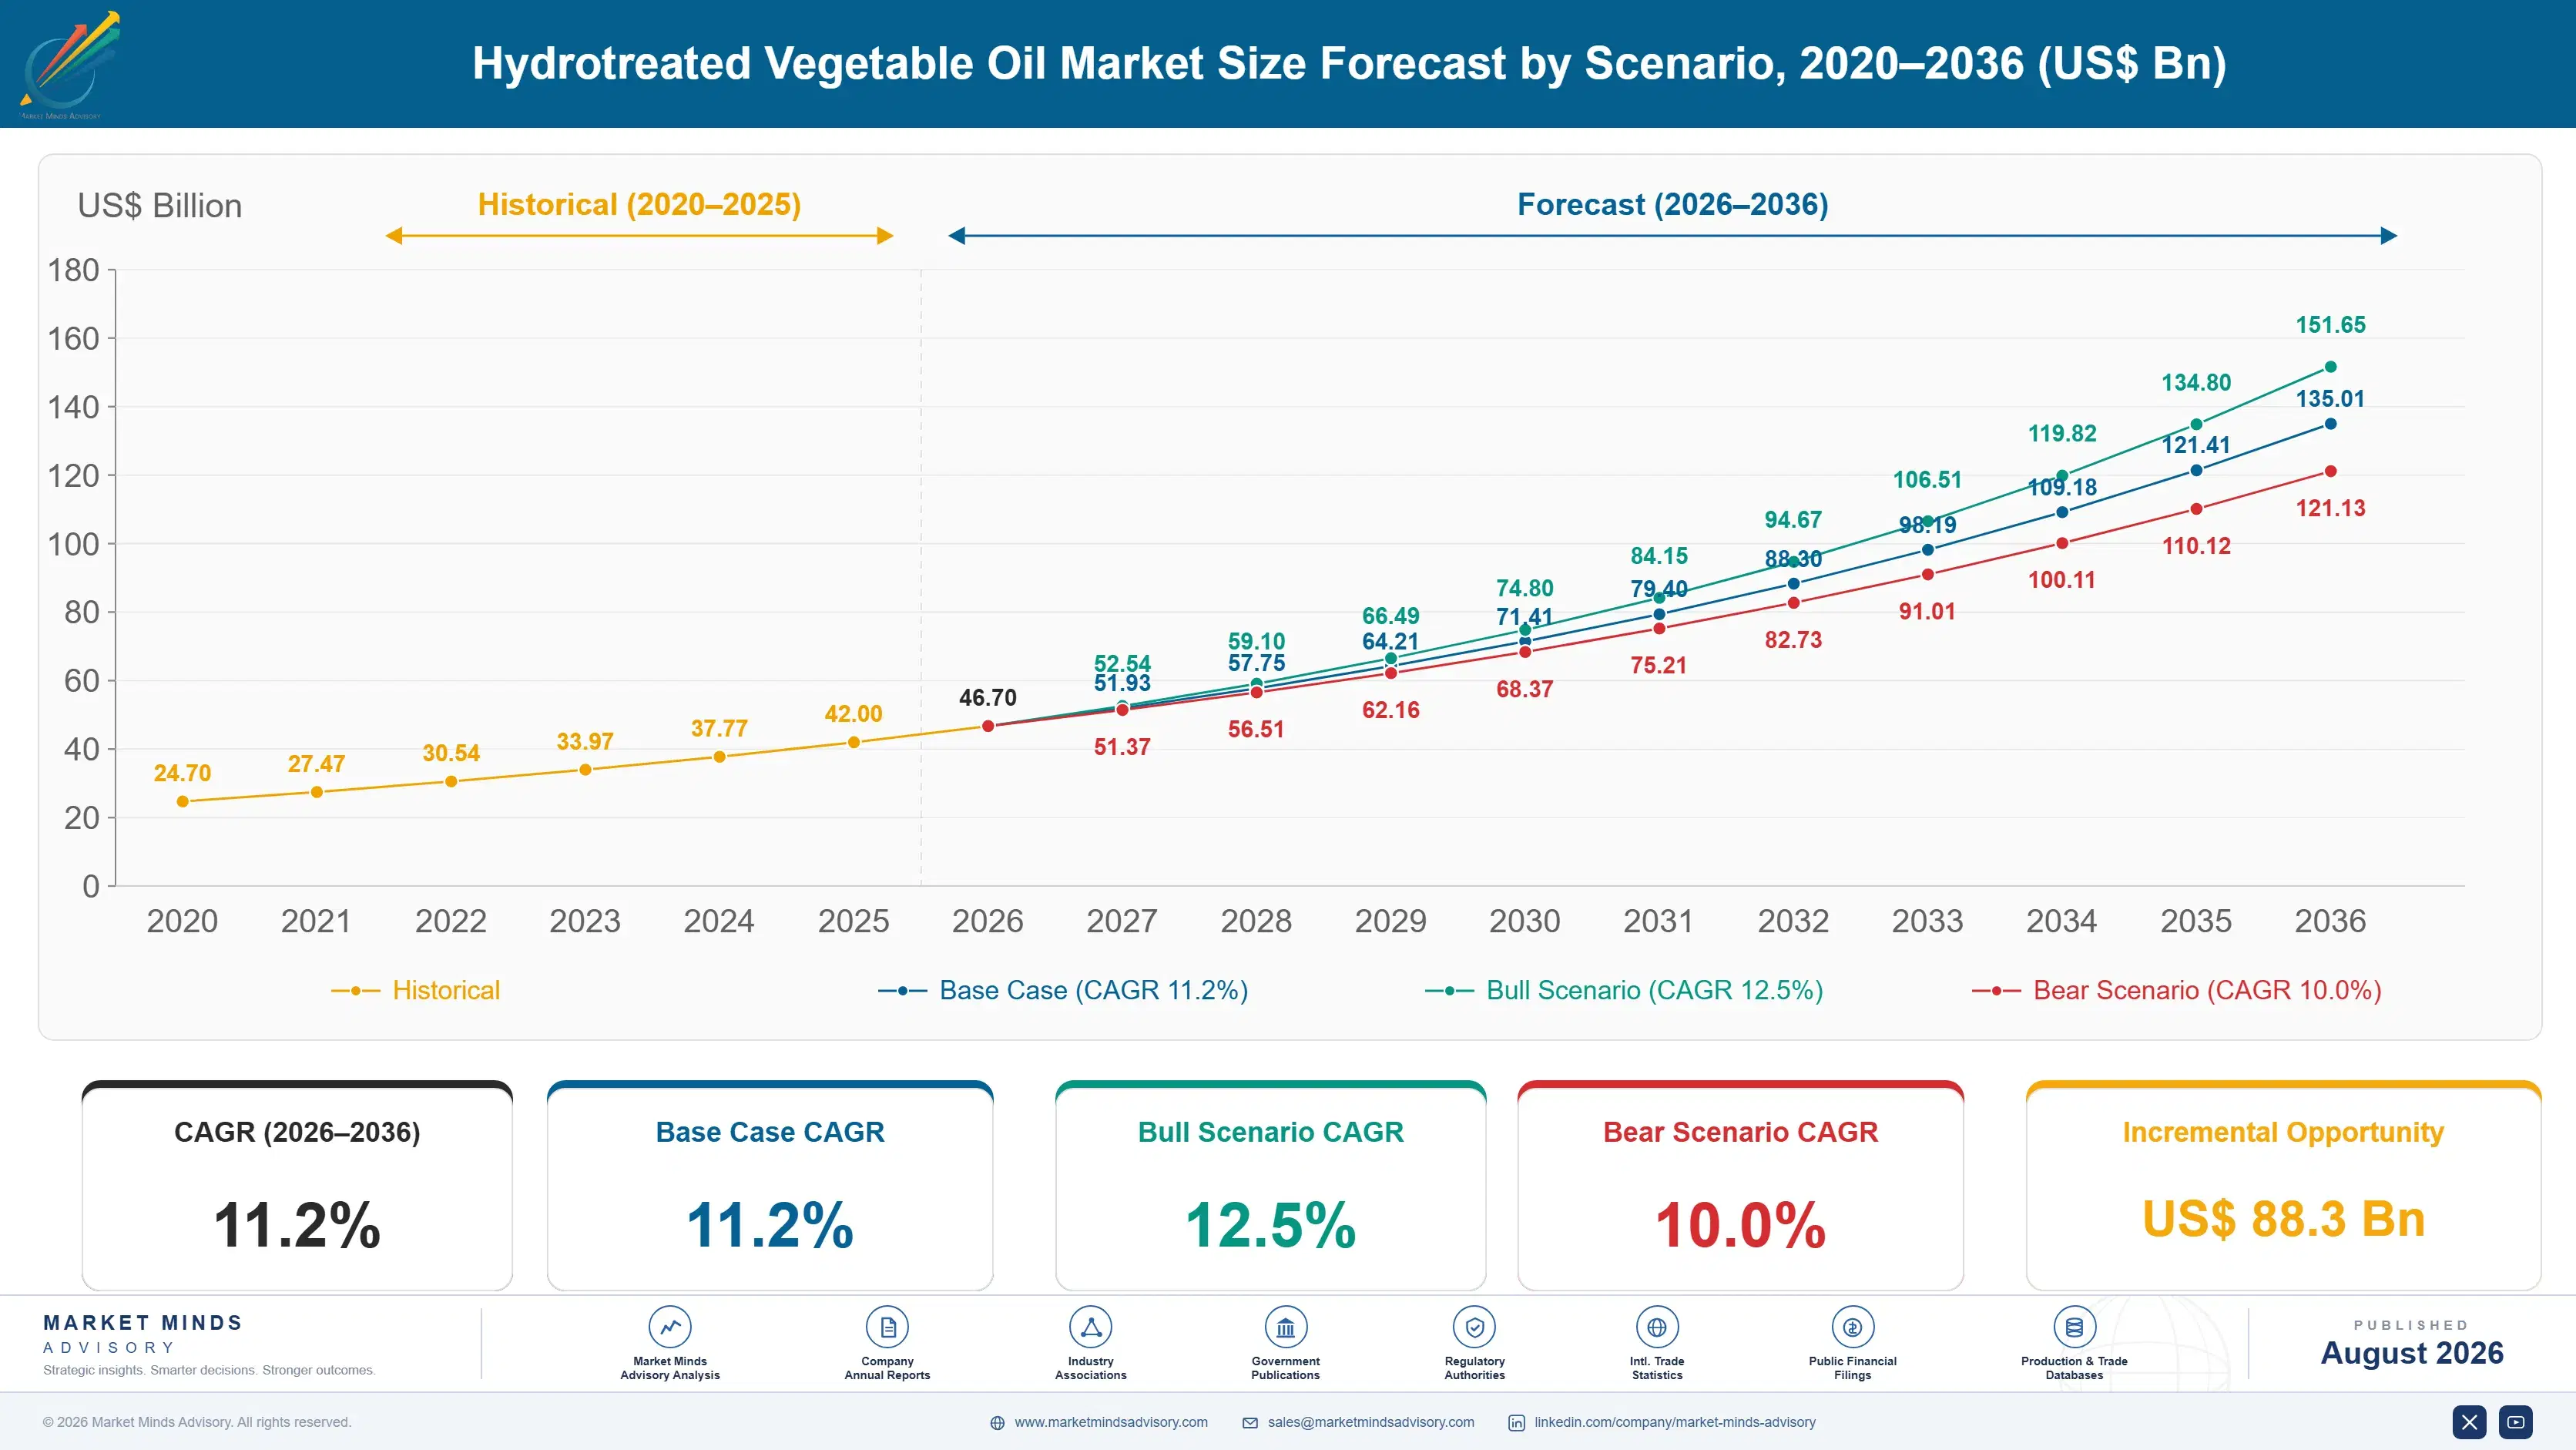
Growth ran at 10.1% annually between 2020 and 2025, and capacity rather than demand set the pace for most of it. A great deal of hydrotreating capacity was announced, financed and built across that period, and much of it came on stream at once. The result was margin compression as capacity outran the feedstock available to run it properly.
The base case at 11.2% rests on three mechanisms. Aviation mandates tighten on published schedules across Europe and several other jurisdictions, creating demand that is legislated rather than chosen. Waste feedstock renewable diesel keeps growing where collection infrastructure develops. And Indian and Southeast Asian demand expands as blending mandates arrive and domestic refining capacity is built alongside them rather than after. None of the three depends on any voluntary buyer choosing to pay more.
The bull case at 12.5% turns on feedstock collection expanding faster than expected, particularly across Asian used cooking oil supply where infrastructure is still developing. The bear case at 10.0% reflects mandate softening under fuel cost pressure, since renewable fuel obligations are politically vulnerable whenever transport costs become a public issue in any market. Mandate politics are the largest single risk here.

Feedstock Not Capacity Constrains This Industry

This industry built a great deal of capacity between 2020 and 2025 and then discovered it could not fill it. Utilisation near 64% against nameplate is common, because feedstock is the binding constraint rather than refining capability. Used cooking oil, animal fats and residues exist in finite quantities that collection infrastructure recovers slowly and imperfectly. Somebody has already collected most of the easy volume across every major market.
TOP FIVE CONCENTRATION61%High, since hydrotreating at scale requires refinery-grade capital commitment
FEEDSTOCK COST SHARE73% of COGSFeedstock contribution to hydrotreated renewable fuel manufactured cost
WASTE FEEDSTOCK SHARE58%Portion of feedstock from waste and residue rather than virgin
CAPACITY UTILISATION64%Typical hydrotreating capacity actually run against nameplate rating
AVIATION CUT YIELD52%Proportion of output achievable as aviation fuel per unit feedstock
WASTE FEEDSTOCK PREMIUM41%Waste oil pricing advantage over comparable virgin vegetable oil
Feedstock at roughly 73% of manufactured cost makes this a feedstock business with a refinery attached rather than the other way round. Waste and residue material carries roughly 41% premium over virgin vegetable oil because it counts double under several regulatory schemes and avoids the land use debate that palm and soy import entirely. That premium is regulatory in origin rather than technical.
Aviation is where the competition for feedstock now concentrates. The hydrotreated esters and fatty acids route produces aviation fuel and renewable diesel from the same process with a different distillation cut, so a producer chooses between them each quarter. Aviation yields less per tonne, which means mandates have to price aviation above diesel to pull feedstock across, and they increasingly do.
"Everybody in this business built refineries and then went looking for used cooking oil. There is a finite amount of it, somebody has already collected most of the easy volume, and the fraud problem is exactly what you would expect when a waste becomes worth more than the original oil."
Director, Renewable Fuels and Energy Transition Practice · MMA Renewable Fuels Practice · August 2026

Market Trends

Aviation Mandates Pull Feedstock Away From Renewable Diesel

The hydrotreated route produces aviation fuel and renewable diesel from identical processing with a different distillation cut, so a producer chooses between them by quarter depending on which pays better. Aviation yields less per tonne of feedstock, which means mandates must price it above diesel to pull material across, and European and other schedules increasingly do exactly that. Airlines have no alternative decarbonisation route at scale before 2035, which makes that demand legislated rather than chosen. Producers with the plant flexibility to switch follow whichever mandate pays better that quarter, and those without it simply cannot.
Market Impact: Mandates cover 78% of demand
Waste Feedstock Premium Creates Fraud Regulators Now Chase

Waste and residue feedstocks count double under several regulatory schemes and avoid the land use debate entirely, which makes them worth roughly 41% more than virgin vegetable oil despite being harder to collect and more variable. That premium is regulatory rather than technical in origin. Predictably, used cooking oil fraud has become a serious enforcement concern rather than a theoretical one, since mislabelling virgin oil as waste is worth a great deal of money to anybody willing to try it. Verification and traceability requirements on imported waste streams have tightened considerably as a result.
Market Impact: India grows at 15.4% annually

Market Opportunities and Growth Drivers

Legislated Demand Removes The Commercial Adoption Question Entirely

Renewable fuel obligations and aviation mandates create demand that exists because legislation requires it rather than because any buyer chose it, which is a fundamentally different commercial position from persuading customers to pay more for a greener product. Obligated parties must acquire compliance volume regardless of price within reason. That makes forecasting unusually tractable against published mandate schedules, and it makes political durability of those mandates the single largest risk in the business. Obligated parties acquire compliance volume regardless of whether they wanted it. Political durability is therefore the real risk.
Market Impact: Utilisation runs at 64% of nameplate

Asian Blending Mandates Arrive Alongside Domestic Refining Capacity

Indian and Southeast Asian blending mandates are arriving with domestic refining capacity built alongside rather than after them, which is a different sequence from the European experience where capacity followed obligation by several years. Indian demand grows near 15.4% annually as a result. Regional feedstock availability including palm residues and used cooking oil collection is developing at the same time, though collection infrastructure remains considerably less mature than in Europe. Palm residues and developing collection both support the capacity being installed there. Regional feedstock availability shapes what gets built. Collection remains less mature than Europe.
Market Impact: Obligations cover 78% of volume

Market Restraints and Challenges

Feedstock Scarcity Leaves Built Capacity Running Well Below Nameplate

A great deal of hydrotreating capacity was financed and built between 2020 and 2025 and much of it came on stream simultaneously, while the waste oils and fats to run it did not expand at the same rate. Utilisation near 64% against nameplate is now common across the industry. The root cause is that waste feedstock exists in finite quantity recovered slowly by collection infrastructure. Participants are responding with feedstock integration, collection investment and pretreatment capability for lower quality material. Fixed cost spread across fewer tonnes compounds the problem badly for anybody caught this way.
Market Impact: Aviation yields 52% per feedstock tonne

Mandate Politics Make Demand Vulnerable To Fuel Cost Pressure

Renewable fuel obligations raise pump and ticket prices, which makes them politically exposed whenever transport costs become a public issue in any jurisdiction. The root cause is that the cost is visible to consumers while the benefit is diffuse and long term. Commercially this puts legislated demand at risk in exactly the periods when producers most need it. Participants are responding with geographic diversification across mandate regimes, long-term offtake contracts and cost reduction through feedstock flexibility. Long-term offtake contracts and feedstock flexibility are the other partial defences available. Diversification across regimes helps materially.
Market Impact: Waste carries 41% pricing premium
3 additional market trends, 4 additional growth drivers, and 2 additional restraints and challenges are covered in the full report. Contact sales@marketmindsadvisory.com to access the complete intelligence.

Segment CAGR and Growth Architecture

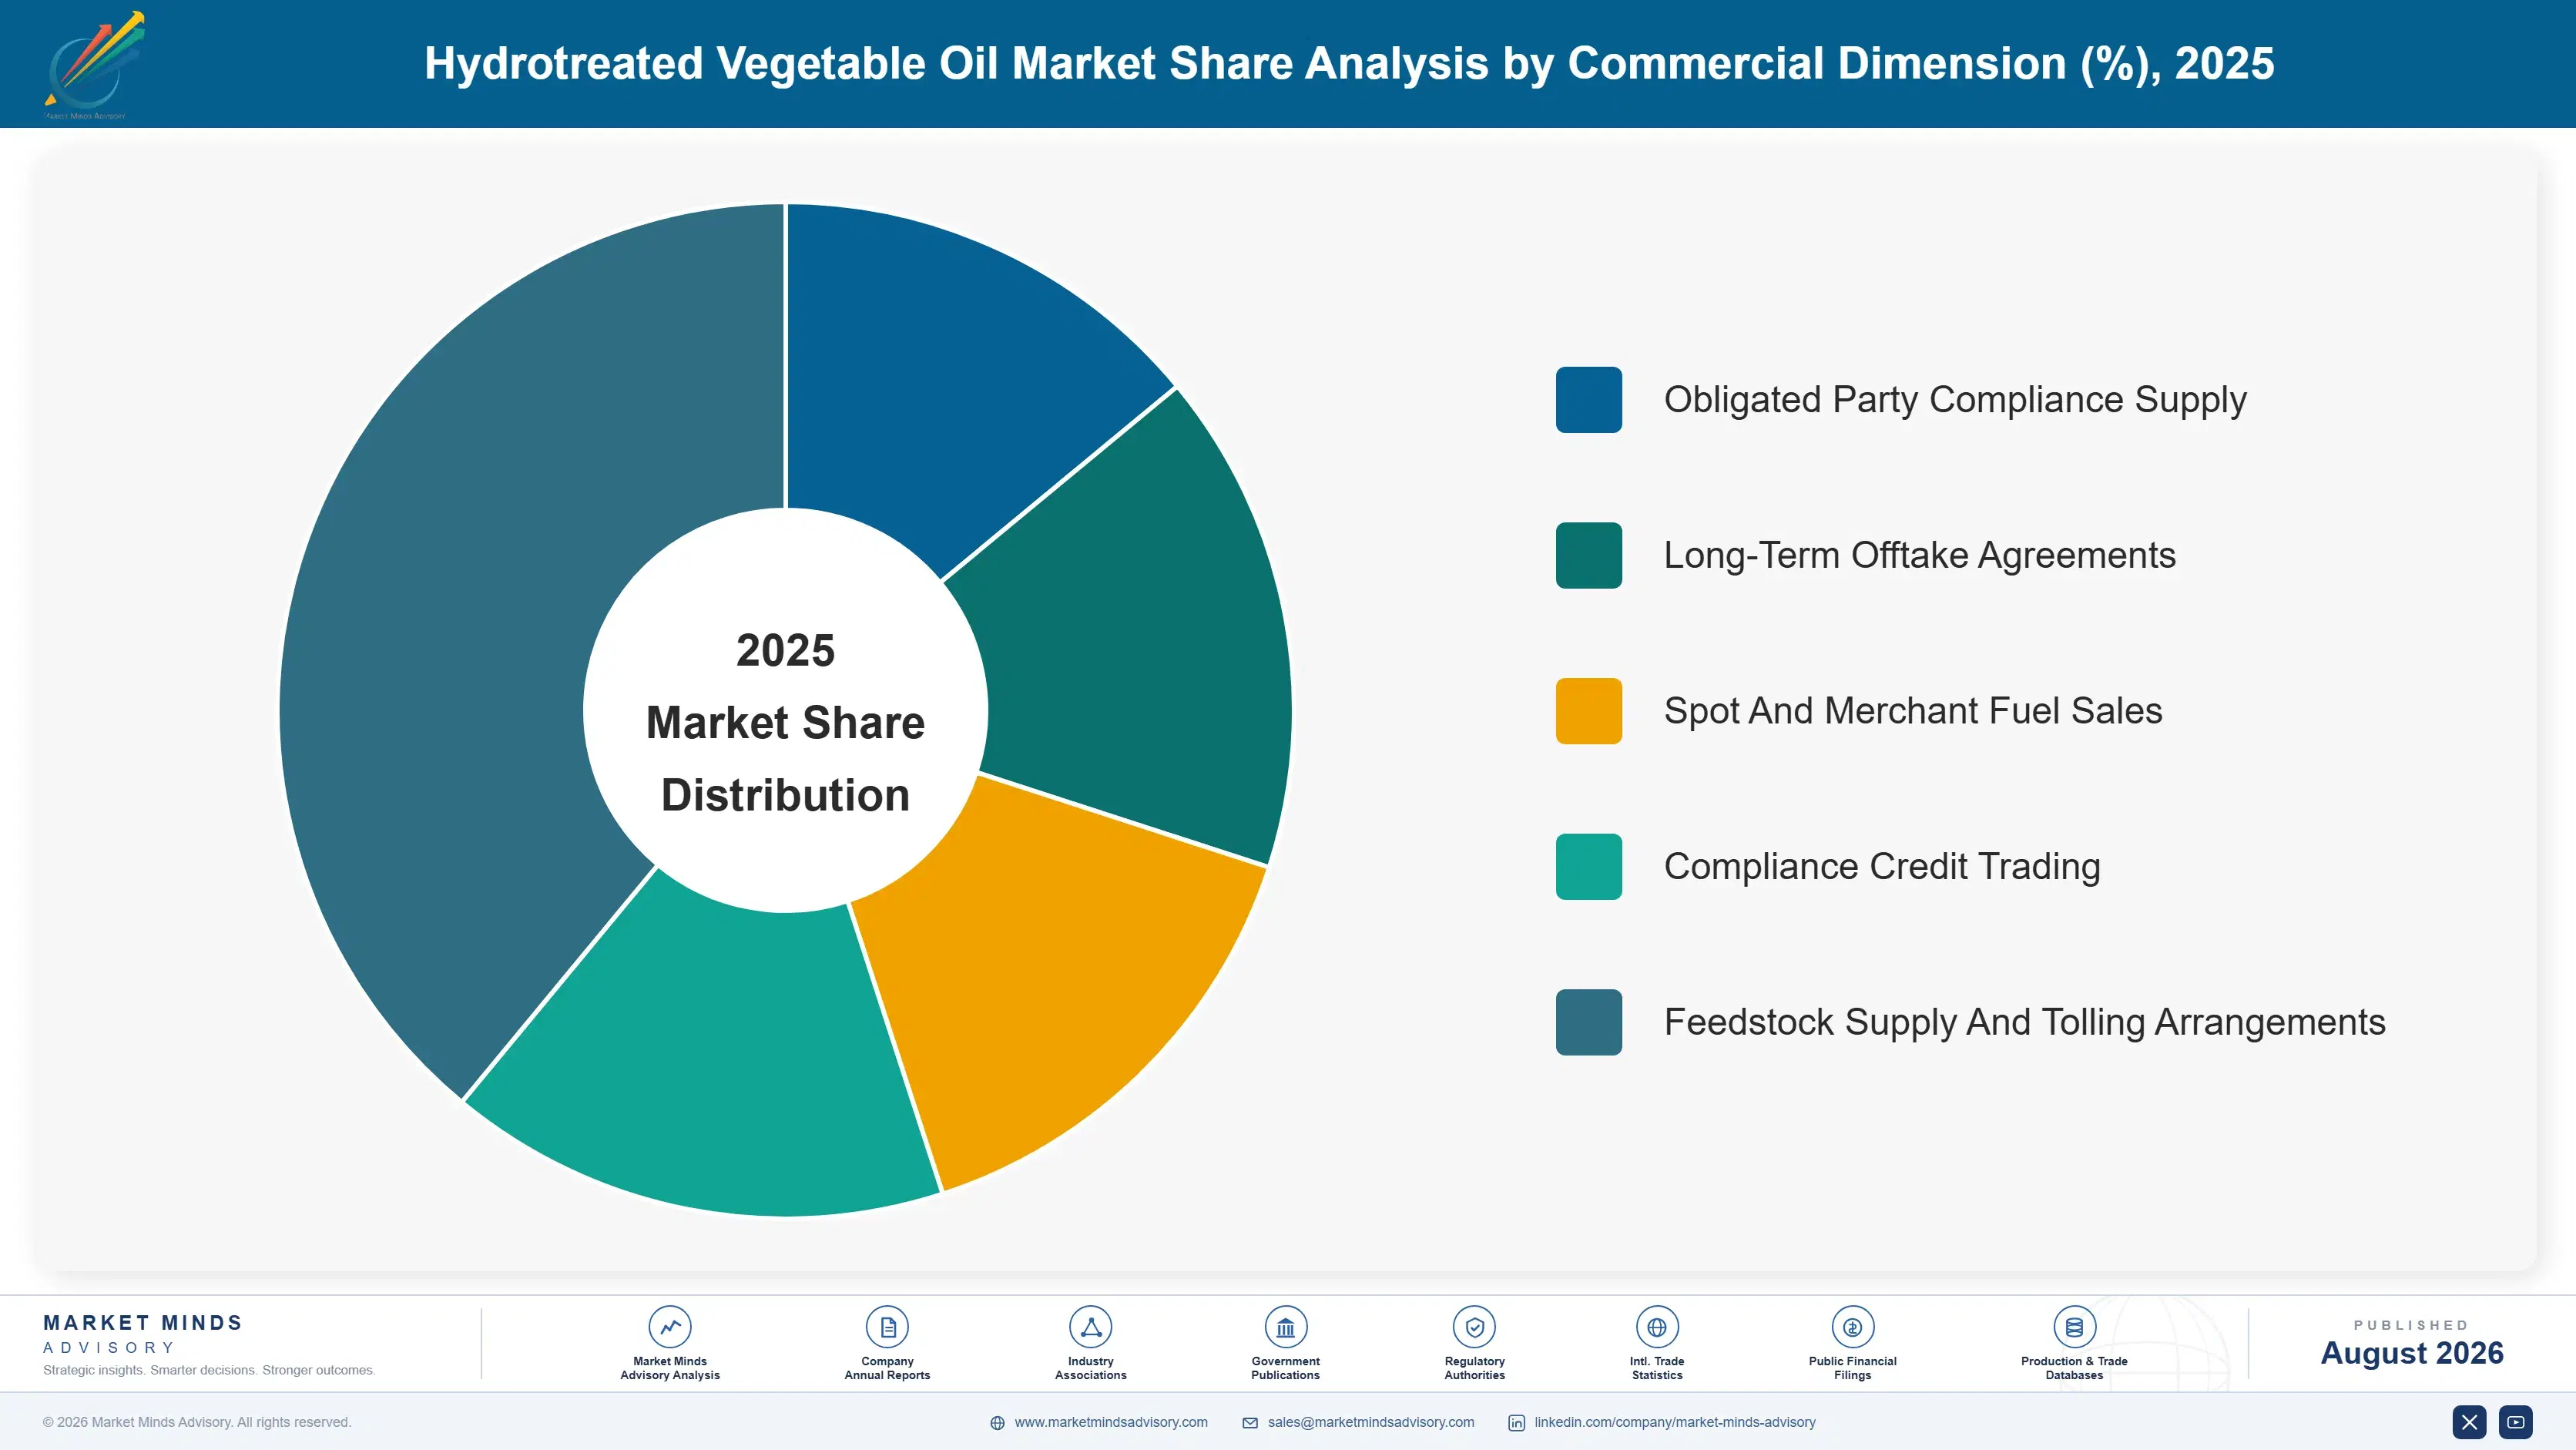
Five product streams divide this market on output cut and feedstock origin rather than on refining technology, which is essentially identical across all of them. Output cut determines which mandate applies and what the fuel is worth, while feedstock origin determines regulatory counting and cost, and those two factors govern every production decision made.
hydrotreated-vegetable-oil-market-trends-market-share-analysis-1787460157591

Sustainable Aviation Fuel Cut

Growing at 16.8% and the fastest part of this market. Sustainable aviation fuel produced through the hydrotreated esters and fatty acids route is chemically the same process as renewable diesel with a different distillation cut, which means a producer can switch output between the two depending on which pays better that quarter. Aviation mandates across Europe and elsewhere create demand that is legislated rather than voluntary, and airlines have no alternative decarbonisation route available at scale before 2035. The constraint is feedstock rather than capacity, since the same waste oils and fats feed renewable diesel and the aviation cut yields less per tonne. Producers switch output between the two by quarter where plant design permits it.
CAGR 16.8%

Waste And Residue Renewable Diesel

Growing at 11.5% on renewable diesel produced from waste and residue feedstocks including used cooking oil, animal fats and tall oil rather than from virgin vegetable oils. Waste feedstocks carry double counting under several regulatory schemes and avoid the land use debate entirely, which makes them worth considerably more per tonne than palm or rapeseed oil despite being harder to collect and more variable in quality. Collection infrastructure is the genuine constraint and the reason fraud in used cooking oil supply chains has become a serious regulatory concern rather than a theoretical one. Collection infrastructure rather than refining capacity is the genuine constraint. Verification requirements on imported streams keep tightening. Quality variability is considerable.
CAGR 11.5%
Full segment breakdown across 5 segments available in the complete report.

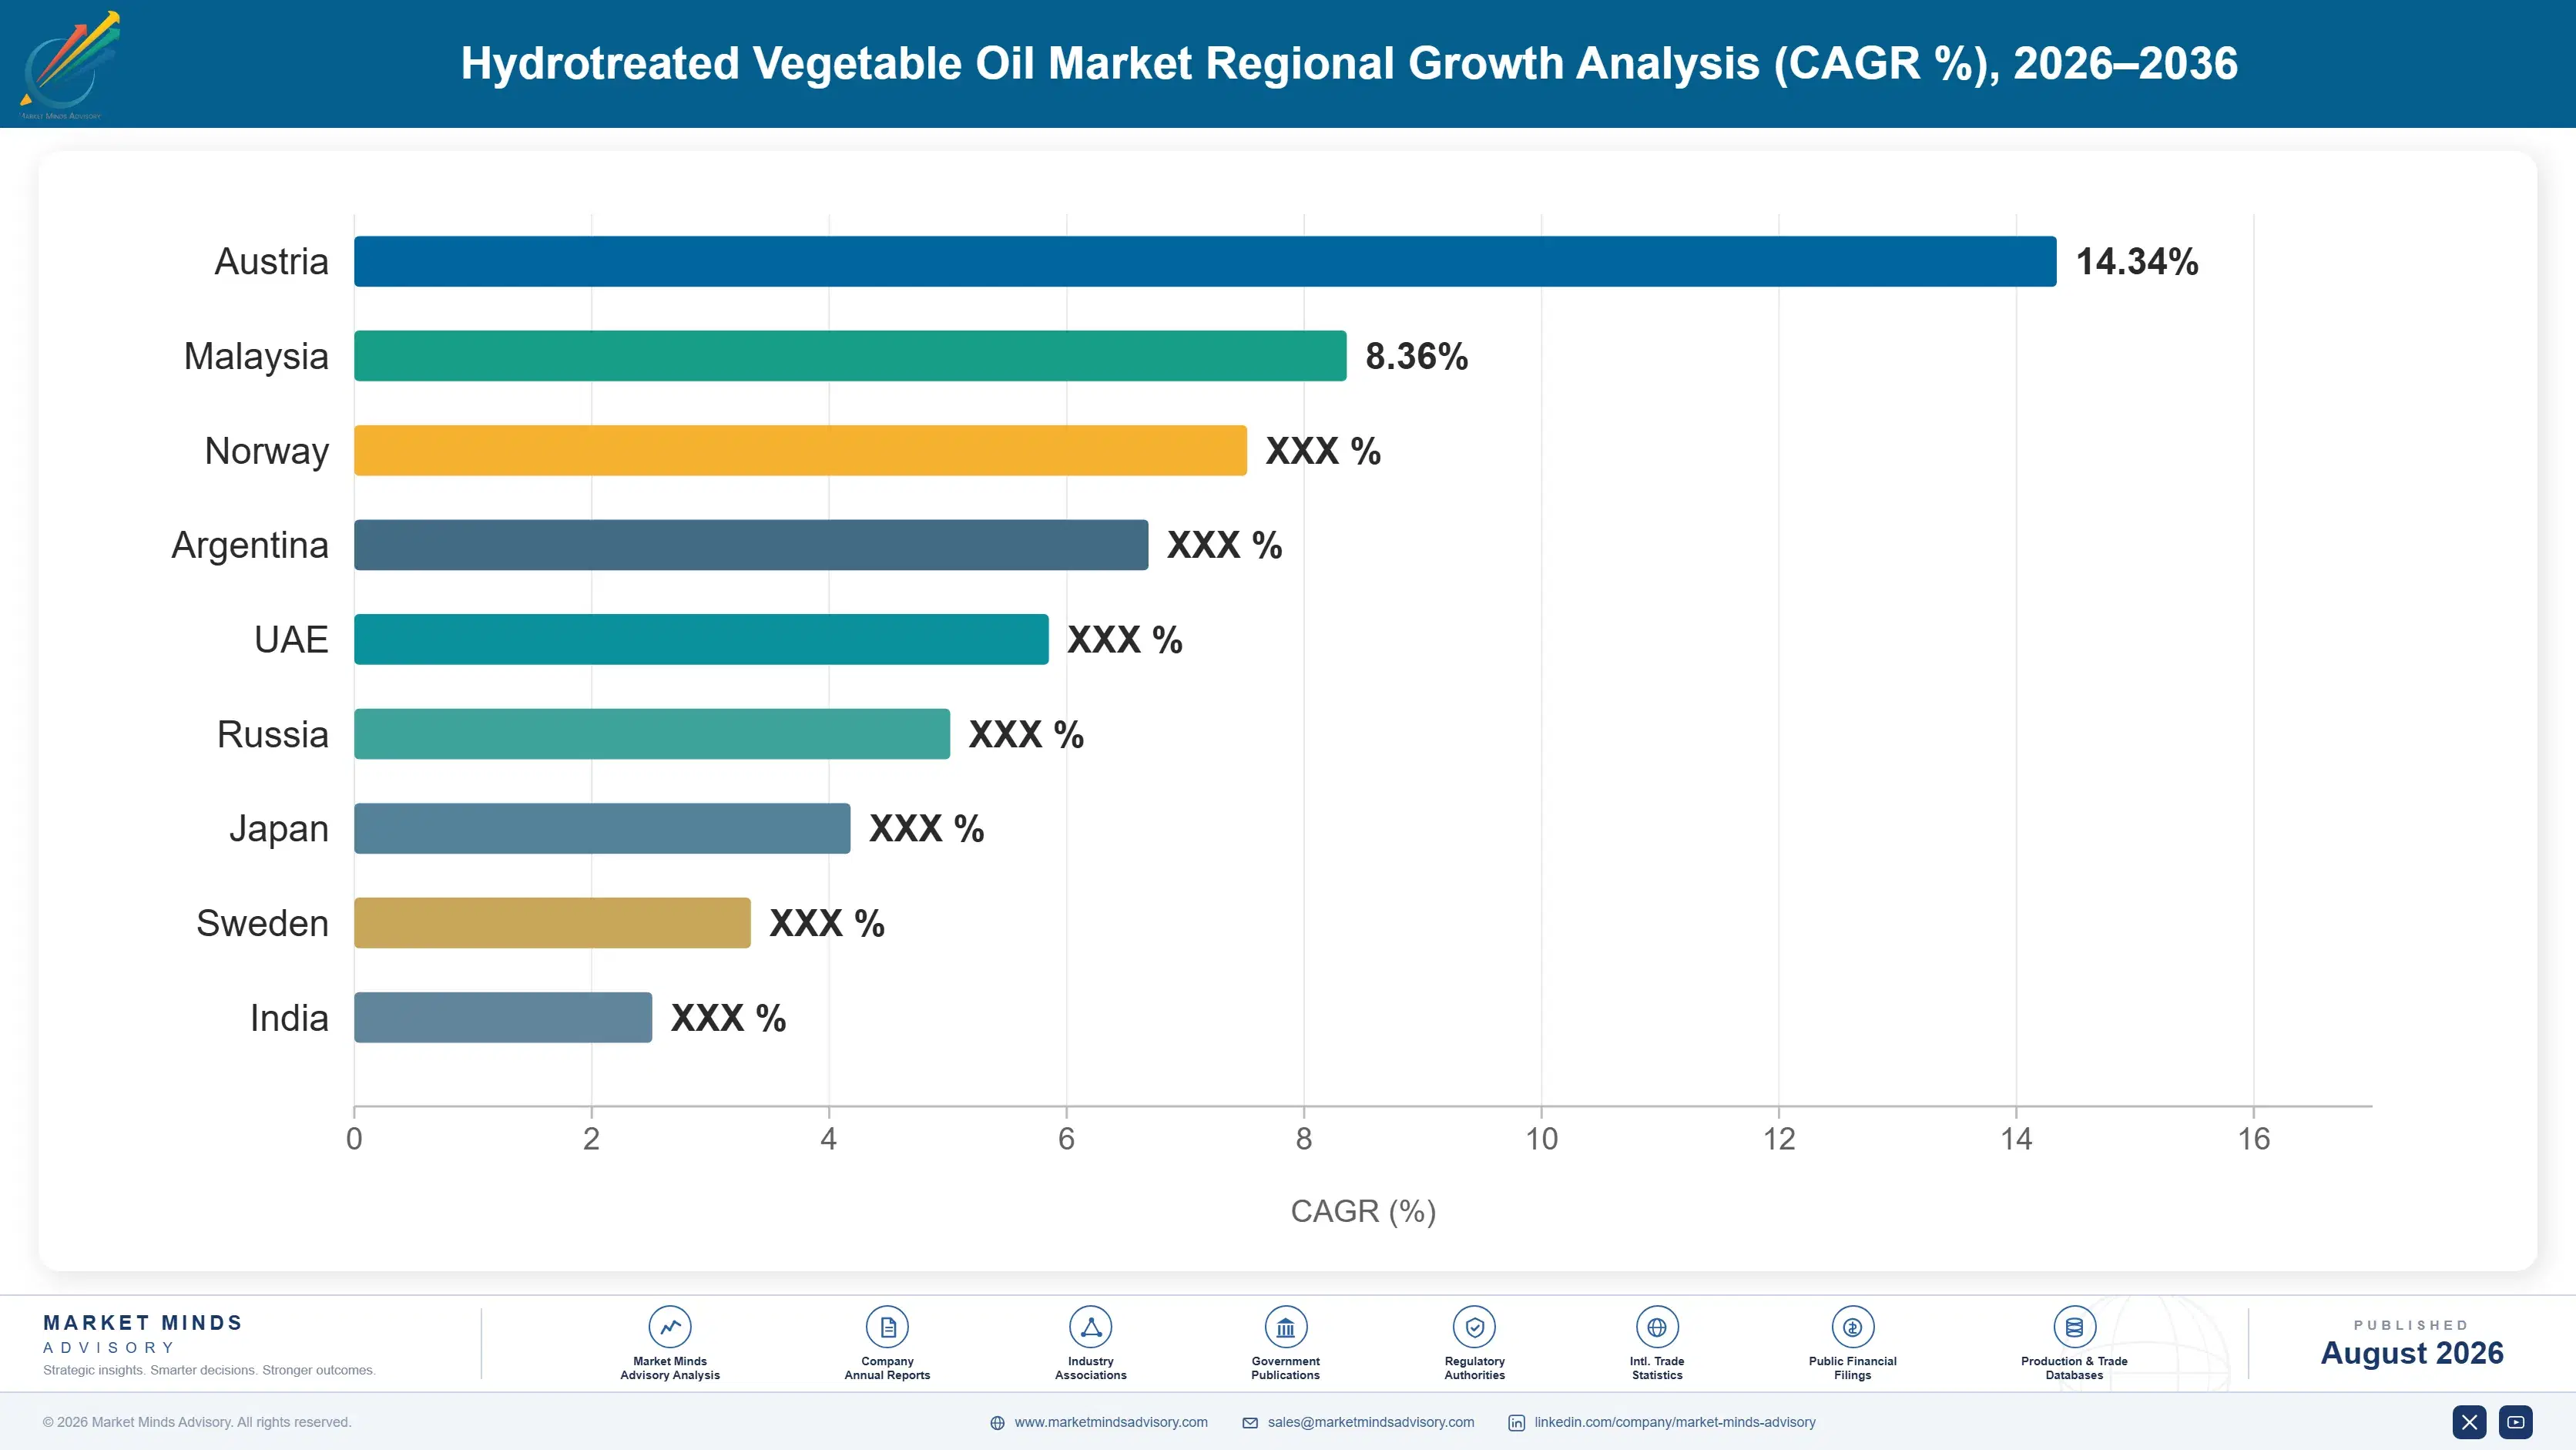
Regional Architecture and Country Demand Map

East Asia holds 26% of global value on Chinese and Singaporean refining capacity that supplies a great deal of world volume alongside growing domestic mandates. Western Europe follows at 25% on the strictest mandate regime anywhere, while South Asia and Pacific grows fastest. Feedstock competition is global.

East Asia

Singaporean and Chinese refining capacity supplies a great deal of world volume, with Neste's Singapore facility among the largest anywhere and Chinese producers exporting substantial quantities of both fuel and used cooking oil feedstock into European markets. That export flow is commercially significant and politically sensitive. Chinese used cooking oil collection is extensive and increasingly formalised, though verification and traceability questions have drawn considerable European regulatory attention. Japanese and Korean aviation mandates are developing and both markets import most of their volume. Regional demand is growing quickly as blending obligations extend across the whole area. Export flows into Europe are commercially significant and politically sensitive. Verification questions have drawn European regulatory attention.
Share: 26% | CAGR: 12.3% (2026 to 2036)

Western Europe

The strictest and most developed mandate regime anywhere sits here, with renewable fuel obligations and aviation mandates both operating on published tightening schedules that give producers unusually clear demand visibility. Double counting for waste feedstocks originated in European rules and shapes global feedstock pricing as a result. Neste, Eni and TotalEnergies all hold substantial capacity. Feedstock imports, particularly used cooking oil from Asia, have raised verification concerns serious enough to prompt enforcement action. Mandate politics are a genuine risk here, since fuel costs are visible and renewable obligations become contentious whenever transport prices rise publicly. Double counting for waste feedstocks originated here and shapes global pricing. Mandate politics are a genuine risk when transport prices rise.
Share: 25% | CAGR: 9.7% (2026 to 2036)
Regional intelligence for 5 additional markets available in the complete report: North America, South Asia and Pacific, Latin America, Middle East and Africa, Eastern Europe. Contact sales@marketmindsadvisory.com.
hydrotreated-vegetable-oil-market-trends-country-cagr-analysis-1787460158106

Where Renewable Fuel Returns Are Made

Four positions separate producers earning returns from those running expensive assets below nameplate: securing feedstock rather than building capacity, developing pretreatment for lower quality material, switching output between aviation and diesel cuts, and diversifying across mandate regimes rather than depending on any single one. Only the first genuinely determines whether a plant runs at all.

Secure Feedstock Rather Than Building More Capacity

Feedstock is roughly 73% of manufactured cost and the binding constraint on this entire industry, which is why utilisation sits near 64% against nameplate across a sector that spent heavily on refineries. Producers with integrated collection or long-term feedstock contracts run 20 to 28 points higher utilisation than those buying on spot markets. Capacity was never the scarce thing, and a great many balance sheets discovered that after the capital had already been committed. Nobody expected feedstock to be the thing that ran out first. Refineries were the easy part to finance.
Market Impact: Lifts plant utilisation by up to 28 points

Develop Pretreatment For Lower Quality Feedstock

Clean used cooking oil is largely spoken for and the remaining volume is dirtier, more variable and harder to process, which is exactly where pretreatment capability creates advantage. Producers able to handle high free fatty acid and contaminated streams access feedstock that competitors cannot use at all, at 15% to 25% below premium waste oil pricing. The capital is real and the alternative is competing for the same clean material everybody else is chasing. Contaminated streams are the only material not already contested. Pretreatment converts an unusable input into a usable one.
Market Impact: Accesses feedstock 25% below premium waste oil pricing

Switch Output Between Aviation And Diesel Cuts

The hydrotreated route produces both fuels from identical processing with a different distillation cut, so a producer with the flexibility can follow whichever mandate pays better that quarter. Aviation yields roughly 52% per feedstock tonne against higher diesel yields, so the price differential has to justify the switch. Producers with switching capability capture 8% to 14% more margin across a cycle than those locked into a single output configuration by their plant design. Plant design either permits the switch or forecloses it permanently. Aviation mandates increasingly price above diesel deliberately.
Market Impact: Captures up to 14% more margin per cycle

Diversify Across Mandate Regimes Rather Than One

Renewable fuel obligations raise pump and ticket prices, which makes them politically exposed whenever transport costs become a public issue, and roughly 78% of demand exists because legislation requires it. A producer selling into one regime carries that political risk undiversified. Serving several mandate jurisdictions spreads it materially, and the compliance and logistics cost of doing so is modest against the exposure it removes from the business. Compliance and logistics cost of multi-market supply is modest against that. A single regime carries that risk entirely undiversified. Serving several jurisdictions spreads it materially instead.
Market Impact: Spreads risk across the 78% of legislated demand

Who Controls the Margin Pool

Concentration reads at 61% for the top five measured on hydrotreated renewable fuel revenue, the basis used throughout this section, and it reflects the refinery-grade capital that hydrotreating at scale requires. Neste holds the largest position and the deepest feedstock network. Diamond Green Diesel and Chevron Renewable Energy Group bring North American scale, while Eni and TotalEnergies convert existing refineries.
Competition runs on three fronts. Feedstock access is the first and by a wide margin the most decisive, since it determines utilisation and utilisation determines returns. Pretreatment capability is the second, opening lower quality streams that competitors cannot process. Output flexibility is the third, letting a producer follow whichever mandate pays better in a given quarter. None of the three is a refining technology argument.

Pressure arrives from two directions. Capacity built between 2020 and 2025 outran available feedstock, which compressed margins across the whole industry rather than only at marginal producers. Separately, mandate politics threaten legislated demand whenever fuel costs become contentious. Rankings will shift toward producers holding feedstock positions and pretreatment capability rather than those holding nameplate capacity alone. Nameplate capacity alone has stopped meaning very much.
hydrotreated-vegetable-oil-market-trends-company-positioning-matrix-1787460158629

Competitive Moat and Risk Dimensions

NESTE

Moat: Feedstock network and pretreatment

The deepest global waste and residue feedstock network combined with pretreatment capability for lower quality streams gives the business utilisation that competitors buying clean material on spot markets cannot approach. Early capacity investment across Singapore, Rotterdam and Finland also secured positions before the sector built more refining than the feedstock base could support.
NESTE

Risk: European mandate political exposure

Heavy weighting toward European demand leaves the business exposed to mandate politics that become contentious whenever transport fuel costs rise publicly, and those obligations are the source of most demand. Chinese used cooking oil imports facing verification scrutiny also threaten a feedstock stream the business and its competitors both depend on considerably.
DIAMOND GREEN DIESEL

Moat: Feedstock integration through rendering

Integration with rendering and fats collection through its ownership structure gives the business feedstock access that pure refining operators must purchase competitively on open markets. North American scale and proximity to both animal fat supply and low carbon fuel standard markets also produce logistics advantages that imported volume cannot match.
DIAMOND GREEN DIESEL

Risk: Credit value and policy dependence

North American economics depend heavily on tax credit and low carbon fuel standard credit values that move with policy and with the volume of competing compliance supply, which introduces volatility outside the operator's control. Feedstock competition with the established biodiesel industry also bids up the same animal fats and used cooking oil.

Players Tracked

Prominent Players

Neste
Diamond Green Diesel
Eni
TotalEnergies
Chevron Renewable Energy Group

Other Key Players

BP
Shell
Repsol
Preem
Cepsa
Phillips 66
Marathon Petroleum
Vertex Energy
World Energy
Sinopec
Zhejiang Jiaao Enprotech
Hebei Jingu
Indian Oil Corporation
Petronas
Braskem

Recent Developments

FEBRUARY 2025

Pretreatment capacity added to process lower quality waste streams

A renewable fuel producer commissioned pretreatment capacity capable of handling high free fatty acid and contaminated waste oils, accessing feedstock volume that competitors without the capability cannot process and reducing dependence on increasingly contested clean used cooking oil. Utilisation improved materially at both affected sites within the year.
Signal: Pretreatment capability opens up the feedstock that competitors chasing clean material simply cannot use at all
JUNE 2025

Output configuration switched toward aviation cut on mandate pricing

A producer shifted distillation configuration toward the sustainable aviation fuel cut after mandate pricing moved sufficiently above renewable diesel to justify the lower yield per feedstock tonne, demonstrating the flexibility that plant design either permits or forecloses. Yield per feedstock tonne fell while realised value per tonne rose considerably.
Signal: Output flexibility lets a producer follow whichever mandate happens to pay better in any given quarter
OCTOBER 2025

Verification requirements tightened on imported used cooking oil

European authorities tightened traceability and verification requirements for imported used cooking oil after concerns that virgin oil was being mislabelled as waste to capture double counting benefits, affecting feedstock flows that producers had come to depend on. Import volumes fell while verification systems were established. Prices for verified material rose.
Signal: Waste feedstock premiums create exactly the fraud incentives that regulators have now begun to actively pursue

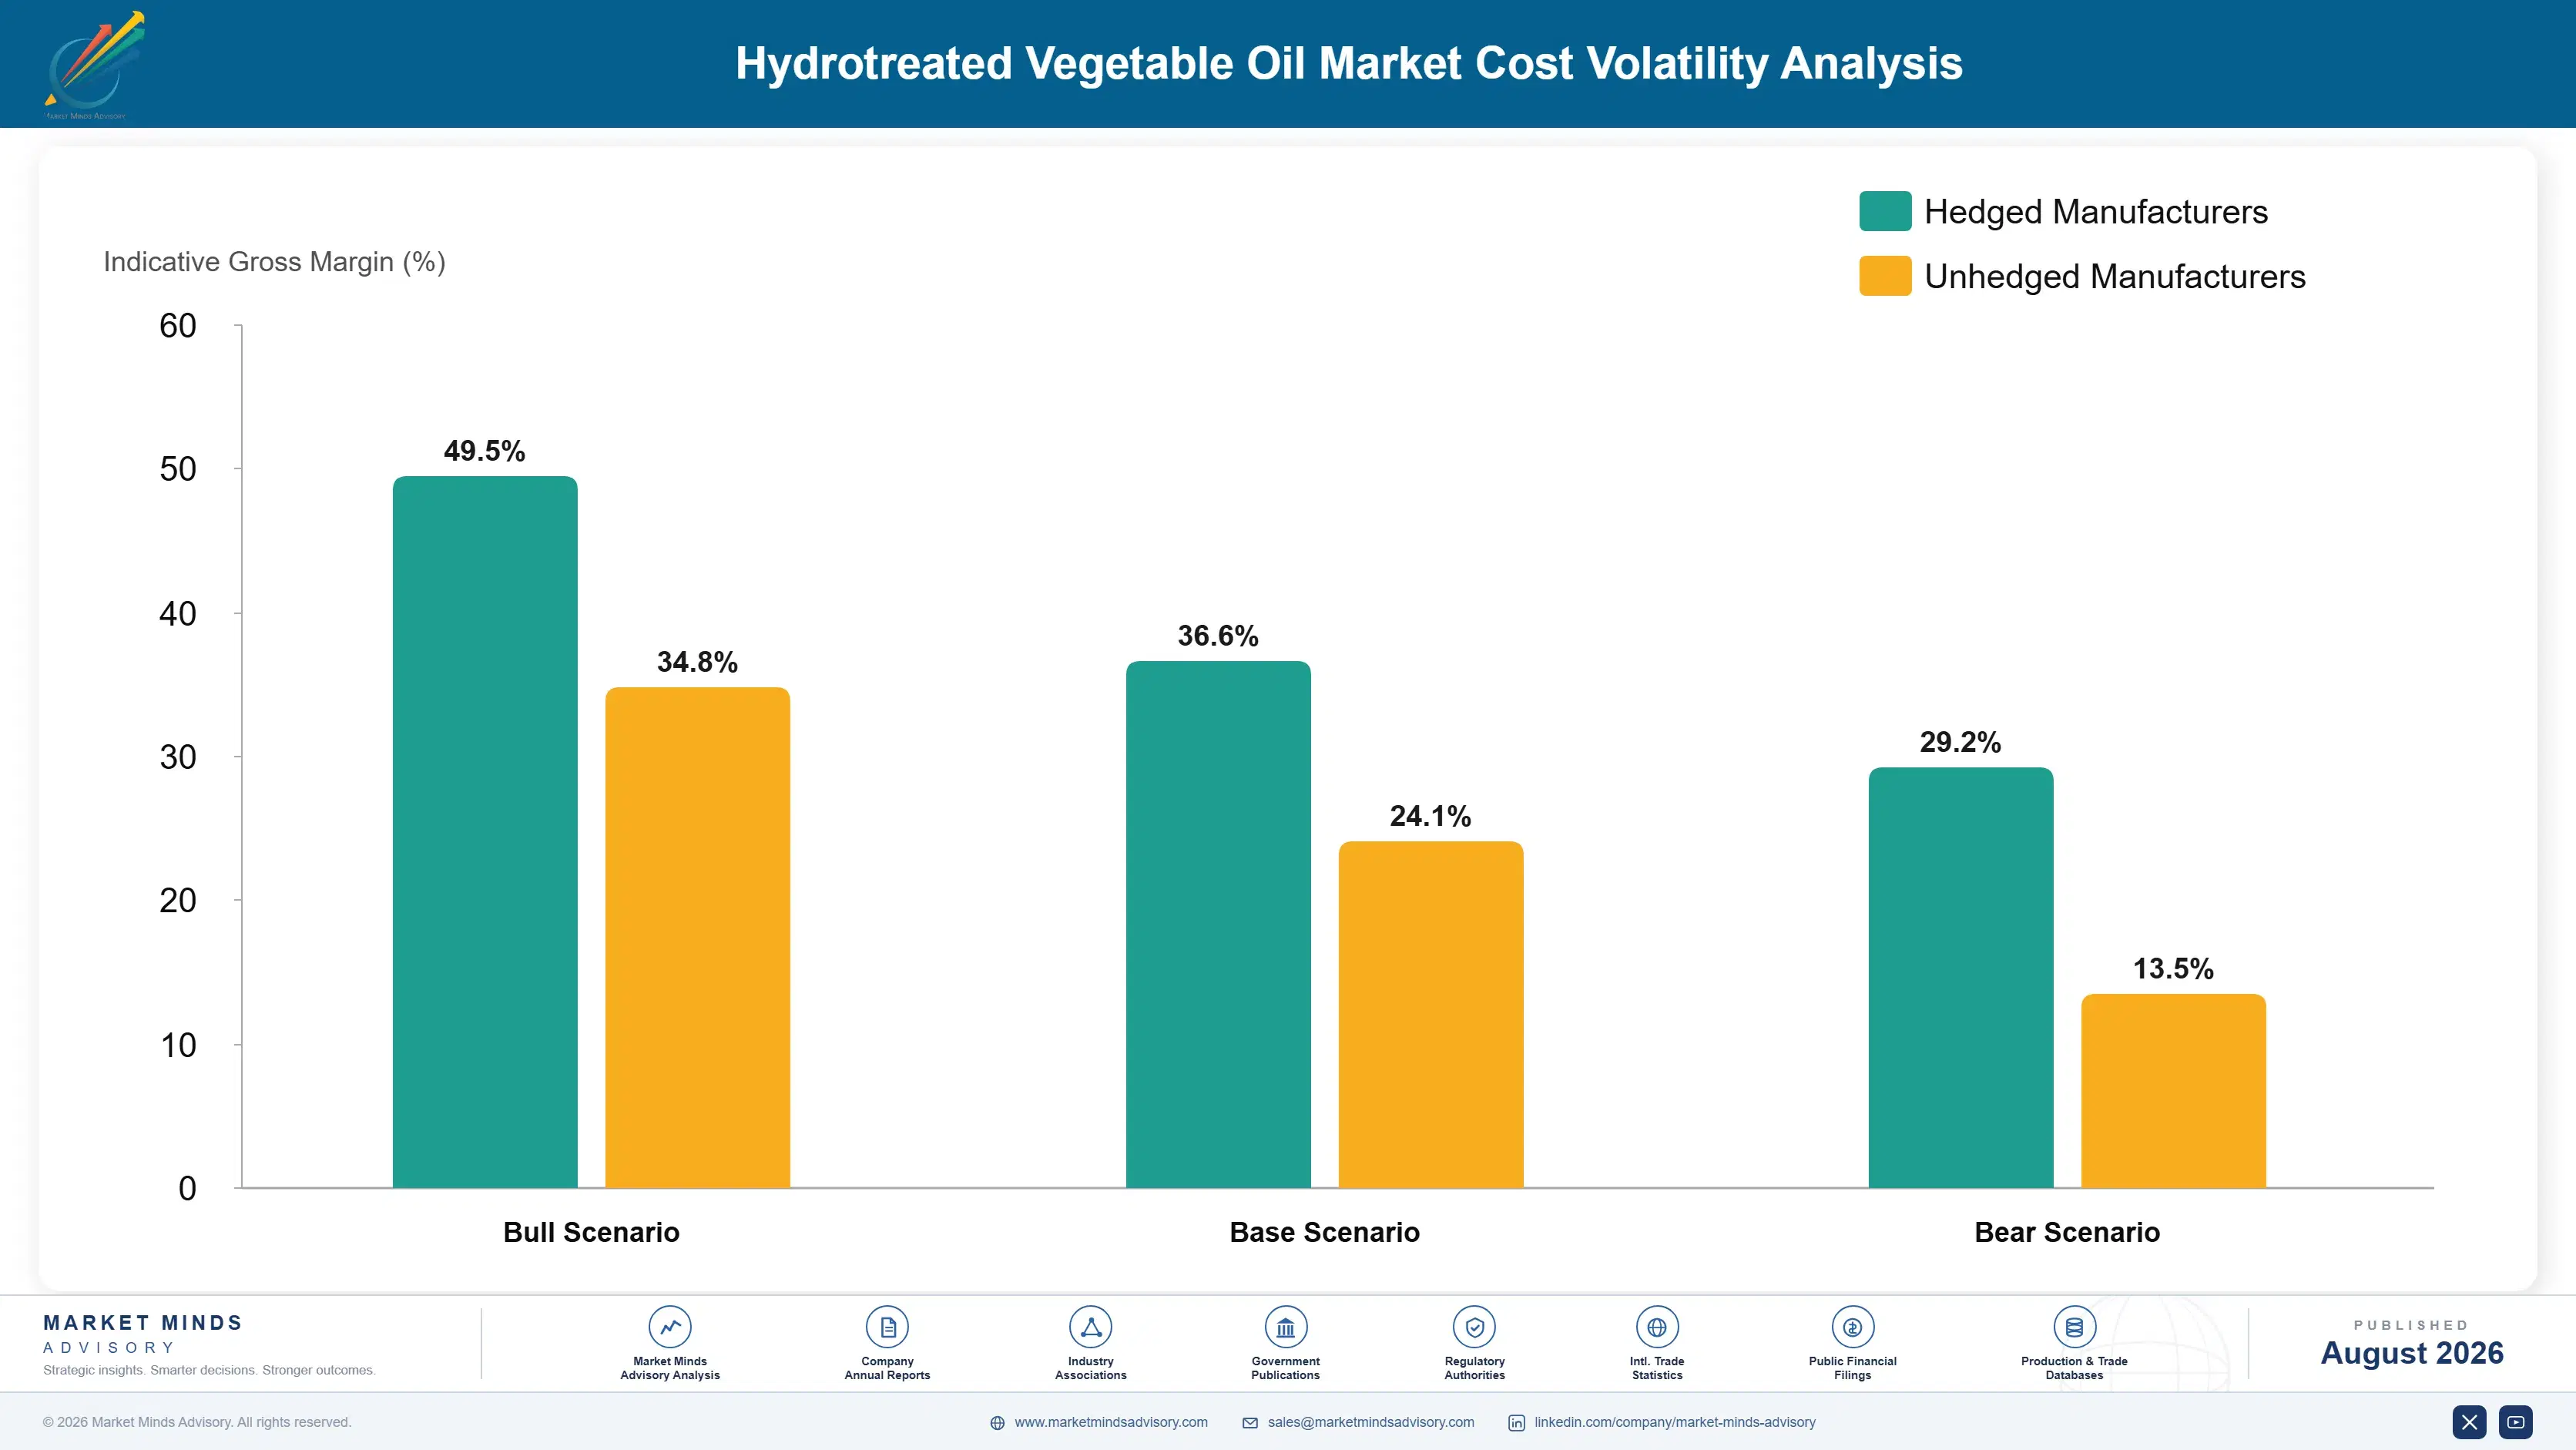
What Drives Renewable Fuel Cost

Feedstock accounts for roughly 73% of manufactured cost, which makes this a feedstock business with a refinery attached rather than a refining business buying inputs. Hydrogen contributes around 9% and its cost depends heavily on whether it is produced from natural gas or purchased. Energy and utilities add about 7%, catalyst and pretreatment chemicals roughly 4%, and fixed operating cost close to 7% across a typical facility.
Used cooking oil pricing rose steeply through 2022 and 2023 as capacity outran collection and double counting premiums took hold, with United States Department of Agriculture vegetable oil data and national statistical office collection figures both showing the movement. Natural gas pricing affecting hydrogen production moved separately across the same period according to International Energy Agency data. Producers absorbed both movements against fixed mandate pricing.

The disadvantage mechanism is feedstock competition against fixed refining capacity, and it falls hardest on producers without integration or long-term supply. A refinery built for volume it cannot obtain runs below nameplate and carries fixed cost across fewer tonnes, which compounds badly. Exposure varies by feedstock strategy rather than by scale, since integrated collectors and pretreatment operators access material that spot buyers simply cannot reach.
hydrotreated-vegetable-oil-market-trends-cost-volatility-analysis-1787460158824

Integrate backwards into collection and rendering supply

Feedstock is nearly three quarters of manufactured cost and the constraint on utilisation, which makes secured access worth considerably more than any refining efficiency improvement could deliver. Integration into collection or rendering removes the spot market exposure that leaves capacity idle. The capital and operational complexity are both real, and the alternative is competing for material everybody else is chasing.

Build pretreatment capability for contaminated feedstock

Clean used cooking oil is largely spoken for and the remaining volume is dirtier and more variable, which is exactly where pretreatment creates access competitors do not have. Handling high free fatty acid and contaminated streams reaches material at a discount to premium waste oil. The capital is significant and it converts an unusable stream into feedstock without outbidding anybody.

Contract feedstock across multiple origins and types

Used cooking oil, animal fats, tall oil and residues all price on different dynamics and face different regulatory verification requirements, so single-source exposure carries risk nobody intended to take. Multi-origin contracting reflects how those markets actually behave. The administrative and compliance burden is genuine, and it is smaller than a supply interruption would be.

Portfolio Architecture for Margin Defence

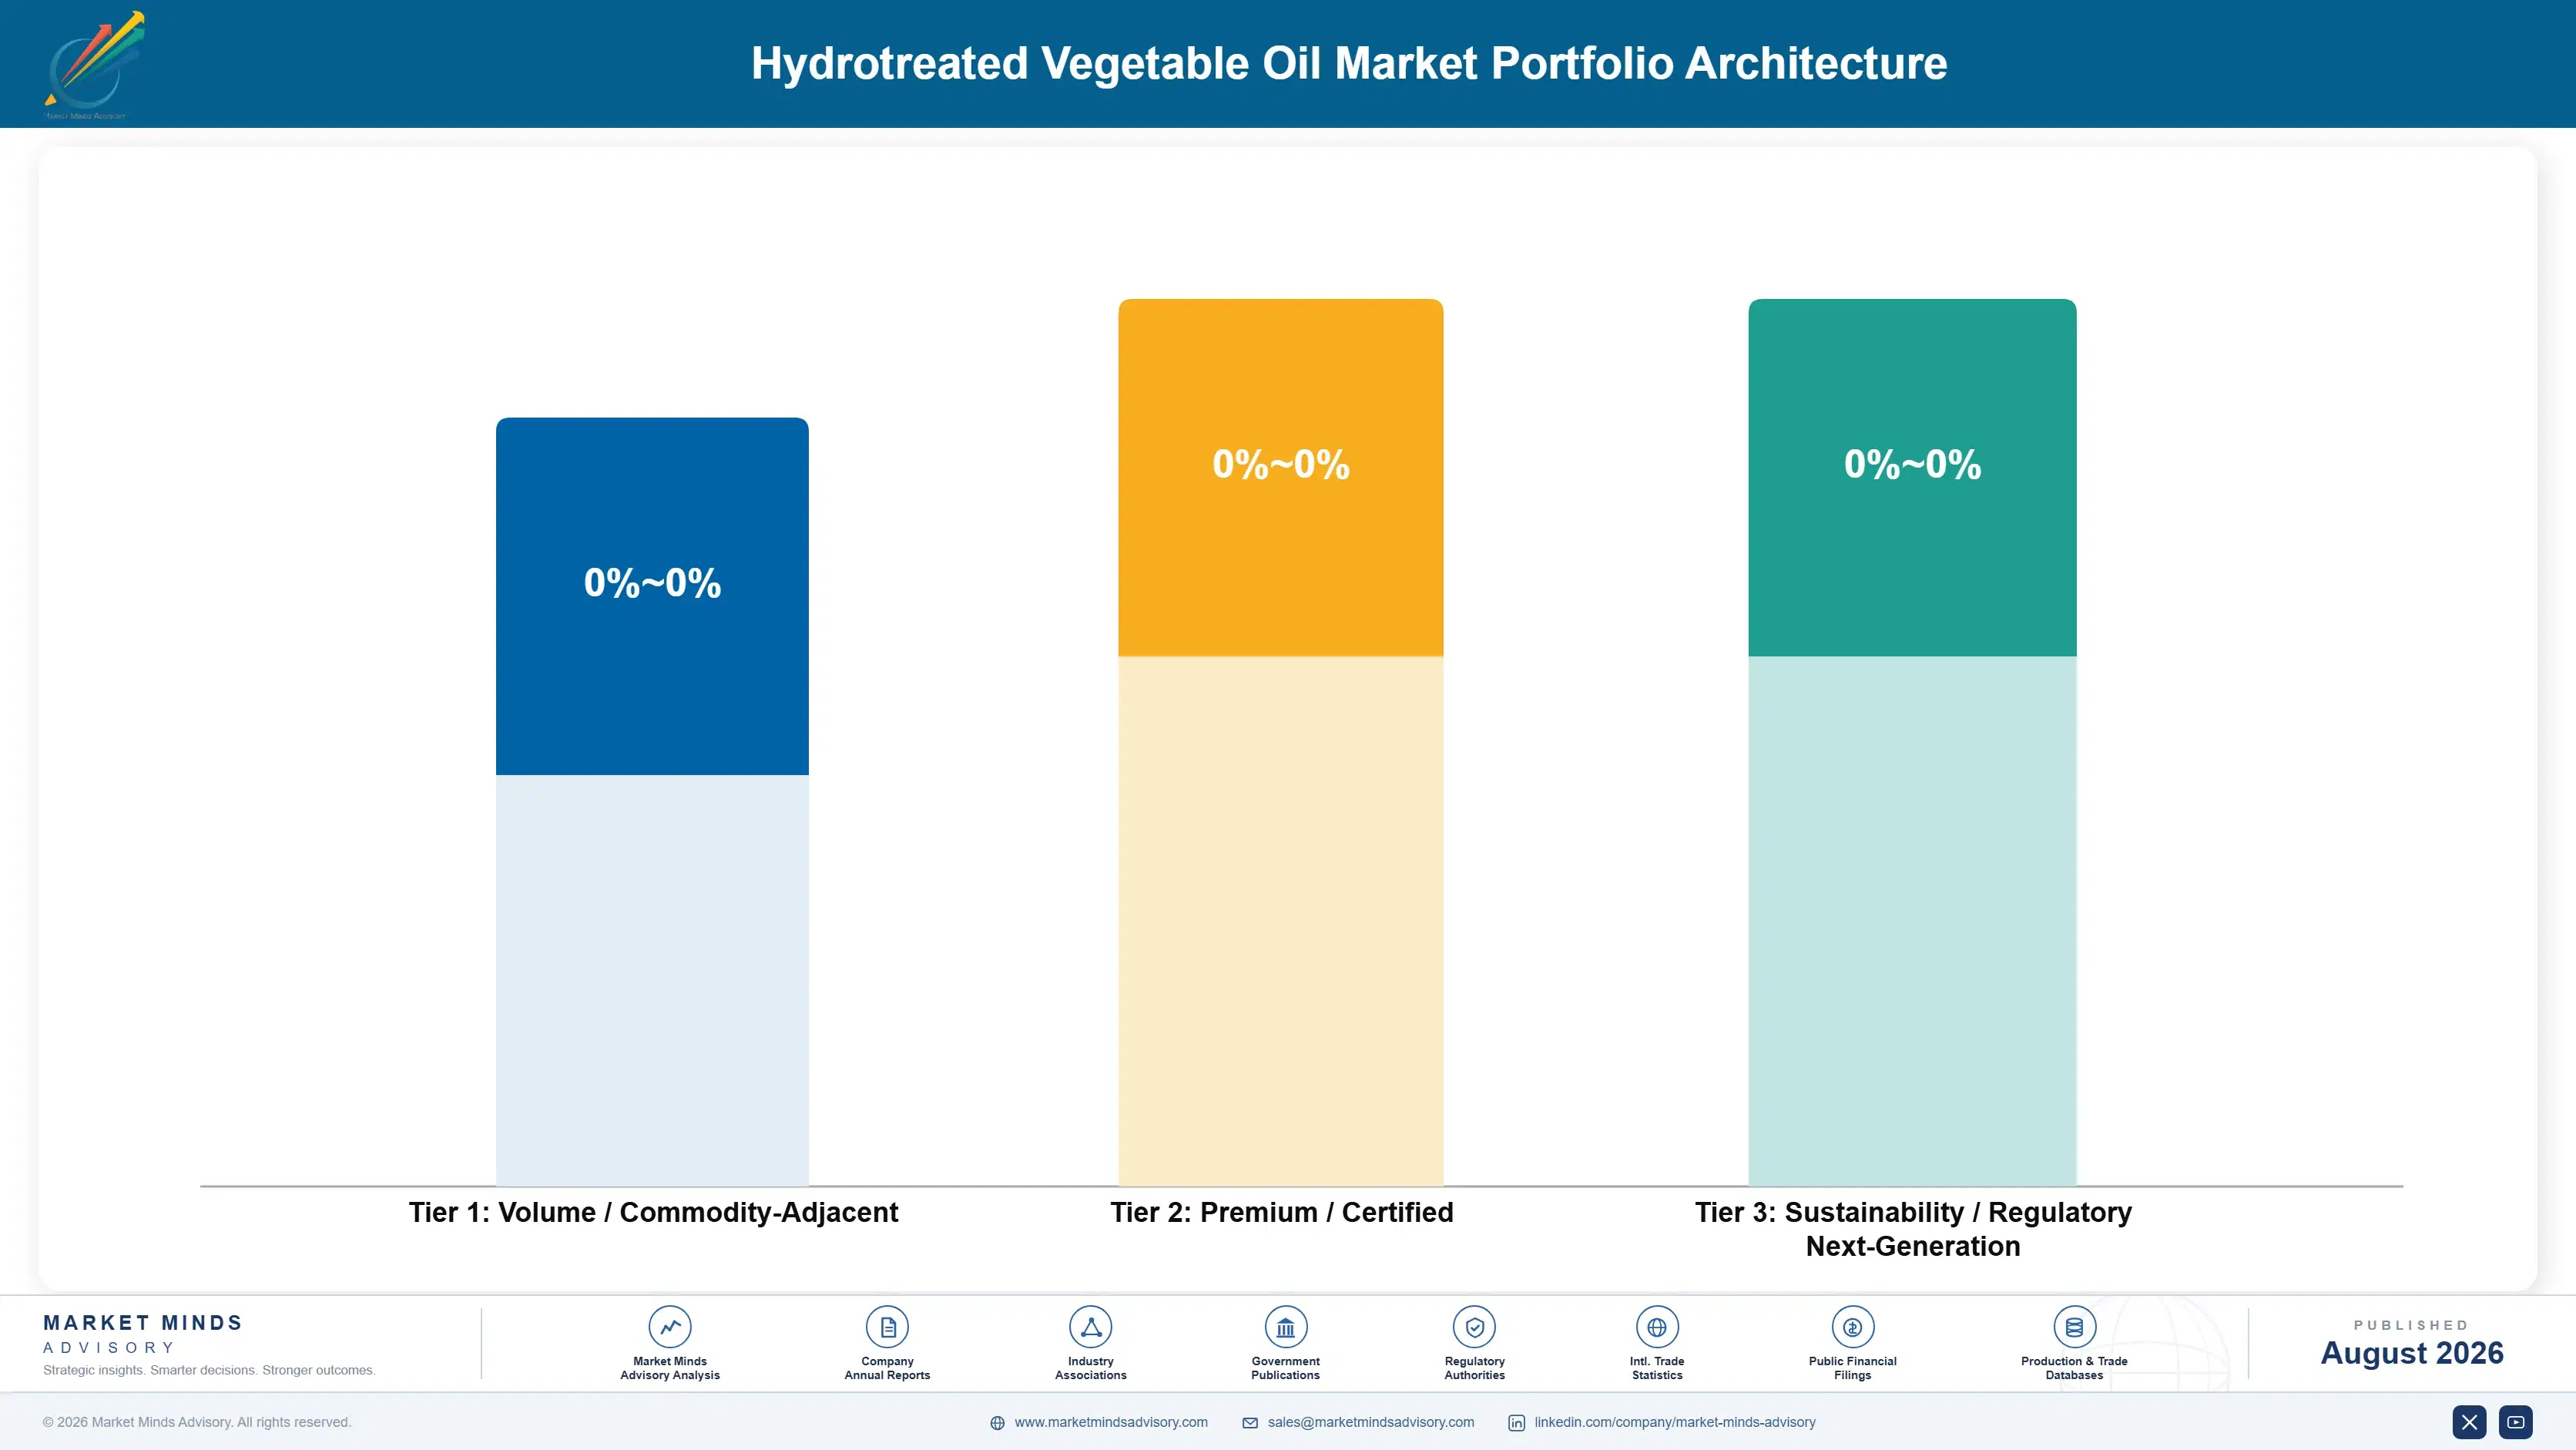
Portfolio economics here divide on feedstock position rather than on refining technology, which is essentially identical across producers. Virgin vegetable oil renewable diesel carries no double counting benefit, faces the land use debate directly, and competes on a feedstock that food and fuel markets both bid for, which is the weakest position available. Food and fuel markets bid for the same oil.
The middle tier is waste and residue renewable diesel. Double counting and avoided land use debate together support roughly 41% premium over virgin oil, and utilisation depends entirely on whether feedstock access is secured or purchased on spot markets. Margins reach the high twenties for producers with integration and considerably less for those without it. Spot buyers run materially below nameplate.

Above both sits the aviation cut with feedstock security behind it. Mandates create legislated demand airlines cannot meet any other way before 2035, pricing has to exceed diesel to pull feedstock across, and margins reach the low forties. Both feedstock access and output flexibility are required, which is why so few producers capture the position properly. Very few producers hold both capabilities together.

Volume / Commodity-Adjacent

Virgin vegetable oil renewable diesel without double counting benefit. The range reflects vegetable oil pricing against fuel value rather than operator skill, and food markets bid for the same feedstock.
Gross Margin: 6 to 14%

Premium / Certified

Waste and residue feedstock renewable diesel carrying double counting. The range reflects whether feedstock access is integrated or purchased on spot, which determines utilisation more than anything else. Utilisation follows feedstock access.
Gross Margin: 22 to 31%

Sustainability / Regulatory / Next-Generation

Sustainable aviation fuel cut with secured feedstock behind it. The wide range reflects mandate pricing against the lower yield per tonne and whether output configuration can actually switch. Both capabilities are required.
Gross Margin: 36 to 47%
hydrotreated-vegetable-oil-market-trends-portfolio-architecture-1787460159327

High-value Sub-segments and Strategic Watch-out

Aviation Cut With Secured Feedstock

High value and high growth together, serving legislated demand airlines cannot meet any other way before 2035. The wide range reflects mandate pricing against lower yield per tonne and whether output configuration can genuinely switch. Airlines have no alternative route. Mandates are legislated rather than chosen.
Gross Margin: 36 to 47%

Integrated Waste Feedstock Positions

High value on strong growth where collection or rendering integration secures the input that constrains everybody. The range reflects integration depth, since spot buyers run materially below nameplate while integrated operators do not. Integration removes the spot exposure. Feedstock access decides utilisation entirely. Nameplate means little.
Gross Margin: 29 to 38%

Pretreated Contaminated Feedstock Volume

A genuinely defensible position accessing material competitors cannot process at all. The range reflects pretreatment capability and how far down the quality curve a facility can economically reach with the equipment installed. Competitors cannot process this material. Quality curve reach decides the discount. Capital is required.
Gross Margin: 25 to 34%

Virgin Vegetable Oil Diesel

The strategic watch-out. Volumes are real but there is no double counting benefit, the land use debate attaches directly, and food markets bid for the same oil. The range reflects vegetable oil pricing rather than any commercial decision. No double counting benefit applies. Land use debate attaches directly.
Gross Margin: 6 to 14%

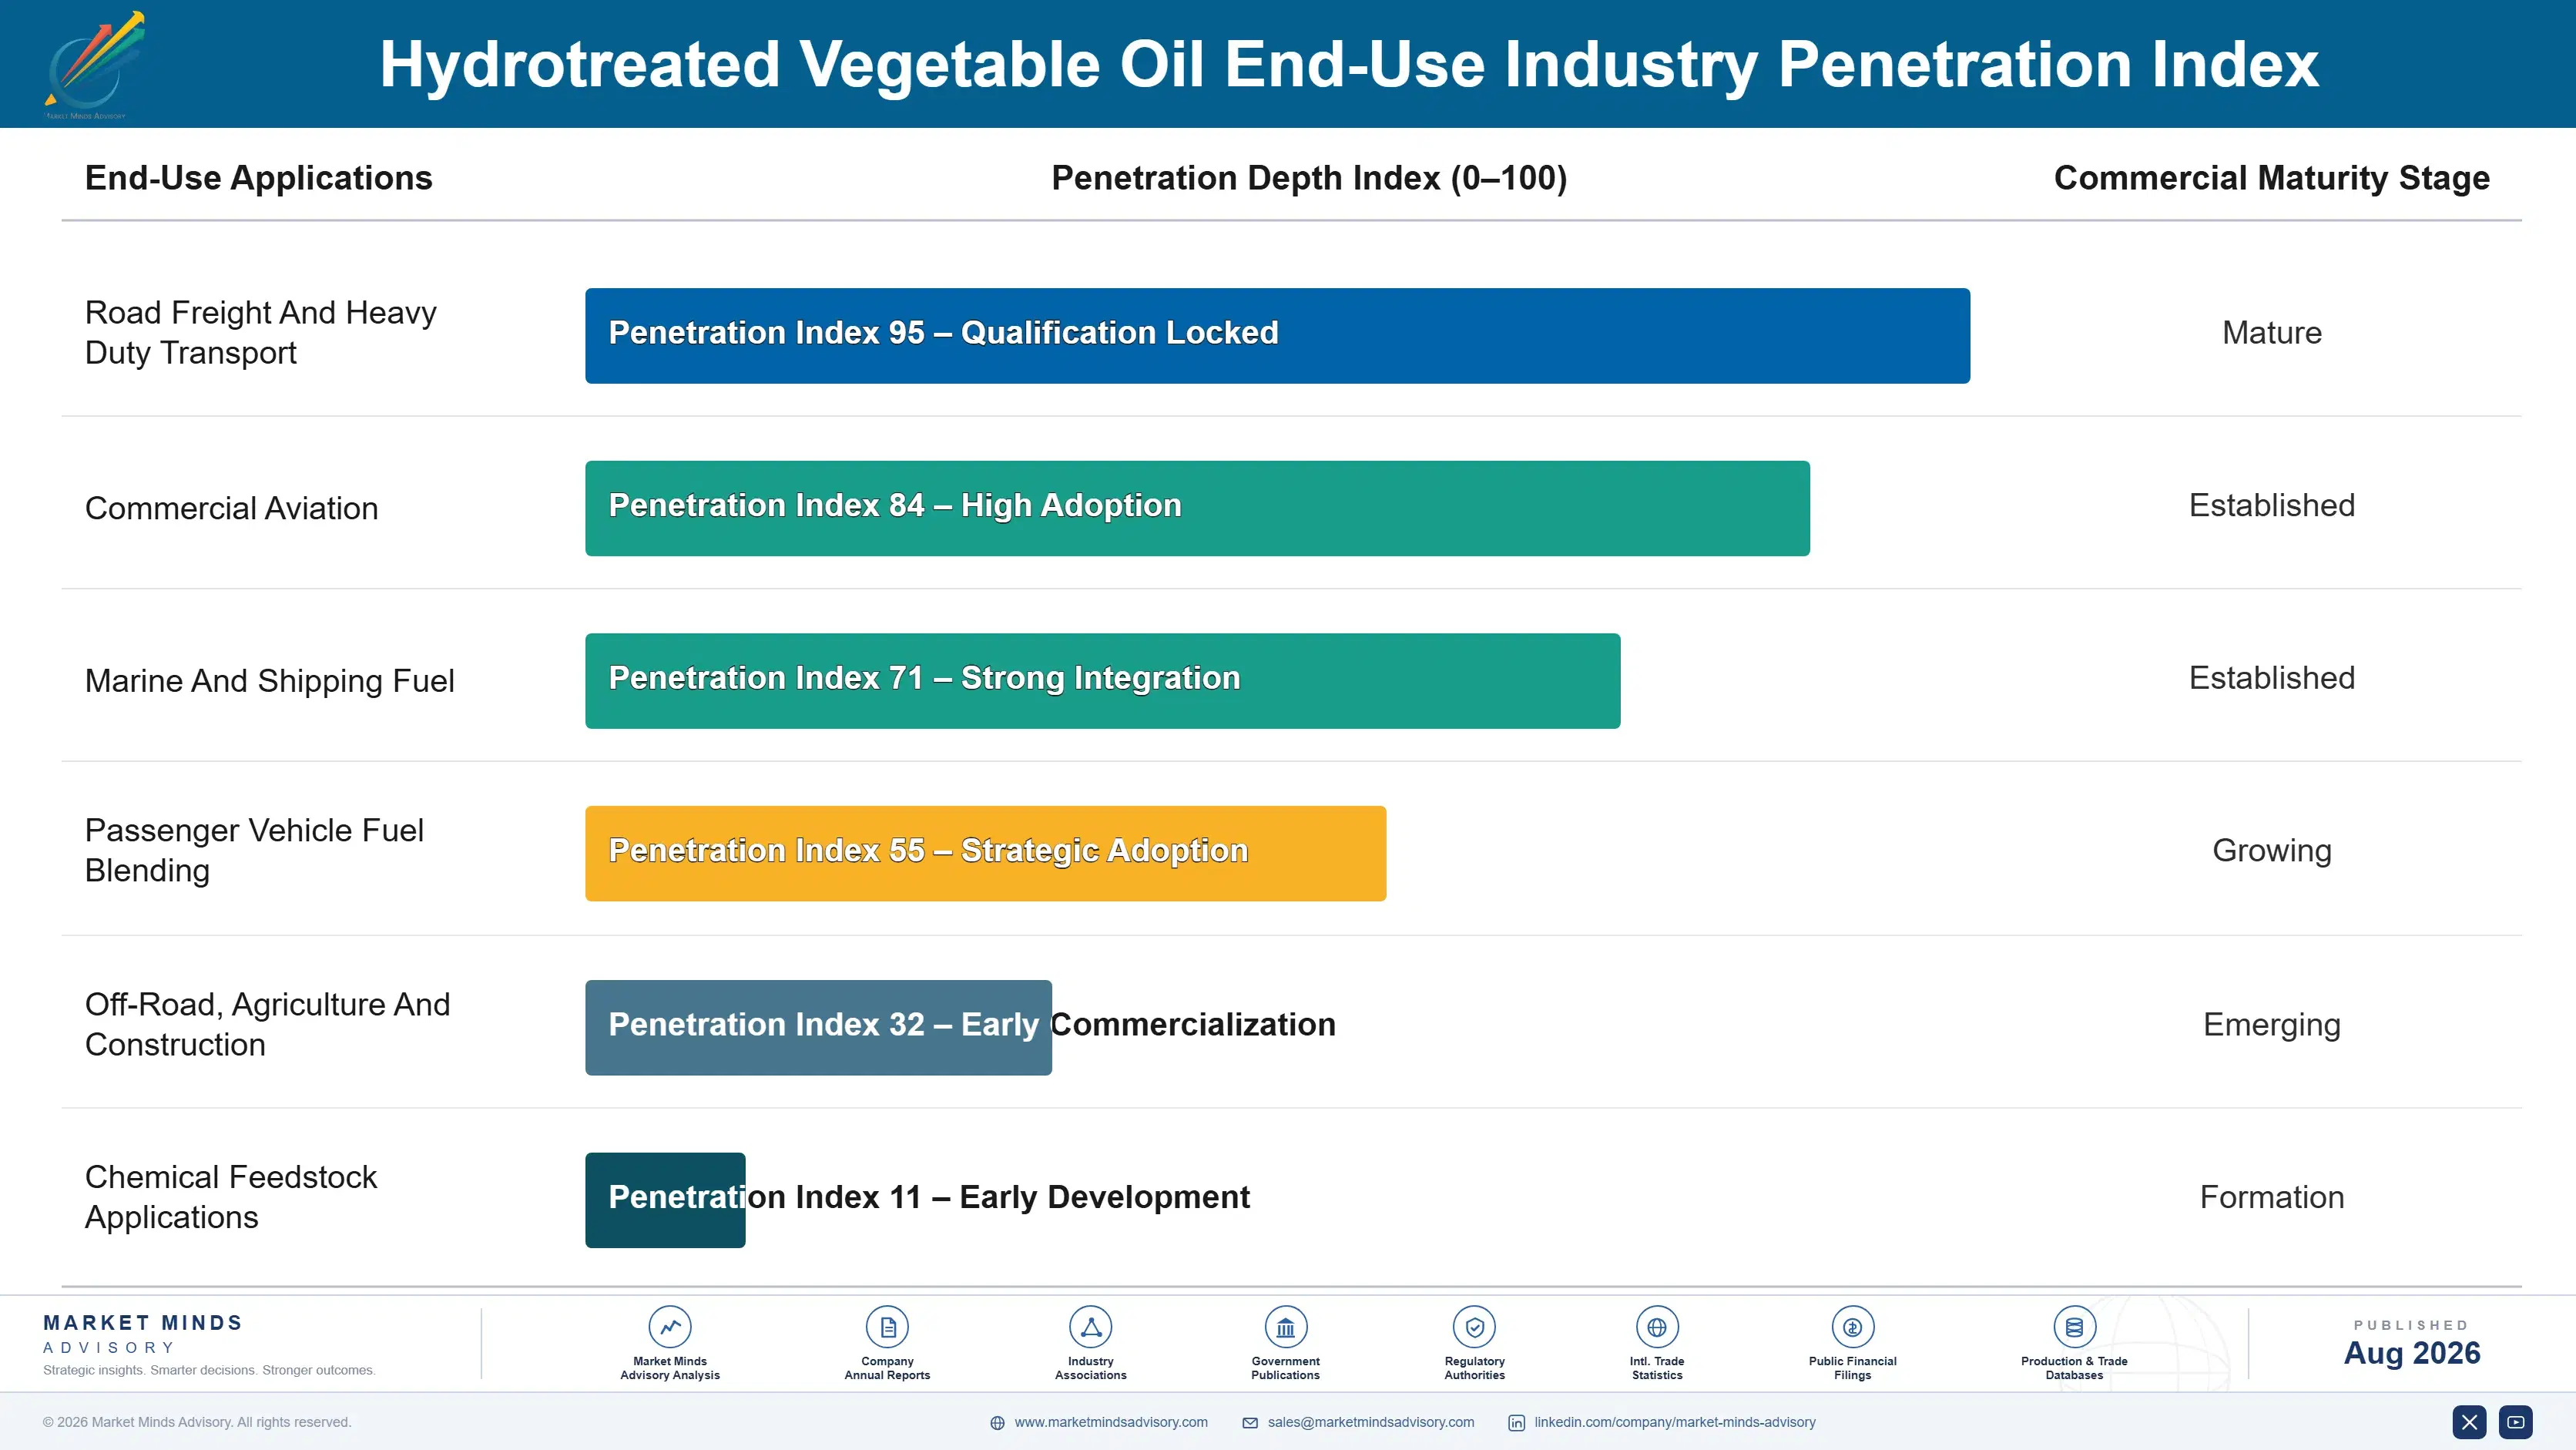
How Renewable Fuel Demand Repeats

Demand here repeats because legislation requires it, which is an unusual foundation and a genuinely durable one while the legislation holds. Obligated parties must acquire compliance volume each year regardless of whether they want to, and mandate schedules are published years ahead, which makes forecasting unusually tractable against a demand curve set by statute rather than by any commercial preference. Statute rather than preference sets the curve.
Stickiness varies by contract structure rather than by product, since the fuel itself is fungible. Long-term offtake agreements with airlines and fuel suppliers hold best, particularly where a mandate obliges the buyer regardless. Compliance credit sales hold as long as the scheme does. Spot volume holds not at all, moving entirely on price between fungible suppliers with nothing to distinguish them.

The buyer profile is unusual and worth stating plainly. The purchaser is generally an obligated party meeting a legal requirement rather than a customer choosing a product, which removes the marketing question entirely and replaces it with a compliance calculation. That makes political durability of mandates the single largest commercial risk anybody in this industry carries, and it is entirely outside their control.
hydrotreated-vegetable-oil-market-trends-end-use-penetration-index-1787460159815

Where To Compete And Why

These are among the four positions where our research anticipates prominent divergence between winners and laggards over the coming forecast period. Each is grounded in the demand model, the regulatory perimeter, and the announced capacity pipeline.
01 / FEEDSTOCK POSITION SECURING

Capacity was never the constraint

Feedstock runs roughly 73% of manufactured cost and binds this entire industry, which is why utilisation sits near 64% against nameplate across a sector that spent heavily on building refineries. Producers holding integrated collection or long-term feedstock contracts run 20 to 28 points higher utilisation than spot buyers do. Refining capacity was never the scarce thing, and a great many balance sheets discovered that only after the capital had already been committed and the plants were already running below nameplate.
02 / PRETREATMENT CAPABILITY BUILDING

The clean oil is already taken

Clean used cooking oil is largely spoken for and the remaining volume is dirtier, more variable and considerably harder to process, which is precisely where pretreatment capability creates genuine advantage. Producers able to handle high free fatty acid and contaminated streams access feedstock competitors cannot use at all, at 15% to 25% below premium waste oil pricing. The capital is real and the alternative is bidding against everybody for exactly the same clean material as every other producer in the region.
03 / OUTPUT SWITCHING FLEXIBILITY

Same process, different distillation cut

The hydrotreated route produces aviation fuel and renewable diesel from identical processing with only a different distillation cut, so a producer with genuine flexibility follows whichever mandate happens to pay better that quarter. Aviation yields roughly 52% per feedstock tonne against considerably higher diesel yields, so the price differential must justify switching. Producers with that capability capture 8% to 14% more margin across a cycle than those whose plant design forecloses the option entirely and permanently at the design stage.
04 / MANDATE REGIME DIVERSIFICATION

Politics is the undiversified risk

Renewable fuel obligations raise pump and ticket prices, which makes them politically exposed whenever transport costs become a public issue anywhere, and roughly 78% of demand here exists only because legislation requires it to. A producer selling into only a single regime carries that political risk entirely undiversified. Serving several separate mandate jurisdictions spreads that risk materially, and the compliance and logistics cost of doing so is modest against the political exposure it removes from the business as a whole.

Engagement Snapshot From the Field

A live engagement with an industry participant carrying material or product regulatory and market exposure ahead of a defining policy shift, showing how our research translates into a defensible multi-year portfolio strategy.
MARKET MINDS ADVISORY · CLIENT ENGAGEMENT SUMMARY
Hydrotreated Vegetable Oil Producer Strategic Portfolio Review and Transition Roadmap 2026·Investment Scenario on Hydrotreated Vegetable Oil Exposure Evaluation 2025-26
CLIENT PROFILE
A European renewable fuel producer with annual revenue near $1.1 billion (client-reported, unverified by MMA), operating two hydrotreating facilities that were commissioned during the recent capacity wave. Both ran materially below nameplate on feedstock purchased through spot and short-term arrangements, with no collection integration and pretreatment capability limited entirely to the clean waste oil streams only.
STRATEGIC CHALLENGE
Utilisation had sat below 60% since commissioning while feedstock costs rose steeply, leaving fixed cost spread across too few tonnes and returns well below the case that financed the plants. Management needed to decide between acquiring collection capability, investing in pretreatment, or reconfiguring toward the aviation cut where mandate pricing had strengthened.
MMA APPROACH
MMA modelled contribution by feedstock type and output cut across three years of the client's own operating data, benchmarked utilisation and feedstock cost against integrated competitors, and assessed pretreatment and collection acquisition options. Twenty-three expert interviews with feedstock collectors, obligated parties and pretreatment technology providers tested each of the routes genuinely available.
KEY FINDINGS
  1. Integrated competitors ran roughly 23 points higher utilisation on comparable assets, and the entire difference traced to feedstock access rather than to any operational or technical capability.
  2. Pretreatment investment would have opened contaminated streams available at roughly 22% below the clean used cooking oil the client was competing for against every other regional producer.
  3. Aviation cut reconfiguration was possible at one facility but not the other, and mandate pricing had already moved far enough to justify it at the site where it was technically feasible.
  4. Collection acquisition targets were available but priced on the assumption of continued feedstock scarcity, which made the returns considerably less attractive than integration usually implies.
CLIENT PROFILE
A European renewable fuel producer with annual revenue near $1.1 billion (client-reported, unverified by MMA), operating two hydrotreating facilities that were commissioned during the recent capacity wave. Both ran materially below nameplate on feedstock purchased through spot and short-term arrangements, with no collection integration and pretreatment capability limited entirely to the clean waste oil streams only.
STRATEGIC CHALLENGE
Utilisation had sat below 60% since commissioning while feedstock costs rose steeply, leaving fixed cost spread across too few tonnes and returns well below the case that financed the plants. Management needed to decide between acquiring collection capability, investing in pretreatment, or reconfiguring toward the aviation cut where mandate pricing had strengthened.
MMA APPROACH
MMA modelled contribution by feedstock type and output cut across three years of the client's own operating data, benchmarked utilisation and feedstock cost against integrated competitors, and assessed pretreatment and collection acquisition options. Twenty-three expert interviews with feedstock collectors, obligated parties and pretreatment technology providers tested each of the routes genuinely available.
KEY FINDINGS
  1. Integrated competitors ran roughly 23 points higher utilisation on comparable assets, and the entire difference traced to feedstock access rather than to any operational or technical capability.
  2. Pretreatment investment would have opened contaminated streams available at roughly 22% below the clean used cooking oil the client was competing for against every other regional producer.
  3. Aviation cut reconfiguration was possible at one facility but not the other, and mandate pricing had already moved far enough to justify it at the site where it was technically feasible.
  4. Collection acquisition targets were available but priced on the assumption of continued feedstock scarcity, which made the returns considerably less attractive than integration usually implies.
RECOMMENDED STRATEGY
Phase 1: Phase one: invest in pretreatment at both facilities, since it opens discounted feedstock and directly addresses the utilisation gap without acquiring anything. Phase 2: Phase two: reconfigure the capable facility toward the aviation cut, capturing mandate pricing that has already moved far enough to justify the lower yield. Phase 3: Phase three: contract feedstock across multiple origins and types rather than acquiring collection assets priced on assumptions of permanent scarcity.
OUTCOME
The client commissioned pretreatment at both sites within sixteen months and lifted utilisation from 58% to 79% (client-reported, unverified by MMA). Aviation cut production began at the capable facility, feedstock cost per tonne fell by roughly 18%, and returns moved above the financing case for the first time since commissioning.

Frequently Asked Questions

Foundational context covering the market sizes, CAGR, scope, country, region and competition that inform every finding below. This section is provided to cover basics and most often pre-purchase conversations, answered from the MMA Primary Research Dataset.

What is the current size of the Hydrotreated Vegetable Oil Market?

The global hydrotreated vegetable oil market was valued at $42.00 billion in 2025, reaching an estimated $46.70 billion in 2026. That covers renewable fuels produced by the hydrotreated esters and fatty acids route.

How large will the Hydrotreated Vegetable Oil Market be by 2036?

MMA forecasts the market reaching $135.01 billion by 2036, an increase of $88.31 billion over the 2026 base. That represents an expansion multiple of 2.89 times across the forecast period.

What is the CAGR for the Hydrotreated Vegetable Oil Market 2026 to 2036?

The base case compound annual growth rate is 11.2%, with a bull case of 12.5% and a bear case of 10.0%. Historical growth between 2020 and 2025 ran at 10.1% annually.

Which segment is growing fastest?

The sustainable aviation fuel cut grows at 16.8%, a full 1.50 times the market rate, on mandates airlines cannot meet any other way. Waste feedstock renewable diesel follows at 11.5%.

Who are the major companies in the Hydrotreated Vegetable Oil Market?

Neste, Diamond Green Diesel, Eni, TotalEnergies and Chevron Renewable Energy Group lead on hydrotreated renewable fuel revenue. Together they account for roughly 61% of global value.

Which country is growing fastest?

India grows fastest at 15.4% annually as blending mandates arrive with domestic refining capacity built alongside them. Indonesia and Malaysia follow closely on palm-derived production capacity.

Report Segmentation Architecture

The full report scope spans multiple orthogonal segmentation dimensions, with cross-tabulated demand data provided for each dimension pair. Coverage extends further to regional breakdowns, trend trajectories, and the competitive detail needed to support segment-level decision-making.

By Product Stream

  • Sustainable Aviation Fuel Cut
  • Waste And Residue Renewable Diesel
  • Virgin Vegetable Oil Renewable Diesel
  • Renewable Naphtha And Co-Products
  • Renewable Propane

By End-Use Industry

  • Road Freight And Heavy Duty Transport
  • Commercial Aviation
  • Marine And Shipping Fuel
  • Passenger Vehicle Fuel Blending
  • Off-Road, Agriculture And Construction
  • Chemical Feedstock Applications

By Commercial Dimension

  • Obligated Party Compliance Supply
  • Long-Term Offtake Agreements
  • Spot And Merchant Fuel Sales
  • Compliance Credit Trading
  • Feedstock Supply And Tolling Arrangements

By Region

  • North America
  • Western Europe
  • East Asia
  • South Asia and Pacific
  • Latin America
  • Middle East and Africa
  • Eastern Europe

Scope, Methodology, and Coverage

Every figure in this report is reproducible from documented input assumptions. The scope below maps the historical period, the forecast horizon, the segmentation dimensions, and the countries covered, alongside the underlying primary and qualitative methodology.
Historical Period
2020 to 2025
Forecast Period
2026 to 2036
Base Year
2025 (USD billions; MMA Primary Research Dataset, August 2026)
Market Definition
This report covers hydrotreated vegetable oil and renewable fuels produced by the hydrotreated esters and fatty acids route, spanning the sustainable aviation fuel cut, waste and residue feedstock renewable diesel, virgin vegetable oil renewable diesel, renewable naphtha and co-products, and renewable propane, across obligated party compliance, offtake, merchant, credit trading and tolling channels. Fatty acid methyl ester biodiesel produced by transesterification, ethanol and other alcohol fuels, gas-to-liquids and power-to-liquids fuels, biomethane, and conventional petroleum diesel and jet fuel are excluded from the sizing.
Quantitative Units
USD billions at producer realised value; volume in million tonnes; realised pricing in USD per tonne.
Segmentation Dimensions
By product stream; by end-use industry; by commercial dimension; by region.
Regions Covered
North America, Western Europe, East Asia, South Asia and Pacific, Latin America, Middle East and Africa, Eastern Europe
Countries Covered
Singapore, China, Japan, South Korea, India, Indonesia, Malaysia, Australia, United States, Canada, Brazil, Argentina, Finland, Netherlands, Italy, Spain, Sweden, Poland, United Arab Emirates, South Africa.
Key Companies Profiled
Neste, Diamond Green Diesel, Eni, TotalEnergies, Chevron Renewable Energy Group, BP, Shell, Repsol, Preem, Cepsa, Phillips 66, Marathon Petroleum, Sinopec, Indian Oil Corporation and others.
Quantitative Methodology
Primary survey, n=3,800 respondents, Q4 2025, six countries; demand-side model with trade association cross-validation
Qualitative Methodology
47 expert interviews, Q4 2025; applied to validate demand model assumptions, identify emerging dynamics, and assess competitive positioning
Report Format
PDF and XLSX data workbook (Word format preview document)
Publisher
Market Minds Advisory
Report Code
MMA-2026-ENE-264
Published
August 2026
Contact
sales@marketmindsadvisory.com | www.marketmindsadvisory.com

Purchase the full Hydrotreated Vegetable Oil Market Report (2026 to 2036).

The full report sizes the hydrotreated vegetable oil market across five product streams, six end-use sectors and seven regions, with tonnage and per tonne pricing detail behind every value estimate. It profiles twenty companies on feedstock access, pretreatment capability and output flexibility. Regional chapters cover mandate schedules, feedstock availability and capacity build by market. Cost analysis quantifies feedstock, hydrogen and utilisation exposure by integration position. Feedstock analysis maps out collection volumes, verification requirements and the fraud enforcement that is now reshaping international import flows entirely.
Tonnage and per tonne pricing by product stream
Mandate schedules and obligation levels compared across jurisdictions
Feedstock availability and collection infrastructure mapped by origin
Capacity build against utilisation measured facility by facility
Competitive position assessments across twenty companies
Aviation cut against renewable diesel yield economics compared

Built For The People Who Decide

From boardroom strategy to bench-side execution, this report is read cover-to-cover by leaders shaping the next decade of their industry, turning demand scenarios, market dynamics and valuation benchmarks into decisions.
CXOs/ Presidents/ VPs/ Managers
M&A and Corporate Development
Strategy Teams and R&D Heads
Procurement and Product Directors
Regulatory and Compliance Leaders
Investor Relations and Equity Analysts