Market Minds Advisory
Hydrophobic Coatings Market

Hydrophobic Coatings Market: PFAS conversion, durability limits and application capability to 2036

Water repellency is easy and oil repellency is not, and the only chemistry that delivers both is exactly what regulators are removing, which leaves 41% of this market looking for a replacement.

Lead Analyst

Bilal Shaikh

Published

September 2026

Make Smarter Decisions with Customized Research Insights

Request a free sample report and evaluate market opportunities, growth trends, and competitive dynamics relevant to your business needs.

2025 MARKET VALUE$2.1BMarket Size 2025
2036 FORECAST VALUE$5.0BBase Case , 2026 to 2036
CAGR 2026 TO 20368.2 %Bull 9.5% / Bear 7.0%
INCREMENTAL OPPORTUNITY$2.7BNet 10- year value creation
EXPANSION MULTIPLE2.20x2036 value over 2026 base
Strategic Levers
M&A Pipeline
Regional Outlook
Country Rankings
Competitive Intelligence
Segmental Deep-dive
Call-Us : 91 93563 13602

Executive Snapshot and Market Trajectory

The European PFAS restriction proposal and American state textile bans are removing the chemistry that made this industry work. Around 41% of coating volume is still fluorinated, the alternatives repel water perfectly well and oil not at all, and reformulation takes 31 months on average. Nobody planned for that.
Nanoparticle sol-gel coatings grow at 12.3%, half again the market rate of 8.2%, because they achieve superhydrophobic performance without fluorine and that is now the whole selling proposition. East Asia holds 28% of value on electronics manufacture and construction volume together. Fluoropolymer coatings, still the largest single chemistry, grow at barely 3%. That single gap is the entire story of this market right now.
Five suppliers hold 32% of formulation revenue, which is unusually fragmented for a specialty coating market and reflects how many applications this chemistry touches. The competitive question is not scale. It is who holds a non-fluorinated formulation that survives abrasion, because the alternatives currently fail 3.8 times sooner than the fluorinated products they replace and every customer has noticed. Nobody has solved that problem yet and a great many companies are trying hard.
Market Definition
This report covers coatings and surface treatments applied to confer water repellency, spanning fluoropolymer, silane and siloxane, silicone, nanoparticle sol-gel, non-fluorinated polymer and hybrid organic-inorganic chemistries. Value is measured at formulation supplier level across industrial, construction, electronics and consumer applications. Excluded are bulk hydrophobic additives compounded into materials, anti-fouling marine paints, general architectural paint, textile finishing equipment, and the substrates being coated.
Base Year Value
$2.1B in 2025 (MMA Primary Research Dataset, August 2026)
Forecast Period
2026 to 2036, eleven discrete annual values
CAGR
8.2% base case. Bull 9.5%. Bear 7.0%.
Fastest Growth Segment
Nanoparticle Sol-Gel Coatings: 12.3% CAGR
Fastest Growth Country
India: 11.1% CAGR
Fastest Growth Region
South Asia and Pacific: 10.3% CAGR
Largest Region
East Asia: 28% of 2025 global value
Market Leaders
PPG Industries, AkzoNobel, 3M, Evonik Industries and Wacker Chemie lead the market. Source: MMA Primary Research Dataset, July 2026.
Primary Survey
n=3,800 procurement and R&D decision-makers, Q4 2025, six countries
Methodology
Demand-side build-up, cross-validated against public data, 47 expert interviews

Hydrophobic Coatings Market Forecast Scenarios

hydrophobic-coatings-market-size-forecast-scenario-1787553297134
Growth ran at 7.0% between 2020 and 2025 and the mix shifted violently underneath it. Electronics conformal coating demand rose with smartphone water resistance ratings becoming standard rather than premium. Construction facade repellent volume tracked building activity. And fluorinated formulations began losing volume from around 2023 as customers moved ahead of regulation rather than waiting for it. Very few suppliers were ready for that.
The 8.2% base case rests on three mechanisms. PFAS restriction converts fluorinated volume into non-fluorinated volume at higher formulation prices, since the alternatives are newer and the supplier base is narrower. Solar installations in dusty regions keep adopting anti-soiling coatings because 6.4% annual output loss is a measurable number that finance teams understand. And electronics manufacturers keep raising ingress protection requirements on devices that were never expected to survive water at all.
The 9.5% bull case is a durability breakthrough in non-fluorinated chemistry, which would open applications currently held by fluoropolymers on abrasion performance rather than preference. The 7.0% bear case is customers simply doing without: an oil-repellent finish that no longer exists is often replaced by no finish at all rather than by a substitute, and that volume never returns to anybody.

The Problem Nobody Has Solved

Repelling water is not difficult. A silicone, a wax or a sol-gel silica layer will push a droplet to a contact angle above 150 degrees and look impressive doing it. Repelling oil is a different physics problem entirely, and the only chemistry that manages both at any scale is fluorinated, which is precisely what regulators across Europe and several American states are removing. That single fact defines every commercial decision in this industry right now.
TOP-FIVE CONCENTRATION32%Combined position across hydrophobic coating supply held by leaders
CONTACT ANGLE THRESHOLD150 degreesAngle above which a surface is classified as superhydrophobic
FLUORINATED FORMULATION SHARE41%Portion of coating volume still using fluorinated chemistry
ABRASION DURABILITY GAP3.8 timesCycle ratio between fluorinated and non-fluorinated alternatives before failure
SOLAR SOILING LOSS6.4%Annual output lost to dust accumulation across desert installations
REFORMULATION PROGRAMME LENGTH31 monthsTypical period from alternative screening to commercial product launch
Durability is the second problem and it gets discussed less. Non-fluorinated superhydrophobic surfaces work by roughness at very small scale, and roughness abrades. Testing puts the current alternatives at roughly 3.8 times fewer abrasion cycles before performance falls below specification, which is fine on a facade and unacceptable on a phone screen or a car windscreen. Around 41% of volume remains fluorinated for exactly this reason, and reformulation programmes run 31 months on average.
One application has arithmetic nobody argues with. Desert solar installations lose around 6.4% of annual output to dust, an anti-soiling coating recovers a meaningful part of that, and the payback calculation is simple enough for a project finance model. Very little else in this industry sells that cleanly.
"The industry keeps announcing fluorine-free breakthroughs and the customers keep running abrasion tests and finding the same answer. Whoever actually closes the durability gap will own applications that have been locked for thirty years, and nobody is close yet."
Director, Surface Technologies and Specialty Coatings Practice · MMA Chemicals and Materials Practice · August 2026

Market Trends

PFAS restriction forces reformulation across every fluorinated application

The European universal PFAS restriction proposal covers side-chain fluorinated polymers used in durable water repellents, and American state legislation has already banned them in textiles sold in California and New York. Around 41% of coating volume is still fluorinated and every litre of it needs an answer. Reformulation programmes run 31 months on average, which means customers who started in 2024 are only now seeing commercial product. Suppliers holding validated non-fluorinated alternatives are winning specifications outright, and those without are watching accounts they held for decades open to competitive tender for the first time.
Market Impact: Reaches 150 degree contact angles

Solar anti-soiling coatings sell on a finance calculation

Utility-scale solar in the Gulf, North Africa, Rajasthan and the American southwest loses around 6.4% of output to dust accumulation, and cleaning costs money and water that these locations do not have spare. An anti-soiling coating recovers part of that loss and reduces cleaning frequency, which converts a coating purchase into a yield improvement a project finance model can price. That is unusual: most coating value is qualitative and gets argued about. Growth here follows solar capacity additions in dusty regions rather than any coating industry initiative, and the coating suppliers involved are mostly small specialists rather than the majors.
Market Impact: Segment growing 8.9% annually

Market Opportunities and Growth Drivers

Electronics ingress protection ratings become standard rather than premium

A water resistance rating used to be a flagship phone feature and is now expected on mid-range devices, hearing aids, wearables and increasingly on power tools and automotive electronics. Achieving it with seals adds cost, weight and assembly complexity. A plasma-deposited nanocoating on the circuit board achieves much of the same protection with none of that, which is why manufacturers keep specifying it. The coating is applied by a small number of specialists holding process equipment rather than by paint companies. Growth follows device volume and rating expectations together, and neither shows any sign of moderating.
Market Impact: Fails 3.8 times sooner

Construction facade repellents grow with building stock renovation

Silane and siloxane water repellents applied to masonry and concrete are the largest volume application in this market and the least discussed, because there is nothing new about them. Growth at 8.9% comes from renovation rather than new build: European energy performance requirements drive facade work on existing stock, and a water-repellent treatment is applied whenever insulation or render is renewed. The chemistry is already non-fluorinated, which means this segment carries none of the regulatory exposure that dominates the rest of the market. It also carries none of the pricing power, since several suppliers offer equivalent products.
Market Impact: Extends sales cycles past 31 months

Market Restraints and Challenges

Non-fluorinated alternatives abrade before they reach specification life

Superhydrophobic performance without fluorine depends on surface roughness at nanometre scale, and roughness is fragile by construction. Testing puts current alternatives at roughly 3.8 times fewer abrasion cycles before water repellency falls below specification. The root cause is physical rather than formulation: fluorine lowers surface energy chemically, while a textured surface achieves the same effect geometrically and loses it as soon as the texture wears. Commercially this locks fluorinated chemistry into automotive glass, textiles and touch surfaces despite the regulation. Suppliers are pursuing self-healing layers and hard nanocomposite matrices, and neither works reliably at commercial cost yet.
Market Impact: Affects 41% of coating volume

Application method rather than chemistry limits commercial reach

Many of the best-performing hydrophobic coatings require plasma deposition, controlled curing or multi-layer application in equipment the customer does not own. The root problem is that a coating requiring a machine is not a product sale but a capital and process decision, which puts the supplier into a longer conversation with a more senior buyer. Commercially this caps addressable demand to customers willing to change a production line. Suppliers have responded by offering coating as a service through regional application centres, and by developing dip and spray formulations that trade some performance for a route to market that actually exists.
Market Impact: Recovers part of 6.4% loss
3 additional market trends, 4 additional growth drivers, and 2 additional restraints and challenges are covered in the full report. Contact sales@marketmindsadvisory.com to access the complete intelligence.

Segment CAGR and Growth Architecture

Coatings are classified here by the chemistry that produces the water-repellent surface, since that determines regulatory exposure, durability and cost together. Application industry, deposition method and substrate are handled separately in the framework, because a single chemistry serves construction, electronics and textiles with different formulation carriers around the same active. Chemistry is where the regulation lands.
hydrophobic-coatings-market-market-share-analysis-1787553297685

Nanoparticle Sol-Gel Coatings

Growing at 12.3%, half again the market rate, this is the chemistry the industry is betting on and it is not yet good enough. Silica and titania nanoparticles deposited from sol-gel produce surface roughness that pushes contact angles past 150 degrees without a fluorine atom anywhere, which answers the regulatory question completely. What it does not answer is durability: the roughness that creates the effect abrades, and current formulations fail roughly 3.8 times sooner than the fluorinated products they replace. Solar anti-soiling and architectural glass tolerate that. Automotive and touch surfaces do not. Every supplier in this segment is working on hard matrices and self-healing layers, and the one that succeeds first takes a great deal.
CAGR 12.3%

Non-Fluorinated Polymer and Wax Coatings

This segment grew because regulation created demand for something rather than because anybody invented anything remarkable. Silicone dendrimers, hyperbranched polymers and modified paraffins deliver perfectly adequate water repellency at costs below the fluorinated products they replace, and they fail completely on oil. Textile durable water repellents are the largest application and the conversion there is well advanced, driven by California and New York legislation ahead of European restriction. Growth at 11.0% reflects conversion rather than market expansion. The commercially interesting question is whether customers who lose oil repellency accept the trade or simply stop specifying a finish at all, and the honest answer varies enormously by end use. Nobody has surveyed that properly yet.
CAGR 11.0%
Full segment breakdown across 6 segments available in the complete report.

Regional Architecture and Country Demand Map

East Asia holds 28% of value on electronics manufacture and construction volume arriving together. North America follows at 26%, where state-level PFAS legislation moved ahead of federal rules and forced early reformulation. Regulation rather than demand explains most of this map. Nobody expected that to be true.

North America

State legislation did what federal rulemaking has not, and California and New York textile bans removed fluorinated durable water repellents from a large consumer market ahead of any European restriction taking effect. That forced American brands to reformulate first and gave suppliers here early commercial experience the rest of the world is now buying. Desert solar installations across the southwest add anti-soiling demand on straightforward payback arithmetic. Automotive glass and paint protection coatings remain heavily fluorinated because the durability alternatives do not exist. Growth at 8.0% mixes forced conversion with genuine application expansion, and separating the two is harder than it looks. Most published forecasts do not even attempt it.
Share: 26% | CAGR: 8.0% (2026 to 2036)

Western Europe

The restriction proposal that is reshaping this entire market originates here, and the exposure lands hardest here as a result. German and Swiss chemical companies hold the deepest silicone and sol-gel formulation capability anywhere and have been funding non-fluorinated development since well before the regulation was drafted. Construction renovation driven by energy performance requirements sustains facade repellent volume that carries no regulatory exposure at all. Growth at 6.6% is the weakest of the seven regions because conversion here means losing fluorinated volume faster than the alternatives replace it. The formulation capability, however, is now the region's principal export in this category. Capability travels considerably better than the volume ever did.
Share: 21% | CAGR: 6.6% (2026 to 2036)
Regional intelligence for 5 additional markets available in the complete report: East Asia, South Asia and Pacific, Latin America, Middle East and Africa, Eastern Europe. Contact sales@marketmindsadvisory.com.
hydrophobic-coatings-market-country-cagr-analysis-1787553298207

Where Coating Margin Is Available

Four moves matter in a market being rebuilt by regulation. Two of them are about arriving with an answer before the customer needs one, and two are about applications where the value is measurable rather than argued. Defending fluorinated volume is not among them, because that volume is leaving regardless of what any supplier prefers.

Arrive with the reformulation answer, not a sample

Around 41% of coating volume still needs a non-fluorinated replacement and reformulation programmes run 31 months, which means a customer starting now is committing to a supplier for three years before seeing commercial product. A supplier arriving with validated performance data, application trials and regulatory documentation already assembled shortens that considerably and wins on capability rather than price. Sending samples and letting the customer do the work loses to whoever did it first. This window closes as customers complete conversion, and most of them will only do it once. That last point is worth dwelling on.
Market Impact: Addresses the full 41% of volume needing replacement

Solve abrasion before solving anything else

Non-fluorinated alternatives fail roughly 3.8 times sooner on abrasion, and that single number is what keeps fluorinated chemistry in automotive glass, textiles and touch surfaces despite the regulation. Every supplier is chasing contact angle and the customers stopped caring about contact angle years ago. A formulation that closes the durability gap opens applications currently unavailable to anybody at any price, and the position it creates would hold for a decade because reformulation programmes are long and customers convert once. Research budgets pointed at repellency rather than durability are pointed at the wrong problem.
Market Impact: Closes a durability gap running 3.8 times wide

Sell solar coatings into the project finance model

Desert installations lose around 6.4% of output annually to dust, and cleaning consumes water and labour that these sites are short of. That makes an anti-soiling coating one of very few coating purchases with a payback calculation a finance team can actually run. Selling it to a procurement function as a coating loses on unit price. Presenting it to the asset manager as a yield improvement wins, because the comparison is against lost generation revenue rather than against a cheaper coating. Very few coating companies have ever prepared a project finance case for anything.
Market Impact: Recovers part of a 6.4% annual output loss

Run application centres rather than selling the chemistry

The best-performing coatings need plasma deposition or controlled curing in equipment the customer does not own and will not buy for a trial, which caps addressable demand to whoever is willing to change a production line. Regional application centres remove that barrier entirely: the customer sends parts and receives coated parts, with no capital decision and no process risk. Pricing follows a service model rather than a litre one, and the switching cost rises because the process knowledge sits with the supplier. Reformulation cycles running 31 months make that relationship considerably stickier than a chemical sale.
Market Impact: Removes the capital barrier across 31 month cycles

Who Controls the Margin Pool

Five suppliers hold 32% of hydrophobic coating revenue, measured on formulation supply into industrial and consumer applications, the basis used throughout this section. That is fragmented for a specialty coating category and it reflects how many unrelated applications this chemistry serves. The gap between leaders and everybody else is not scale but non-fluorinated development depth, and several very small specialists hold better positions there than the majors do.
Competition runs on three dimensions. Non-fluorinated performance data, which decides who gets shortlisted before anybody discusses price. Application capability, particularly whether a supplier can coat parts rather than sell chemistry. And regulatory documentation depth, since a customer converting a formulation needs evidence it can hand to a regulator. Price argument sits in construction and almost nowhere else.

Rankings will shift on whoever closes the abrasion gap first, and there is no reason that has to be a large company. Specialist coating houses hold process capability and application experience that a formulation major cannot buy quickly. Construction chemistry positions hold longest, because the products are already non-fluorinated and the customers buy on price and distribution reach. That is a very different business.
hydrophobic-coatings-market-company-positioning-matrix-1787553298728

Competitive Moat and Risk Dimensions

PPG INDUSTRIES

Moat: Application breadth across industries

PPG formulates for automotive, aerospace, architectural and industrial customers from one technical base, which means a non-fluorinated development funded for one application transfers into several others at no additional research cost. Specialists working a single vertical cannot spread development that way, and in a market where every application needs reformulating at once that matters considerably.
PPG INDUSTRIES

Risk: Coating rather than process

The business sells formulations rather than applied surfaces, which excludes it from the electronics and precision applications where plasma deposition or controlled curing is the requirement. Those are among the fastest-growing uses and they belong to specialists holding process equipment. Buying that capability means acquiring companies with cultures and economics quite unlike a coatings major.
EVONIK INDUSTRIES

Moat: Silica and sol-gel depth

Evonik built fumed silica and sol-gel capability across decades of unrelated industrial applications, and that turns out to be exactly the chemistry the non-fluorinated transition depends on. Competitors arriving now are learning particle synthesis and dispersion stability from a standing start, and neither is quick to acquire or reliable to outsource.
EVONIK INDUSTRIES

Risk: Ingredient rather than formulation

Much of the position sits in supplying materials to formulators rather than in owning the customer relationship, which means the value captured per kilogramme is lower than a finished coating commands. Customers converting formulations talk to their coating supplier first and the ingredient producer second, and that sequence is difficult to change from behind.

Players Tracked

Prominent Players

PPG Industries
AkzoNobel
3M
Evonik Industries
Wacker Chemie

Other Key Players

BASF
Dow
Shin-Etsu Chemical
Momentive Performance Materials
Elkem
Sika
Mapei
Sto SE
Nippon Paint Holdings
Kansai Paint
Jotun
P2i
HZO
Aculon
NEI Corporation

Recent Developments

MAY 2025

Evonik expanded non-fluorinated repellent development capacity in Germany

Evonik increased formulation development and application testing capacity for non-fluorinated water repellent chemistry at a German site, responding to customer reformulation enquiries generated by the European PFAS restriction proposal. This was an organic expansion of technical service resource rather than any acquisition or partnership. Enquiries had run ahead of orders.
Signal: Suppliers are staffing against a regulation that has not landed, which tells you how certain the industry considers it
OCTOBER 2025

PPG Industries acquired a specialist surface treatment company

PPG Industries completed the acquisition of a specialist company holding plasma deposition and precision surface treatment capability for electronics applications. The transaction was an acquisition rather than a joint venture, with full ownership transferring at completion, and it adds applied process capability the formulation business lacked.
Signal: Formulation majors are buying process capability rather than building it, which suggests they judge the learning curve too long
MARCH 2026

3M signed a multi-year anti-soiling coating supply agreement with a Gulf solar developer

3M entered a multi-year supply agreement covering anti-soiling coatings for utility-scale solar installations across a Gulf developer's project portfolio. The arrangement was a supply agreement rather than a joint venture or equity investment, and it includes performance measurement against agreed soiling loss thresholds. Thresholds were written into the contract.
Signal: Coating performance is being contracted against measured yield rather than specification, which changes what a supplier is actually selling

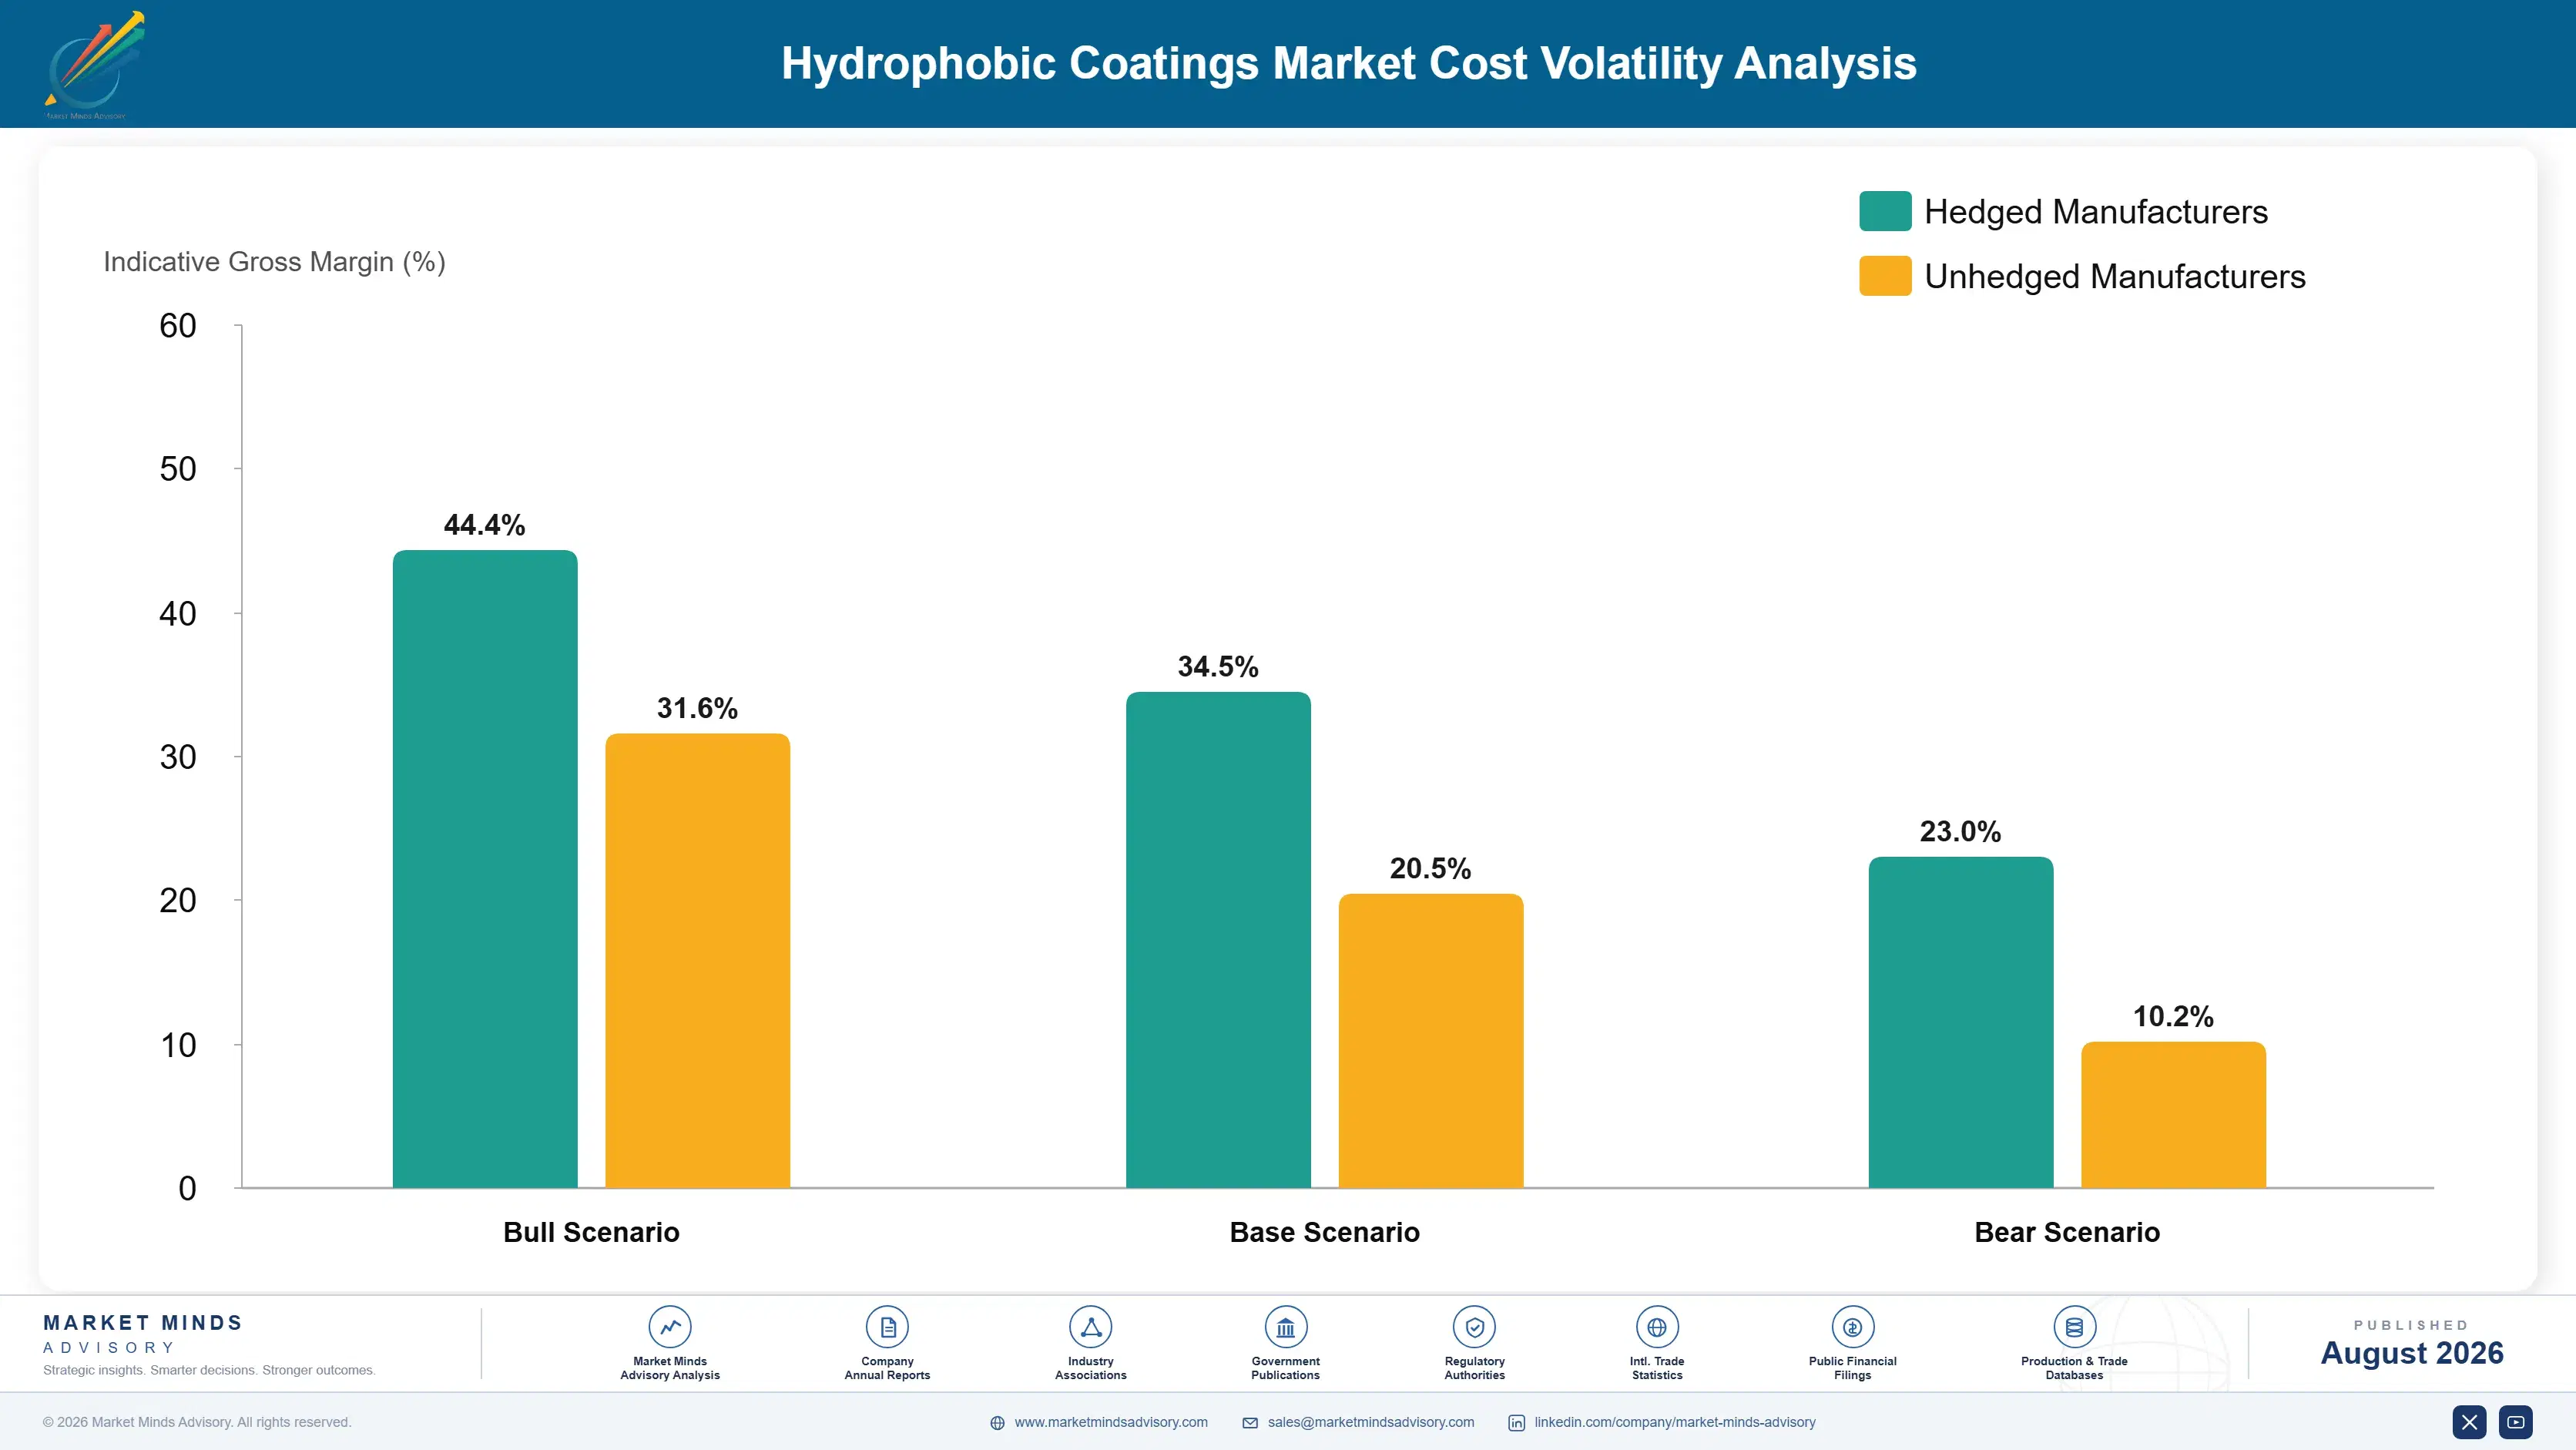
What Moves Formulation Cost

Silicone and siloxane intermediates account for around 38% of formulation cost across the non-fluorinated chemistries, with nanoparticle silica, solvent carriers and specialty additives making up the balance. Siloxane supply concentrates in a small number of producers in Germany, Japan, the United States and China. Fluorinated intermediates, where still used, come from producers facing their own regulatory pressure.
Siloxane prices moved sharply through 2021 and 2022 as European energy costs raised silicon metal expenses, and IEA data show European industrial electricity running well above American levels. Wacker Chemie recorded raw material and energy cost pressure across its silicones division in its Annual Report 2022. Coating formulators on annual customer agreements absorbed most of the movement, because a coating qualified into a customer specification cannot be reformulated to a cheaper carrier without repeating validation.

That validation lock is the disadvantage mechanism and it lands unevenly. A formulator holding customer specifications cannot change carrier or particle source without repeating trials that take months. Construction repellent suppliers reformulate freely because nobody validates a facade treatment. Formulators with captive silica or siloxane supply carry smaller exposure than those buying on the merchant market. Asian producers gain further from energy costs European operations cannot match.
hydrophobic-coatings-market-cost-volatility-analysis-1787553298925

Qualify two silica sources during initial formulation development

Nanoparticle silica supply concentrates in few producers and particle characteristics vary enough between them that substitution after qualification means repeating customer trials. Validating two sources during original development costs modestly more and preserves the ability to switch when one supply tightens or one producer raises price. Almost nobody plans that far ahead, because development budgets reward speed to first sample.

Index customer agreements to published siloxane benchmarks

Annual fixed pricing on a formulation whose largest input moved by multiples in 2022 transfers all volatility to the formulator across a period nobody can forecast. Indexing to published silicone intermediate benchmarks with quarterly reset removes the argument, and customers accept it readily than expected once the alternative is a padded quotation. Resistance comes from procurement rather than technical functions.

Reduce solvent load through waterborne carrier development

Solvent carriers add cost and regulatory exposure on volatile organic compound limits, and much of the industry still uses them because waterborne versions perform slightly worse. Closing that gap removes a cost line and a compliance burden at once. The development effort is real and the payoff is permanent, which is a better trade than most formulation work offers.

Portfolio Architecture for Margin Defence

Margin in hydrophobic coatings tracks how hard the performance is to achieve and how few suppliers can achieve it, which right now means non-fluorinated durability above everything. Construction facade repellents run at gross margins in the high teens, sold on price and distribution against several equivalent products. Electronics and precision coatings run considerably higher, because the process capability is scarce and the customer cannot easily requalify. Solar anti-soiling sits between the two, priced against measured yield rather than against a competitor.
The tension is that construction volume pays the overhead and specialty applications pay the returns, and the two need entirely different organisations. Selling facade repellent means distribution reach and price discipline. Selling an electronics coating means process engineering, application equipment and a technical conversation lasting years. Formulators running both from one commercial structure have generally found the volume business starved the specialty one of technical resource at exactly the wrong moment.

High-value pools sit in durable non-fluorinated formulations, applied electronics coatings and solar anti-soiling sold against yield. None of the three is large in volume terms and all three are defended by capability rather than by capacity. Blending equipment by itself defends nothing whatsoever here.

Volume / Commodity-Adjacent

Silane and siloxane facade repellents and general industrial water repellent formulations sold on price and distribution reach against several equivalent products. The seven-point range separates suppliers with captive siloxane supply from those buying intermediates on the merchant market.
Gross Margin: 17%-24%

Premium / Certified

Formulations qualified into customer specifications across automotive, aerospace and industrial applications where validation work creates a genuine switching cost. The eight-point spread reflects how much application development the supplier contributes against how much the customer performs alone.
Gross Margin: 30%-38%

Sustainability / Regulatory / Next-Generation

Durable non-fluorinated formulations, applied electronics coatings and solar anti-soiling sold against measured yield. The fourteen-point range is wide because pricing reflects scarcity of qualified alternatives and process capability rather than any cost basis a customer can benchmark.
Gross Margin: 40%-54%
hydrophobic-coatings-market-portfolio-architecture-1787553299424

High-value Sub-segments and Strategic Watch-out

Durable Non-Fluorinated Formulations

The single largest opportunity in this market and nobody has taken it yet, because current alternatives fail 3.8 times sooner on abrasion. Whoever closes that gap opens automotive glass, textiles and touch surfaces that are locked to fluorinated chemistry despite the regulation. Research budgets point elsewhere.
Gross Margin: 42%-54%

Solar Anti-Soiling Coatings

One of very few coating purchases with a payback a finance team can run, since desert installations lose 6.4% of output annually to dust and cleaning water is scarce. Sell it to the asset manager rather than to procurement and the price argument disappears entirely.
Gross Margin: 38%-50%

Construction Facade Repellents

The volume that pays the overhead, already non-fluorinated and therefore carrying none of the regulatory exposure that dominates everything else here. It also carries none of the pricing power, because several suppliers offer equivalent products. Manage it for distribution reach. Nothing else defends the position.
Gross Margin: 17%-24%

Applied Coating Service Capability

The best-performing coatings need equipment the customer will not buy for a trial, which caps demand until somebody offers coating as a service instead. Regional application centres remove the capital barrier and make the relationship far stickier than any chemical sale ever was. Very few majors run them.
Gross Margin: 40%-52%

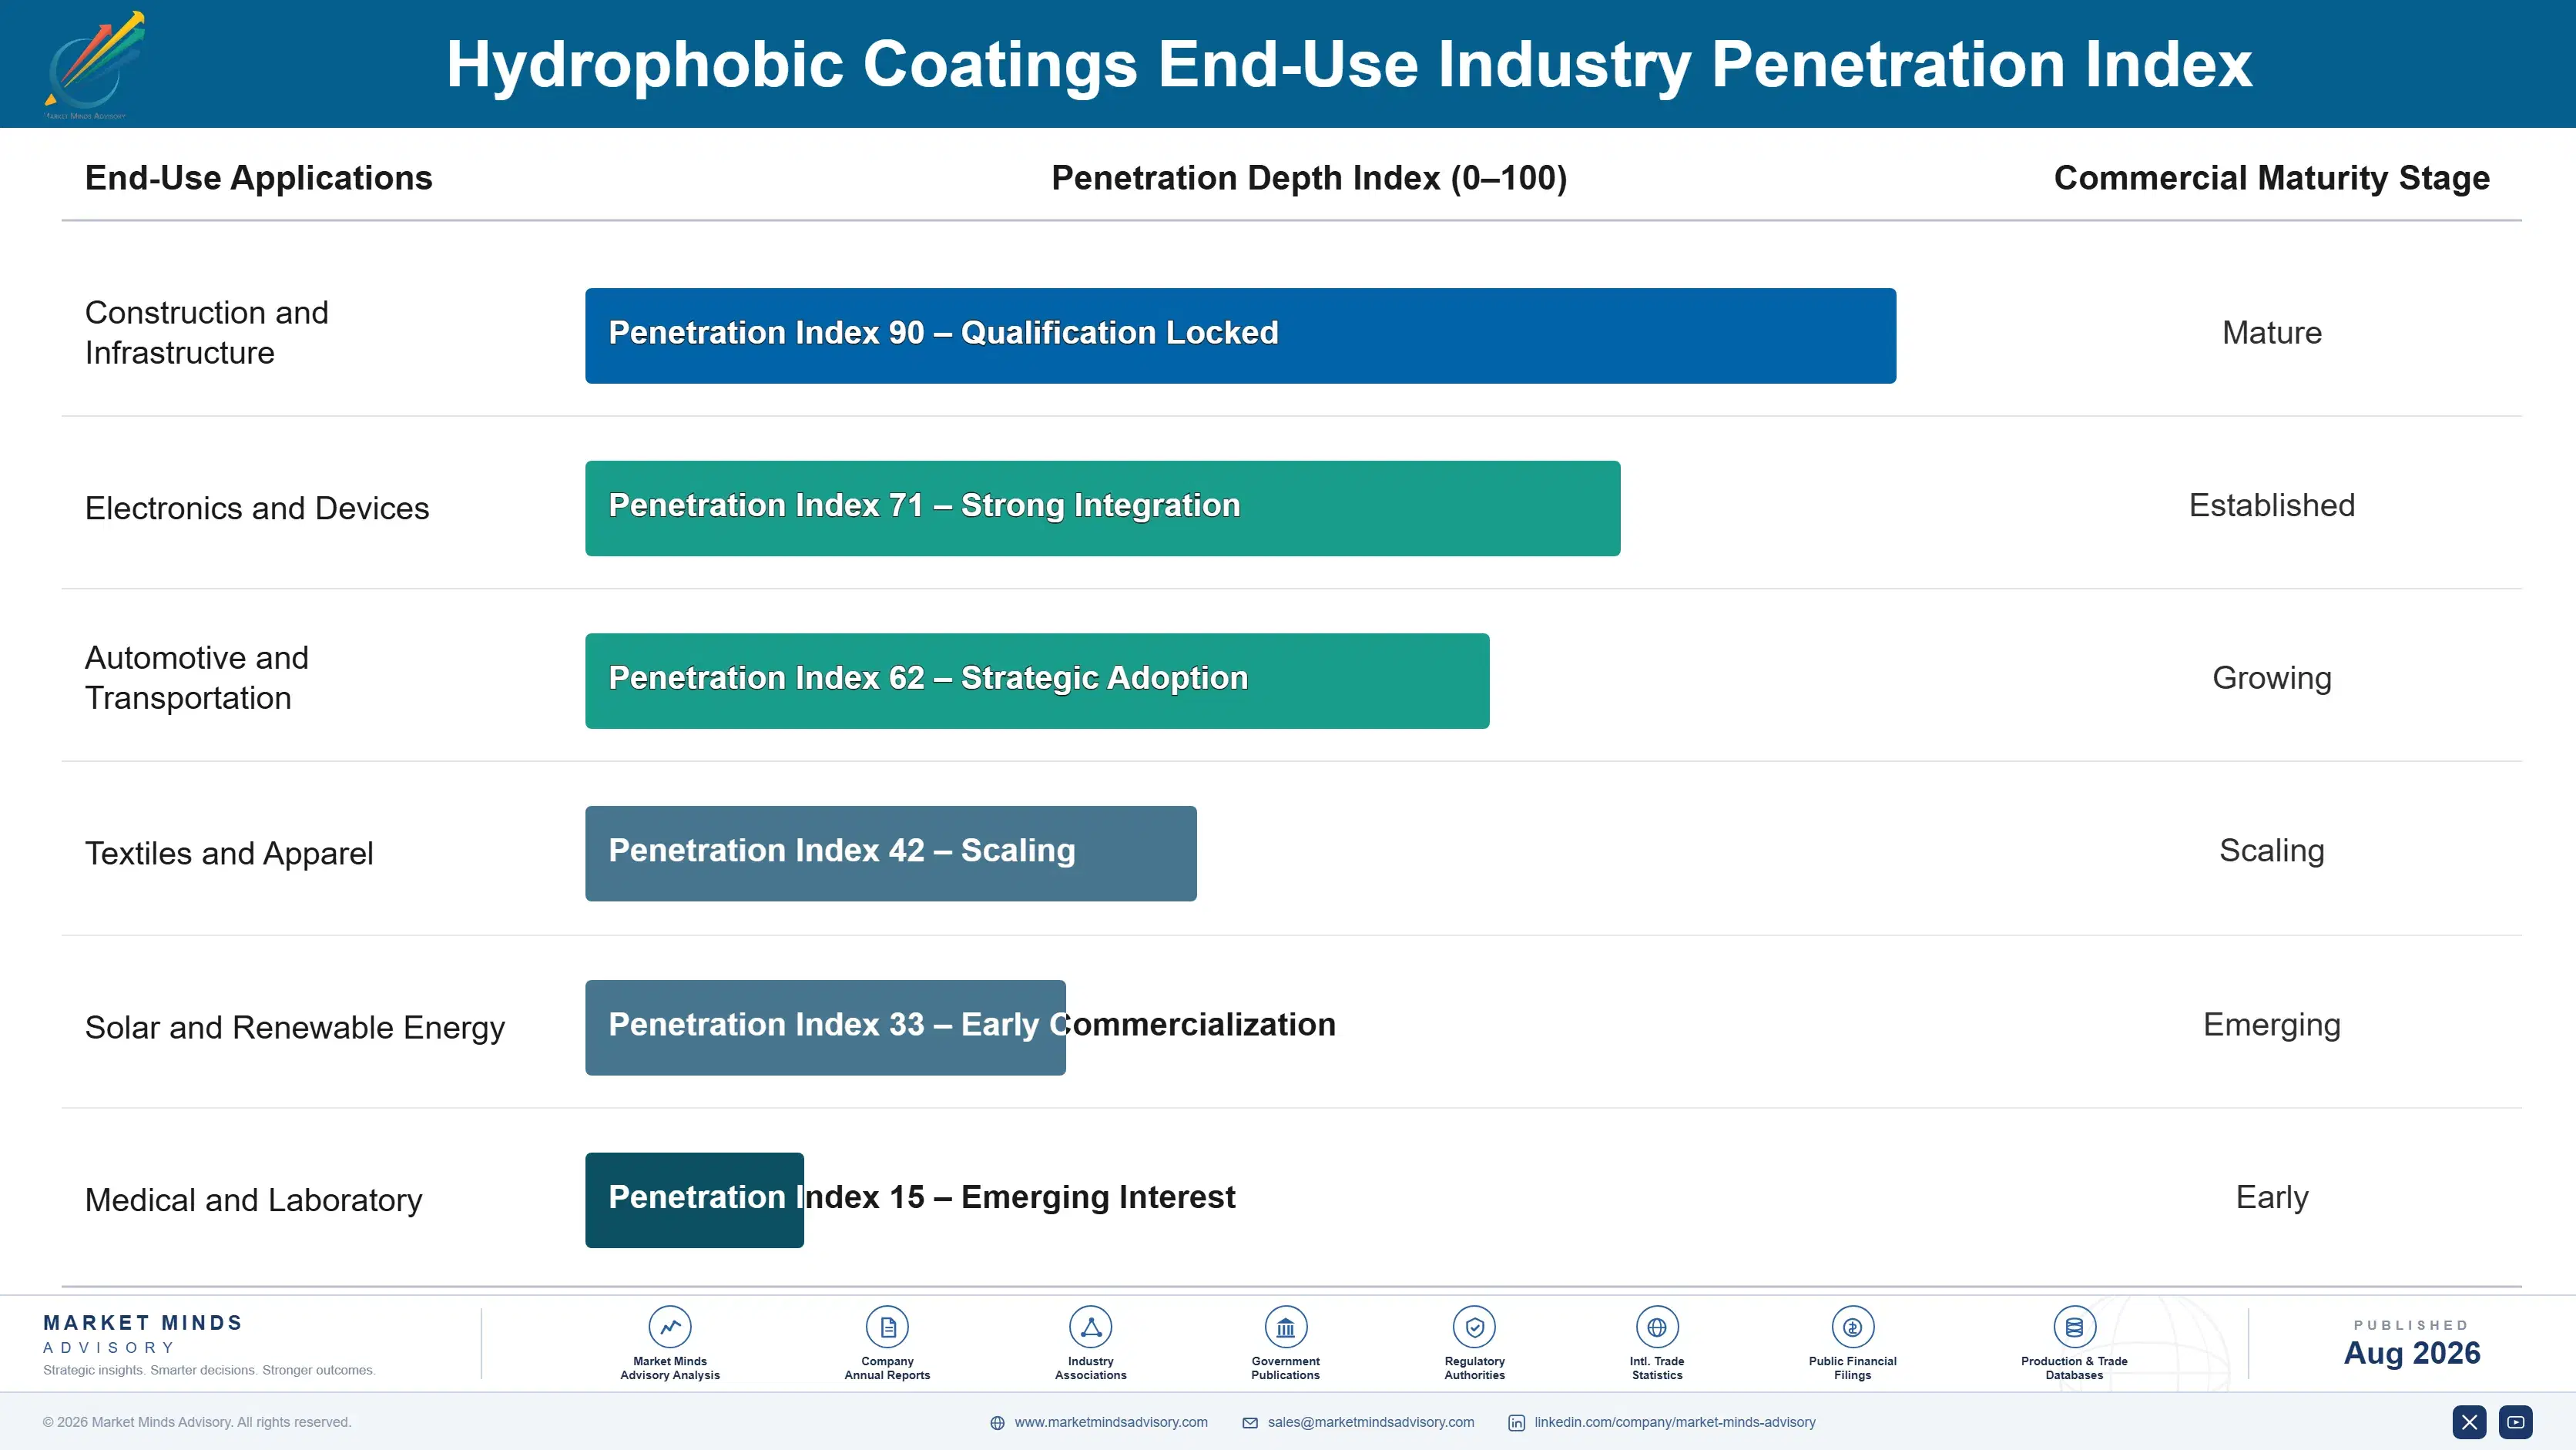
How Coating Demand Renews

Coating demand renews on two different clocks depending on application. Construction repellents are reapplication revenue: a facade treatment lasts perhaps ten years and the building comes back for another one. Electronics and industrial coatings are consumption revenue tied to production volume, arriving continuously with every unit built and stopping the moment a line stops. Solar anti-soiling sits closest to a service, reapplied on a maintenance schedule the asset owner controls entirely.
Stickiness varies enormously. Electronics coatings applied on the supplier's own equipment are close to permanent, since the process knowledge sits outside the customer entirely. Automotive and industrial formulations qualified into specifications change reluctantly because revalidation takes months. Construction repellents change on whichever distributor called last. Depth follows the same line: specialty customers consolidate onto one supplier across applications while construction buyers hold no loyalty.

The buyer moved and the industry noticed late. Coating selection once sat with product engineers weighing performance against cost. It increasingly sits with regulatory and compliance functions asking what substances are present, with sustainability teams asking the same question differently, and with asset managers asking what yield improvement the coating actually delivers. None of those three cares about contact angle at all.
hydrophobic-coatings-market-end-use-penetration-index-1787553299916

Where To Place The Bet

These are among the four positions where our research anticipates prominent divergence between winners and laggards over the coming forecast period. Each is grounded in the demand model, the regulatory perimeter, and the announced capacity pipeline.
01 / ABRASION DURABILITY RESEARCH

Point research at durability, not repellency

Current non-fluorinated alternatives fail roughly 3.8 times sooner on abrasion, and that single number is what keeps fluorinated chemistry locked into automotive glass, textiles and touch surfaces despite regulation removing it everywhere else. Every supplier keeps announcing higher contact angles and no customer has cared about contact angle for years now. A formulation that closes the durability gap takes applications nobody can currently serve at any price, and reformulation cycles are long enough that the position would hold for a decade.
02 / REFORMULATION WINDOW CAPTURE

Arrive with the answer before the customer asks

Around 41% of coating volume still needs a non-fluorinated replacement and reformulation programmes run 31 months, which means a customer starting the work now commits to a supplier for three years before commercial product exists at all. Arriving with validated performance data, application trials and regulatory documentation already assembled turns a sampling exercise into a decision, and the supplier who did that work first generally keeps the account. This window closes as conversions complete, and most customers will only convert once.
03 / SOLAR YIELD POSITIONING

Sell anti-soiling as generation, not coating

Desert installations lose around 6.4% of output annually to dust and cleaning consumes water and labour these sites cannot spare, which makes an anti-soiling coating one of very few coating purchases with a payback a finance model can actually run. Presenting it to procurement as a coating loses on unit price every single time out. Presenting it to the asset manager as a yield improvement wins, because the comparison becomes lost generation revenue rather than a cheaper competing product on the shelf.
04 / APPLIED SERVICE MODEL

Coat the parts rather than sell the chemistry

The best-performing coatings need plasma deposition or controlled curing in equipment no customer buys for a trial, which caps addressable demand to whoever will change a production line for an entirely unproven product. Regional application centres remove that barrier completely: parts arrive uncoated and leave coated, with no capital decision and no process risk on the customer's side at all. Pricing follows a service model and switching costs rise sharply, because the process knowledge never leaves the supplier's own building.

Engagement Snapshot From the Field

A live engagement with an industry participant carrying material or product regulatory and market exposure ahead of a defining policy shift, showing how our research translates into a defensible multi-year portfolio strategy.
MARKET MINDS ADVISORY · CLIENT ENGAGEMENT SUMMARY
Hydrophobic Coatings Producer Strategic Portfolio Review and Transition Roadmap 2026·Investment Scenario on Hydrophobic Coatings Exposure Evaluation 2025-26
CLIENT PROFILE
A global outdoor apparel brand with annual revenue around USD 1.2 billion (client-reported, unverified by MMA), selling technical outerwear across North America, Europe and Japan. Durable water repellent finishes on shell fabrics were fluorinated across most of the range. California legislation had already removed the products from one of its largest markets and European restriction was approaching. No replacement had been qualified.
STRATEGIC CHALLENGE
Non-fluorinated finishes trialled by the client's mills failed durability testing at roughly a third of the specified wash cycles (client-reported, unverified by MMA), and warranty exposure on a technical outerwear brand made that unacceptable. Product teams wanted to reduce performance claims rather than delay launches. The board needed to know whether that was the only realistic option available.
MMA APPROACH
MMA benchmarked available non-fluorinated repellent chemistries against the client's actual performance specification rather than against supplier datasheets, using the expert interview programme to establish what competing brands had accepted. Mill application practice was reviewed, since cure conditions affect durability as much as chemistry does. Competitor claim language across the client's categories was analysed for how far the market had already moved.
KEY FINDINGS
  1. Roughly half the durability shortfall came from mill cure conditions rather than from the chemistry, which meant the trials had been testing application practice as much as formulation.
  2. Two competing brands had already reduced published wash durability claims without any measurable effect on sales, which suggested the specification was tighter than the market required.
  3. One silicone dendrimer chemistry met the revised specification when applied under corrected cure conditions, and only one of the client's four mills could achieve those conditions reliably.
  4. Oil repellency loss affected only two product categories in the range, neither of which carried claims about it, which removed an objection the product teams had assumed was decisive.
CLIENT PROFILE
A global outdoor apparel brand with annual revenue around USD 1.2 billion (client-reported, unverified by MMA), selling technical outerwear across North America, Europe and Japan. Durable water repellent finishes on shell fabrics were fluorinated across most of the range. California legislation had already removed the products from one of its largest markets and European restriction was approaching. No replacement had been qualified.
STRATEGIC CHALLENGE
Non-fluorinated finishes trialled by the client's mills failed durability testing at roughly a third of the specified wash cycles (client-reported, unverified by MMA), and warranty exposure on a technical outerwear brand made that unacceptable. Product teams wanted to reduce performance claims rather than delay launches. The board needed to know whether that was the only realistic option available.
MMA APPROACH
MMA benchmarked available non-fluorinated repellent chemistries against the client's actual performance specification rather than against supplier datasheets, using the expert interview programme to establish what competing brands had accepted. Mill application practice was reviewed, since cure conditions affect durability as much as chemistry does. Competitor claim language across the client's categories was analysed for how far the market had already moved.
KEY FINDINGS
  1. Roughly half the durability shortfall came from mill cure conditions rather than from the chemistry, which meant the trials had been testing application practice as much as formulation.
  2. Two competing brands had already reduced published wash durability claims without any measurable effect on sales, which suggested the specification was tighter than the market required.
  3. One silicone dendrimer chemistry met the revised specification when applied under corrected cure conditions, and only one of the client's four mills could achieve those conditions reliably.
  4. Oil repellency loss affected only two product categories in the range, neither of which carried claims about it, which removed an objection the product teams had assumed was decisive.
RECOMMENDED STRATEGY
Phase 1: Phase one: correct cure conditions at the three underperforming mills before condemning any chemistry, since that alone recovered half the durability shortfall. Phase 2: Phase two: revise published durability claims to a level the market has already accepted, rather than defending a specification no competitor now matches. Phase 3: Phase three: qualify the selected chemistry across the full range on a two-year timetable rather than converting category by category as legislation arrives.
OUTCOME
Cure conditions were corrected at all three mills and the selected chemistry now meets the revised specification across most of the range. Conversion is running to the two-year plan. The client reported avoided reformulation and relaunch cost of roughly USD 8.6 million (client-reported, unverified by MMA) against the category-by-category approach.

Frequently Asked Questions

Foundational context covering the market sizes, CAGR, scope, country, region and competition that inform every finding below. This section is provided to cover basics and most often pre-purchase conversations, answered from the MMA Primary Research Dataset.

What is the current size of the Hydrophobic Coatings Market?

The market was valued at USD 2.1 billion in 2025, rising to an estimated USD 2.27 billion in 2026. East Asia holds the largest regional share at 28% of value.

How large will the Hydrophobic Coatings Market be by 2036?

MMA forecasts USD 5.0 billion by 2036 under the base case, an expansion multiple of 2.20 times the 2026 value. That represents USD 2.73 billion of incremental value.

What is the CAGR for the Hydrophobic Coatings Market 2026 to 2036?

The base case runs at 8.2% compound annual growth between 2026 and 2036, with a bull case at 9.5% and a bear case at 7.0%. Historical growth from 2020 to 2025 was 7.0%.

Which segment is growing fastest?

Nanoparticle sol-gel coatings lead at 12.3%, half again the market rate, because they achieve superhydrophobic performance without fluorine. Non-fluorinated polymer and wax coatings follow at 11.0%.

Who are the major companies in the Hydrophobic Coatings Market?

PPG Industries, AkzoNobel, 3M, Evonik Industries and Wacker Chemie hold 32% between them. Non-fluorinated development depth rather than manufacturing scale sustains those positions across the market.

Which country is growing fastest?

India leads at 11.1%, driven by solar capacity in dust conditions and by textile manufacture serving export markets whose regulations forbid fluorinated repellents entirely. Both effects compound.

Report Segmentation Architecture

The full report scope spans multiple orthogonal segmentation dimensions, with cross-tabulated demand data provided for each dimension pair. Coverage extends further to regional breakdowns, trend trajectories, and the competitive detail needed to support segment-level decision-making.

By Coating Chemistry

  • Fluoropolymer Coatings
  • Silane and Siloxane Coatings
  • Silicone-Based Coatings
  • Nanoparticle Sol-Gel Coatings
  • Non-Fluorinated Polymer and Wax Coatings
  • Hybrid Organic-Inorganic Coatings

By End-Use Industry

  • Construction and Infrastructure
  • Electronics and Devices
  • Automotive and Transportation
  • Textiles and Apparel
  • Solar and Renewable Energy
  • Medical and Laboratory

By Application Method

  • Spray and Dip Application
  • Plasma Deposition Service
  • Roll and Pad Coating
  • Brush and Manual Application
  • Coating Service Centre Supply

By Region

  • North America
  • Western Europe
  • East Asia
  • South Asia and Pacific
  • Latin America
  • Middle East and Africa
  • Eastern Europe

Scope, Methodology, and Coverage

Every figure in this report is reproducible from documented input assumptions. The scope below maps the historical period, the forecast horizon, the segmentation dimensions, and the countries covered, alongside the underlying primary and qualitative methodology.
Historical Period
2020 to 2025
Forecast Period
2026 to 2036
Base Year
2025 (USD billions; MMA Primary Research Dataset, August 2026)
Market Definition
The market comprises coatings and surface treatments applied to confer water repellency on a substrate, covering fluoropolymer, silane and siloxane, silicone, nanoparticle sol-gel, non-fluorinated polymer and wax, and hybrid organic-inorganic chemistries. Value is measured at formulation supplier level across construction, electronics, automotive, textile, solar and medical applications, including coating applied as a service. Bulk hydrophobic additives compounded into materials, anti-fouling marine paints, general architectural paint, oleophobic-only treatments, textile finishing equipment and the coated substrates themselves fall outside scope.
Quantitative Units
USD billions (current prices); thousand tonnes of formulation supplied annually; USD per square metre of coated surface by chemistry
Segmentation Dimensions
By Coating Chemistry; By End-Use Industry; By Application Method; By Region
Regions Covered
North America, Western Europe, East Asia, South Asia and Pacific, Latin America, Middle East and Africa, Eastern Europe
Countries Covered
China, Japan, South Korea, Taiwan, Vietnam, India, Thailand, Malaysia, Australia, United States, Canada, Mexico, Germany, Switzerland, France, United Kingdom, Italy, Spain, Netherlands, Sweden, Poland, Czechia, Romania, Hungary, Brazil, Chile, Saudi Arabia, United Arab Emirates, Morocco, South Africa
Key Companies Profiled
PPG Industries, AkzoNobel, 3M, Evonik Industries, Wacker Chemie, BASF, Dow, Shin-Etsu Chemical, Momentive Performance Materials, Elkem, Sika, Mapei, Sto SE, Nippon Paint Holdings, Kansai Paint, Jotun, P2i, HZO, Aculon, NEI Corporation
Quantitative Methodology
Primary survey, n=3,800 respondents, Q4 2025, six countries; demand-side model with trade association cross-validation
Qualitative Methodology
47 expert interviews, Q4 2025; applied to validate demand model assumptions, identify emerging dynamics, and assess competitive positioning
Report Format
PDF and XLSX data workbook (Word format preview document)
Publisher
Market Minds Advisory
Report Code
MMA-2026-CHM-536
Published
August 2026
Contact
sales@marketmindsadvisory.com | www.marketmindsadvisory.com

Purchase the full Hydrophobic Coatings Market Report (2026 to 2036).

The full report sizes the global hydrophobic coatings market to 2036 across six coating chemistries and seven regions, measured at formulation supplier level across industrial and consumer applications. It maps the European PFAS restriction proposal and American state legislation against remaining fluorinated volume, and quantifies the abrasion durability gap that keeps conversion from completing. Competitive analysis covers 20 participants evaluated on formulation supply, with moat and risk assessment for the two leaders. Input cost exposure runs from siloxane and nanoparticle silica supply through to validation-locked reformulation constraints. Four quantified revenue levers close the analysis.
Six-chemistry segment sizing with segment-level growth rates
Seven-region share and growth breakdown to 2036
Twenty-participant competitive map on one supply basis
PFAS exposure mapped across remaining fluorinated coating volume
Input cost exposure traced to siloxane and silica
Four quantified revenue levers with commercial impact ranges

Built For The People Who Decide

From boardroom strategy to bench-side execution, this report is read cover-to-cover by leaders shaping the next decade of their industry, turning demand scenarios, market dynamics and valuation benchmarks into decisions.
CXOs/ Presidents/ VPs/ Managers
M&A and Corporate Development
Strategy Teams and R&D Heads
Procurement and Product Directors
Regulatory and Compliance Leaders
Investor Relations and Equity Analysts