Market Minds Advisory
Hydrodesulfurization Catalyst Market

Hydrodesulfurization Catalyst Market: cycle length economics, metals exposure and renewable feedstock qualification

Refiners buy hydrotreating catalyst once every three years and lose more money in a single unplanned change-out than the catalyst charge cost, which is why cycle length decides these contracts rather than price.

Lead Analyst

Bilal Shaikh

Published

September 2026

Make Smarter Decisions with Customized Research Insights

Request a free sample report and evaluate market opportunities, growth trends, and competitive dynamics relevant to your business needs.

2025 MARKET VALUE$2.7BMarket Size 2025
2036 FORECAST VALUE$4.5BBase Case , 2026 to 2036
CAGR 2026 TO 20364.8 %Bull 6.0% / Bear 3.5%
INCREMENTAL OPPORTUNITY$1.7BNet 10- year value creation
EXPANSION MULTIPLE1.60x2036 value over 2026 base
Strategic Levers
M&A Pipeline
Regional Outlook
Country Rankings
Competitive Intelligence
Segmental Deep-dive
Call-Us : 91 93563 13602

Executive Snapshot and Market Trajectory

Nobody buys hydrotreating catalyst on price, whatever the procurement paperwork says about it. A refiner loses more margin in a week of unplanned downtime than the whole catalyst charge cost, so the contract is really about how long the bed runs before the unit comes down again.
Growth concentrates in renewable and co-processed feedstock hydrotreating, expanding at 7.2%, where used cooking oil, tallow and vegetable oils carry contaminants that poison conventional beds and demand purpose-designed catalyst systems instead. East Asia holds 32% of value, the largest regional share, because Chinese refining capacity has overtaken every other single country and because Japanese and Korean refiners both run deep desulphurisation duty on imported sour crude at a scale nobody else matches.
The supplier base is tightly concentrated, with the top five holding 71% of catalyst supply volume, and it divides between integrated licensor-catalyst houses and independent formulators competing on performance alone. Competition runs on demonstrated commercial cycle length rather than on activity measured in a laboratory pilot reactor. Renewable feedstock qualification is the technical shift now reordering positions in what had been a settled industry for decades.
Market Definition
Hydrodesulfurization catalyst comprises supported cobalt-molybdenum, nickel-molybdenum and nickel-tungsten formulations charged into refinery hydrotreating reactors to remove sulphur, nitrogen and metals from hydrocarbon feed streams. Sizing covers fresh catalyst and regenerated catalyst supplied to refiners at realised delivered price. Hydrocracking, catalytic reforming, fluid catalytic cracking and isomerisation catalysts, sulphur recovery units, guard bed inert materials, reactor internals, and process licensing fees all fall outside scope.
Base Year Value
$2.7B in 2025 (MMA Primary Research Dataset, August 2026)
Forecast Period
2026 to 2036, eleven discrete annual values
CAGR
4.8% base case. Bull 6.0%. Bear 3.5%.
Fastest Growth Segment
Renewable and Co-Processed Feedstock Hydrotreating: 7.2% CAGR
Fastest Growth Country
India: 7.6% CAGR
Fastest Growth Region
South Asia and Pacific: 7.1% CAGR
Largest Region
East Asia: 32% of 2025 global value
Market Leaders
Albemarle, Criterion Catalysts and Technologies, Advanced Refining Technologies, Axens and Topsoe lead on catalyst supply volume into refinery hydrotreating service. Source: MMA Primary Research Dataset, July 2026.
Primary Survey
n=3,800 procurement and R&D decision-makers, Q4 2025, six countries
Methodology
Demand-side build-up, cross-validated against public data, 47 expert interviews

Hydrodesulfurization Catalyst Market Forecast Scenarios

hydrodesulfurization-catalyst-market-trend-size-forecast-scenario-1787310658273
Growth of 4.0% across 2020 to 2025 hid two opposing forces working against each other. Refinery runs collapsed through 2020 and change-outs were deferred wherever a bed could be stretched, then demand caught up sharply from 2022 as postponed cycles came due together. Marine fuel sulphur limits introduced in 2020 raised distillate hydrotreating severity permanently, which lifted catalyst consumption per barrel across most of the fleet.
The base case at 4.8% rests on three mechanisms. Renewable diesel and sustainable aviation fuel capacity keeps expanding, and each of those units needs pretreatment and hydrotreating catalyst designed for contaminated biogenic feed. Crude slates continue getting heavier and more sour as light sweet production plateaus, which raises required catalyst activity across existing units. And Asian and Middle Eastern refining capacity keeps commissioning while European capacity closes, shifting rather than reducing demand.
The bull case at 6.0% turns on renewable fuel mandates accelerating faster than currently modelled, since biogenic feedstock shortens cycles considerably and lifts replacement frequency above conventional service. The bear case at 3.5% turns on refinery rationalisation. Faster closure of European, Japanese and Australian capacity would remove installed reactor volume permanently, and new Asian units run longer cycles on better hydrogen availability.

Hydrotreating catalysts: cycle length against metals cost

The commercial logic here is unusual and most suppliers still sell against it rather than with it. A distillate hydrotreater charge might cost a few million dollars and run for 36 months, while the unit it sits in generates that much margin in a fortnight. One extra month of cycle length is therefore worth considerably more to the refiner than the entire catalyst purchase, and yet almost nobody sells it that way.
TOP FIVE CONCENTRATION71%Share of global catalyst supply volume held collectively
ACTIVE METALS COST SHARE38% of COGSPortion of delivered cost tied to active metals
TYPICAL CYCLE LENGTH36 monthsInterval between catalyst change-outs in conventional distillate service
REGENERATED CATALYST SHARE34% of volumePortion of demand served by regenerated rather than fresh
ROAD FUEL SULPHUR LIMIT10 ppmSpecification driving deep desulphurisation severity across most fleets
RENEWABLE CO-PROCESSING UNITS210 unitsRefineries processing biogenic feedstock through existing hydrotreating assets
Cost structure pulls in a different direction. Active metals, principally molybdenum with nickel and cobalt, account for roughly 38% of delivered cost, and molybdenum has moved violently enough in single quarters to erase a supplier's whole annual margin on contracted volume. Alumina support, impregnation and calcination make up most of the remainder, and none of it scales down the way buyers generally assume it must.
Demand divides by feed severity rather than by refinery size, which surprises people who expect scale to govern. Naphtha and kerosene service is undemanding and increasingly served by regenerated catalyst, which now covers 34% of volume. Residue and renewable feedstock duty is where activity, contaminant tolerance and cycle length genuinely separate suppliers, and where realised pricing reflects that separation properly.
"Every catalyst supplier presents pilot plant activity data, and every refiner nods politely and then buys on the last cycle they actually observed. The winners in this industry are not the best formulators; they are the ones with the longest verified run histories in units that look like the customer's."
Director, Refining and Petrochemical Catalysts Practice · MMA Chemicals and Mate

Market Trends

Renewable feedstock pretreatment reshaping catalyst system design requirements

Used cooking oil, tallow, distillers corn oil and vegetable feedstocks carry phosphorus, alkali metals, chlorides and polymer species that conventional hydrotreating beds were never designed to tolerate. Roughly 210 refineries now process biogenic feed through existing assets, and cycle lengths in those units run considerably shorter than conventional distillate service because contaminants deposit rather than convert. Suppliers offering graded guard bed systems alongside the main catalyst charge capture the whole loading rather than a portion of it. The design work is genuinely different from conventional hydrotreating, which is why qualification positions are being established now.
Market Impact: Meets 10 ppm sulphur specification

Regenerated catalyst displacing fresh charges in undemanding service

Ex-situ regeneration and rejuvenation now recover a large proportion of original activity at roughly half the cost of a fresh charge, and refiners have grown considerably more comfortable using it in naphtha, kerosene and mild distillate duty. Regenerated material accounts for around 34% of catalyst volume charged globally, a share that has climbed steadily as regenerators have improved and as procurement departments have looked harder at working capital. Fresh catalyst suppliers who also own regeneration capacity capture that value rather than losing it. Those without it watch a third of the market move beyond reach.
Market Impact: Adds 7.2% annual segment growth

Market Opportunities and Growth Drivers

Heavier and sourer crude slates raising required catalyst activity

Light sweet crude production has plateaued while medium and heavy sour grades from the Gulf, Latin America and Canada make up a growing share of refinery intake, and every increment of sulphur and nitrogen in the feed raises the activity a hydrotreater must deliver to hit the same product specification. Refiners meeting a 10 ppm road fuel limit on a heavier slate must either raise reactor severity, which shortens cycles, or buy more active catalyst. Most choose the more active catalyst, because reactor severity costs hydrogen and hydrogen is rarely sitting spare in a refinery.
Market Impact: Exposes 38% of delivered cost

Renewable diesel and aviation fuel capacity commissioning worldwide

Renewable diesel and sustainable aviation fuel projects continue commissioning across North America, Europe and Asia, and every one of them requires hydrotreating catalyst designed for biogenic feed rather than for petroleum streams. Contaminant loading in used cooking oil and tallow shortens cycles well below conventional distillate service, which raises replacement frequency and therefore annual catalyst consumption per unit of installed capacity. Around 210 refineries worldwide already co-process biogenic feed through their existing assets, and newly built dedicated renewable units add further catalyst volume on top of that installed base every year.
Market Impact: Removes 2 million barrels daily cap

Market Restraints and Challenges

Molybdenum price volatility eroding contracted catalyst supply margins

Active metals account for roughly 38% of delivered catalyst cost, and molybdenum has moved by more than half in a single quarter on several occasions. The root cause is supply structure: most molybdenum arrives as a by-product of copper mining, so output responds to copper economics rather than to catalyst demand, and no producer adjusts volume when catalyst buyers need more. Commercially this destroys margin on multi-year contracts priced before a move. Suppliers are responding with metals pass-through clauses, forward purchasing against contracted charges, and reclamation programmes recovering metal from spent catalyst.
Market Impact: Covers 210 co-processing refinery u

Refinery closures removing installed reactor volume permanently across regions

European, Japanese and Australian refinery closures remove hydrotreating reactor volume that never returns, and each closure takes a recurring catalyst charge out of the market for good. The root cause is regional fuel demand decline combined with competition from newer, larger and better-configured Asian and Middle Eastern refineries built for export. Commercially this shifts demand geographically rather than eliminating it, but it strands supplier relationships built over decades in the closing regions. Participants are responding by following capacity additions eastward, building regional technical service capability, and pursuing renewable conversion projects at closing sites.
Market Impact: Serves 34% of charged catalyst volu
2 additional market trends, 3 additional growth drivers, and 4 additional restraints and challenges are covered in the full report. Contact sales@marketmindsadvisory.com to access the complete intelligence.

Segment CAGR and Growth Architecture

Segmentation follows the feed stream the catalyst treats, because the feed severity governs required activity, contaminant tolerance, cycle length and achievable pricing simultaneously. Six feed streams cover the whole market, running from relatively undemanding naphtha service through distillate and heavy oil duty to the renewable feedstock applications that are now growing fastest of all.
hydrodesulfurization-catalyst-market-trend-market-share-analysis-1787310659230

Renewable and Co-Processed Feedstock Hydrotreating

Expanding at 7.2%, a full 1.50 times the market rate, on catalyst systems treating used cooking oil, tallow, distillers corn oil and vegetable feedstocks that carry contaminants petroleum streams never contain. Phosphorus, alkali metals, chlorides and polymer species deposit on conventional beds rather than converting, which shortens cycles considerably and forces graded guard bed design ahead of the main catalyst charge itself. Roughly 210 refineries co-process biogenic feed through existing assets, with dedicated renewable diesel and aviation fuel units adding further volume each year. Qualification positions are being established right now, unit by unit, and they will hold for as long as those units keep processing biogenic feed at all.
CAGR 7.2%

Lube Base Oil and Specialty Hydrotreating

Growing at 5.9% on catalyst charged into lube base oil hydrotreating, hydrofinishing and specialty product service, where the requirement is colour, oxidation stability and saturate content rather than sulphur removal alone. Group II and Group III base oil capacity continues expanding as engine oil specifications tighten and as Group I capacity closes across Europe and Japan, and each new train commissioned carries a recurring catalyst charge behind it for as long as it operates. Severity is high and cycles are long, which suits suppliers holding genuine formulation depth rather than those competing purely on delivered price. Specialty white oil and food-grade hydrofinishing duty sits at the most demanding end of this particular stream.
CAGR 5.9%
Full segment breakdown across 6 segments available in the complete report.

Regional Architecture and Country Demand Map

Catalyst demand follows the installed hydrotreating reactor volume rather than regional fuel consumption, which is exactly why the geographic picture tracks where refineries have recently been built and where they are now closing permanently, rather than simply where the transport fuel happens to get burned.

East Asia

Thirty-two percent of global value, comfortably the largest regional share, because Chinese refining capacity has overtaken every other single country while Japanese and Korean refiners run deep desulphurisation duty on imported sour crude at a severity few others attempt. Note: this exceeds the standard regional band because installed hydrotreating reactor volume is genuinely concentrated here to a degree that no fuel consumption measure would capture. Chinese domestic catalyst producers hold most of their own home market, which sharply limits what international suppliers actually realise from all that installed capacity. Growth of 5.6% runs above the global rate, supported by continued Chinese commissioning even as Japanese and Korean capacity closes steadily.
Share: 32% | CAGR: 5.6% (2026 to 2036)

North America

Twenty-four percent of global value, weighted heavily toward Gulf Coast and Midwest refining that runs heavy sour crude at high severity, and toward much the largest concentration of renewable diesel capacity found anywhere in the world. Renewable fuel standards and state low carbon fuel programmes have together driven both conversions and new greenfield units that consume purpose-designed catalyst systems rather than the conventional charges used elsewhere. Technical service expectations here are the most demanding of any region anywhere, and suppliers with genuine local troubleshooting capability hold positions that pricing alone cannot dislodge. Growth of 4.2% reflects mature conventional refining alongside renewable capacity that keeps adding fresh reactor volume every year.
Share: 24% | CAGR: 4.2% (2026 to 2036)
Regional intelligence for 5 additional markets available in the complete report: Western Europe, South Asia and Pacific, Latin America, Middle East and Africa, Eastern Europe. Contact sales@marketmindsadvisory.com.
hydrodesulfurization-catalyst-market-trend-country-cagr-analysis-1787310660078

Where catalyst suppliers actually earn money

Four commercial positions separate the suppliers earning genuine formulation economics from those selling activity data against a delivered price per kilogram. Each one of them rests on something a competitor cannot assemble quickly: verified commercial run histories, renewable feedstock qualification, owned regeneration capability, or the metals value locked up inside every spent catalyst charge.

Contract against achieved cycle length not price

A refiner loses roughly USD 2.5 million in margin for every week a hydrotreater sits down unexpectedly, which dwarfs the entire catalyst charge cost several times over. Suppliers contracting against achieved cycle length, with the commercial terms tied to actual run duration rather than to kilograms delivered, realise roughly 30% above competitors quoting on price per kilogram. The evidence required is commercial run history the supplier already possesses and very rarely presents properly. Most suppliers sell pilot plant activity data instead, which refiners long ago learned to discount almost entirely.
Market Impact: Realises roughly 30% above price-qu

Qualify graded systems for renewable feedstock service

Roughly 210 refineries co-process biogenic feed through assets designed for petroleum streams, and contaminant deposition shortens cycles well below conventional service. Suppliers qualifying complete graded guard bed and main catalyst systems capture roughly 4 times the loading value of those supplying only the main bed, because the guard section is replaced more often and specified together. Qualification is being established right now across the fleet, unit by unit. Once a system is written into the reactor loading diagram it stays there for as long as that unit keeps running on biogenic feed.
Market Impact: Captures roughly 4 times the reacto

Own regeneration capacity alongside fresh catalyst supply

Regenerated material now covers around 34% of catalyst volume charged globally, and that share has climbed steadily as regeneration quality has improved and as procurement departments have looked harder at working capital. Suppliers owning regeneration capacity themselves capture roughly 55% of the value they would otherwise lose entirely to independent regenerators. The capital involved is genuinely modest measured against a catalyst manufacturing line. Selling only fresh charges means watching a third of the addressable market move permanently beyond reach, which is a strange commercial position for any formulator to accept.
Market Impact: Recovers roughly 55% of otherwise f

Capture metals reclamation value from spent charges

Spent hydrotreating catalyst carries recoverable molybdenum, nickel, cobalt and vanadium worth somewhere around USD 9,000 per tonne at typical metal prices, and most refiners still treat the disposal as a cost rather than as any kind of recovery opportunity. Suppliers offering reclamation as part of the change-out package capture that value directly while removing a waste handling problem the customer genuinely dislikes. It also hedges the supplier's own metals exposure, since reclaimed metal units feed straight back into fresh catalyst manufacture rather than being purchased again on the open market.
Market Impact: Recovers roughly USD 9,000 per spen

Who Controls the Margin Pool

Concentration is high, with the top five holding 71% of catalyst supply volume, the basis on which every participant here is assessed. Albemarle and Criterion lead through formulation depth combined with installed run histories accumulated across decades of refinery service, while the challenger group divides between licensor-affiliated houses such as Axens and Topsoe and independent formulators competing on demonstrated performance without a process licence attached.
Competition currently runs on verified cycle length, technical service reach and contaminant tolerance rather than on laboratory activity or delivered price. Refiners buy from suppliers whose catalyst they have watched run in units resembling their own, which makes reference positions extraordinarily durable. Regeneration capability has become a genuine competitive dimension rather than an afterthought handed to independents.

Emerging pressure comes from two directions at once. Chinese domestic producers hold most of their own market and are beginning to compete on export projects, which affects the fastest-growing installed base anywhere. And renewable feedstock qualification is reordering positions that conventional hydrotreating had settled long ago, favouring suppliers who moved early on contaminant tolerance rather than those with the longest petroleum run histories.
hydrodesulfurization-catalyst-market-trend-company-positioning-matrix-1787310660979

Competitive Moat and Risk Dimensions

ALBEMARLE

Moat: Formulation depth and run histories

Decades of accumulated commercial run data across thousands of hydrotreater charges give Albemarle reference positions that no laboratory result can substitute for. Refiners select catalyst by watching what performed in units resembling their own, and that evidence base compounds over time in a way that a newer competitor cannot simply purchase or replicate quickly.
ALBEMARLE

Risk: Molybdenum cost pass-through exposure

Active metals represent roughly 38% of delivered catalyst cost, and Albemarle's contracted supply arrangements carry timing exposure whenever molybdenum moves sharply between pricing and delivery. Copper by-product supply economics mean the metal responds to conditions entirely unrelated to catalyst demand, so the exposure cannot be managed through commercial negotiation with customers alone.
CRITERION CATALYSTS AND TECHNOLOGIES

Moat: Refinery integration and technical service

Criterion's position inside a major refining organisation gives it operational feedback from commercial units and technical service depth that independent formulators struggle to match. Troubleshooting a unit that is underperforming mid-cycle is where catalyst relationships are genuinely won, and having refinery operators rather than only chemists on the ground matters considerably.
CRITERION CATALYSTS AND TECHNOLOGIES

Risk: Slower renewable feedstock positioning

Criterion's strength rests on conventional petroleum hydrotreating, where its run histories are deepest, while renewable feedstock service demands contaminant tolerance and guard bed design that the petroleum record does not directly demonstrate. Suppliers who moved early on biogenic qualification are establishing positions in exactly the segment growing fastest, and those positions will hold for unit lifetimes.

Players Tracked

Prominent Players

Albemarle
Criterion Catalysts and Technologies
Advanced Refining Technologies
Axens
Topsoe

Other Key Players

Honeywell UOP
Sinopec Catalyst Company
JGC Catalysts and Chemicals
Nippon Ketjen
Clariant
BASF
Johnson Matthey
Evonik Industries
Eurecat
Porocel Industries
Unicat Catalyst Technologies
CNPC Catalyst Company
Sud-Chemie India
Zeolyst International
Chevron Lummus Global

Recent Developments

JANUARY 2025

Catalyst supplier qualifies graded system for renewable feedstock

A refining catalyst supplier completed full commercial qualification of a graded guard bed and hydrotreating catalyst system for used cooking oil and tallow feedstock service, demonstrating measured contaminant tolerance for phosphorus, alkali metals and chlorides across a full commercial cycle in an operating refinery unit.
Signal: Renewable qualification positions are bein
MAY 2025

Molybdenum price movement triggers contract renegotiation across suppliers

A sharp molybdenum price movement prompted several refining catalyst suppliers to renegotiate the metals pass-through terms written into their multi-year refinery supply contracts, after realised margins on charges priced before the move proved wholly insufficient to cover the active metal content those formulations actually required.
Signal: Metals pass-through terms are now becoming
SEPTEMBER 2025

European refiner awards catalyst supply on cycle terms

A European refiner awarded its hydrotreating catalyst supply on contract terms tied directly to achieved cycle length and unplanned shutdown avoidance rather than to delivered price per kilogram, following detailed internal analysis of the refining margin lost to catalyst-related outages right across its whole refining system.
Signal: Cycle length contracting is now beginning

Active metals and alumina cost exposure

Active metals account for roughly 38% of delivered catalyst cost, principally molybdenum with nickel and cobalt, sourced through copper by-product streams and nickel refiners concentrated in Chile, Peru, China and Russia. Alumina support contributes about 19%, impregnation and calcination energy around 13%, shaping and extrusion 9%, quality testing and pilot validation 8%, with packaging, freight and working capital carrying the remaining 13%.
Molybdenum moved violently through the forecast history. Prices roughly doubled across late 2022 and early 2023 on Chinese restocking against constrained copper by-product supply, and catalyst suppliers holding contracted charges priced before the move absorbed the difference for several quarters. Albemarle Annual Report 2023 recorded raw material cost pressure across its catalyst business directly, and Topsoe Annual Report 2023 noted metals cost recovery lagging contractual pricing across refinery supply agreements.

The competitive disadvantage mechanism runs through metals procurement scale rather than through formulation capability. Small formulators buying molybdenum in modest quantities pay materially more per unit than suppliers contracting annual requirements forward. Those without reclamation programmes buy every kilogram openly rather than recovering it from spent charges. Regional producers serving a single refining market carry both disadvantages at once, which confines them to undemanding naphtha and kerosene duty.
hydrodesulfurization-catalyst-market-trend-cost-volatility-analysis-1787310661294

Write metals pass-through terms into multi-year supply contracts

Catalyst charges are priced years before delivery while molybdenum can move by half in a quarter, and absorbing that gap has cost suppliers more than any formulation investment ever returned. Indexed pass-through clauses tied to a published metals reference remove the exposure entirely, and refiners accept them readily once the arithmetic is presented properly.

Recover active metals from spent catalyst charges

Spent hydrotreating catalyst carries recoverable molybdenum, nickel, cobalt and vanadium worth around USD 9,000 per tonne, and most of it currently goes to third-party reclaimers or to disposal. Building reclamation into the change-out offer feeds recovered metal straight back into manufacture, which hedges input cost exposure and removes a genuine customer problem at the same time.

Contract alumina support supply on multi-year terms

Alumina support represents roughly a fifth of delivered cost and comes from a narrow supplier base with limited spare capacity for catalyst-grade material. Spot purchasing exposes formulators to both price and availability risk at precisely the moments demand peaks, whereas multi-year contracting costs very little and secures the physical base of every formulation made.

Portfolio Architecture for Margin Defence

Margin architecture separates by feed severity and contaminant tolerance rather than by catalyst chemistry, which is not at all what most suppliers' product management organisations assume. Naphtha and kerosene service earns whatever regenerated material and regional formulators between them allow, because the activity requirement is loose enough that a great many products satisfy it perfectly well.
Value climbs steeply wherever the feed is difficult and the consequence of a short cycle is severe for the operator. Distillate and vacuum gas oil duty at a 10 ppm product specification defends pricing through demonstrated activity retention across the cycle. Residue desulphurisation sits higher again, since metals deposition and cycle management in that service require formulation depth that remarkably few suppliers genuinely possess.

The highest value pools now concentrate in renewable feedstock service, where contaminant tolerance, graded bed design and short qualification history combine to limit the field of credible suppliers sharply. Those pools are small measured in tonnage and quite disproportionate in realised margin. The commercial tension is that undemanding naphtha volume keeps manufacturing lines loaded while contributing almost nothing toward the qualification work that actually opens anything above it.

Volume / Commodity-Adjacent Tier

Naphtha and kerosene hydrotreating catalyst supplied against loose activity specifications, increasingly served by regenerated material, where many regional formulators satisfy the requirement and delivered price decides the outcome almost every time.
Gross Margin: 18-26%

Premium / Certified Tier

Distillate and vacuum gas oil hydrotreating catalyst meeting 10 ppm product specification at demanding severity. Demonstrated activity retention and run history defend pricing here. The ten-point range reflects catalogue grades against qualified unit positions.
Gross Margin: 30-40%

Sustainability / Regulatory / Next-Generation Tier

Renewable feedstock and residue desulphurisation systems with graded guard beds and contaminant tolerance built in. Qualification barriers and scarce alternatives defend pricing strongly. The fourteen-point range reflects established residue against emerging renewable qualification economics.
Gross Margin: 44-58%
hydrodesulfurization-catalyst-market-trend-portfolio-architecture-1787310662204

High-value Sub-segments and Strategic Watch-out

Renewable feedstock graded catalyst systems

High value and high growth together here, because contaminant tolerance, graded guard bed design and commercial run history all combine to limit the credible field very sharply indeed, and qualification positions established now will hold for whole unit lifetimes afterwards, whatever competitors happen to do later.
Gross Margin: 44-58%

Residue desulphurisation and heavy oil duty

Strong realised value on rather steadier growth, because metals deposition and cycle management in residue service both demand formulation depth that remarkably few suppliers anywhere genuinely possess today, and the consequence of a short cycle is genuinely severe for the refiner that has to run it.
Gross Margin: 40-52%

Naphtha and kerosene hydrotreating volume

The volume core of this market, keeping manufacturing lines loaded while earning whatever regenerated material and regional formulators permit against loose activity specifications that a great many products already satisfy perfectly well. Necessary for basic operating scale, but this tier funds nothing whatsoever above itself.
Gross Margin: 18-26%

Molybdenum exposure across the catalyst portfolio

The strategic watch-out for this market, given that the active metals carry fully 38% of delivered catalyst cost and that molybdenum itself responds to copper mining economics rather than to catalyst demand at all, and moving by half within a single quarter on several separate occasions already.
Gross Margin: 14-44%

How catalyst demand actually behaves

Demand is episodic and specification-locked, which is an awkward combination commercially. A refiner buys a charge once every 24 to 48 months depending on service, so revenue arrives in lumps bearing no relation to how continuously the unit operates. Between change-outs the supplier earns nothing at all from that reactor, which makes the loading diagram position worth defending far more aggressively than a transaction suggests.
Stickiness varies enormously with feed severity. Naphtha and kerosene duty is loosest, increasingly served by regenerated material bought on price with substitution requiring no more than a purchase order. Distillate and vacuum gas oil service sits tighter, because a supplier with observed run history in a similar unit carries evidence newcomers cannot produce. Renewable and residue duty is stickiest of all, since nobody experiments with a reactor that is difficult to restart.

The buyer profile splits between refining organisations in ways that defeat any single commercial model. Large integrated refiners run central catalyst selection with technical committees evaluating data across multiple sites. Independent and national refiners decide unit by unit, often with the process engineer who will live with the consequence holding most of the influence, which rewards suppliers whose technical people are actually present.
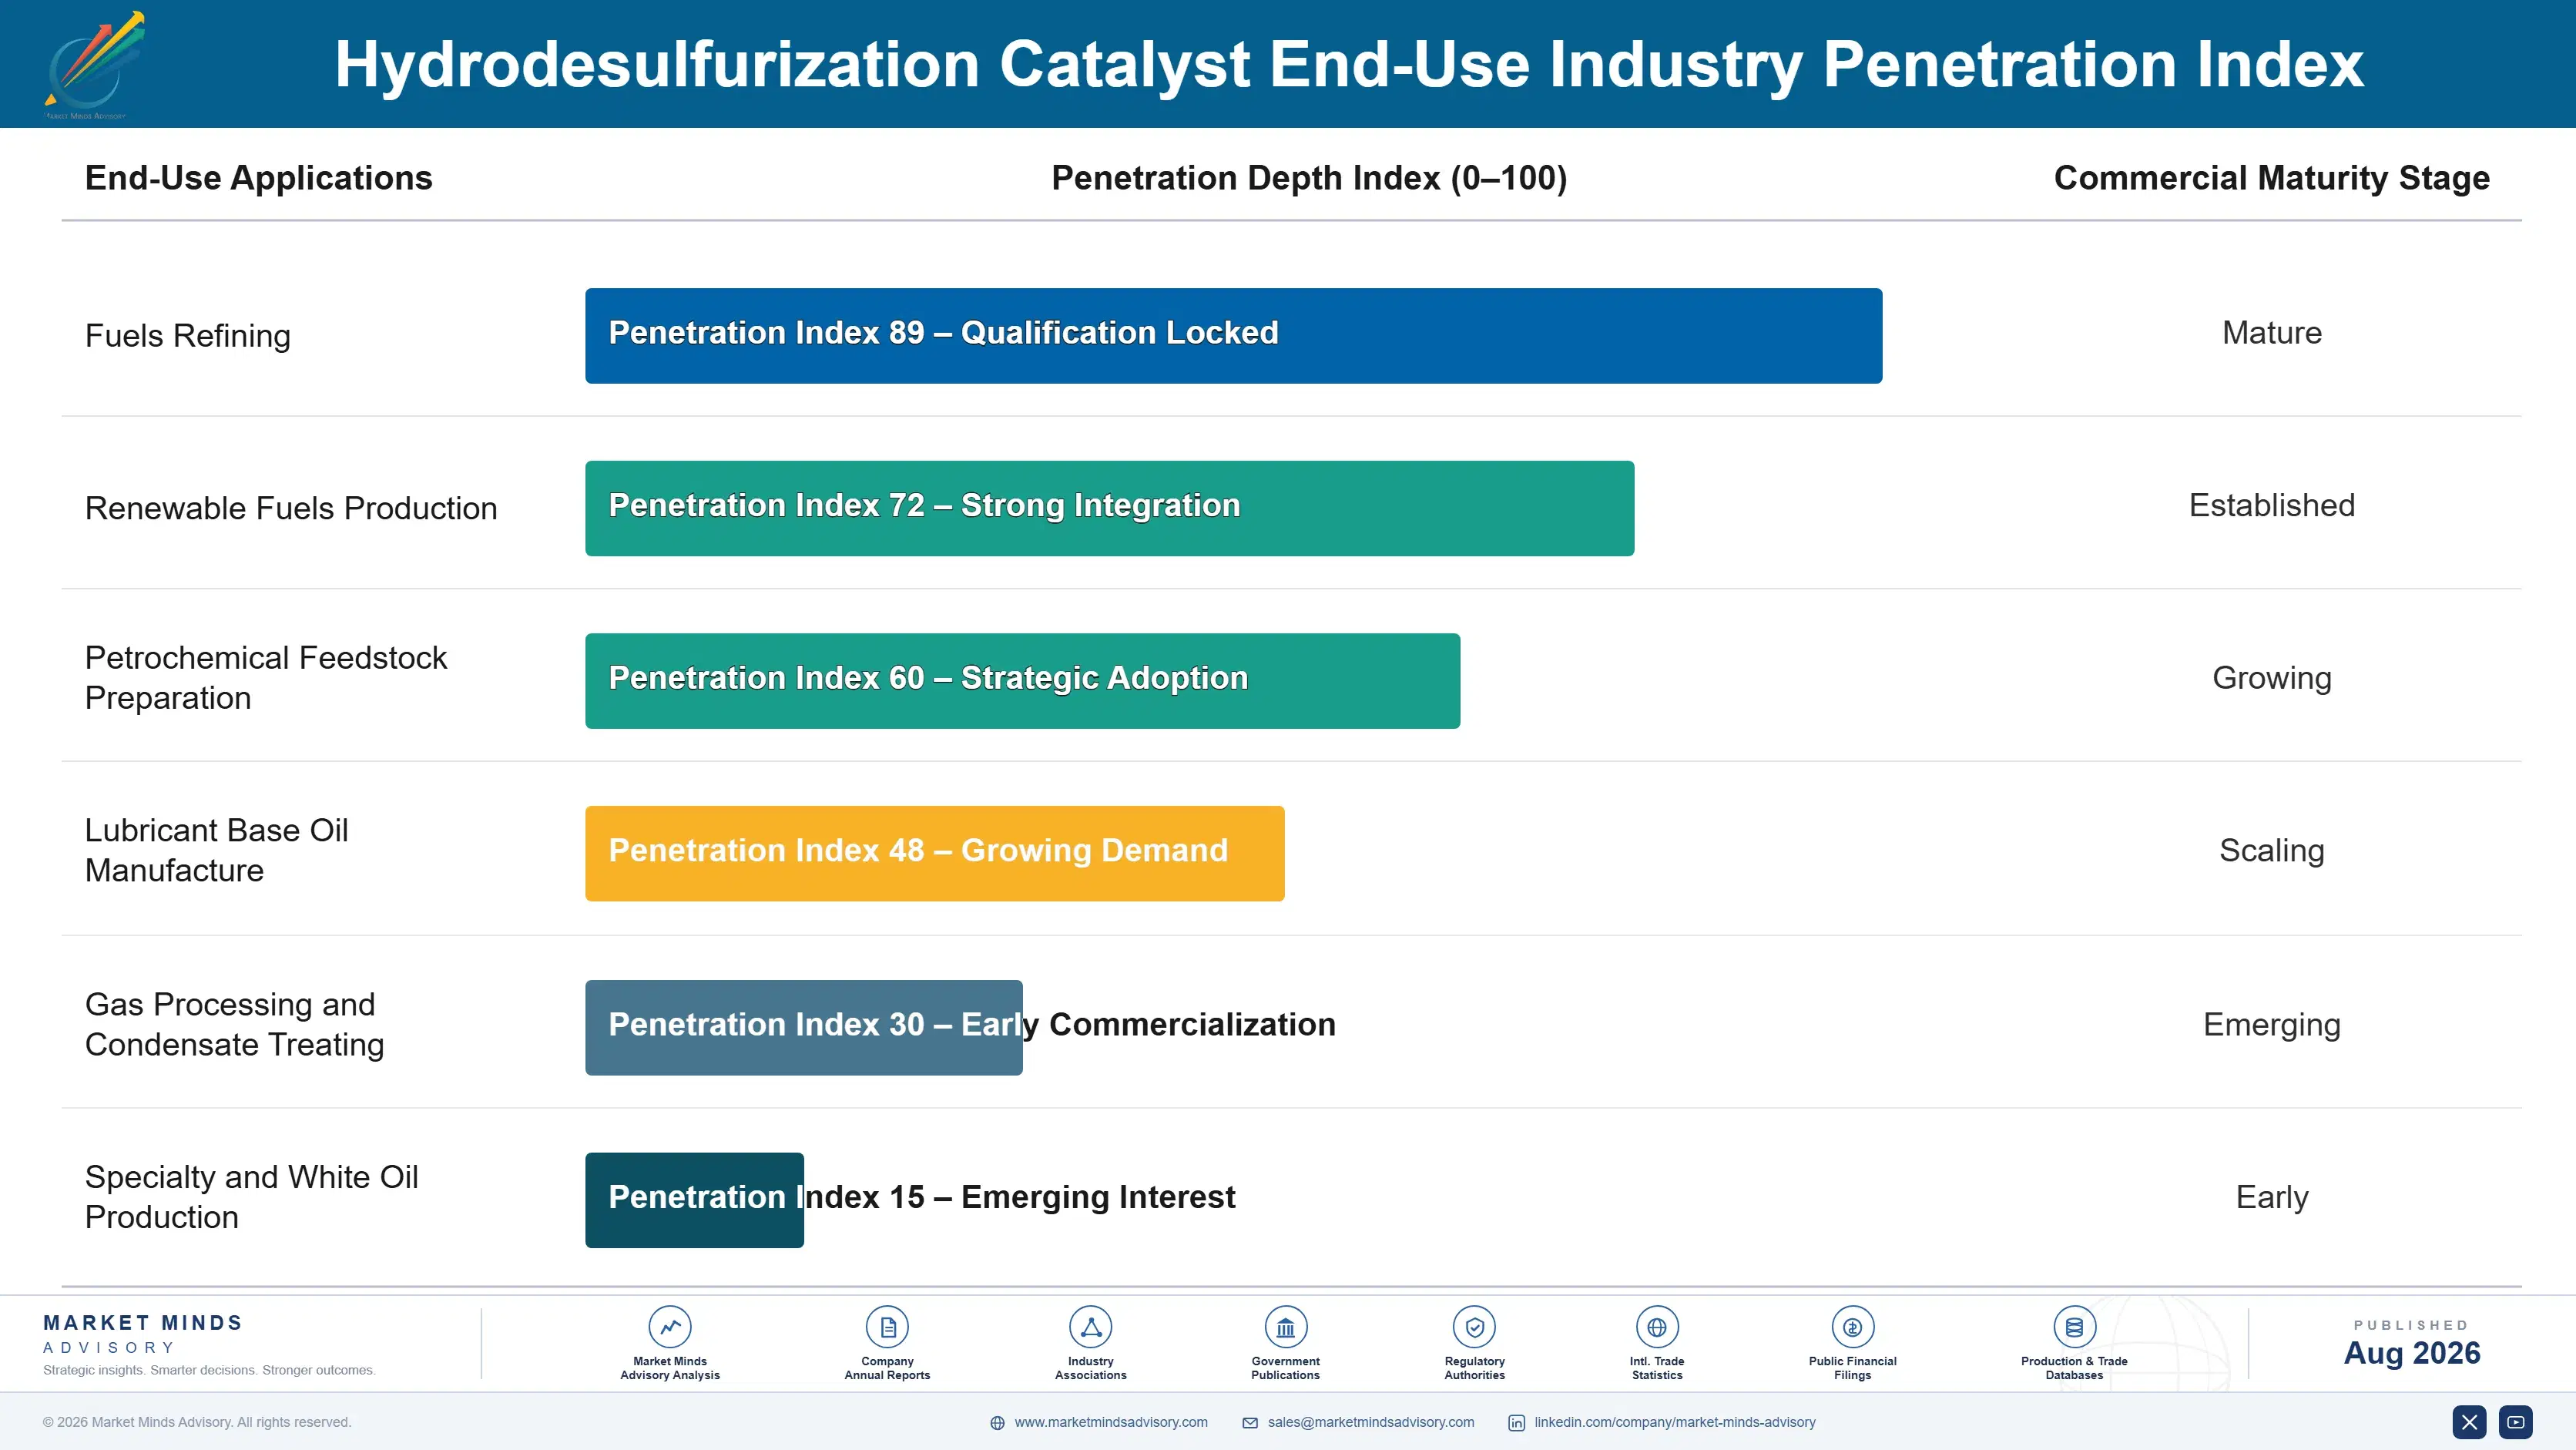
hydrodesulfurization-catalyst-market-trend-end-use-penetration-index-1787310663066

What we would actually do here

These are among the four positions where our research anticipates prominent divergence between winners and laggards over the coming forecast period. Each is grounded in the demand model, the regulatory perimeter, and the announced capacity pipeline.
01 / CYCLE LENGTH CONTRACTING

Sell run duration, not activity from a pilot plant

A refiner loses roughly USD 2.5 million in margin for every week a hydrotreater sits down unexpectedly, which dwarfs the whole catalyst charge cost several times over. Suppliers contracting against achieved cycle length rather than kilograms delivered realise roughly 30% above competitors quoting price per kilogram. The evidence needed is commercial run history the supplier already holds and rarely presents properly, while most suppliers still lead with the pilot plant activity data that refiners long ago learned to discount almost entirely.
02 / RENEWABLE FEEDSTOCK QUALIFICATION

Qualify graded systems while the positions remain open

Roughly 210 refineries co-process biogenic feed through assets designed for petroleum streams, and contaminant deposition shortens cycles well below conventional service. Suppliers qualifying a complete graded guard bed and main catalyst system capture roughly 4 times the reactor loading value of those supplying only the main bed itself. Qualification is being established unit by unit right now, and once a system enters the reactor loading diagram it stays there for as long as that unit keeps running biogenic feed at all.
03 / REGENERATION SERVICE INTEGRATION

Own the third of the market you currently concede

Regenerated material now covers around 34% of catalyst volume charged globally, and that share has climbed steadily as regeneration quality improved and procurement examined working capital harder. Suppliers owning regeneration capacity recover roughly 55% of the value otherwise lost entirely to independent regenerators, against capital that is modest beside a catalyst manufacturing line. Selling only fresh charges means watching fully a third of the addressable market move permanently beyond reach, which is a strange thing for a formulator to accept.
04 / SPENT CATALYST RECLAMATION

Turn the disposal problem into a metals position

Spent hydrotreating catalyst carries recoverable molybdenum, nickel, cobalt and vanadium worth around USD 9,000 per tonne, and most refiners still treat the change-out as a waste handling cost rather than a recovery opportunity. Suppliers offering reclamation inside the change-out package capture that value directly while removing a waste handling problem the customer genuinely dislikes dealing with. It also hedges the supplier's own metals exposure, since reclaimed units feed straight back into fresh catalyst manufacture rather than being bought again openly.

Engagement Snapshot From the Field

A live engagement with an industry participant carrying material or product regulatory and market exposure ahead of a defining policy shift, showing how our research translates into a defensible multi-year portfolio strategy.
MARKET MINDS ADVISORY · CLIENT ENGAGEMENT SUMMARY
Hydrodesulfurization Catalyst Producer Strategic Portfolio Review and Transition Roadmap 2026·Investment Scenario on Hydrodesulfurization Catalyst Exposure Evaluation 2025-26
CLIENT PROFILE
A refining catalyst producer operating manufacturing capacity in Western Europe and Asia, supplying hydrotreating catalyst to independent and national refiners across three continents alongside a smaller specialty catalyst business. Hydrotreating catalyst revenue approached USD 310 million annually (client-reported, unverified by MMA), roughly two thirds of it in naphtha and distillate service sold against activity specifications on delivered price.
STRATEGIC CHALLENGE
Margins had compressed for three consecutive years and management attributed the decline to regenerated catalyst competition, responding with a proposed capacity expansion at the European manufacturing site. Renewable feedstock opportunities were being lost without anybody establishing why they were lost. Molybdenum exposure across the contracted order book had never been quantified against realistic price movement.
MMA APPROACH
We assessed the portfolio by feed severity rather than by catalyst family, quantified metals exposure across the contracted order book under historical price movements, and reconstructed nine lost renewable feedstock opportunities through interviews with refinery process engineers rather than the procurement contacts the client normally dealt with. Commercial run histories were benchmarked independently against three competitor products.
KEY FINDINGS
  1. Margin compression traced principally to mix drifting toward naphtha service, not to regenerated catalyst pricing, which had moved very little across the period in question.
  2. Eight of nine lost renewable opportunities failed on absent graded guard bed capability rather than on catalyst activity, delivered price or technical service quality.
  3. Unhedged molybdenum exposure across the contracted order book exceeded a full year of divisional operating profit under the 2023 price movement repeated.
  4. The proposed capacity expansion would have added volume in exactly the tier where regenerated material was taking share and realised margins were already lowest.
CLIENT PROFILE
A refining catalyst producer operating manufacturing capacity in Western Europe and Asia, supplying hydrotreating catalyst to independent and national refiners across three continents alongside a smaller specialty catalyst business. Hydrotreating catalyst revenue approached USD 310 million annually (client-reported, unverified by MMA), roughly two thirds of it in naphtha and distillate service sold against activity specifications on delivered price.
STRATEGIC CHALLENGE
Margins had compressed for three consecutive years and management attributed the decline to regenerated catalyst competition, responding with a proposed capacity expansion at the European manufacturing site. Renewable feedstock opportunities were being lost without anybody establishing why they were lost. Molybdenum exposure across the contracted order book had never been quantified against realistic price movement.
MMA APPROACH
We assessed the portfolio by feed severity rather than by catalyst family, quantified metals exposure across the contracted order book under historical price movements, and reconstructed nine lost renewable feedstock opportunities through interviews with refinery process engineers rather than the procurement contacts the client normally dealt with. Commercial run histories were benchmarked independently against three competitor products.
KEY FINDINGS
  1. Margin compression traced principally to mix drifting toward naphtha service, not to regenerated catalyst pricing, which had moved very little across the period in question.
  2. Eight of nine lost renewable opportunities failed on absent graded guard bed capability rather than on catalyst activity, delivered price or technical service quality.
  3. Unhedged molybdenum exposure across the contracted order book exceeded a full year of divisional operating profit under the 2023 price movement repeated.
  4. The proposed capacity expansion would have added volume in exactly the tier where regenerated material was taking share and realised margins were already lowest.
RECOMMENDED STRATEGY
Phase 1: Phase one: index metals pass-through terms across all multi-year supply contracts and hedge the residual exposure on committed charges immediately. Phase 2: Phase two: defer the capacity expansion and redirect that capital toward graded guard bed development and renewable feedstock qualification programmes. Phase 3: Phase three: build reclamation into the change-out offer, feeding recovered molybdenum and nickel back into manufacture rather than purchasing openly.
OUTCOME
The client deferred the expansion and committed the capital to guard bed development and metals hedging instead. Two renewable feedstock qualifications were underway within eleven months, and realised margin on distillate and renewable charges improved by 17% (client-reported, unverified by MMA) against the prior year on comparable volume.

Frequently Asked Questions

Foundational context covering the market sizes, CAGR, scope, country, region and competition that inform every finding below. This section is provided to cover basics and most often pre-purchase conversations, answered from the MMA Primary Research Dataset.

What is the current size of the Hydrodesulfurization Catalyst Market?

The market is valued at USD 2.7 billion in 2025, rising to USD 2.83 billion in 2026. Sizing covers fresh and regenerated catalyst supplied to refiners at realised delivered price.

How large will the Hydrodesulfurization Catalyst Market be by 2036?

The market reaches USD 4.52 billion by 2036, an increase of USD 1.69 billion across the forecast period. That represents an expansion multiple of 1.60 times the 2026 base.

What is the CAGR for the Hydrodesulfurization Catalyst Market 2026 to 2036?

The base case CAGR is 4.8% across 2026 to 2036. The bull case reaches 6.0% on faster renewable fuel adoption, while the bear case sits at 3.5% under accelerated refinery rationalisation.

Which segment is growing fastest?

Renewable and co-processed feedstock hydrotreating grows fastest at 7.2%, a full 1.50 times the market rate. Biogenic contaminants shorten cycles considerably, which raises replacement frequency well above conventional petroleum service.

Who are the major companies in the Hydrodesulfurization Catalyst Market?

Albemarle, Criterion, Advanced Refining Technologies, Axens and Topsoe lead on supply volume, holding 71% collectively. The remaining field divides between licensor-affiliated houses and independent regional formulators.

Which country is growing fastest?

India grows fastest at 7.6%, driven by refining capacity expanding faster than anywhere else alongside tighter fuel specifications raising catalyst activity requirements across the existing fleet.

Report Segmentation Architecture

The full report scope spans multiple orthogonal segmentation dimensions, with cross-tabulated demand data provided for each dimension pair. Coverage extends further to regional breakdowns, trend trajectories, and the competitive detail needed to support segment-level decision-making.

By Feed Stream Treated

  • Naphtha and Light Ends Hydrotreating
  • Middle Distillate Hydrotreating
  • Vacuum Gas Oil Hydrotreating
  • Residue Desulphurisation
  • Renewable and Co-Processed Feedstock Hydrotreating
  • Lube Base Oil and Specialty Hydrotreating

By End-Use Industry

  • Fuels Refining
  • Renewable Fuels Production
  • Petrochemical Feedstock Preparation
  • Lubricant Base Oil Manufacture
  • Gas Processing and Condensate Treating
  • Specialty and White Oil Production

By Customer Type and Channel

  • Integrated Oil Major Refiners
  • National Oil Company Refiners
  • Independent Merchant Refiners
  • Renewable Fuel Producers
  • Process Licensor Bundled Supply
  • Regeneration and Reclamation Service Accounts

By Region

  • North America
  • Western Europe
  • East Asia
  • South Asia and Pacific
  • Latin America
  • Middle East and Africa
  • Eastern Europe

Scope, Methodology, and Coverage

Every figure in this report is reproducible from documented input assumptions. The scope below maps the historical period, the forecast horizon, the segmentation dimensions, and the countries covered, alongside the underlying primary and qualitative methodology.
Historical Period
2020 to 2025
Forecast Period
2026 to 2036
Base Year
2025 (USD billions; MMA Primary Research Dataset, August 2026)
Market Definition
The market comprises supported hydrodesulfurization catalyst formulations charged into refinery hydrotreating reactors, spanning cobalt-molybdenum, nickel-molybdenum and nickel-tungsten systems on alumina and modified alumina supports, together with graded guard bed catalysts supplied as part of a reactor loading. Sizing captures fresh and regenerated catalyst revenue at realised delivered price across fuels refining, renewable fuels production, petrochemical feedstock preparation, lubricant base oil manufacture, gas processing and specialty product applications. Hydrocracking, catalytic reforming, fluid catalytic cracking and isomerisation catalysts, sulphur recovery units, inert support media, reactor internals, and process licensing fees all fall outside scope.
Quantitative Units
USD billions (current prices); catalyst supplied annually in thousands of tonnes; USD per kilogram at realised delivered price
Segmentation Dimensions
By Feed Stream Treated; By End-Use Industry; By Customer Type and Channel; By Region
Regions Covered
North America, Western Europe, East Asia, South Asia and Pacific, Latin America, Middle East and Africa, Eastern Europe
Countries Covered
USA, Canada, Mexico, UK, Germany, France, Italy, Spain, Netherlands, Belgium, Poland, Hungary, Czech Republic, Romania, Turkey, China, Japan, South Korea, Taiwan, India, Singapore, Malaysia, Thailand, Vietnam, Indonesia, Australia, Brazil, Argentina, Colombia, Saudi Arabia, UAE, Kuwait, Oman, Qatar, Egypt, Algeria, Nigeria, South Africa, and additional markets relevant to this sector
Key Companies Profiled
Albemarle, Criterion Catalysts and Technologies, Advanced Refining Technologies, Axens, Topsoe, Honeywell UOP, Sinopec Catalyst Company, JGC Catalysts and Chemicals, Nippon Ketjen, Clariant, BASF, Johnson Matthey, Evonik Industries, Eurecat, Porocel Industries, Unicat Catalyst Technologies, CNPC Catalyst Company, Sud-Chemie India, Zeolyst International, Chevron Lummus Global.
Quantitative Methodology
Primary survey, n=3,800 respondents, Q4 2025, six countries; demand-side model with trade association cross-validation
Qualitative Methodology
47 expert interviews, Q4 2025; applied to validate demand model assumptions, identify emerging dynamics, and assess competitive positioning
Report Format
PDF and XLSX data workbook (Word format preview document)
Publisher
Market Minds Advisory
Report Code
MMA-2026-CHM-550
Published
August 2026
Contact
sales@marketmindsadvisory.com | www.marketmindsadvisory.com

Purchase the full Hydrodesulfurization Catalyst Market Report (2026 to 2036).

The full report sizes the hydrodesulfurization catalyst market across six feed streams, six end-use industries, six customer channels and seven regions, with annual forecasts to 2036 in revenue and tonnage supplied. It quantifies refinery margin lost to catalyst-related outages by unit type, which is the analysis establishing what an extra month of cycle length is genuinely worth to a customer. Twenty participants are assessed on a consistent catalyst supply volume basis, with renewable feedstock qualification mapped separately from conventional run histories. Molybdenum exposure is quantified across each supplier's contracted order book.
Six feed streams sized and forecast annually to 2036
Refinery margin lost to catalyst outages quantified
Twenty participants assessed on consistent supply volume basis
Renewable qualification mapped separately from conventional run histories
Molybdenum exposure quantified across contracted supplier order books
Regeneration and reclamation economics compared supplier by supplier

Built For The People Who Decide

From boardroom strategy to bench-side execution, this report is read cover-to-cover by leaders shaping the next decade of their industry, turning demand scenarios, market dynamics and valuation benchmarks into decisions.
CXOs/ Presidents/ VPs/ Managers
M&A and Corporate Development
Strategy Teams and R&D Heads
Procurement and Product Directors
Regulatory and Compliance Leaders
Investor Relations and Equity Analysts