Market Minds Advisory
Hydraulic Intensifiers Market

Hydraulic Intensifiers Market: Pressure Classes, Fatigue Qualification, And The Aftermarket Most Suppliers Give Away

Nothing else reaches the pressure, so the intensifier gets bought regardless of price. What decides the order is whether the seal package survives a shift and the cylinder survives twenty million cycles.

Lead Analyst

David Horsley

Published

September 2026

Make Smarter Decisions with Customized Research Insights

Request a free sample report and evaluate market opportunities, growth trends, and competitive dynamics relevant to your business needs.

2025 MARKET VALUE$0.9BMarket Size 2025
2036 FORECAST VALUE$1.7BBase Case , 2026 to 2036
CAGR 2026 TO 20366.1 %Bull 7.3% / Bear 4.9%
INCREMENTAL OPPORTUNITY$0.8BNet 10- year value creation
EXPANSION MULTIPLE1.81x2036 value over 2026 base
Strategic Levers
M&A Pipeline
Regional Outlook
Country Rankings
Competitive Intelligence
Segmental Deep-dive
Call-Us : 91 93563 13602

Executive Snapshot and Market Trajectory

An intensifier is bought when no pump reaches the pressure required, which makes the purchase inelastic and the specification technical. Value sits in seal life and cylinder fatigue resistance rather than in the piston ratio. The market is USD 0.9 billion in 2025, growing at 6.1%.
Hyper pressure units above 6,500 bar grow fastest at 10.4%, about 1.70 times the market rate, as waterjet cutting moves beyond 6,000 bar and high-pressure food processing scales up. North America holds 30% of value on waterjet and food processing demand, and Western Europe 25% through press, test rig, and subsea equipment builders. East Asia takes 24% and is gaining share the fastest of the three.
Concentration runs at 54%, held down by specialist engineering firms that occupy niches the diversified majors have not found worth entering. Competition turns on seal package life, cylinder fatigue design, and aftermarket service reach, since 38% of category revenue arrives after the machine is sold. The suppliers doing well treat the intensifier as a consumables platform, and those doing badly still price it as equipment. That difference shows up in margin, not revenue.
Market Definition
The hydraulic intensifier market covers pressure boosting devices that use a differential piston area to raise the pressure of a liquid working medium above what the driving pump or supply delivers, sold as standalone units and as integrated modules. It spans oil, water, and emulsion media across medium through hyper pressure classes. Hydraulic pumps, accumulators, cylinders, valves, complete waterjet cutting machines, and gas compressors are excluded.
Base Year Value
$0.9B in 2025 (MMA Primary Research Dataset, August 2026)
Forecast Period
2026 to 2036, eleven discrete annual values
CAGR
6.1% base case. Bull 7.3%. Bear 4.9%.
Fastest Growth Segment
Hyper Pressure (Above 6,500 bar): 10.4% CAGR
Fastest Growth Country
India: 8.9% CAGR
Fastest Growth Region
South Asia and Pacific: 8.1% CAGR
Largest Region
North America: 30% of 2025 global value
Market Leaders
Bosch Rexroth, Parker Hannifin, KAMAT, Hydratron, Maximator. Source: MMA Primary Research Dataset, July 2026.
Primary Survey
n=3,800 procurement and R&D decision-makers, Q4 2025, six countries
Methodology
Demand-side build-up, cross-validated against public data, 47 expert interviews

Hydraulic Intensifiers Market Forecast Scenarios

hydraulic-intensifiers-market-size-forecast-scenario-1787332574275
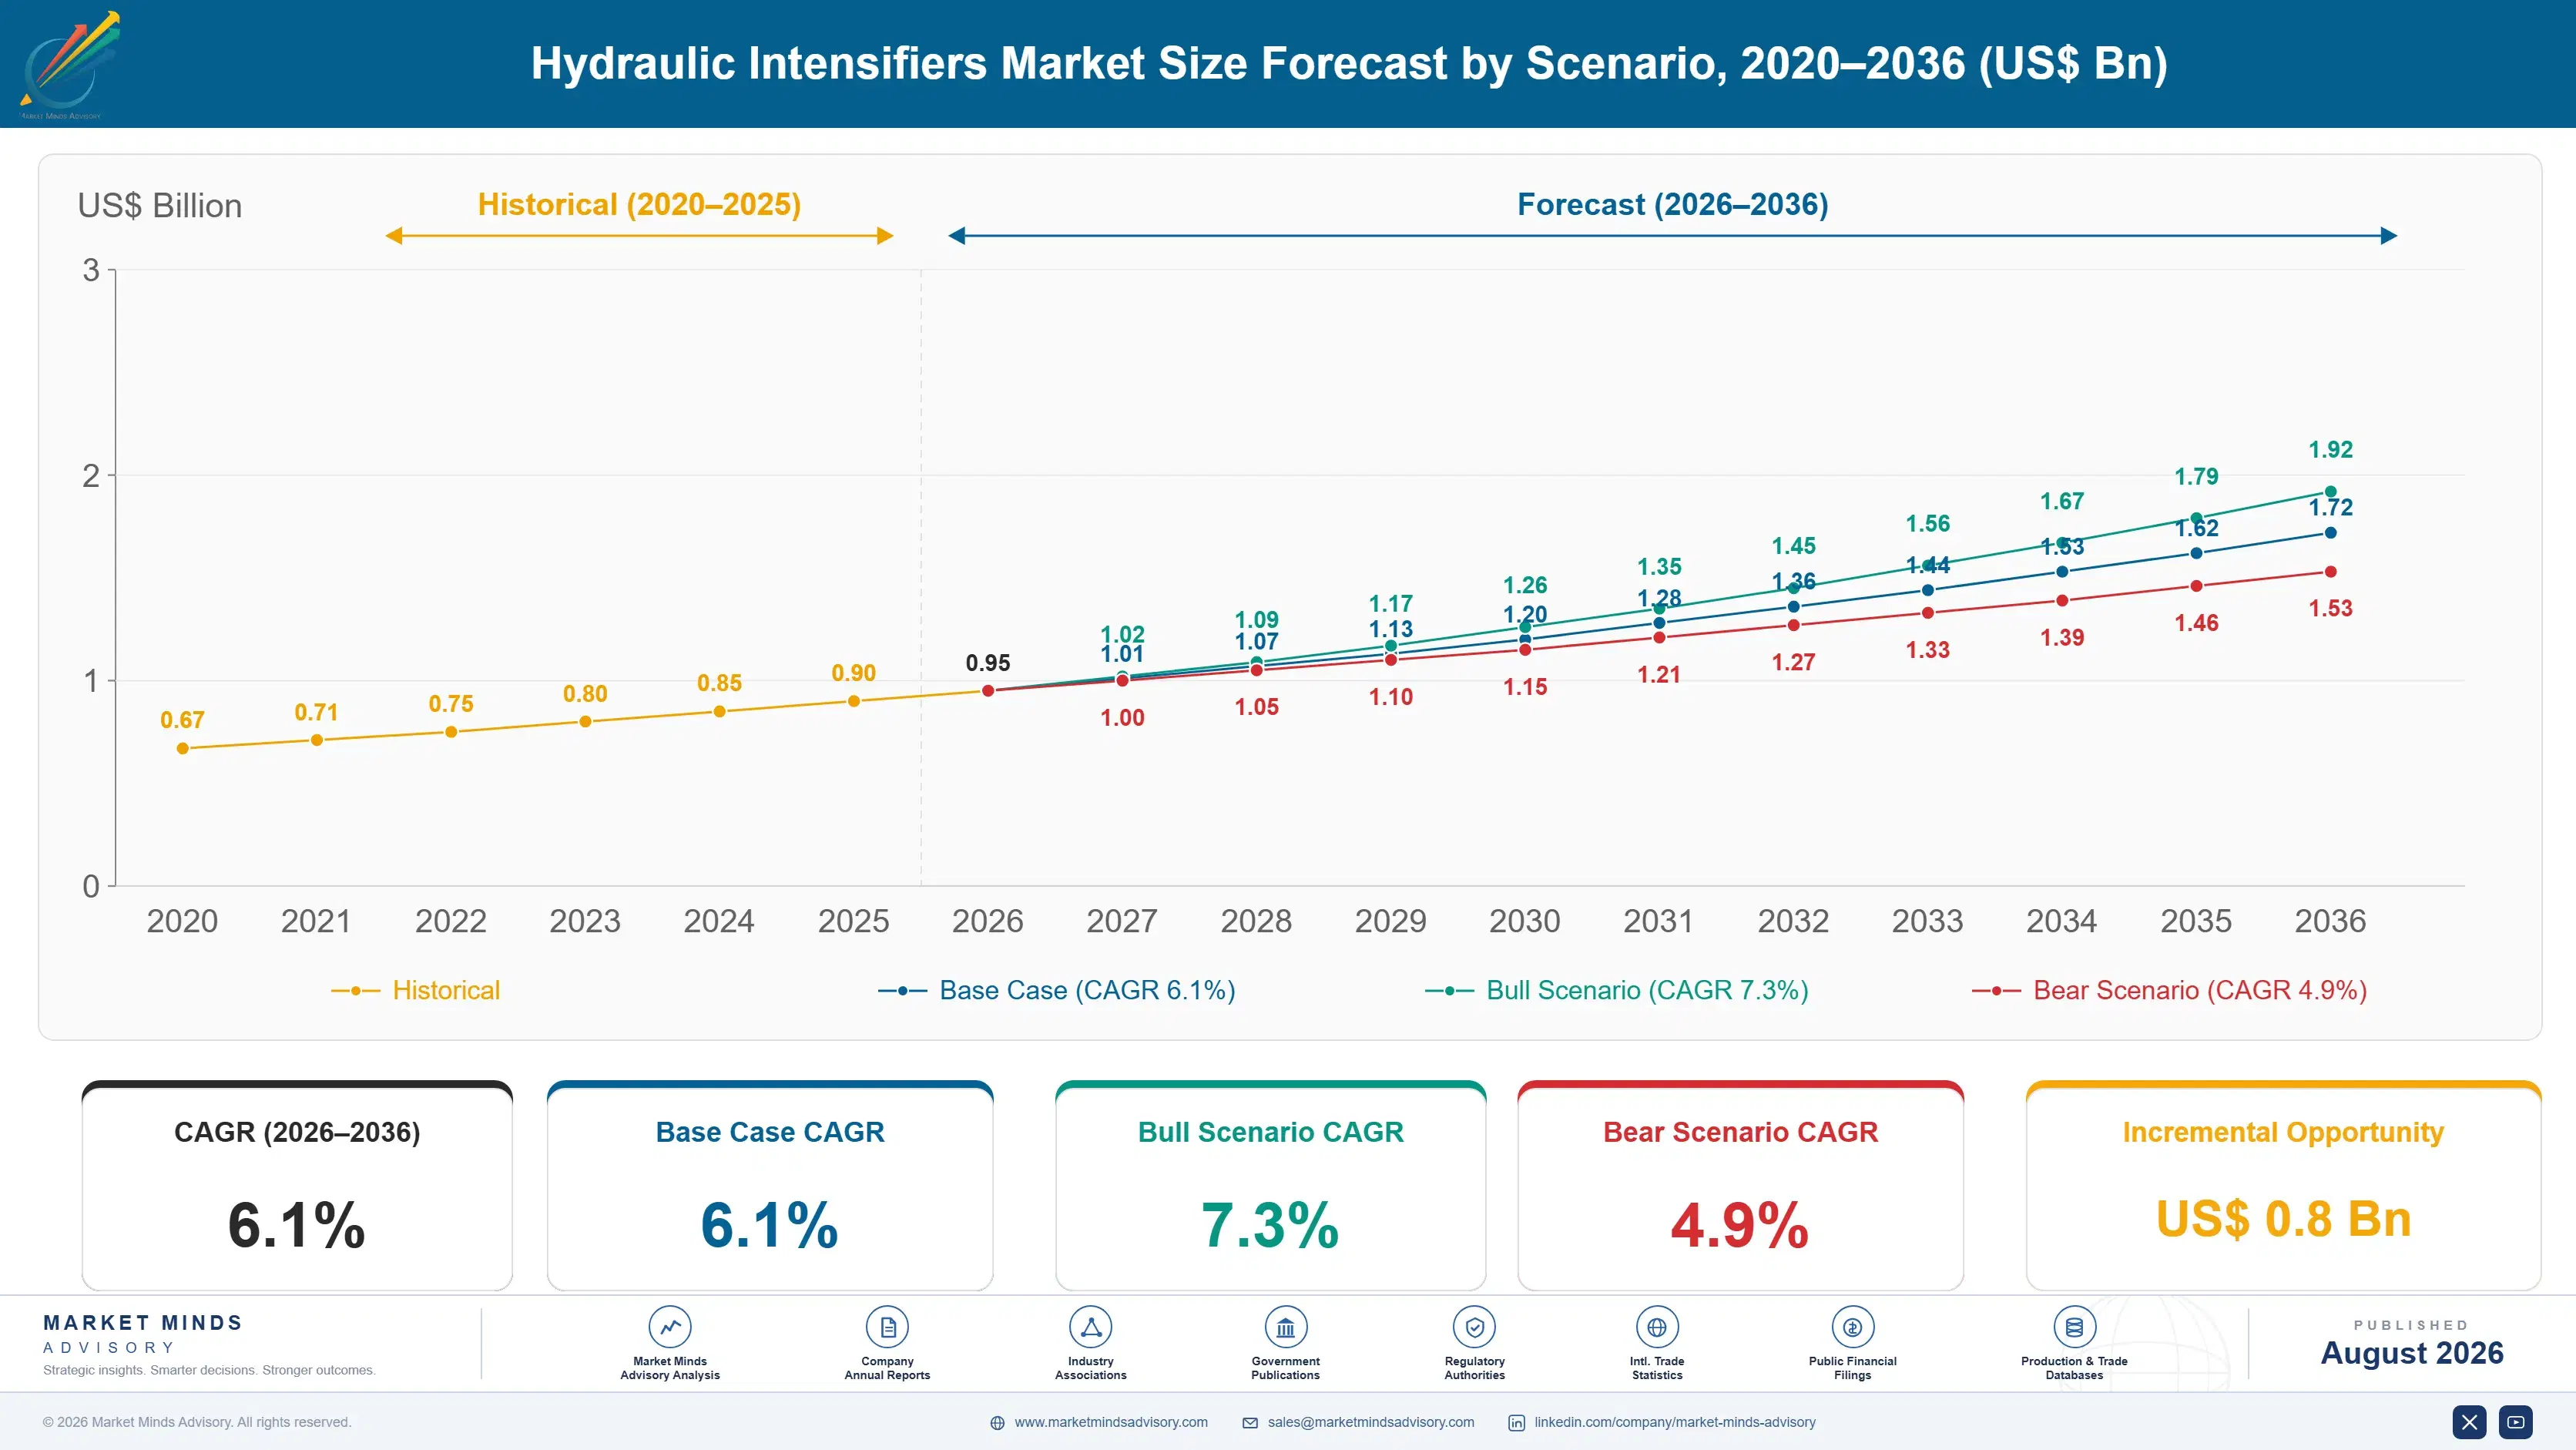
Between 2020 and 2025 this market moved up the pressure ladder rather than out. Unit shipments in the medium and high pressure classes were broadly flat, while waterjet cutting systems shifted toward 6,000 bar and above and high-pressure food processing installations multiplied. A 5.2% historical CAGR therefore reflects specification creep as much as new demand, and average selling price rose faster than units did throughout.
Three mechanisms carry the 6.1% base case. Waterjet cutting continues moving to higher pressures because cut speed scales with pressure and abrasive consumption falls, which pays for the intensifier within a year. High-pressure processing of food at 6,000 bar keeps adding installations as retailers demand extended shelf life without thermal treatment or preservatives. And subsea equipment qualification testing deepens with offshore development, since a component rated for 3,000 metres must be proven at pressures only an intensifier generates.
The 7.3% bull case turns on high-pressure food processing reaching mainstream retail volumes, which would multiply installed capacity rather than replace it. The 4.9% bear case is capital equipment deferral in metal fabrication, where a waterjet upgrade is postponed the moment order books soften. Both scenarios turn on customer capital cycles, and neither concerns the intensifier itself.

Bought Because Nothing Else Reaches The Pressure

Demand here is inelastic in a way most industrial equipment is not. A shop that needs 6,000 bar cannot get there with a bigger pump, a better pump, or any amount of plumbing, so the intensifier is bought and the price argument happens afterwards. Blended average selling price sits at USD 14,600, which spans a small air-driven booster and an ultra-high-pressure waterjet pump costing many times that.
TOP FIVE CONCENTRATION54%Specialist engineering firms hold positions the majors have not taken
AVERAGE SELLING PRICEUSD 14,600Blended across pressure classes and drive configurations sold
SEAL REPLACEMENT INTERVAL400 to 900 hoursOperating hours between high-pressure seal service in continuous duty
AFTERMARKET REVENUE SHARE38%Seals, plungers, and service carried after the initial sale
LEADING PRODUCER SHARE34%Manufacturing concentrates where precision cylinder capability already exists
REPLACEMENT CYCLE LENGTH12 to 18 yearsInterval between unit installation and full capital replacement
Aftermarket carries 38% of category revenue, which is the number that explains the business. High-pressure seals last 400 to 900 operating hours in continuous duty and then must be changed, and a waterjet shop running two shifts replaces them monthly. Plungers, check valves, and cylinder heads follow their own schedules. A supplier without service reach sells the machine once and loses the following twelve years of consumption to somebody else.
Above roughly 4,000 bar the engineering problem changes character. Below that, seals wear and get replaced. Above it, the cylinder itself fatigues, and a body that cracks after 8 million cycles rather than 20 million is a warranty catastrophe rather than a maintenance item. Autofrettage practice and material selection separate the handful of firms who can build at these pressures from everybody else.
"Everyone specifies the area ratio and nobody asks about the seal package, which is the only part that will cost them money. The ratio is arithmetic. Getting a seal to survive nine hundred hours at six thousand bar is thirty years of somebody's career."
Principal Analyst, Fluid Power Practice · MMA Construction and Industrial Equipm

Market Trends

Waterjet Cutting Keeps Climbing The Pressure Curve

Cut speed on a waterjet rises with pressure and abrasive consumption falls, so a shop moving from 4,100 bar to 6,900 bar cuts faster and spends less on garnet at the same time. Machine builders have pushed the standard specification upward accordingly, and 4,100 bar systems increasingly read as entry level rather than as the norm. The intensifier is the component that makes the difference, which puts the pressure supplier rather than the machine builder in the technical conversation. Seal and cylinder engineering set the ceiling on how far this can go.
Market Impact: Seals last 400 to 900 hours

High-Pressure Food Processing Creates A Continuous Duty Market

High-pressure processing holds packaged food at around 6,000 bar for several minutes, which inactivates pathogens without heat and extends shelf life without preservatives. The intensifiers driving those vessels run near-continuously on production schedules that resemble a chemical plant rather than a machine shop. That duty cycle changes the commercial relationship completely: seal consumption is predictable, service intervals are scheduled, and the operator cares more about uptime guarantees than purchase price. Suppliers accustomed to selling into job shops find this a different business entirely, and a considerably better one. Continuous duty is worth several job shops.
Market Impact: Components rated to 3,000 metres

Market Opportunities and Growth Drivers

Aftermarket Seal Consumption Drives Most Recurring Revenue

A high-pressure seal package lasts 400 to 900 operating hours in continuous duty, which means a two-shift waterjet operation replaces seals roughly monthly and a food processing line on a similar schedule. Across a 12 to 18 year machine life, cumulative consumables spend exceeds the original purchase price several times over. That is why aftermarket carries 38% of category revenue and why the service network matters more than the sales network. Suppliers who let third parties supply seals have given away the profitable half of their own product. Very few of them realise it in time.
Market Impact: Fatigue life below 20 million cycle

Subsea Qualification Testing Deepens With Offshore Development

A subsea component rated for 3,000 metres must be proven at the pressure that depth generates, plus a safety factor, and no pump reaches those figures. Test houses and equipment manufacturers therefore buy intensifiers as capital infrastructure and run them for decades. Brazilian pre-salt, West African, and Guyanese offshore development all add qualification testing volume, and each new water depth record moves the required test pressure upward. Certification bodies also tighten test protocols periodically, which obsoletes rigs built to older specifications and forces replacement. Test infrastructure ages by regulation rather than by wear.
Market Impact: Aftermarket holds 38% through downt

Market Restraints and Challenges

Cylinder Fatigue Design Limits Who Can Build Hyper Pressure

Above roughly 4,000 bar the failure mode shifts from seal wear to cylinder fatigue, and a body that cracks at 8 million cycles instead of 20 million destroys both the customer's production and the supplier's reputation. The root cause is that hoop stress at these pressures approaches the material limit, so autofrettage residual stress and inclusion control in the steel decide life more than wall thickness does. Commercially this restricts hyper pressure supply to a handful of firms. New entrants are pursuing composite-wrapped and segmented designs, though none has yet accumulated the service history buyers require.
Market Impact: Systems moving to 6,900 bar

Capital Equipment Deferral Hits Job Shop Demand Immediately

A metal fabrication shop considering a waterjet pressure upgrade postpones it the week order books soften, because the existing machine still cuts and the upgrade only cuts faster. The root cause is that most intensifier demand in fabrication is a productivity improvement rather than a capability requirement, and productivity spending is the first thing deferred. Commercially this makes the job shop channel volatile in a way the food processing and subsea channels are not. Suppliers are mitigating through service contracts and seal supply, which continue regardless of whether anybody buys a new machine.
Market Impact: Vessels operate at 6,000 bar
2 additional market trends, 4 additional growth drivers, and 3 additional restraints and challenges are covered in the full report. Contact sales@marketmindsadvisory.com to access the complete intelligence.

Segment CAGR and Growth Architecture

Segmentation follows output pressure class, because pressure determines the engineering problem, the supplier set capable of solving it, and the application it serves. Drive medium, mounting configuration, and end-use industry are handled in the framework, since each cuts across every pressure class rather than defining one. Nothing else separates this market anything like so cleanly.
hydraulic-intensifiers-market-market-share-analysis-1787332574858

Hyper Pressure (Above 6,500 bar)

Hyper pressure grows fastest at 10.4%, about 1.70 times the market rate, and it is the class where the engineering stops being routine. Above 6,500 bar hoop stress approaches the steel's limit, so autofrettage residual stress, inclusion control, and cyclic fatigue testing decide whether a cylinder reaches 20 million cycles or cracks at eight. Waterjet systems at 6,900 bar and high-pressure food processing vessels are the two commercial drivers, and both run continuous duty schedules that consume seals predictably. Perhaps six firms worldwide can supply at this level with credible service history. Price competition is essentially absent here. Buyers choose on demonstrated fatigue life and on very little else at all.
CAGR 10.4%

Ultra-High Pressure (4,000 to 6,500 bar)

Ultra-high pressure grows at 8.2% and carries the largest share of value, since this is where most waterjet cutting and a good deal of pressure testing actually operate. The engineering is demanding but established: seal packages last 400 to 900 hours, cylinder design is well understood, and perhaps a dozen firms compete credibly. That makes it the class where commercial factors rather than technical qualification decide accounts, and where service network reach separates suppliers most visibly. Growth comes from installed base expansion and from machines migrating up from the high pressure class below it. Aftermarket economics dominate the business case here. Whoever holds the seal supply effectively holds the customer.
CAGR 8.2%
Full segment breakdown across 7 segments available in the complete report.

Regional Architecture and Country Demand Map

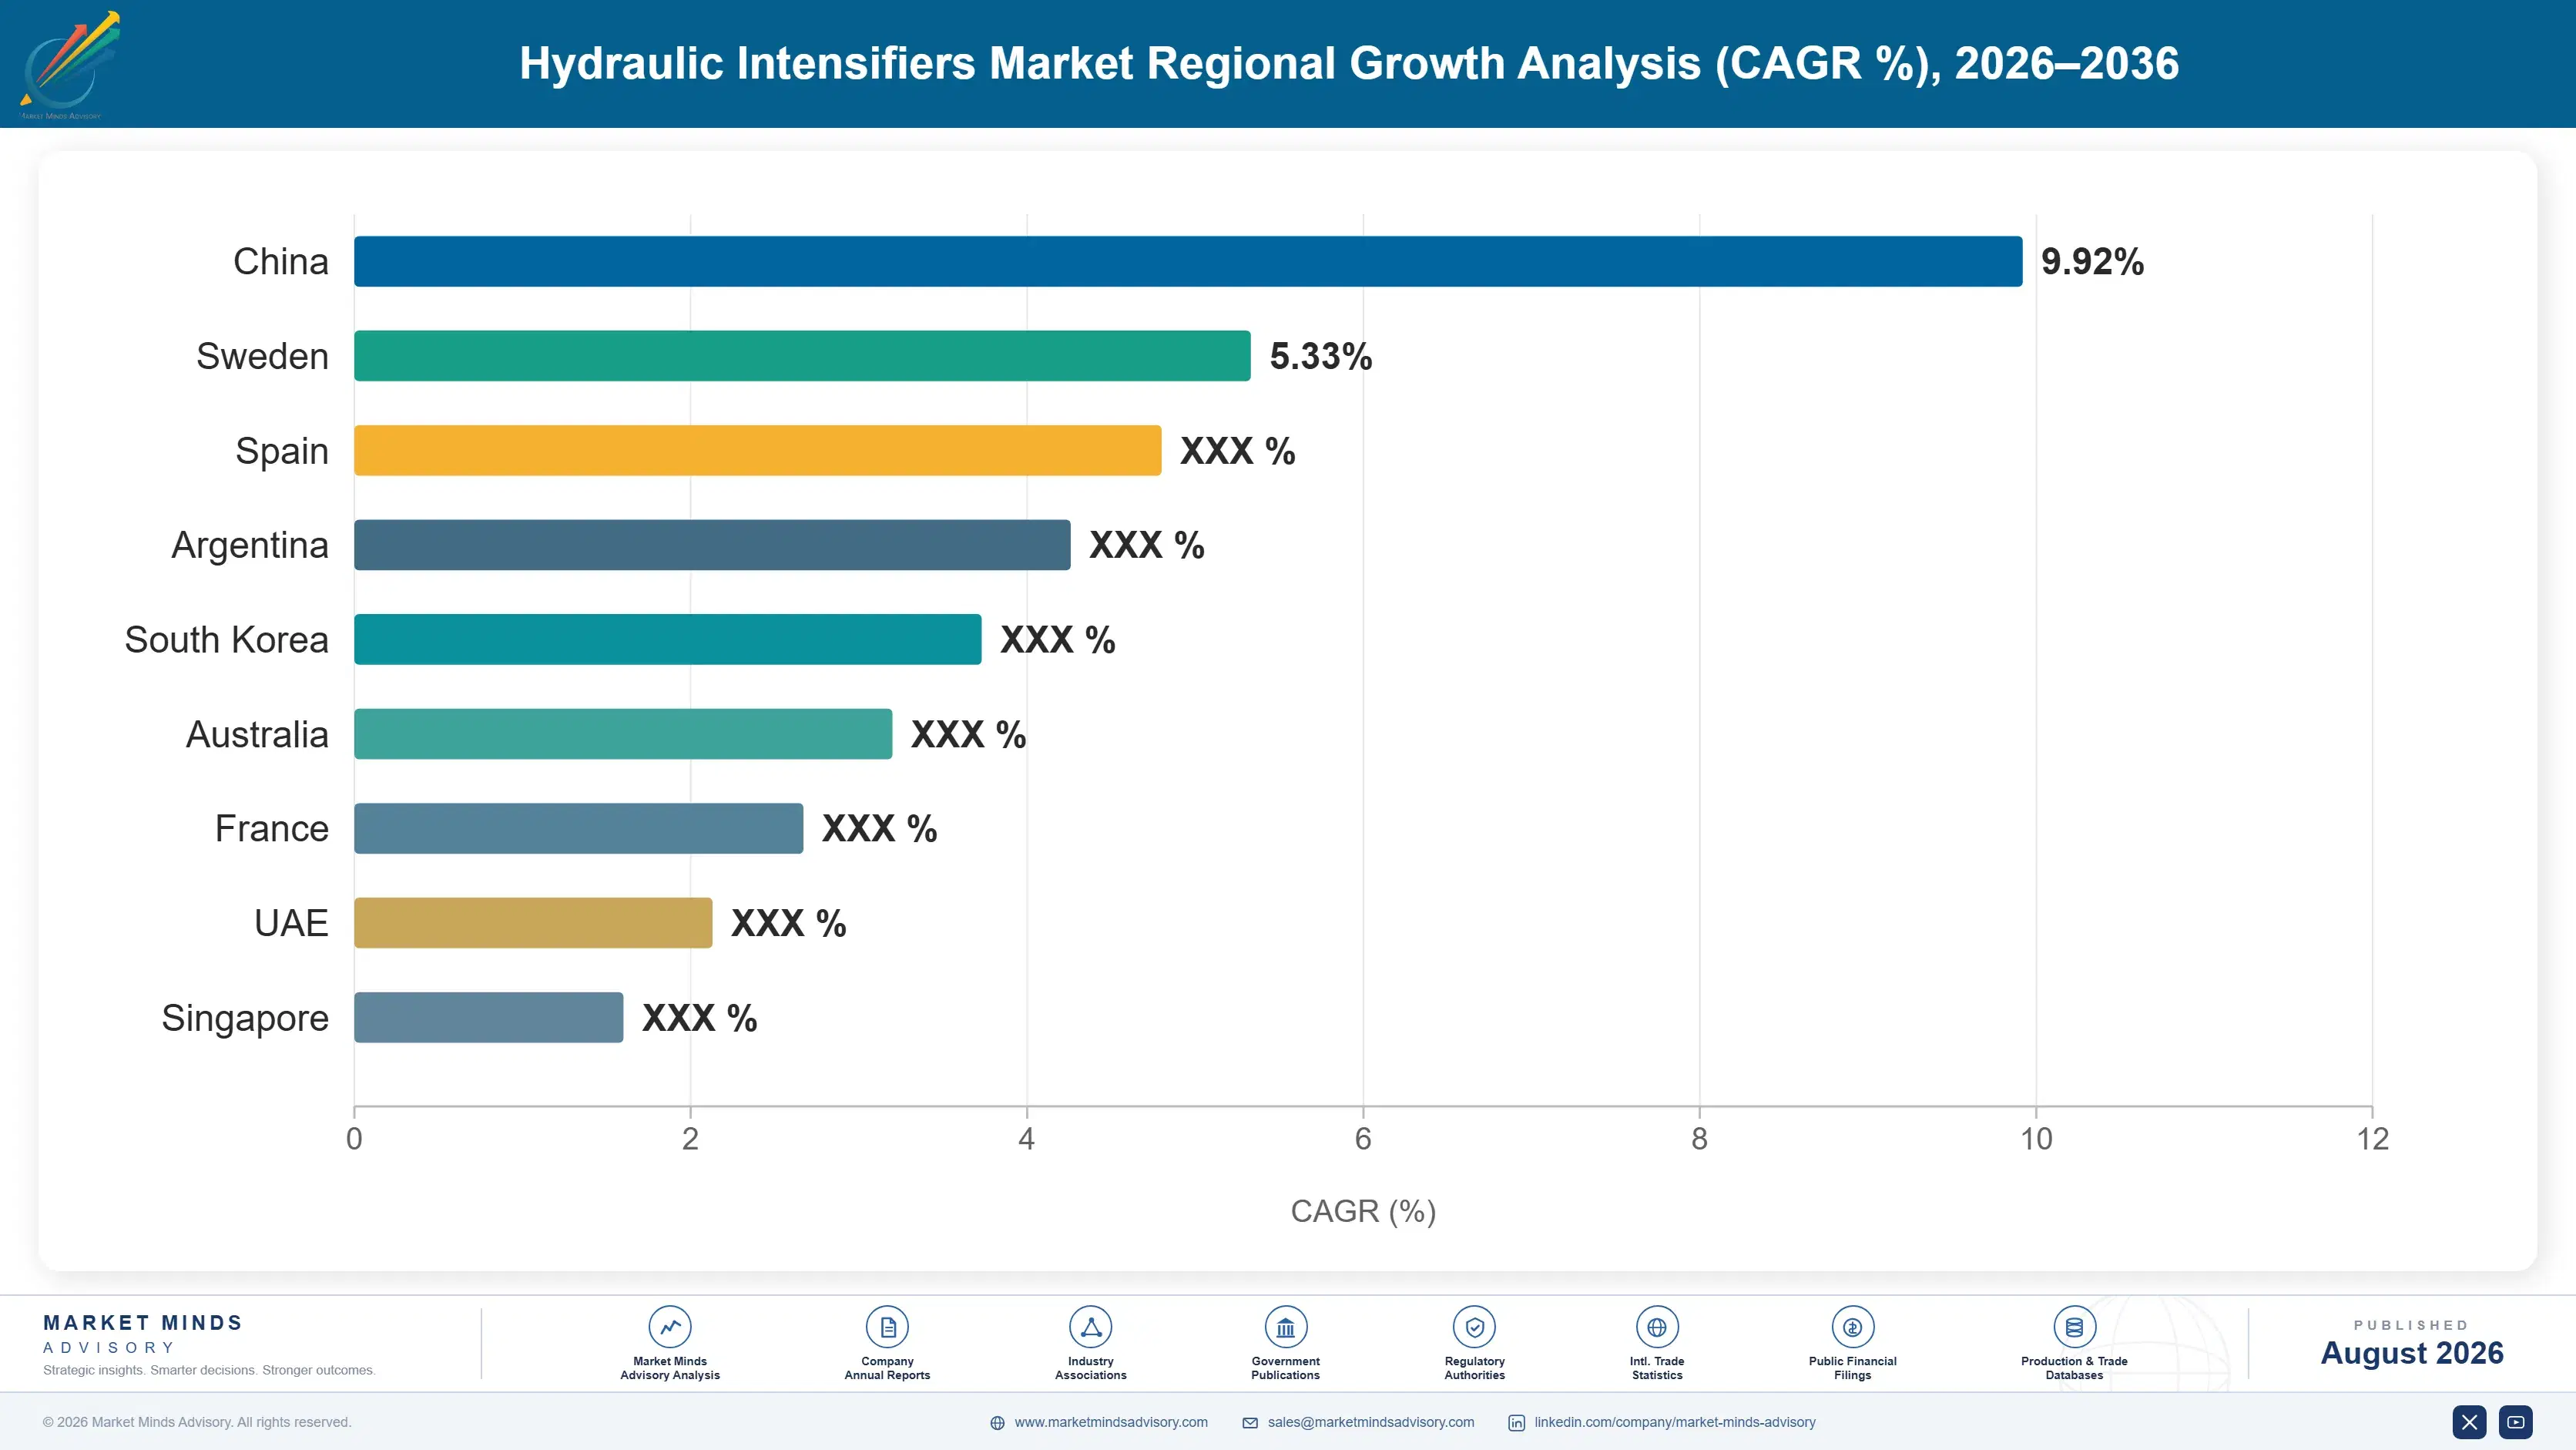
Regional shares here follow specific industries rather than general industrial output: waterjet fabrication, food processing, press building, and offshore testing. North America and Western Europe together take over half because those four concentrate there. Growth is fastest where fabrication capacity is being added rather than replaced.

North America

North America holds 30% of value, the largest share anywhere, on a combination that exists nowhere else in the same concentration. Waterjet cutting penetrated American job shops earlier and more completely than any other market, high-pressure food processing found its first mainstream retail acceptance here, and Gulf of Mexico subsea qualification testing runs continuously. Aftermarket seal consumption from that installed base is substantial and predictable. Canadian demand follows the same industries at smaller scale. Growth at 6.4% sits above the global rate, driven by food processing installations and by fabrication shops upgrading pressure rather than adding machines. The installed base here is the real commercial asset rather than annual equipment sales.
Share: 30% | CAGR: 6.4% (2026 to 2036)

Western Europe

Manufacturing rather than consumption explains much of Western Europe's 25% share. German, Italian, and Danish firms build a disproportionate share of the world's intensifiers, including most of the specialist units sold into presses, clamping systems, and test rigs. Domestic demand is genuine too, particularly from press builders in Germany and Italy and from North Sea subsea qualification work. High-pressure food processing has adopted more slowly here than in North America, held back by regulatory caution and consumer preference. Growth at 4.7% is the slowest of any region, reflecting mature fabrication capacity and an equipment base being replaced rather than expanded. Export revenue matters considerably more here than domestic demand ever does.
Share: 25% | CAGR: 4.7% (2026 to 2036)
Regional intelligence for 5 additional markets available in the complete report: East Asia, South Asia and Pacific, Latin America, Middle East and Africa, Eastern Europe. Contact sales@marketmindsadvisory.com.
hydraulic-intensifiers-market-country-cagr-analysis-1787332575364

Where The Real Margin Sits

Four levers matter here, and only one of them concerns the initial sale. Aftermarket capture, fatigue qualification, continuous-duty channel selection, and service network reach decide the economics, because the machine is a twelve to eighteen year annuity that most suppliers hand to somebody else. Selling harder on the capital equipment misses where the money actually accumulates.

Capture The Seal Supply Before A Third Party Does

Seals last 400 to 900 hours and get replaced monthly on a two-shift operation, which over a 12 to 18 year machine life means cumulative consumables spend several times the purchase price. Aftermarket already carries 38% of category revenue, and the suppliers holding it are the ones with service coverage and rapid parts availability. Third-party seal makers are competent and cheaper, and they take that revenue wherever the original supplier cannot deliver within a day. Designing the seal package so an equivalent is hard to source is legitimate and effective. Parts availability wins this more than price does.
Market Impact: Aftermarket carries 38% of revenue

Publish Fatigue Test Data At Full Rated Pressure

Above 4,000 bar buyers care about one thing: whether the cylinder survives. A supplier holding documented cyclic fatigue testing to 20 million cycles at rated pressure has an argument no competitor can answer with a datasheet, and it is the argument that decides hyper pressure accounts. Generating that data costs perhaps USD 900,000 in test rig time and takes two years, which is precisely why so few firms have it. It is also the reason hyper pressure carries almost no price competition and the widest margins in the category. Two years of testing buys a decade of position.
Market Impact: Costs roughly USD 900,000 and two y

Chase Continuous Duty Applications Over Job Shop Volume

A food processing line or a subsea test house runs its intensifier on a production schedule, which makes seal consumption predictable and turns the relationship into a supply contract rather than a series of transactions. A fabrication job shop uses the machine intermittently, defers capital in every downturn, and buys seals from whoever answers the phone. The same equipment produces perhaps 3 times the lifetime revenue in the first channel. Sales organisations built around machine tool distribution rarely reach food processing or offshore buyers at all, which is the real barrier. Channel access costs more than product development does.
Market Impact: Delivers roughly 3 times the lifeti

Build Service Coverage Before Extending The Product Range

An intensifier down on a food line or a two-shift waterjet costs the customer more per hour than the machine cost per month, so response time decides who keeps the aftermarket. Suppliers add products because engineering is fun and service coverage because a spreadsheet forces them, which is the wrong order. A regional service point costs perhaps USD 400,000 to establish and protects an installed base generating far more than that annually in seals and labour. Product breadth without coverage simply hands the aftermarket to local competitors. Coverage is the less interesting investment and the better one.
Market Impact: A service point costs roughly USD 4

Who Controls the Margin Pool

Concentration sits at 54% for the top five, which understates how segmented this market is, because the diversified majors dominate the lower pressure classes while specialists hold the top of the range. The gap between leaders and challengers is documented fatigue qualification and service coverage, not product design. All participants here are assessed on one basis, revenue from hydraulic pressure intensifiers and booster units including their dedicated consumables.
Competition runs on four dimensions that barely intersect. Fatigue qualification decides hyper pressure accounts outright, since nothing else answers the buyer's only real question. Service response time decides the aftermarket, which is 38% of revenue. Channel access decides whether a supplier reaches food processing and offshore buyers at all. Price decides only the medium and high pressure classes, where Chinese and Indian manufacturers now compete effectively.

Two pressures will shift rankings. Asian manufacturers are moving up the pressure classes steadily, and their absence above 4,000 bar reflects accumulated fatigue test history rather than any manufacturing limitation they cannot overcome. Meanwhile third-party seal suppliers keep taking aftermarket revenue from original manufacturers with thin service coverage. Positions will favour whoever combines documented fatigue life with genuine service reach, and very few hold both today.
hydraulic-intensifiers-market-company-positioning-matrix-1787332575883

Competitive Moat and Risk Dimensions

BOSCH REXROTH

Moat: Press integration and global service

Bosch Rexroth supplies intensifiers as part of complete press and clamping systems, which means the specification is written into a machine the customer buys for other reasons entirely. Competing against that requires displacing the whole system, not the component. Global service coverage also holds the aftermarket in territories where specialist firms have no presence at all.
BOSCH REXROTH

Risk: Weak above 4,000 bar

Rexroth's positions concentrate in the medium and high pressure classes, which grow at 3.3% and 5.0% against 10.4% for hyper pressure. The top of the range demands fatigue qualification and specialist metallurgy that a broad fluid power portfolio does not naturally develop. Those classes are also where the margin is, so the mix works against the position over time.
PARKER HANNIFIN

Moat: Distribution reach and breadth

Parker's distribution network reaches industrial customers in more territories than any specialist reaches, and an intensifier ordered alongside hoses, fittings, and cylinders arrives on one purchase order. For medium and high pressure applications that convenience frequently outweighs a technical advantage the buyer would struggle to evaluate anyway. Breadth is the moat, and it is not one a specialist can build.
PARKER HANNIFIN

Risk: Intensifier is one line item

An intensifier sits among tens of thousands of Parker part numbers, which means it receives engineering attention and inventory priority proportionate to its revenue rather than to its technical difficulty. Specialist competitors bring application engineers who have spent careers on pressure boosting. In the classes where that expertise decides the account, breadth counts for very little.

Players Tracked

Prominent Players

Bosch Rexroth
Parker Hannifin
KAMAT
Hydratron
Maximator

Other Key Players

Flow International
KMT Waterjet
Haskel International
Hi-Force
Enerpac
SITEMA
Tox Pressotechnik
Minibooster Hydraulics
Scanwill Fluid Power
Resato International
Uraca
Hydro-Pac
Hammelmann
Interpump Group
Yuken Kogyo

Recent Developments

FEBRUARY 2025

Waterjet system pressures extend beyond 6,900 bar in production

Machine builders extended production waterjet offerings past 6,900 bar operating pressure, moving what had been a specialist capability toward standard specification on higher-end systems. These were product introductions rather than any commercial transaction, and they push intensifier requirements into a class only a handful of suppliers can qualify for.
Signal: Specification creep at the top of the rang
AUGUST 2024

High-pressure processing capacity expands across food manufacturing

Food manufacturers and contract processors added high-pressure processing vessel capacity across North America and Western Europe, driven by retailer demand for extended shelf life without thermal treatment. These were organic capacity expansions rather than acquisitions, and each installation adds continuous-duty intensifier demand with predictable consumables consumption attached.
Signal: Continuous duty installations are each wor
NOVEMBER 2024

Subsea test protocols tightened for deepwater qualification

Certification bodies and operators tightened qualification test protocols for deepwater subsea equipment, raising both required test pressures and cycle counts for components rated beyond 3,000 metres. These were standards revisions rather than commercial events, and they obsolete test rigs built to earlier specifications across the offshore supply chain.
Signal: Standards revisions replace capital equipm

Alloy Steel, Seals, And Machining

Cost structure is dominated by two lines behaving very differently. High-grade alloy steel forgings for cylinder bodies carry 22% to 32% of unit cost, from a small set of European and Japanese mills certifying inclusion content. Precision machining, honing, and autofrettage account for 26% to 38%, largely internal labour. Seal and sealing element content runs 8% to 14%, from specialist polymer producers.
European energy costs through 2022 raised specialty steel prices sharply, and mills passed through surcharges that persisted after gas prices eased. The IEA documented the underlying energy constraint on European industry across that period. For intensifier builders the difficulty was qualification rather than percentage: switching mill requires requalifying material certification and, for hyper pressure bodies, repeating fatigue testing. Several absorbed the cost instead. Bosch Rexroth disclosed input cost pressure then.

Every range above exceeds three points because a medium pressure booster and a hyper pressure body share no process route. Exposure separates by pressure class. A hyper pressure builder carries steel qualification risk money cannot resolve quickly, since requalification repeats fatigue tests. A medium pressure supplier carries ordinary commodity exposure on a product where Chinese manufacturers already set the price. Machining labour separates European builders from Asian ones.
hydraulic-intensifiers-market-cost-volatility-analysis-1787332576077

Qualify a second steel mill before the first fails you

Cylinder body forgings come from few mills certifying inclusion content to the level hyper pressure needs, and switching means repeating material certification and, above 4,000 bar, fatigue testing. That is years of work and considerable cost. Starting while supply is comfortable is the only version that does not stop production. The alternative is discovering the problem during a shortage.

Own the seal design rather than buying a catalogue part

Seals run 8% to 14% of unit cost and generate the majority of aftermarket revenue over a machine's life, so buying a standard catalogue part hands that revenue to whoever else stocks it. Designing a proprietary seal geometry costs development time once and keeps the consumables stream attached to the original supplier for a decade or more.

Treat machining capacity as strategic, not as overhead

Precision machining, honing, and autofrettage carry 26% to 38% of unit cost and are almost entirely internal labour and equipment. Outsourcing looks cheaper on a spreadsheet and removes the process control that determines fatigue life. Manufacturers who subcontracted cylinder finishing have generally brought it back after a warranty problem taught them what the saving actually cost them.

Portfolio Architecture for Margin Defence

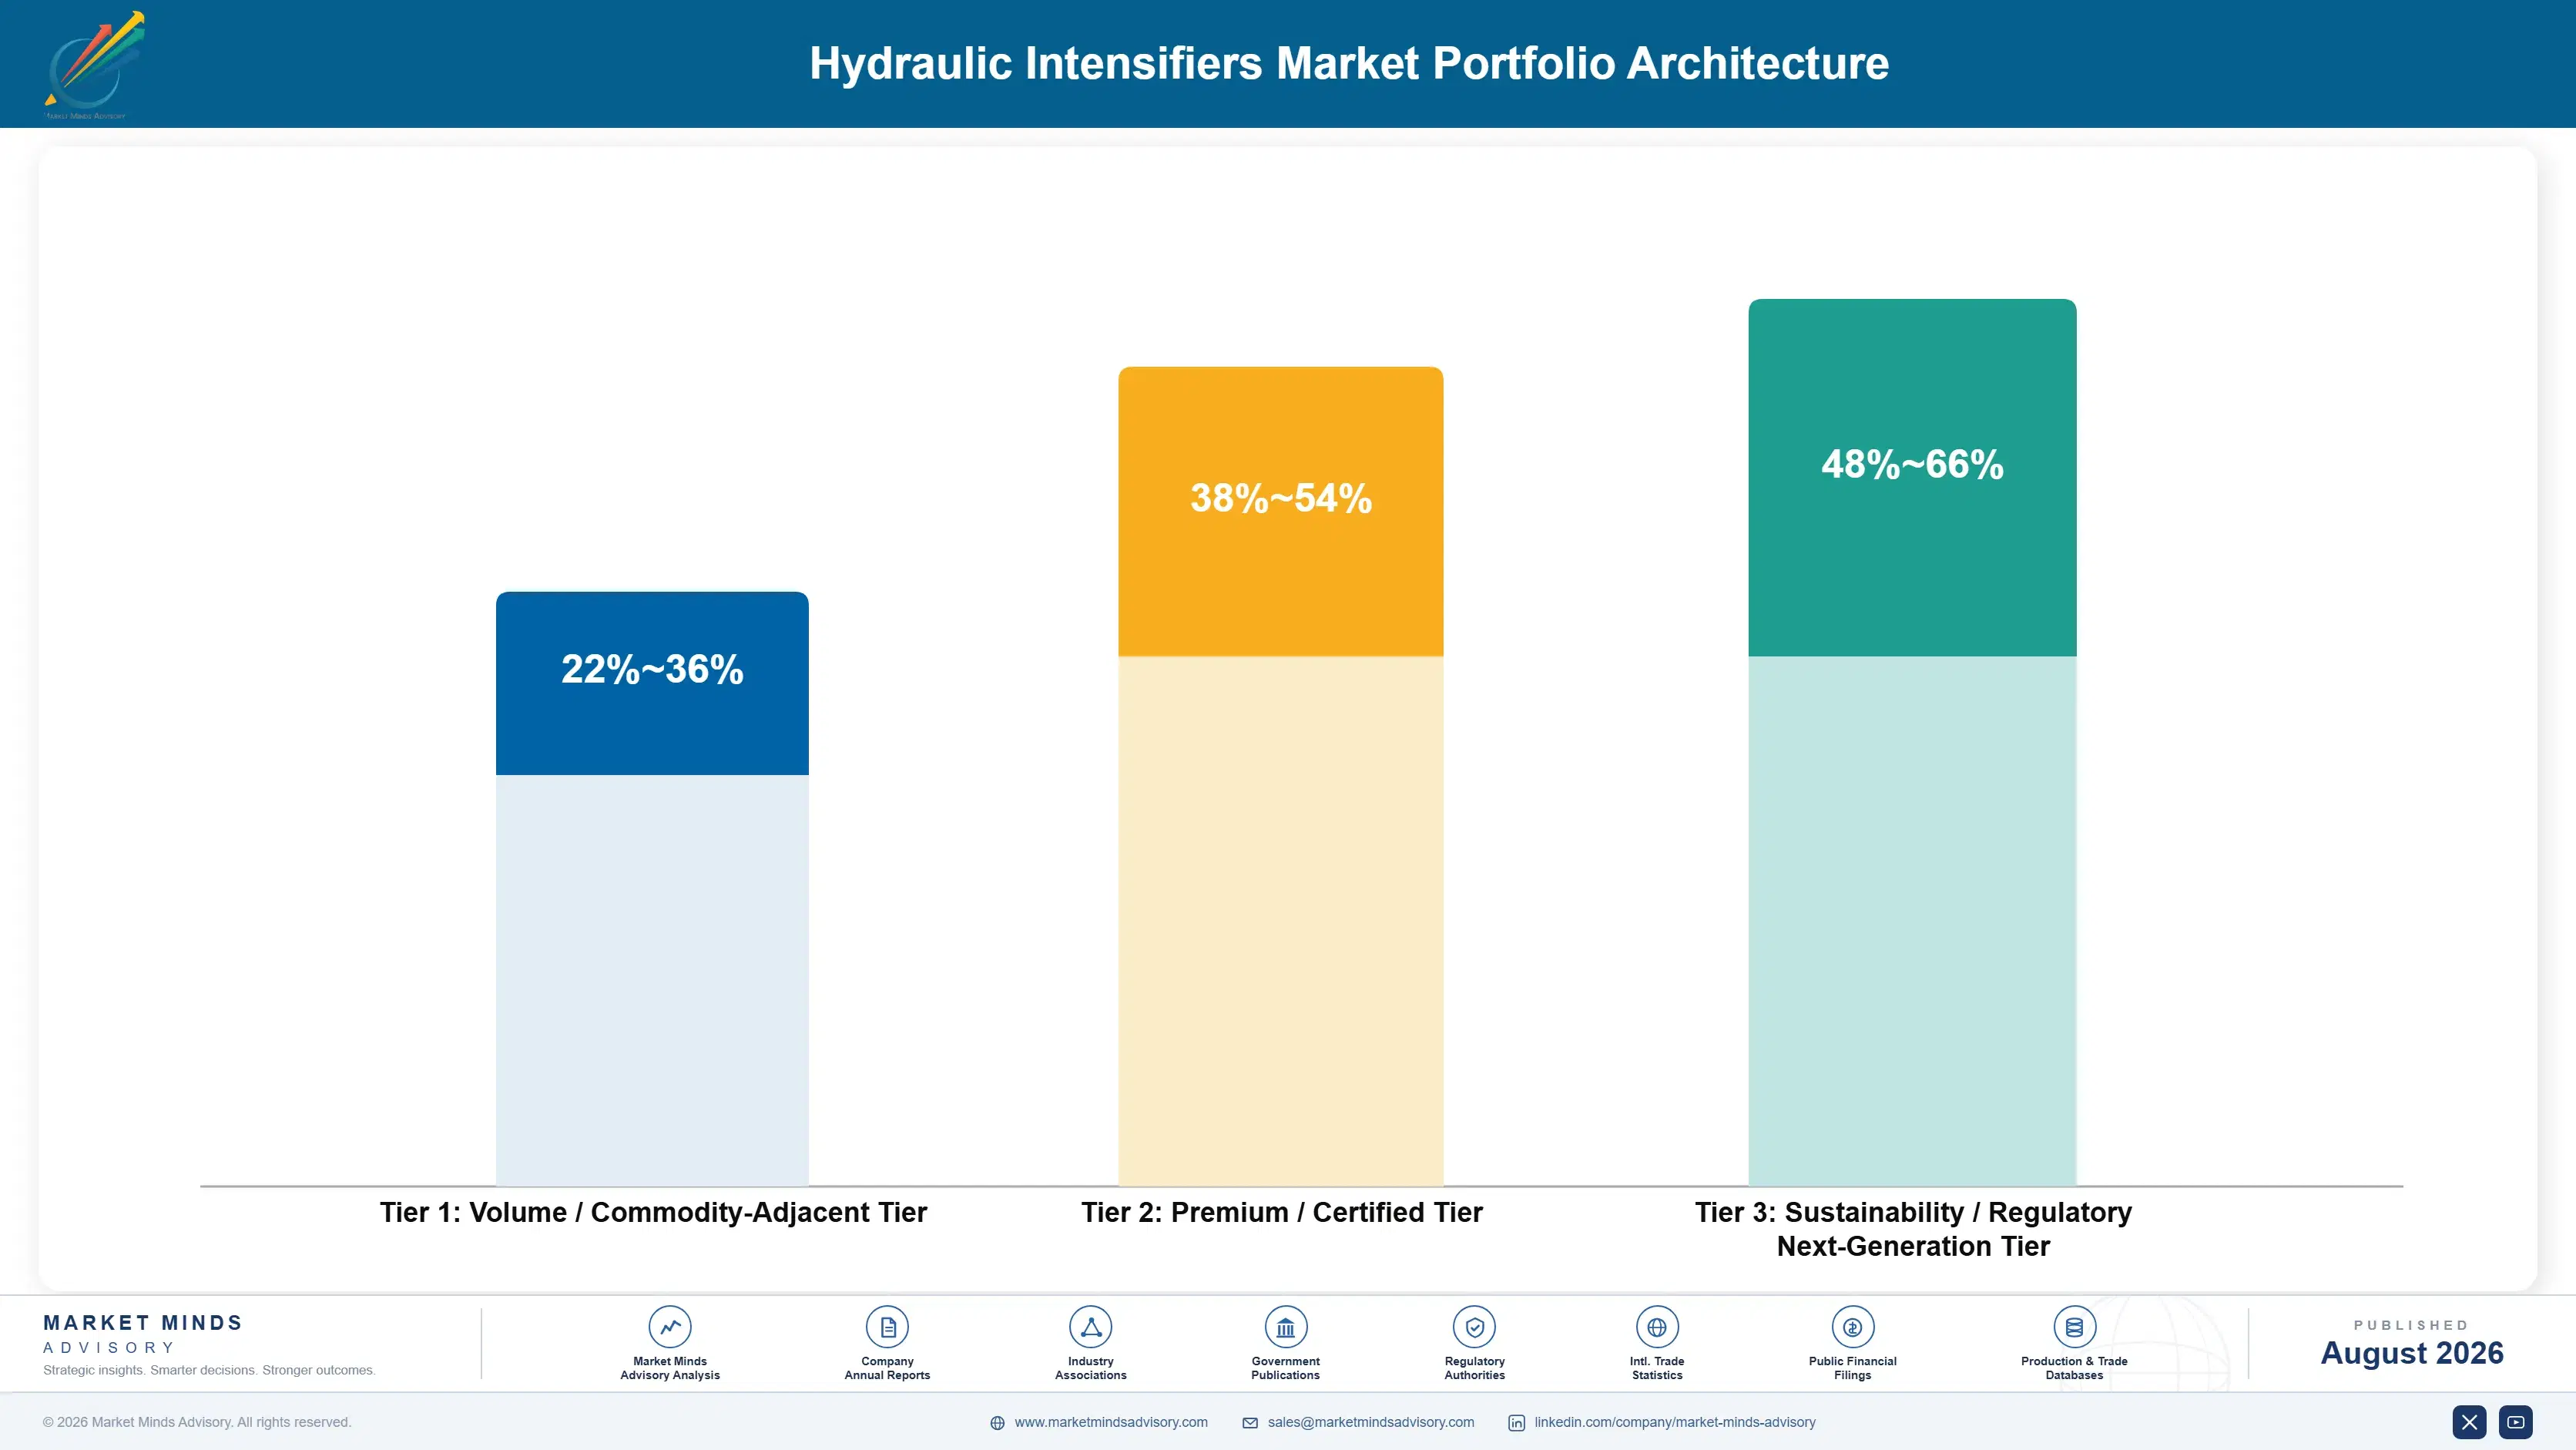
Three tiers with different economics sit inside this category, and pressure class draws the lines. Medium and high pressure boosters form the volume tier, where Chinese and Indian manufacturers compete effectively and the engineering is well understood. Ultra-high pressure units earn more because seal packages, service coverage, and application engineering separate suppliers. Hyper pressure prices highest of all, since documented fatigue life restricts the field to perhaps six firms.
The tension here is between equipment revenue that shows up this quarter and aftermarket revenue that accumulates over twelve to eighteen years. Sales organisations are compensated on the first and largely indifferent to the second, which is how third-party seal suppliers took so much of the consumables stream. Suppliers who fixed the incentive found the aftermarket margin considerably better than anything the original sale carried.

High-value pools concentrate where qualification or service limits competition: hyper pressure bodies with documented fatigue history, continuous duty installations in food processing and offshore testing, and proprietary seal packages that only the original manufacturer supplies. The commodity end is medium pressure boosters sold through general fluid power distribution, where Asian manufacturers set the price. High pressure sits between, contested and reasonably profitable.

Volume / Commodity-Adjacent Tier

Medium and high pressure boosters sold through general fluid power distribution into presses, clamping, and machine tools. The range is wide because Asian manufacturing cost positions and Western engineering overheads produce entirely different economics at similar selling prices.
Gross Margin: 22-36%

Premium / Certified Tier

Ultra-high pressure units for waterjet cutting and pressure testing, sold with application engineering and service coverage. The range is wide because suppliers holding the aftermarket earn very differently from those who sell the machine and lose the consumables.
Gross Margin: 38-54%

Sustainability / Regulatory / Next-Generation Tier

Hyper pressure bodies with documented fatigue qualification, plus continuous duty installations in food processing and deepwater testing. The range is wide because fatigue test investment is a fixed cost recovered across very different unit volumes between suppliers.
Gross Margin: 48-66%
hydraulic-intensifiers-market-portfolio-architecture-1787332576583

High-value Sub-segments and Strategic Watch-out

Hyper Pressure (Above 6,500 bar)

High value and high growth at 10.4%, the fastest class, because waterjet systems and food processing vessels keep pushing operating pressure upward. Documented cyclic fatigue life rather than price decides accounts here, which restricts credible supply to perhaps six firms worldwide. Test history is the entry ticket.
Gross Margin: 48-66%

Ultra-High Pressure (4,000 to 6,500 bar)

High value with strong growth at 8.2% and the largest share of category value, covering most waterjet cutting and a large part of pressure testing. Service coverage and seal supply, not technical qualification, separate suppliers in this class. Aftermarket economics decide the whole business case.
Gross Margin: 38-54%

Very High Pressure (1,500 to 4,000 bar)

The volume core by units at 6.4%, serving bolt tensioning, hydroforming, and general pressure testing where the engineering is established and a dozen suppliers compete. Growth tracks industrial capital spending closely and offers no particular defensive advantage to anybody. Competent, contested, and largely unremarkable work throughout.
Gross Margin: 30-46%

Medium Pressure (Below 700 bar)

The strategic watch-out at 3.3%, where Asian manufacturers now build competent units at prices Western builders cannot approach and the application rarely justifies premium engineering. Volume holds but value erodes, and defending it consumes capital better spent higher up the range. Sourcing beats manufacturing in this class.
Gross Margin: 22-36%

How Pressure Demand Actually Repeats

Demand commits at machine specification and then repeats as consumables for twelve to eighteen years. A waterjet running two shifts consumes a seal package roughly monthly, and across a machine life cumulative parts spend exceeds the original purchase several times over. That is the annuity, and the whole reason aftermarket carries 38% of category revenue. The initial sale is really the price of entry to it.
Stickiness varies enormously by vertical and by duty cycle. Food processing sticks hardest, since a validated process cannot change a component without revalidation and the regulator takes an interest. Offshore test houses stick almost as hard through accreditation. Press and clamping applications stick through system integration, because the intensifier arrived inside a machine somebody else specified. Fabrication job shops stick least: they buy seals from whoever ships same day.

The buyer profile has shifted from a hydraulics engineer to a production or maintenance manager who thinks in uptime rather than in bar. That person wants a service level agreement, spare part availability, and predictable consumables cost, and pays a premium for all three. Suppliers still presenting pressure curves and area ratios are answering a technical question the buyer stopped asking a decade ago.
hydraulic-intensifiers-market-end-use-penetration-index-1787332577070

Our Call On Pressure Intensifiers

These are among the four positions where our research anticipates prominent divergence between winners and laggards over the coming forecast period. Each is grounded in the demand model, the regulatory perimeter, and the announced capacity pipeline.
01 / AFTERMARKET CAPTURE PRIORITY

The machine is entry, the seals are the business

Seal packages last 400 to 900 hours and get replaced monthly on continuous duty, which over a 12 to 18 year machine life produces cumulative consumables spend several times the original purchase price. Aftermarket already carries 38% of category revenue, and every point of that lost to a third-party seal maker is margin the original manufacturer designed, qualified, and then gave away. Suppliers compensating sales teams on equipment revenue alone have built an organisation optimised for the least valuable half of their own product.
02 / FATIGUE QUALIFICATION INVESTMENT

Documented cycle life is the only real barrier

Above 4,000 bar the buyer has exactly one question, which is whether the cylinder body survives, and only documented cyclic fatigue testing at rated pressure answers it. Building that evidence costs roughly USD 900,000 in rig time and two years of elapsed testing, which is precisely why perhaps six firms worldwide can supply hyper pressure with credible history. That barrier is also why the class carries almost no price competition and the widest margins anywhere in this entire category today.
03 / CONTINUOUS DUTY TARGETING

Chase production schedules, not job shops

A food processing line or an accredited subsea test house runs its intensifier continuously, which makes seal consumption predictable, turns the relationship into a supply contract, and produces roughly three times the lifetime revenue of the same machine in a fabrication shop. Job shop demand also collapses first in any downturn, since a pressure upgrade is a productivity improvement rather than a capability the customer lacks. Sales organisations built around machine tool distribution cannot reach the better channel, and that gap costs more than any product deficiency.
04 / MEDIUM PRESSURE REALISM

Source the bottom class and defend the top

Medium pressure boosters grow at 3.3% while Asian manufacturers build competent units at prices no Western builder approaches, and the application rarely justifies the engineering overhead a specialist carries. Capital spent defending that class earns less than the same capital spent on fatigue qualification or service coverage higher up the range, where competition is thin and margin is wide. Sourcing rather than manufacturing the bottom class keeps the distribution relationship without funding a position that erodes a little further every year.

Engagement Snapshot From the Field

A live engagement with an industry participant carrying material or product regulatory and market exposure ahead of a defining policy shift, showing how our research translates into a defensible multi-year portfolio strategy.
MARKET MINDS ADVISORY · CLIENT ENGAGEMENT SUMMARY
Hydraulic Intensifiers Producer Strategic Portfolio Review and Transition Roadmap 2026·Investment Scenario on Hydraulic Intensifiers Exposure Evaluation 2025-26
CLIENT PROFILE
A European pressure equipment manufacturer with roughly USD 62 million in annual revenue engaged MMA after realising its aftermarket revenue share had fallen to 19%, against a category norm nearer 38% (client-reported, unverified by MMA). The company built well-regarded ultra-high pressure units and had installed several thousand over two decades, yet saw almost none of the consumables spend those machines generated.
STRATEGIC CHALLENGE
The commercial director attributed the gap to pricing and wanted seal prices cut. Engineering believed customers preferred third-party parts because delivery was faster. Nobody had asked the installed base directly, and the two explanations implied completely different remedies. The board needed a position before the next budget cycle, having already deferred the question twice.
MMA APPROACH
MMA contacted 140 operators of the client's installed machines and asked where they bought seals, why, and what would change it. We mapped the client's service coverage against the geographic distribution of that installed base. We then modelled the revenue effect of three interventions: a price reduction, a stocked-parts network, and a proprietary seal geometry that third parties could not readily copy.
KEY FINDINGS
  1. Price ranked fourth among reasons for buying third-party seals, behind delivery time, local stock, and the third party's willingness to send an engineer (client-reported, unverified by MMA).
  2. Roughly 60% of the installed base sat more than a day's shipping from any stocked parts location the client operated or supplied through.
  3. The client's seal geometry matched a widely available catalogue profile, so three independent suppliers could produce an equivalent without any reverse engineering at all.
  4. Operators reported willingness to pay a premium above third-party pricing for guaranteed next-day availability, which the price reduction model had assumed impossible.
CLIENT PROFILE
A European pressure equipment manufacturer with roughly USD 62 million in annual revenue engaged MMA after realising its aftermarket revenue share had fallen to 19%, against a category norm nearer 38% (client-reported, unverified by MMA). The company built well-regarded ultra-high pressure units and had installed several thousand over two decades, yet saw almost none of the consumables spend those machines generated.
STRATEGIC CHALLENGE
The commercial director attributed the gap to pricing and wanted seal prices cut. Engineering believed customers preferred third-party parts because delivery was faster. Nobody had asked the installed base directly, and the two explanations implied completely different remedies. The board needed a position before the next budget cycle, having already deferred the question twice.
MMA APPROACH
MMA contacted 140 operators of the client's installed machines and asked where they bought seals, why, and what would change it. We mapped the client's service coverage against the geographic distribution of that installed base. We then modelled the revenue effect of three interventions: a price reduction, a stocked-parts network, and a proprietary seal geometry that third parties could not readily copy.
KEY FINDINGS
  1. Price ranked fourth among reasons for buying third-party seals, behind delivery time, local stock, and the third party's willingness to send an engineer (client-reported, unverified by MMA).
  2. Roughly 60% of the installed base sat more than a day's shipping from any stocked parts location the client operated or supplied through.
  3. The client's seal geometry matched a widely available catalogue profile, so three independent suppliers could produce an equivalent without any reverse engineering at all.
  4. Operators reported willingness to pay a premium above third-party pricing for guaranteed next-day availability, which the price reduction model had assumed impossible.
RECOMMENDED STRATEGY
Phase 1: Phase 1 (0 to 9 months): Abandon the price reduction and establish stocked parts positions covering the three densest installed base regions. Phase 2: Phase 2 (9 to 24 months): Introduce a proprietary seal geometry on new machines and offer guaranteed next-day availability as a paid service. Phase 3: Phase 3 (24 to 42 months): Extend stocked coverage to remaining territories and shift sales compensation onto lifetime account value.
OUTCOME
The client cancelled the planned price reduction and funded three stocked parts positions instead. Aftermarket revenue share rose materially over the following eighteen months at unchanged seal pricing, and the proprietary geometry now ships on all new machines (client-reported, unverified by MMA). Sales compensation was changed later than recommended and remains a source of internal argument.

Frequently Asked Questions

Foundational context covering the market sizes, CAGR, scope, country, region and competition that inform every finding below. This section is provided to cover basics and most often pre-purchase conversations, answered from the MMA Primary Research Dataset.

What is the current size of the Hydraulic Intensifiers Market?

The global market is valued at USD 0.9 billion in 2025, covering hydraulic pressure intensifiers and booster units across medium through hyper pressure classes. Pumps, accumulators, cylinders, and complete waterjet machines are excluded.

How large will the Hydraulic Intensifiers Market be by 2036?

The market is forecast to reach USD 1.72 billion by 2036 in the base case, about 1.81 times the 2026 level. That represents incremental value of roughly USD 0.77 billion.

What is the CAGR for the Hydraulic Intensifiers Market 2026 to 2036?

The market grows at a 6.1% CAGR in the base case, with bull and bear scenarios at 7.3% and 4.9%. The spread turns on food processing adoption and on fabrication capital spending.

Which segment is growing fastest?

Hyper pressure units above 6,500 bar grow fastest at 10.4%, about 1.70 times the overall rate, as waterjet and food processing pressures climb. Ultra-high pressure follows at 8.2%.

Who are the major companies in the Hydraulic Intensifiers Market?

Leading participants include Bosch Rexroth, Parker Hannifin, KAMAT, Hydratron, and Maximator. Concentration sits at roughly 54%, with specialist engineering firms holding the highest pressure classes almost entirely.

Which country is growing fastest?

India grows fastest at an 8.9% CAGR, driven by fabrication capacity expansion and by defence and space pressure testing previously sent overseas. China follows on new waterjet installations.

Report Segmentation Architecture

The full report scope spans multiple orthogonal segmentation dimensions, with cross-tabulated demand data provided for each dimension pair. Coverage extends further to regional breakdowns, trend trajectories, and the competitive detail needed to support segment-level decision-making.

By Output Pressure Class

  • Hyper Pressure Above 6,500 Bar
  • Ultra-High Pressure 4,000 to 6,500 Bar
  • Very High Pressure 1,500 to 4,000 Bar
  • High Pressure 700 to 1,500 Bar
  • Medium Pressure Below 700 Bar

By End-Use Industry

  • Metal Fabrication and Waterjet Cutting
  • Food and Beverage Processing
  • Oil Gas and Subsea Testing
  • Automotive and Press Manufacturing
  • Aerospace and Defence Test

By Sales Model

  • Direct Sale to End User
  • Machine Builder OEM Supply
  • Fluid Power Distribution
  • Service Contract and Parts Supply

By Region

  • North America
  • Western Europe
  • East Asia
  • South Asia and Pacific
  • Latin America
  • Middle East and Africa
  • Eastern Europe

Scope, Methodology, and Coverage

Every figure in this report is reproducible from documented input assumptions. The scope below maps the historical period, the forecast horizon, the segmentation dimensions, and the countries covered, alongside the underlying primary and qualitative methodology.
Historical Period
2020 to 2025
Forecast Period
2026 to 2036
Base Year
2025 (USD billions; MMA Primary Research Dataset, August 2026)
Market Definition
The hydraulic intensifiers market comprises the manufacture and sale of pressure boosting devices that use a differential piston area to raise the pressure of a liquid working medium above the level the driving pump or supply delivers, valued at manufacturer selling prices to end users, machine builders, fluid power distributors, and service contractors. It spans hydraulic-driven and air-driven units operating on oil, water, and emulsion media across medium, high, very high, ultra-high, and hyper pressure classes, together with the seal packages, plungers, check valves, and cylinder heads supplied as dedicated consumables for those units. Hydraulic pumps of every positive displacement type, accumulators, cylinders and actuators, directional and pressure control valves, complete waterjet cutting machines and their motion systems, gas compressors and gas boosters, and high-pressure vessels themselves are excluded. Pressure testing services and equipment certification services are outside scope.
Quantitative Units
USD billions (current prices); volume in thousands of units shipped
Segmentation Dimensions
By Output Pressure Class; By End-Use Industry; By Sales Model; By Region
Regions Covered
North America, Western Europe, East Asia, South Asia and Pacific, Latin America, Middle East and Africa, Eastern Europe
Countries Covered
USA, Canada, Mexico, Germany, Italy, Denmark, France, Spain, UK, Netherlands, Sweden, Switzerland, China, Japan, South Korea, Taiwan, India, Australia, Singapore, Vietnam, Thailand, Brazil, Chile, Peru, Colombia, Argentina, Saudi Arabia, United Arab Emirates, Qatar, Nigeria, Angola, South Africa, Turkey, Poland, Czechia, Slovakia, Romania, and additional markets relevant to this sector
Key Companies Profiled
Bosch Rexroth, Parker Hannifin, KAMAT, Hydratron, Maximator, Flow International, KMT Waterjet, Haskel International, Hi-Force, Enerpac, SITEMA, Tox Pressotechnik, Minibooster Hydraulics, Scanwill Fluid Power, Resato International, Uraca, Hydro-Pac, Hammelmann, Interpump Group, Yuken Kogyo
Quantitative Methodology
Primary survey, n=3,800 respondents, Q4 2025, six countries; demand-side model with trade association cross-validation
Qualitative Methodology
47 expert interviews, Q4 2025; applied to validate demand model assumptions, identify emerging dynamics, and assess competitive positioning
Report Format
PDF and XLSX data workbook (Word format preview document)
Publisher
Market Minds Advisory
Report Code
MMA-2026-CON-435
Published
August 2026
Contact
sales@marketmindsadvisory.com | www.marketmindsadvisory.com

Purchase the full Hydraulic Intensifiers Market Report (2026 to 2036).

The full MMA Hydraulic Intensifiers report sizes the market across five output pressure classes, five end-use industries, four sales models, and seven regions through 2036. It profiles 20 participants on a consistent basis of intensifier and booster revenue including dedicated consumables, scoring each on documented fatigue qualification, seal package ownership, service coverage, and continuous duty channel access. Scenario models quantify how waterjet pressure migration, high-pressure food processing adoption, and fabrication capital cycles move both volume and achievable margin. The report also includes aftermarket capture benchmarking by supplier, seal consumption modelling by duty cycle, fatigue qualification status by pressure class, and installed base mapping across the four largest end-use industries.
Five-pressure-class and four-channel market sizing to 2036
Twenty-participant benchmark on intensifier and consumables revenue
Aftermarket capture rate benchmarking by supplier and region
Seal consumption modelling by duty cycle and application
Fatigue qualification status by supplier and pressure class
Installed base mapping across the four largest industries

Built For The People Who Decide

From boardroom strategy to bench-side execution, this report is read cover-to-cover by leaders shaping the next decade of their industry, turning demand scenarios, market dynamics and valuation benchmarks into decisions.
CXOs/ Presidents/ VPs/ Managers
M&A and Corporate Development
Strategy Teams and R&D Heads
Procurement and Product Directors
Regulatory and Compliance Leaders
Investor Relations and Equity Analysts