Market Minds Advisory
Hydraulic Fluids Market

Hydraulic Fluids Market: Approval lock, drain interval erosion and chemistry conversion to 2036

Drain intervals doubled over twenty years and nobody in this industry celebrated, because every hour of extended fluid life is a litre that somebody does not get to sell next year.

Lead Analyst

Bilal Shaikh

Published

September 2026

Make Smarter Decisions with Customized Research Insights

Request a free sample report and evaluate market opportunities, growth trends, and competitive dynamics relevant to your business needs.

2025 MARKET VALUE$9.8BMarket Size 2025
2036 FORECAST VALUE$15.7BBase Case , 2026 to 2036
CAGR 2026 TO 20364.4 %Bull 5.6% / Bear 3.2%
INCREMENTAL OPPORTUNITY$5.5BNet 10- year value creation
EXPANSION MULTIPLE1.54x2036 value over 2026 base
Strategic Levers
M&A Pipeline
Regional Outlook
Country Rankings
Competitive Intelligence
Segmental Deep-dive
Call-Us : 91 93563 13602

Executive Snapshot and Market Trajectory

This market grows on price rather than volume and has done for a decade. Drain intervals near 5,000 hours are roughly double what they were, filtration and condition monitoring keep extending them, and the litres disappearing get replaced by specifications that cost considerably more per litre.
Environmentally acceptable ester fluids grow at 6.6%, half again the market rate of 4.4%, pulled by the American Vessel General Permit and European Ecolabel requirements rather than by anybody's preference. East Asia holds 29% of value on construction equipment manufacture and industrial machinery output combined. The mineral oil business that still carries most of the volume grows at less than 3%. Two very different businesses reported as one.
Five blenders hold 39% of supply and the number tells you almost nothing about who has power here. Around 71% of aftermarket purchases follow the equipment maker's specification, which means the real customer is an approval department at Caterpillar or Bosch Rexroth rather than the contractor buying the drum. A blender without those approvals competes for the remaining 29% on price alone, and that is a considerably worse business to be in.
Market Definition
This report covers fluids formulated for hydraulic power transmission in mobile and stationary equipment, spanning mineral oil, synthetic hydrocarbon, fire-resistant water-containing and synthetic, environmentally acceptable ester and polyalkylene glycol chemistries. Value is measured at blender level across factory fill and aftermarket channels. Excluded are engine oils, transmission and gear oils, metalworking fluids, brake fluids, base oil sold unblended, and hydraulic components or filtration equipment.
Base Year Value
$9.8B in 2025 (MMA Primary Research Dataset, August 2026)
Forecast Period
2026 to 2036, eleven discrete annual values
CAGR
4.4% base case. Bull 5.6%. Bear 3.2%.
Fastest Growth Segment
Environmentally Acceptable Ester Fluids: 6.6% CAGR
Fastest Growth Country
India: 7.1% CAGR
Fastest Growth Region
South Asia and Pacific: 6.5% CAGR
Largest Region
East Asia: 29% of 2025 global value
Market Leaders
Shell, ExxonMobil, TotalEnergies, BP Castrol and Fuchs lead the market. Source: MMA Primary Research Dataset, July 2026.
Primary Survey
n=3,800 procurement and R&D decision-makers, Q4 2025, six countries
Methodology
Demand-side build-up, cross-validated against public data, 47 expert interviews

Hydraulic Fluids Market Forecast Scenarios

hydraulic-fluids-market-trends-size-forecast-scenario-1787553278677
Growth ran at 3.4% between 2020 and 2025 and volume barely moved across the whole period. Construction and mining equipment utilisation recovered strongly after 2020, which should have lifted litres, and drain interval extension took most of that back. What actually raised the number was mix: fire-resistant and ester specifications displacing mineral oil in applications where regulation or insurance made the cheaper option unavailable.
The 4.4% base case rests on three mechanisms. Environmental regulation keeps converting marine, forestry and waterside applications to ester fluids at 6.6%, driven by the Vessel General Permit and European Ecolabel rather than any operator preference. Off-highway equipment output keeps growing in Asia and India, which adds factory fill and eventually aftermarket volume. And fire-resistant specifications keep spreading through steel, foundry and underground mining as insurers price the alternative properly.
The 5.6% bull case is fire-resistant conversion accelerating on insurance pressure, which would move meaningful volume out of mineral oil at three to four times the price. The 3.2% bear case is drain interval extension continuing faster than mix improvement: condition monitoring is getting cheaper and better, and a fluid that lasts 8,000 hours instead of 5,000 removes litres nobody replaces.

Who Actually Chooses The Fluid

The contractor buying the drum is not the customer. Around 71% of aftermarket hydraulic fluid purchases follow the specification printed in the equipment manual, which means the decision was made years earlier by an approval engineer at the machine builder who has never met the person paying. A blender's commercial job is therefore getting listed on specifications like Caterpillar TO-4 or the Bosch Rexroth fluid requirements, and everything downstream follows from that.
TOP-FIVE CONCENTRATION39%Combined position across hydraulic fluid supply held by leaders
BASE OIL COST SHARE62%Portion of blended fluid cost from base oil
AVERAGE DRAIN INTERVAL5,000 hoursTypical running period between fluid changes in mobile equipment
FACTORY FILL SHARE17%Portion of volume supplied at original equipment build
AFTERMARKET SPECIFICATION LOCK71%Share of aftermarket purchases following the equipment maker specification
FLUID VOLUME PER MACHINE340 litresAverage charge across a mid-size tracked excavator system
The volume arithmetic is uncomfortable. A mid-size tracked excavator holds around 340 litres and changes it roughly every 5,000 hours, which is about double the interval of twenty years ago. Better filtration, better additive chemistry and cheap condition monitoring keep pushing that out. Factory fill accounts for only 17% of volume, so the aftermarket is where the business sits, and the aftermarket shrinks every time somebody improves a filter.
Base oil takes around 62% of blended cost, which leaves the additive package and the approval work as the only places a blender adds anything a refiner could not. That is the whole competitive question in this industry compressed into one number. Very few blenders phrase it that way.
"Every improvement in filtration is revenue somebody loses and nobody in the fluid industry will say so publicly. The blenders that have done well are the ones who stopped selling litres and started selling the approval that makes the litres unavoidable."
Director, Lubricants and Industrial Fluids Practice · MMA Chemicals and Materials Practice · August 2026

Market Trends

Environmental regulation converts waterside applications to ester fluids

The American Vessel General Permit requires environmentally acceptable lubricants at every oil-to-sea interface on commercial vessels above a certain size operating in United States waters, and the European Ecolabel criteria push the same direction on inland waterways and forestry equipment. That turned a niche product into a specification requirement. Growth at 6.6% follows the regulation rather than any operator enthusiasm, since ester fluids cost more and demand tighter water contamination control. Blenders holding the approvals early are collecting on them now, and the conversion has some years left to run across dredging, port equipment and hydroelectric installations.
Market Impact: Controls 71% of aftermarket volume
Off-highway electrification changes fluid requirements more than volume

A battery-electric excavator still runs hydraulics and still holds a few hundred litres, so the volume loss is smaller than most forecasts assume. What changes is the specification. No engine means lower ambient temperature and different viscosity choices, integrated electric pump motors mean the fluid sits against windings and needs electrical compatibility nobody previously tested for, and duty cycles shift because an electric machine is used differently. Blenders that treated this as a volume threat missed the point entirely: it is a requalification opportunity on machines where the incumbent approval does not automatically carry across.
Market Impact: Costs 4 times mineral oil

Market Opportunities and Growth Drivers

Equipment maker specifications control most aftermarket purchasing

Around 71% of aftermarket volume goes to whatever the equipment manual specifies, and machine builders write those specifications to protect warranty exposure rather than to help anybody's procurement. A blender listed on a Caterpillar, Komatsu or Bosch Rexroth specification therefore inherits demand for the operating life of every machine sold with it, which in construction equipment runs a decade or more. Getting listed requires component rig testing, field validation and a relationship with an approval department that takes years to build. It is the single most valuable asset a hydraulic fluid business owns and it appears on no balance sheet.
Market Impact: Extends drains past 5,000 hours

Fire-resistant specifications spread as insurers price the alternative

A hydraulic line failure near molten metal or in an underground mine is a fire, and the industry has enough history on that to make the arithmetic clear. Insurers have started pricing mineral oil systems in those environments at rates that make fire-resistant fluid cheaper overall, which converts a safety argument into a procurement one. Steel plants, die casting operations and underground coal are the main conversions. The fluids cost three to four times mineral oil and require seal compatibility work that plant engineers dislike, which slows adoption without stopping it. Growth here runs ahead of the mineral oil business.
Market Impact: Sets 62% of blended cost

Market Restraints and Challenges

Drain interval extension removes volume nobody replaces

Average drain intervals near 5,000 hours are roughly double what they were twenty years ago, and every improvement in filtration, additive chemistry or condition monitoring pushes them further out. The root cause is that the customer's interest and the supplier's interest point in opposite directions, and the customer has been winning steadily. Commercially this means the industry's volume base erodes even while equipment populations grow. Blenders have responded by moving into fluid condition monitoring services, which converts the extension from a threat into a revenue line, and by pushing higher-value chemistries where the price per litre offsets the litres lost.
Market Impact: Segment compounding at 6.6%

Base oil supply concentration leaves blenders with thin control

Base oil accounts for around 62% of blended fluid cost and comes from refineries that a blender mostly does not own, which leaves very little of the cost structure under anybody's control. The root problem is that Group II and Group III base oil capacity sits with a handful of integrated majors and Asian producers, and independent blenders buy at merchant prices that move with crude and refinery margins together. Commercially this compresses independent margins whenever base oil tightens. Some have secured multi-year supply agreements, others have qualified re-refined base oil which is cheaper and carries its own approval burden.
Market Impact: Requalifies 340 litre systems
4 additional market trends, 2 additional growth drivers, and 3 additional restraints and challenges are covered in the full report. Contact sales@marketmindsadvisory.com to access the complete intelligence.

Segment CAGR and Growth Architecture

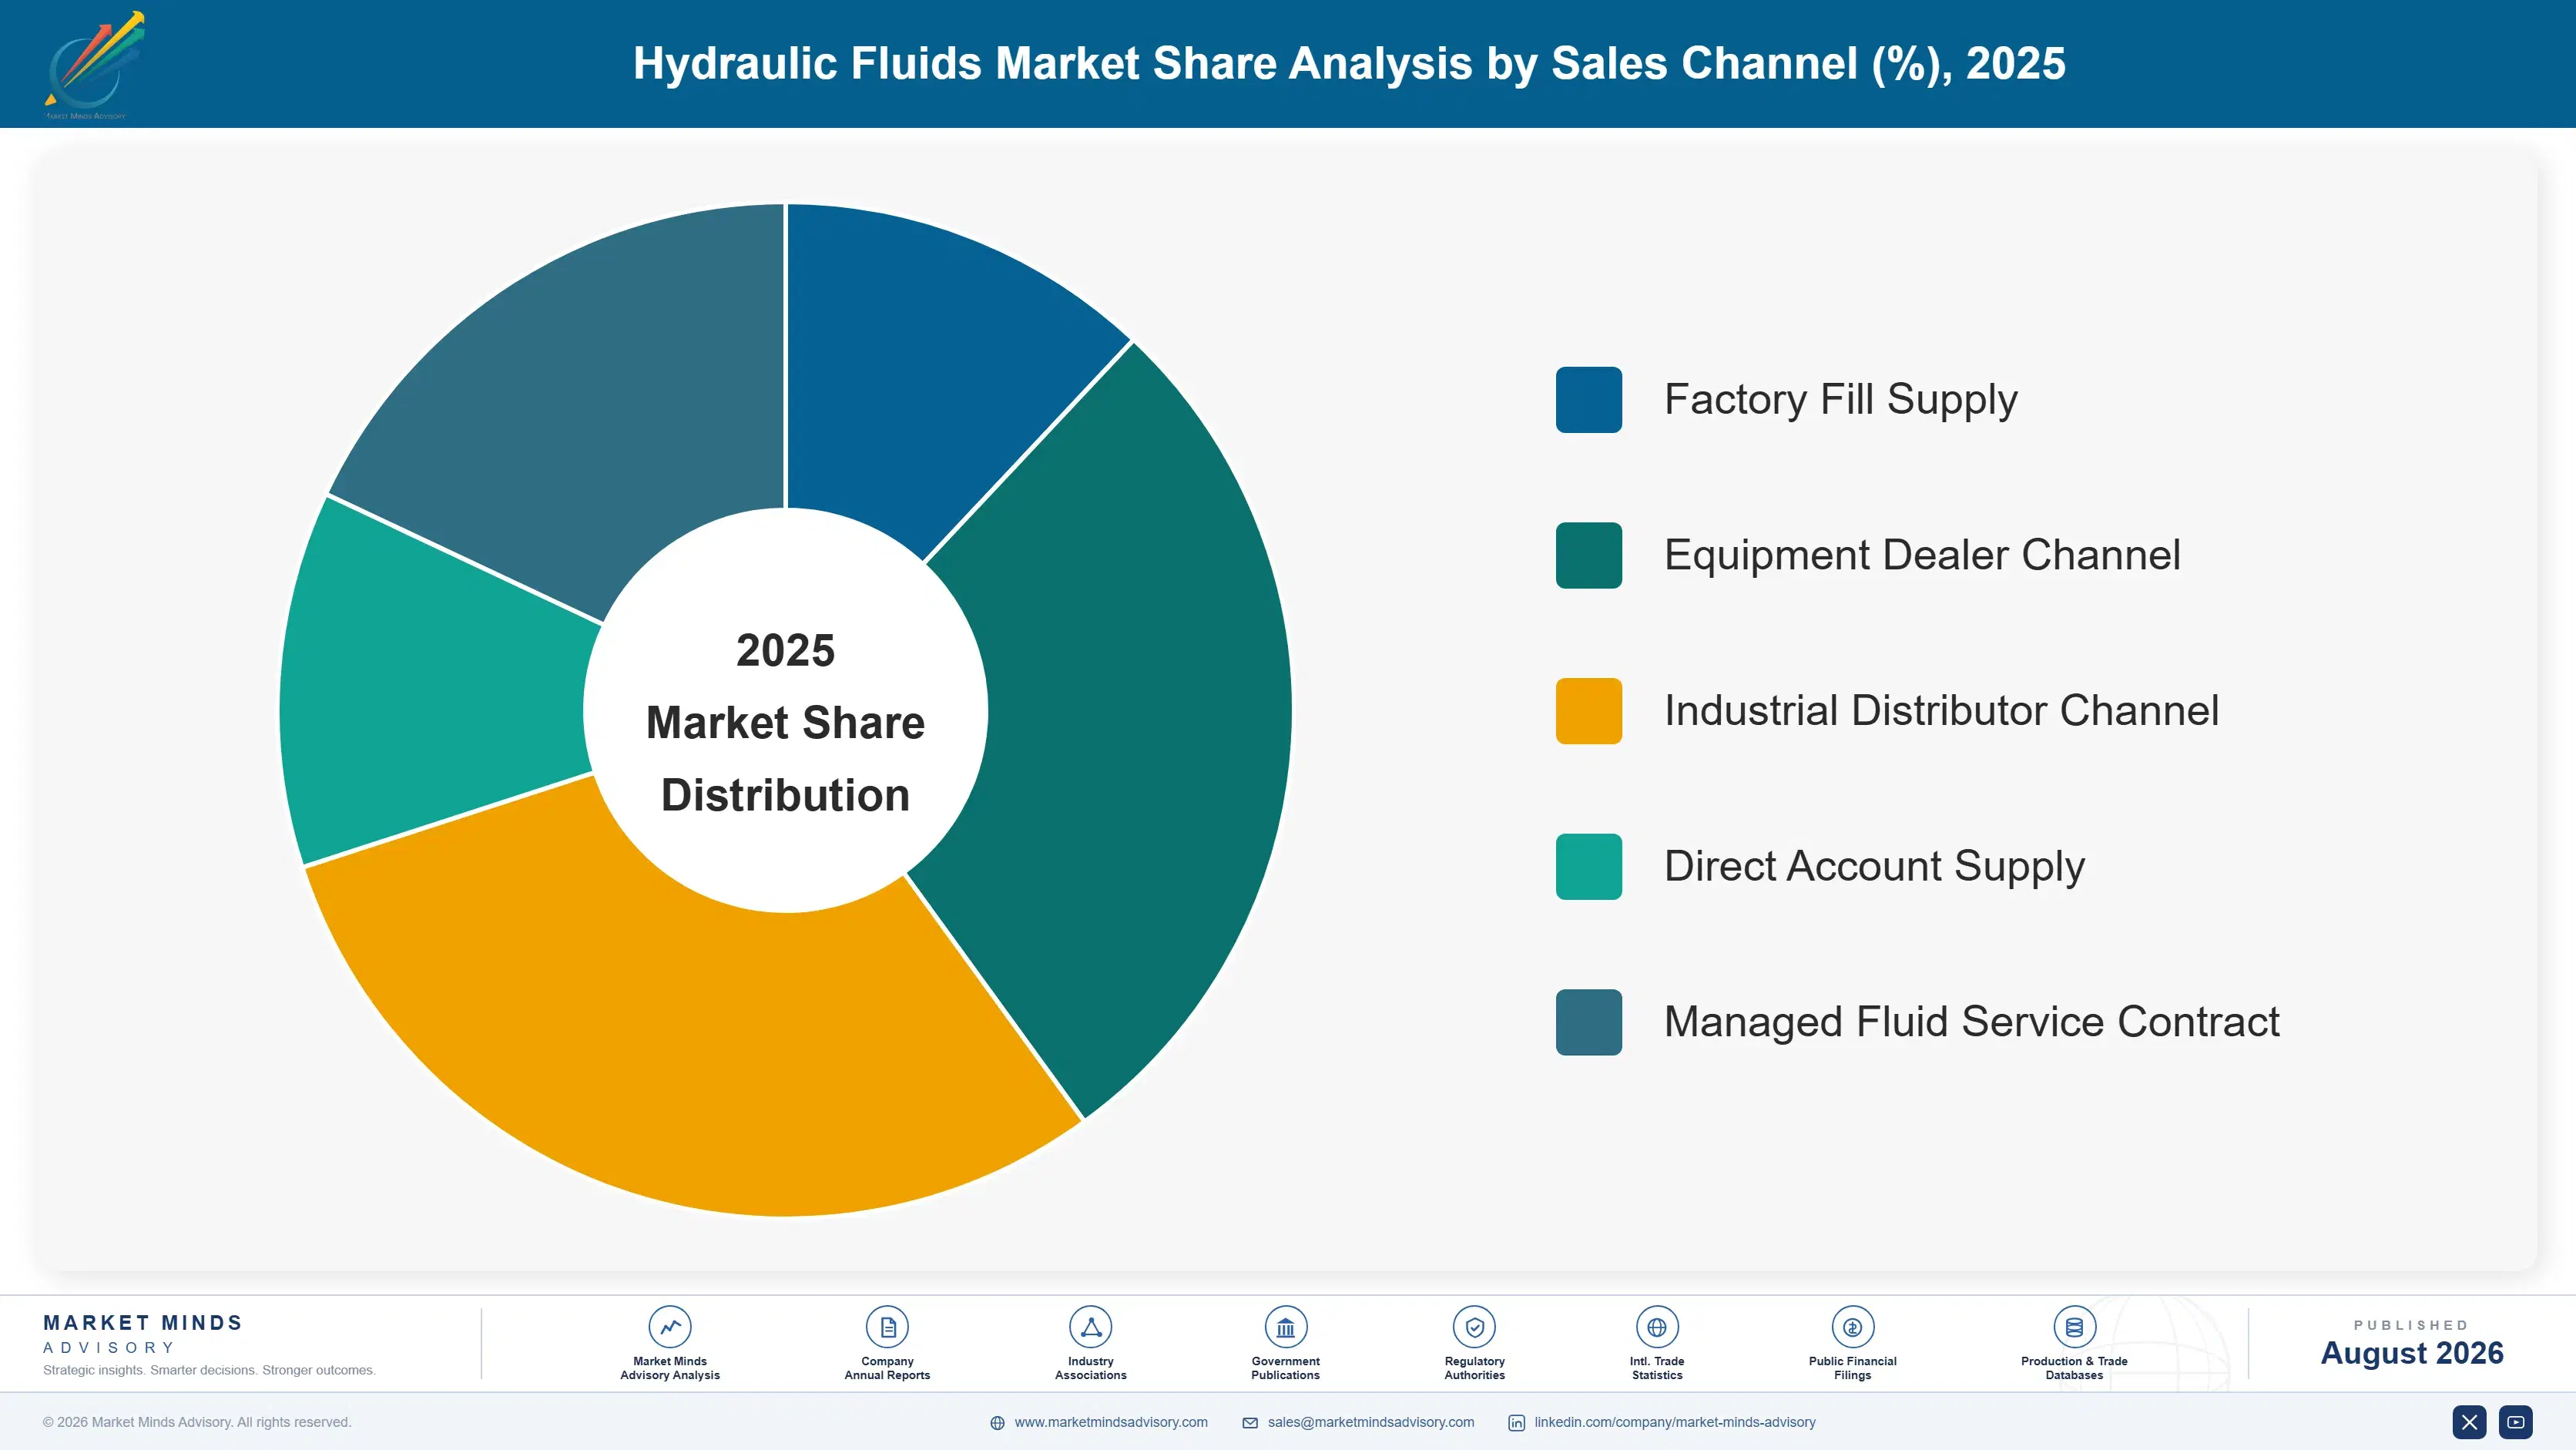
Fluids are classified here by base chemistry, since that determines fire resistance, biodegradability, seal compatibility and price, which between them decide every application question. Equipment type, viscosity grade and sales channel are handled separately in the framework, because a single chemistry serves mobile and stationary equipment across several industries at once. Chemistry decides everything downstream.
hydraulic-fluids-market-trends-market-share-analysis-1787553279213

Environmentally Acceptable Ester Fluids

Growing at 6.6%, half again the market rate, this segment exists because regulation created it rather than because anybody wanted a more expensive fluid. Synthetic and vegetable esters biodegrade quickly and carry low aquatic toxicity, which is what the Vessel General Permit and European Ecolabel criteria require at oil-to-sea and oil-to-ground interfaces. Marine deck equipment, dredgers, forestry machines and hydroelectric gates take most of the volume. The technical cost is real: esters hydrolyse in the presence of water, so contamination control matters far more than with mineral oil, and seal compatibility needs checking on older equipment. Blenders holding early approvals are collecting on work funded years before the regulation arrived.
CAGR 6.6%

Synthetic Hydrocarbon Fluids

Polyalphaolefin fluids sit here and the commercial argument for them is drain interval, which is a strange thing for a fluid supplier to be selling. A synthetic charge lasts considerably longer than mineral oil at temperature, tolerates cold starting better, and costs several times as much per litre. Growth at 6.1% comes from mobile equipment operating in extreme climates and from stationary systems where a change-out means shutting a production line. Mining fleets in northern Canada and Scandinavia converted years ago and never went back. The interesting question is whether the price per litre genuinely offsets the litres not sold, and for most blenders the honest answer is that it depends entirely on the account.
CAGR 6.1%
Full segment breakdown across 6 segments available in the complete report.

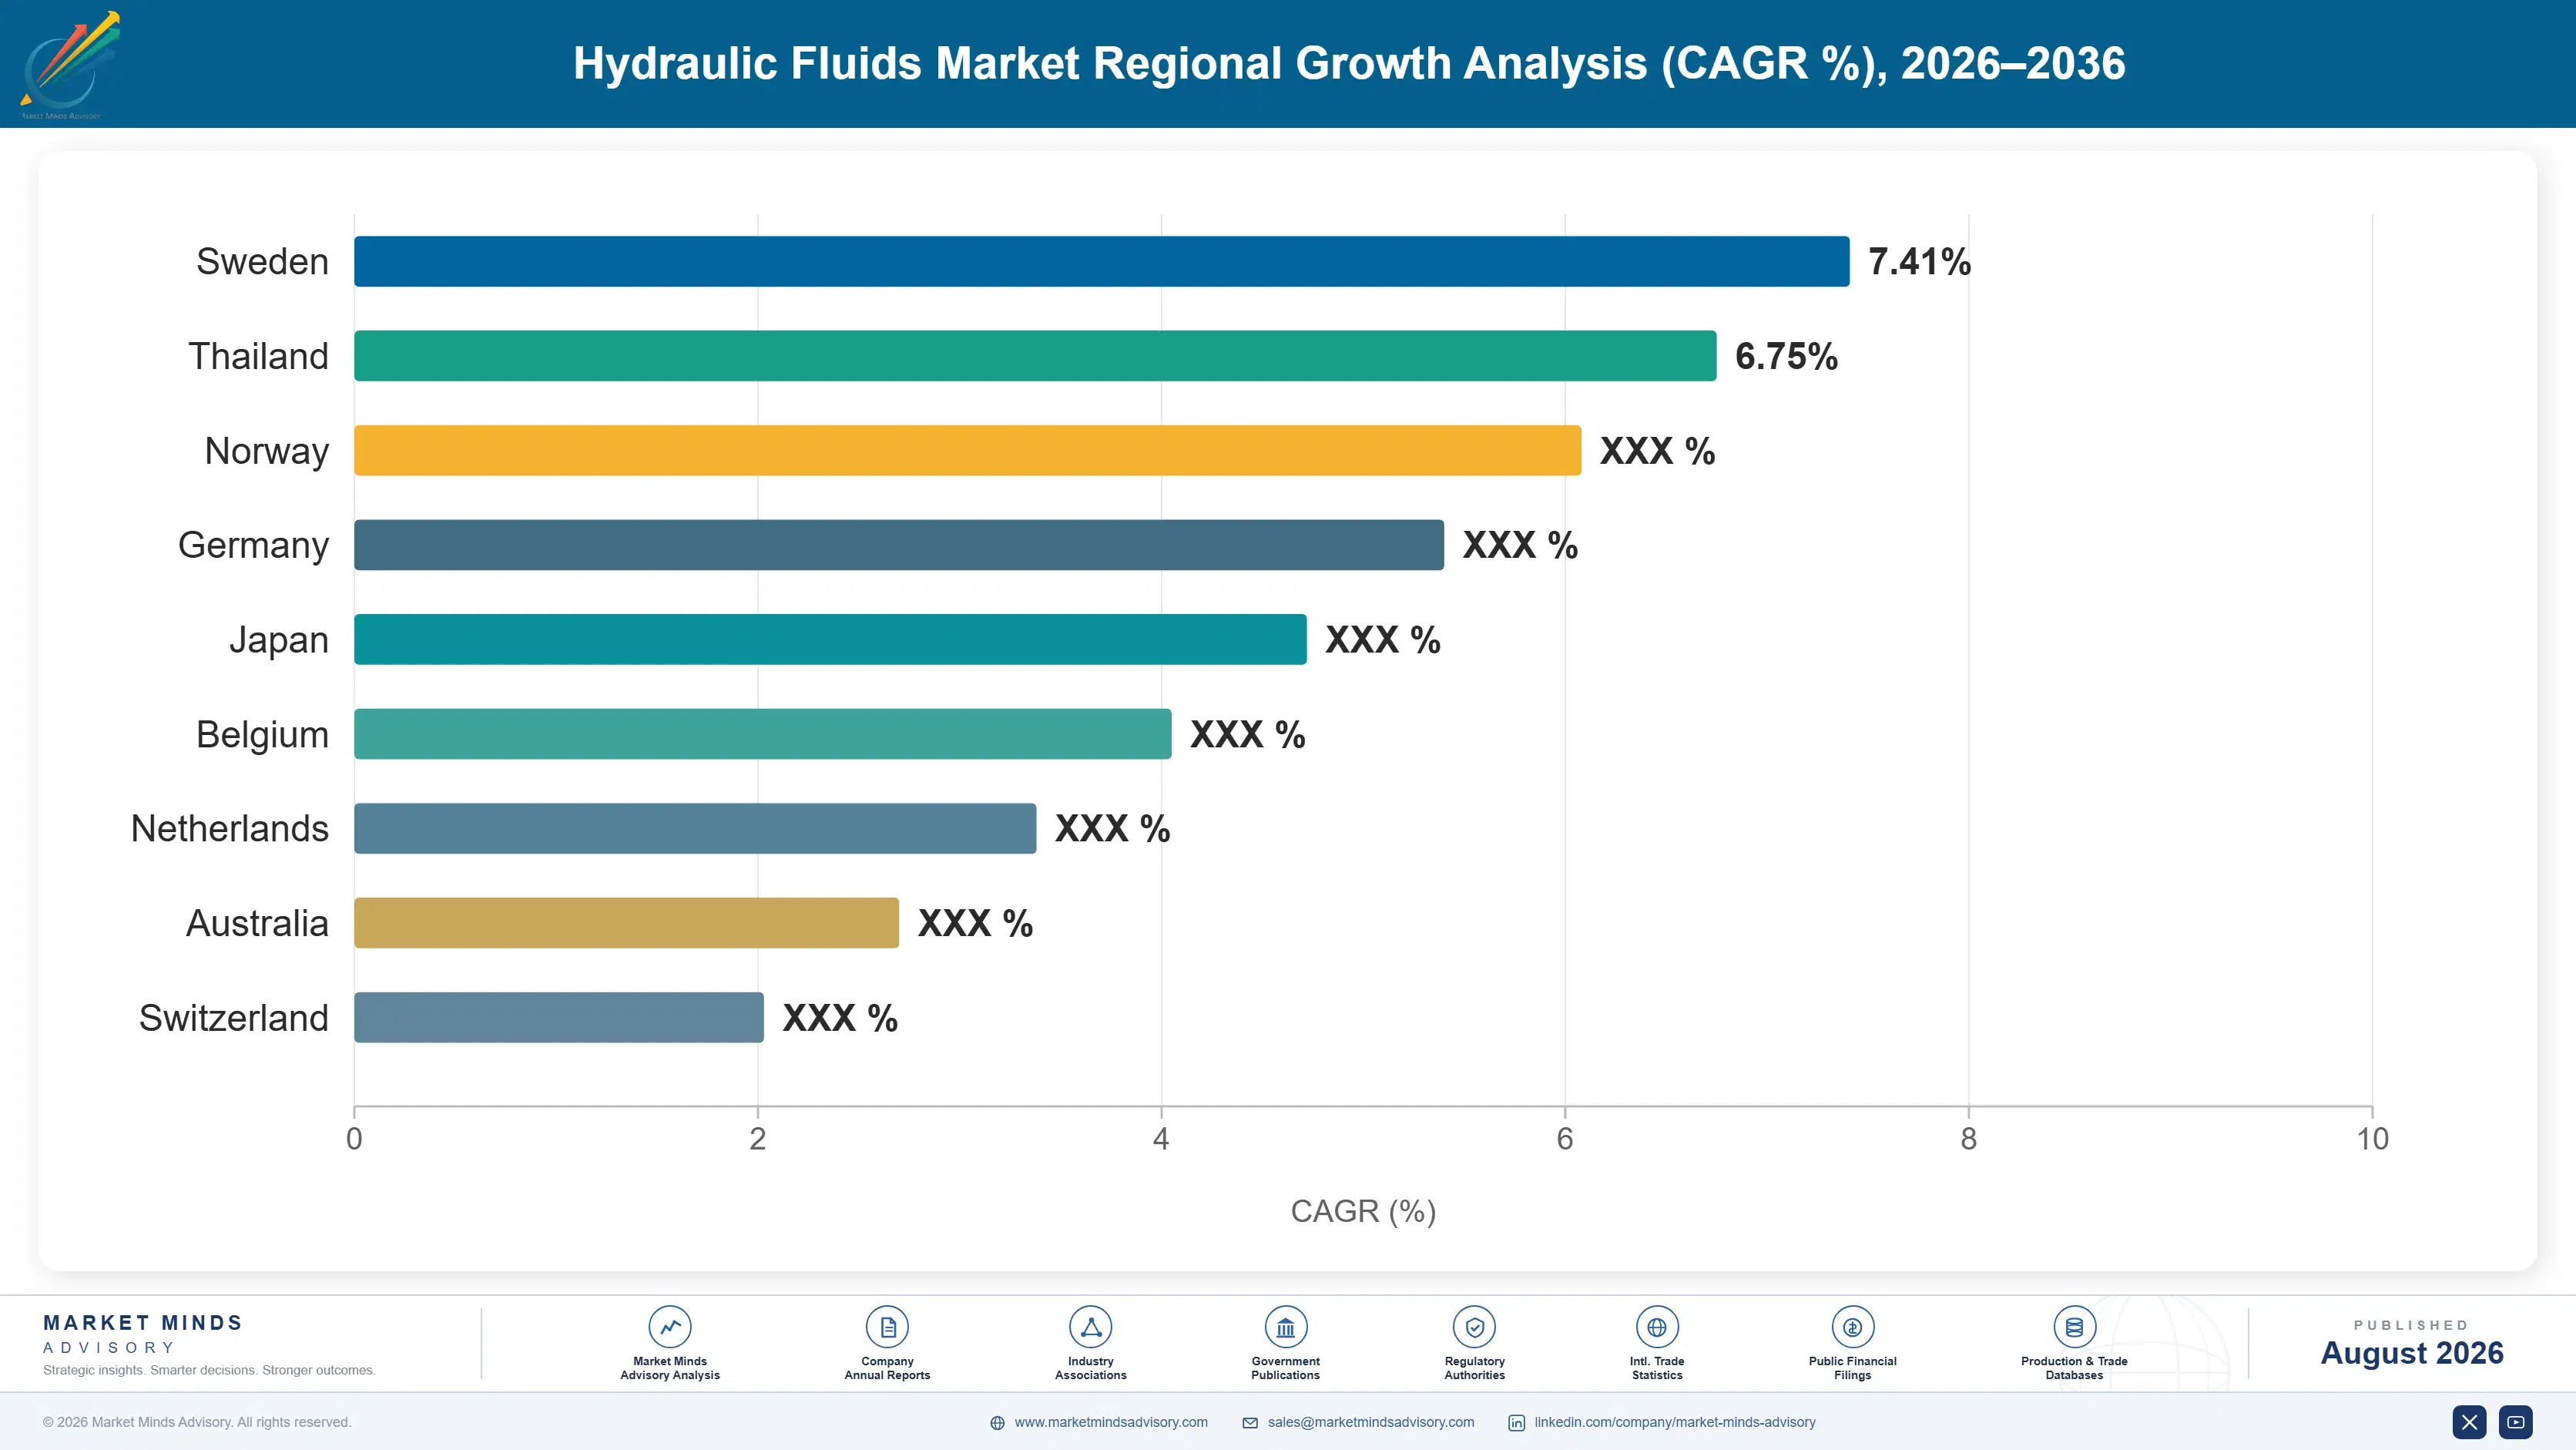
Regional Architecture and Country Demand Map

East Asia holds 29% of value on construction equipment manufacture and industrial machinery output arriving together. North America follows at 25% on a large installed equipment population and mining fleet. Equipment population rather than fluid preference explains almost all of this map. Regulation explains the rest of it.

North America

A very large installed equipment population is what sustains demand here, and much of it is old, which matters because older machines run shorter drain intervals and consume more fluid per operating hour. Mining fleets in the western states and Canadian oil sands operate in conditions that justify synthetic conversion on their own economics. The Vessel General Permit made environmentally acceptable lubricants a legal requirement rather than a preference across commercial shipping in United States waters, and that regulation has done more for ester volume here than any commercial argument. Growth at 4.0% is modest and the mix improvement underneath it is not. Value per litre is rising faster than volume falls.
Share: 25% | CAGR: 4.0% (2026 to 2036)

Western Europe

Almost nothing grows here and the specification leadership sits here anyway. German equipment builders and Bosch Rexroth in particular set fluid requirements that the rest of the world adopts, which gives European blenders early sight of where the technical bar moves next. Ecolabel criteria pushed ester adoption into forestry and inland waterway equipment earlier than anywhere else. The installed equipment population is mature and shrinking slightly, and drain intervals here are the longest anywhere because maintenance practice is disciplined and filtration is good. Growth at 2.9% is the weakest of the seven regions and represents mix improvement almost entirely rather than any volume at all. Specification influence is the real export here.
Share: 20% | CAGR: 2.9% (2026 to 2036)
Regional intelligence for 5 additional markets available in the complete report: East Asia, South Asia and Pacific, Latin America, Middle East and Africa, Eastern Europe. Contact sales@marketmindsadvisory.com.
hydraulic-fluids-market-trends-country-cagr-analysis-1787553279723

Where Fluid Margin Actually Sits

Four moves matter and selling more litres is not one of them, because the litres are disappearing regardless of what anybody does. What remains is the approval position, the chemistry the customer cannot argue about, and the service revenue that grows precisely as the fluid volume shrinks. That last one is the uncomfortable but correct answer.

Sell to the approval department, not the contractor

Around 71% of aftermarket volume follows the equipment manual, which means the commercial contest was settled years earlier in a machine builder's approval process and the person buying the drum has no discretion at all. A blender listed on a Caterpillar or Bosch Rexroth specification inherits demand across the operating life of every machine sold with it, typically a decade. The work required is rig testing, field validation and a relationship that takes years. Blenders spending sales resource on distributors and contractors are competing for the 29% where price is the only argument available.
Market Impact: Captures the full 71% of aftermarket purchase decisions

Charge for condition monitoring, not for replacement

Drain intervals near 5,000 hours keep extending and every extension removes litres nobody replaces, which is a losing position for anybody whose revenue is measured in volume. A fluid analysis and condition monitoring service reverses the incentive: the supplier earns from telling the customer the fluid is still good, and the customer pays for the confidence to leave it in. Several blenders now run this as a priced service line rather than a free sampling programme. It also generates account-level data on equipment condition that no competitor arriving at renewal can match.
Market Impact: Monetises the drain interval extending past 5,000 hours

Qualify on electrified machines before approvals reset

A battery-electric excavator still holds around 340 litres, so the volume threat is smaller than most forecasts assume, and the specification changes enough that the incumbent approval does not automatically carry across. Lower operating temperature, integrated electric pump motors and different duty cycles all require fresh validation. That makes electrification a requalification window rather than a decline, and windows like this open perhaps twice in a generation. Blenders treating it as a threat are ceding position on machine platforms that will run for the next twenty years. Very few have made that argument internally.
Market Impact: Reopens approvals across every 340 litre hydraulic system

Take the insurance argument to the plant risk manager

Fire-resistant fluids cost roughly 4 times mineral oil and plant engineers resist them on price and on seal compatibility work. The risk manager holds a different calculation entirely, because insurers have started pricing mineral oil hydraulics near molten metal at rates that make the conversion cheaper overall. Presenting the argument to procurement loses on unit price every time. Presenting it to the person who owns the premium wins, and the conversion once made is close to permanent because nobody reverses a fire safety decision. Very few blenders have ever called on a risk function.
Market Impact: Converts volume at roughly 4 times the price

Who Controls the Margin Pool

Five blenders hold 39% of hydraulic fluid supply, measured on volume supplied into factory fill and aftermarket channels, the basis used throughout this section. Concentration looks moderate and it badly understates the real position, because a blender without equipment maker approvals is excluded from 71% of aftermarket demand regardless of product quality or price. The gap between the leaders and everybody else is the approval portfolio, not the blending plant.
Competition runs on three dimensions and litre price is only one of them. Approval breadth across equipment makers, which decides addressable demand before anybody quotes. Technical service depth, particularly fluid analysis and contamination control, which is what keeps an account through a procurement review. And base oil supply position, since 62% of cost sits there and independents buy at merchant prices that integrated majors do not pay.

Rankings shift where Chinese and Indian blenders follow their domestic equipment makers into export markets, carrying approvals earned at home. That is already happening in Africa and Southeast Asia. Western positions hold longest in fire-resistant and ester chemistries, where the approval work is heaviest and the customer's tolerance for an unfamiliar supplier is lowest.
hydraulic-fluids-market-trends-company-positioning-matrix-1787553280243

Competitive Moat and Risk Dimensions

SHELL

Moat: Approval portfolio breadth

Shell holds equipment maker approvals across a wider range of machine builders than any competitor, which means a mixed fleet operator can standardise on one supplier rather than stocking several products. Assembling that portfolio took decades of rig testing and field validation with approval departments that grant listings slowly and revoke them quickly.
SHELL

Risk: Base oil integration exposure

The integrated position that supplies base oil advantage also ties the lubricants business to refining decisions taken for entirely different reasons. Refinery closures and conversions in Europe have shifted base oil supply patterns in ways the blending operation did not choose, and competitors buying on the merchant market retain flexibility the integrated model gives up.
FUCHS

Moat: Industrial specialisation depth

Fuchs built its position on industrial and specialty applications rather than on automotive volume, which gives it technical depth in fire-resistant and ester chemistries that generalist majors treat as a small line. Customers with unusual requirements go there first, and that reputation compounds because approval departments recommend suppliers they have worked with before.
FUCHS

Risk: No base oil position

Buying base oil on the merchant market means paying whatever refinery margins dictate, and at 62% of blended cost that exposure reaches the profit line directly whenever supply tightens. Integrated competitors absorb the same movement internally. Multi-year supply agreements reduce the exposure without removing it, and every tight market tests them.

Players Tracked

Prominent Players

Shell
ExxonMobil
TotalEnergies
BP Castrol
Fuchs

Other Key Players

Chevron
Idemitsu Kosan
Eni
Repsol
Petronas Lubricants International
Quaker Houghton
Klüber Lubrication
Sinopec Lubricant
PetroChina Kunlun
Valvoline
Phillips 66
Nynas
Panolin
Indian Oil Corporation
Gulf Oil International

Recent Developments

APRIL 2025

Fuchs expanded ester fluid production capacity in Germany

Fuchs commissioned additional production capacity for environmentally acceptable ester hydraulic fluids at a German site, responding to marine and forestry conversion demand the existing lines could not cover. The investment was organic and funded internally, with no partner or acquisition involved at any stage. Regulation had outrun the plant.
Signal: Ester capacity is being built against regulatory timetables rather than demand forecasts, which is a different planning basis entirely
AUGUST 2025

Shell signed a multi-year fluid supply and monitoring agreement with a global mining operator

Shell entered a multi-year agreement covering hydraulic fluid supply and fluid condition monitoring services across a global mining operator's fleet. The arrangement was a supply and service agreement rather than a joint venture, with no equity participation, and pricing follows a managed-service structure rather than volume.
Signal: Pricing on service rather than litres is how blenders intend to survive drain interval extension without losing the account
FEBRUARY 2026

TotalEnergies obtained fluid approval on an electric excavator platform

TotalEnergies secured a fluid specification listing on a European manufacturer's battery-electric excavator platform, following validation work covering electrical compatibility with integrated pump motors and revised viscosity requirements. This was an approval decision rather than a commercial agreement, and it carries no exclusivity. The validation work took nearly three years.
Signal: Electrification reopens approvals that had been settled for decades, which is an opportunity most blenders are reading as a threat

What Moves Blended Cost

Base oil accounts for around 62% of blended fluid cost, with additive packages, blending and packaging making up the balance. Group II and Group III base oil comes from a small number of integrated refiners in North America, the Middle East and Asia. Additive chemistry concentrates further still, with zinc dialkyldithiophosphate and ashless alternatives coming from four principal suppliers worldwide.
Base oil prices moved sharply through 2022 as crude rose, and IEA data show the energy cost pressure across European refining through that period. Fuchs recorded raw material cost pressure across its lubricants business in its Annual Report 2022. Independent blenders buying on the merchant market absorbed considerably more of that movement than integrated majors did, because a fluid on an equipment maker approval cannot be reformulated to a cheaper base stock without requalification.

That approval lock is the disadvantage mechanism and it falls unevenly. A blender holding equipment maker listings cannot change base stock or additive package without repeating validation. Integrated majors absorb base oil movement internally; independents carry the full swing on 62% of their cost. Asian blenders gain further from base oil supply proximity that European operations do not have.
hydraulic-fluids-market-trends-cost-volatility-analysis-1787553280438

Secure multi-year base oil supply with volume commitment

Buying 62% of a cost base on the merchant market leaves an independent blender exposed to refinery margins it has no influence over and cannot forecast. Multi-year agreements with committed volume secure both supply and a price that reflects the commitment, which matters more than the discount when supply tightens. Integrated competitors have this by construction rather than by negotiation.

Qualify two base stocks during initial approval work

An approved fluid cannot change base stock without repeating equipment maker validation, which means a blender qualifies once and lives with the exposure for years. Validating two base stocks during the original approval costs modestly more and preserves the ability to switch when one supply tightens. Almost nobody does this, because approval budgets are set by whoever wants the listing.

Qualify re-refined base oil where approvals permit it

Re-refined Group II base oil performs adequately in most hydraulic applications and prices below virgin stock, which is a genuine cost advantage that carries its own approval burden. Equipment makers increasingly accept it and some now prefer it on sustainability reporting grounds. The work is qualification rather than chemistry, and blenders who did it early are ahead.

Portfolio Architecture for Margin Defence

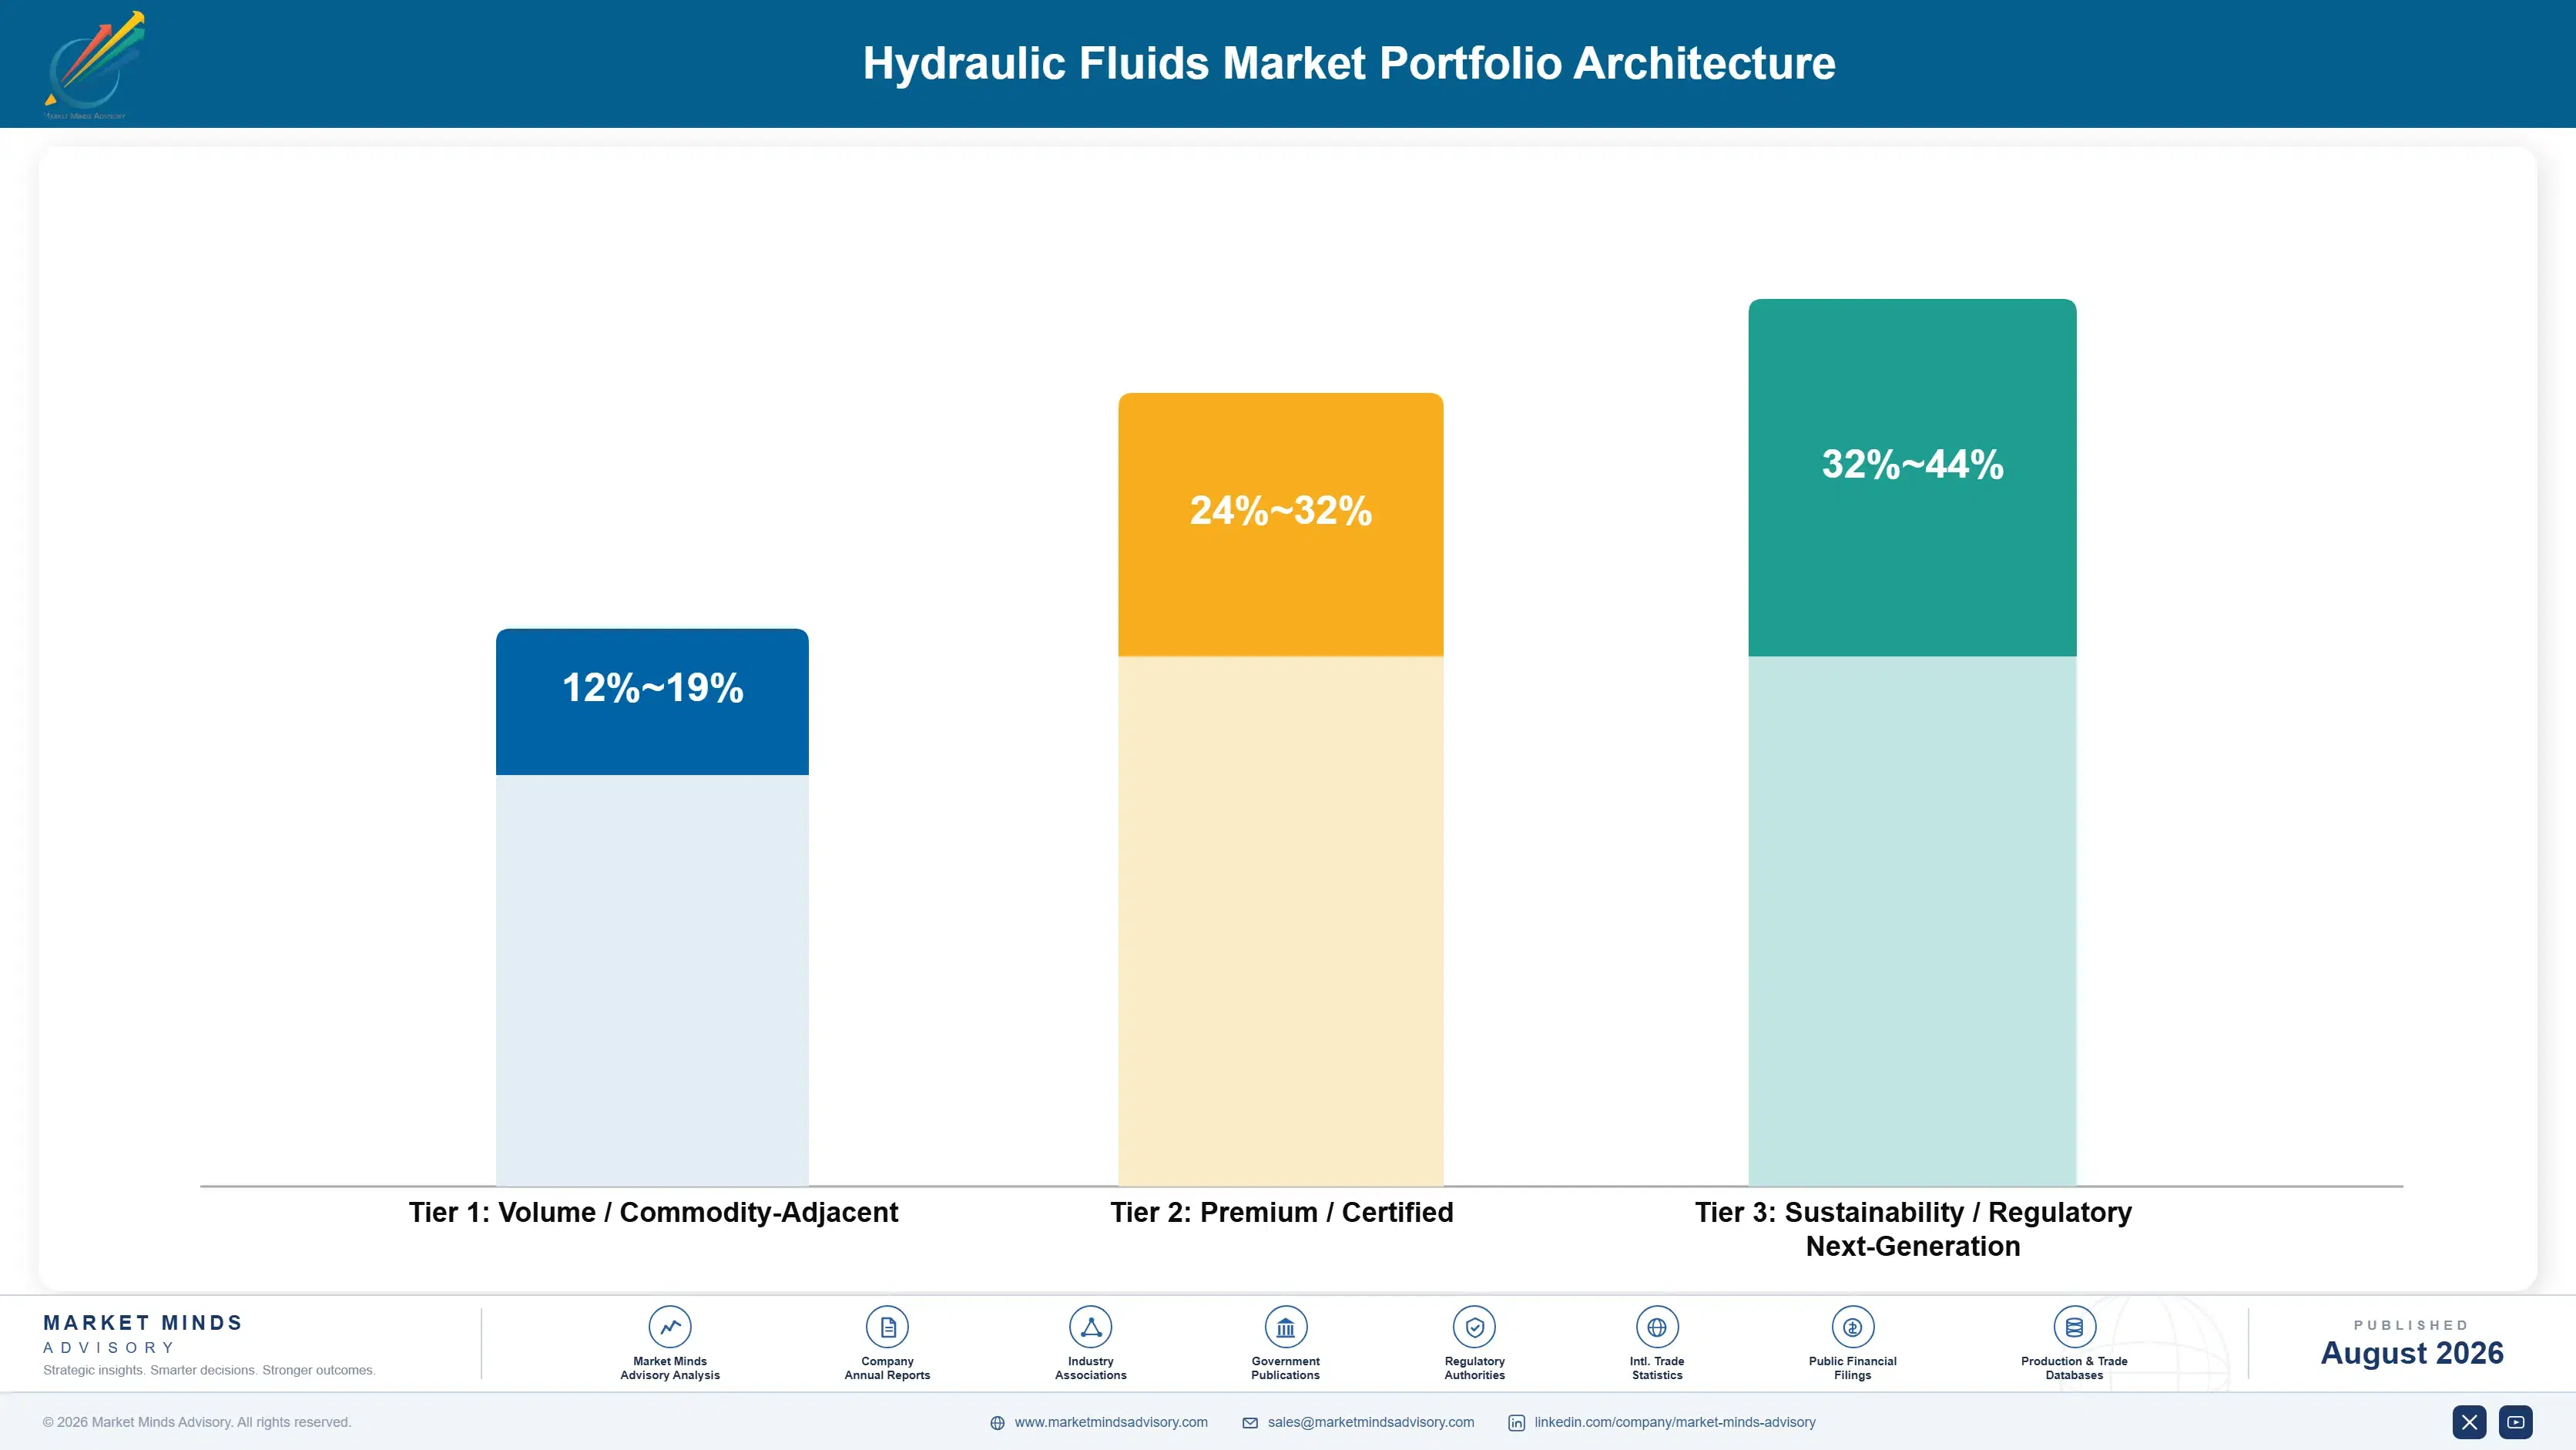
Margin in hydraulic fluids tracks approval difficulty rather than manufacturing complexity, since blending is not hard and everybody can do it. Mineral oil grades run at gross margins in the low to mid teens, competing against any blender within delivery range on a product the customer treats as interchangeable. Approved synthetic and fire-resistant grades run considerably higher, because the equipment maker listing excludes competitors and the customer has no realistic alternative to reference.
The tension is between volume and value in an unusually direct way, because the higher-value chemistries actively reduce the litres sold. A synthetic fluid lasting twice as long earns more per litre and fewer litres, and whether that trade is positive depends entirely on the account and on how the blender prices the technical service alongside it. Businesses run on volume targets consistently resist their own best products, which is a compensation design problem more than a strategy one.

High-value pools concentrate in ester fluids sold against regulation, fire-resistant grades sold against insurance, and condition monitoring services sold against the drain interval itself. None of the three is where the tonnage is. Blending capacity by itself defends nothing whatsoever.

Volume / Commodity-Adjacent

Mineral oil hydraulic grades sold into general industrial and agricultural use where the customer treats products as interchangeable and any blender within delivery range can compete. The seven-point range separates blenders with integrated base oil supply from those buying at merchant prices.
Gross Margin: 12%-19%

Premium / Certified

Synthetic hydrocarbon and polyalkylene glycol grades carrying equipment maker approvals across major machine platforms. The eight-point spread reflects approval breadth, since a blender listed on several specifications sells into fleets a single-listing competitor cannot reach at all.
Gross Margin: 24%-32%

Sustainability / Regulatory / Next-Generation

Environmentally acceptable ester fluids, fire-resistant grades and priced condition monitoring services. The twelve-point range is wide because pricing reflects regulatory necessity and insurance arithmetic rather than any cost basis a customer could benchmark against.
Gross Margin: 32%-44%
hydraulic-fluids-market-trends-portfolio-architecture-1787553280940

High-value Sub-segments and Strategic Watch-out

Environmentally Acceptable Ester Fluids

Compounding at 6.6% because the Vessel General Permit and European Ecolabel made it a legal requirement rather than a preference. Blenders holding early approvals are collecting on work funded years before the regulation arrived. The conversion has years left across dredging and port equipment. Very few competitors qualified.
Gross Margin: 34%-44%

Fluid Condition Monitoring Services

The only revenue line in this industry that grows as drain intervals extend past 5,000 hours, which reverses the incentive that has worked against fluid suppliers for twenty years. It also generates account-level equipment data no competitor arriving at renewal can match anywhere. Most blenders still give it away.
Gross Margin: 36%-46%

Mineral Oil Hydraulic Grades

The tonnage that fills blending plants, growing under 3% and treated as interchangeable by every customer who buys it. Chinese and Indian blenders following their domestic equipment makers abroad are the immediate threat here. Manage it for plant utilisation rather than for margin. Margin will not come back.
Gross Margin: 12%-19%

Electrified Machine Approvals

Battery-electric equipment still holds 340 litres per machine and the incumbent approval does not automatically carry across, which reopens listings that have been settled for decades. Requalification windows like this open perhaps twice in a generation. Most blenders are reading it as a threat instead.
Gross Margin: 24%-40%

How Fluid Demand Renews

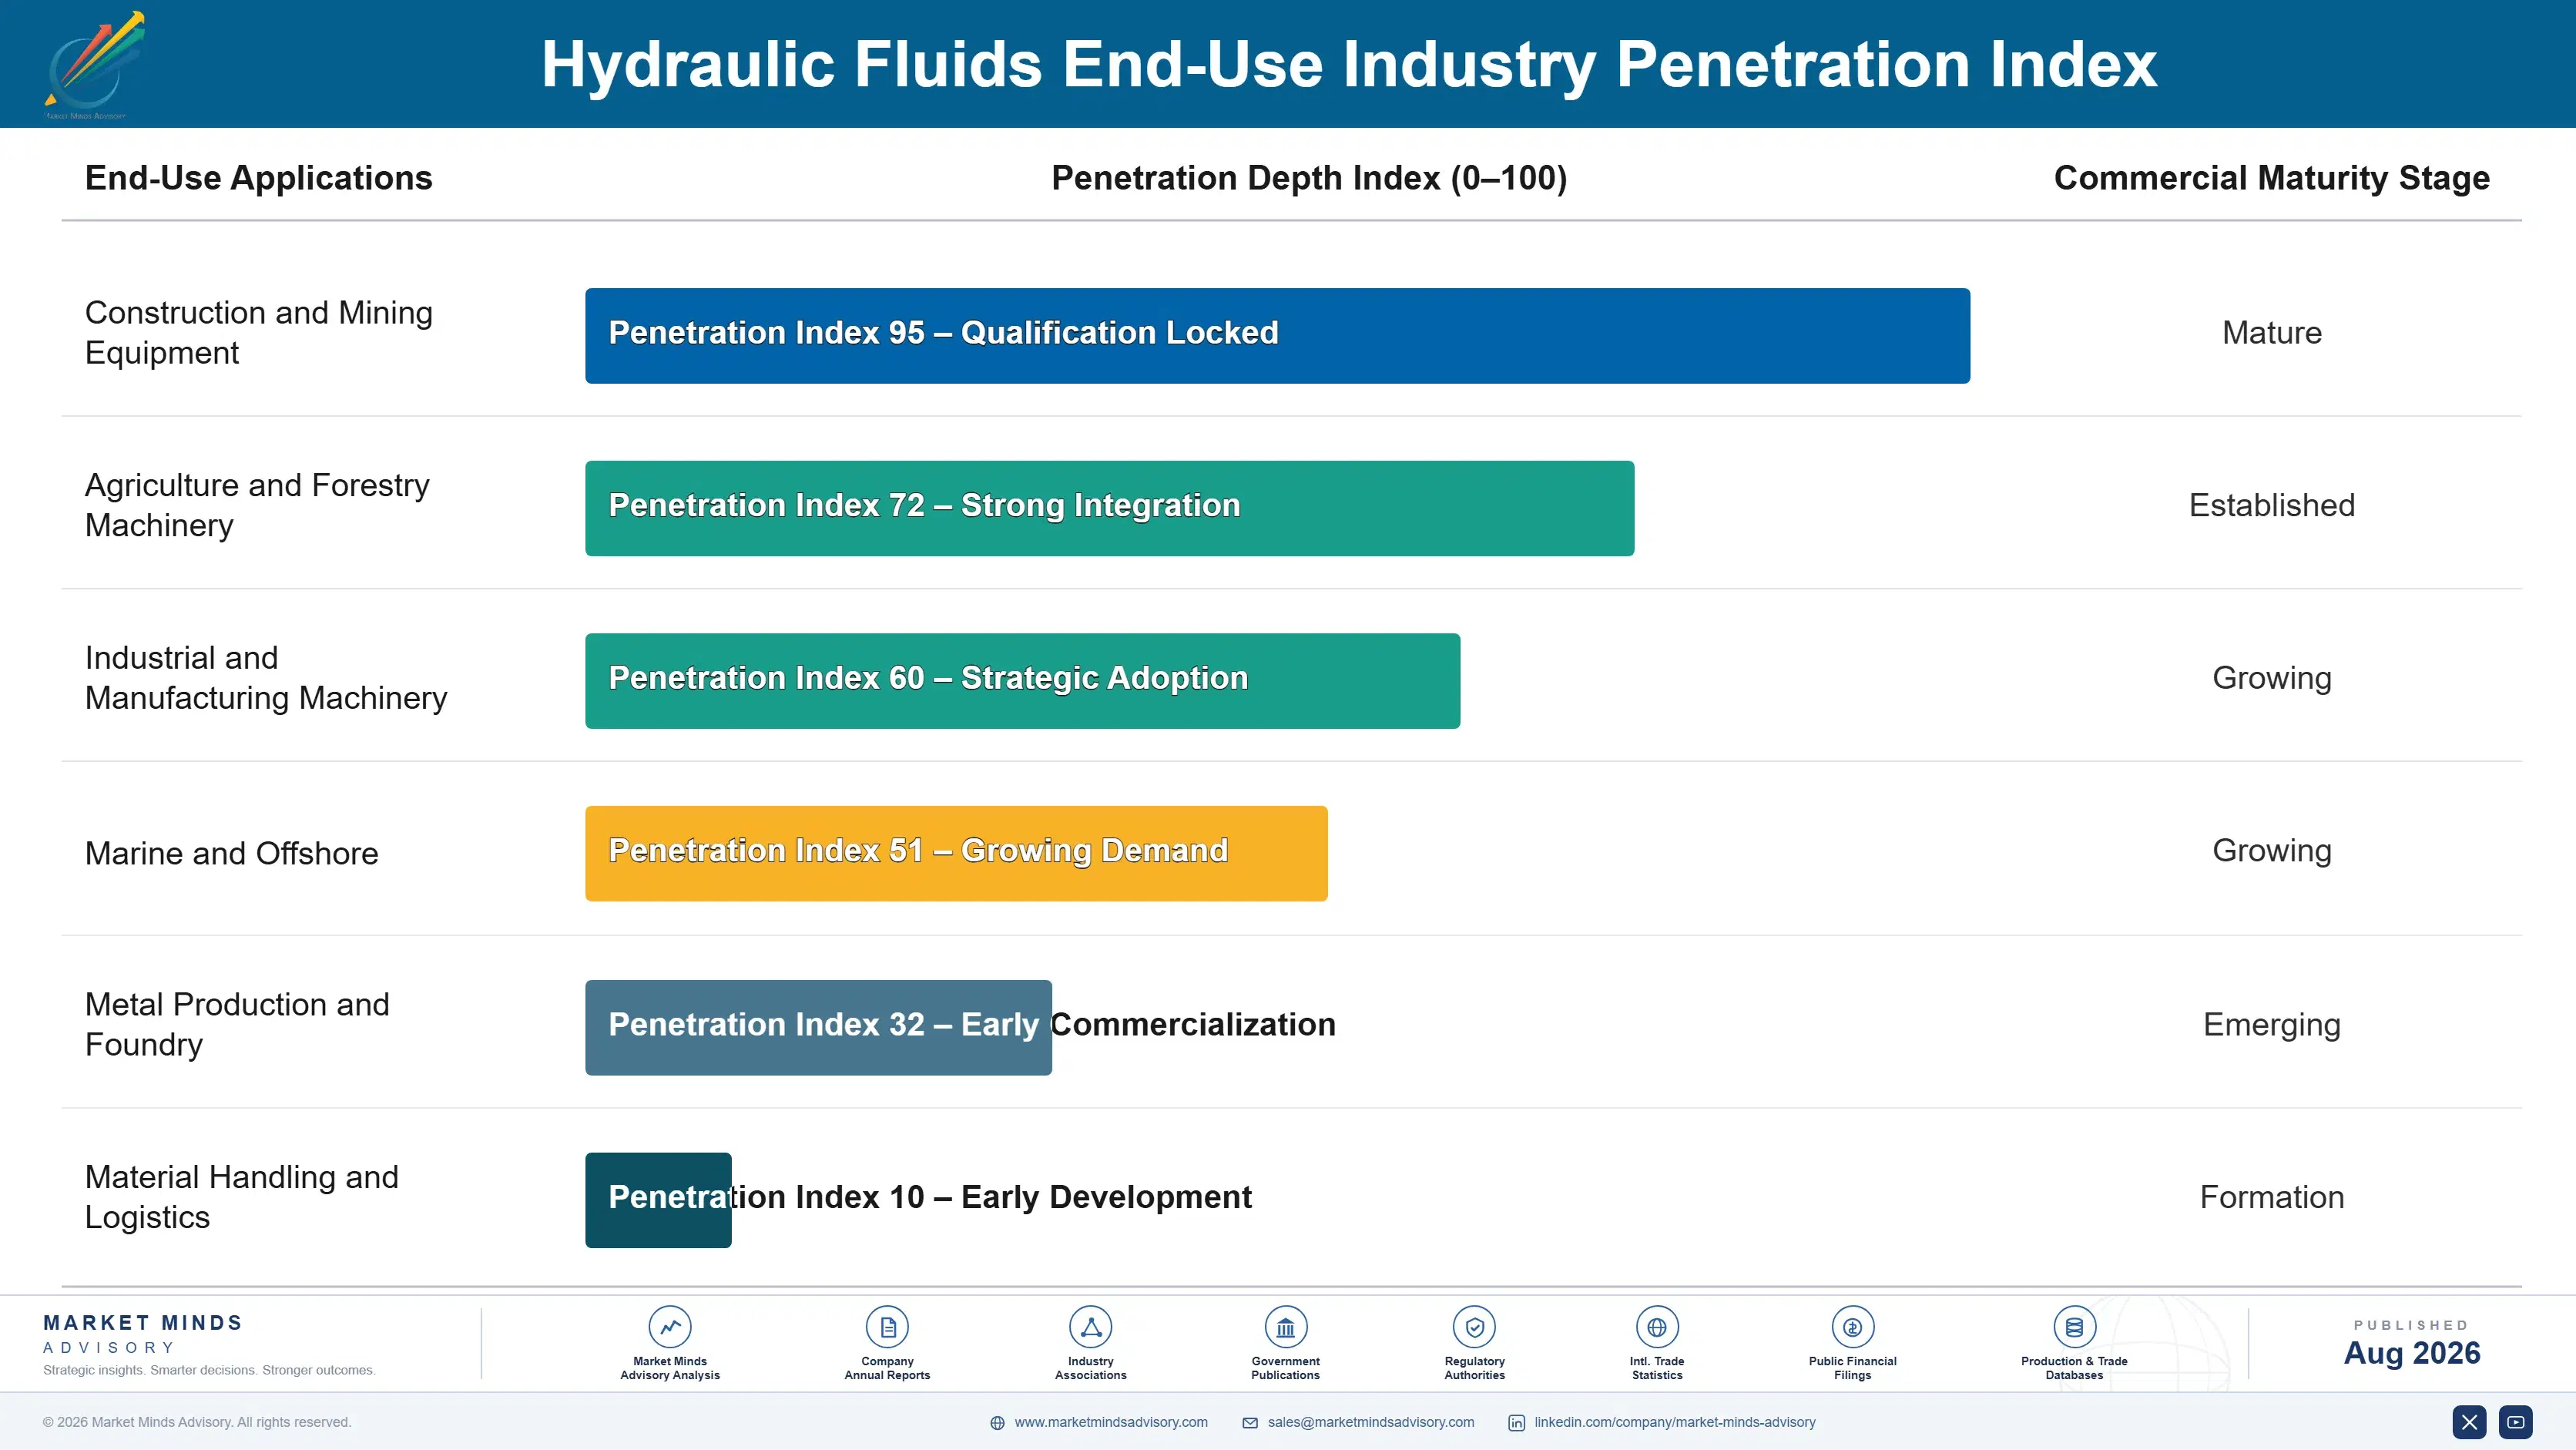
Fluid demand is consumption revenue with a specification lock on top. A machine drains and refills every 5,000 hours across a working life measured in decades, and the specification printed in the manual decides who supplies it every time. Factory fill is only 17% of volume, so the money is in the refills, and the refills follow a decision taken once at the machine builder rather than repeatedly by the operator.
Stickiness varies by vertical. Large mining and industrial accounts with technical service relationships almost never change supplier, since the analysis history is worth more than any price difference. Construction contractors buy on price wherever the specification permits it. Agricultural buyers follow the dealer, who follows the equipment maker. Depth follows the same pattern: industrial accounts consolidate across several fluid types while contractors buy one product from whoever is nearest.

The buyer has moved and blender sales organisations have mostly followed too slowly. Fluid selection once sat with maintenance managers weighing price per drum. It increasingly sits with equipment maker approval departments deciding years in advance, with plant risk managers weighing insurance exposure, and with sustainability functions asking about biodegradability. None of those three has ever bought a drum.
hydraulic-fluids-market-trends-end-use-penetration-index-1787553281425

Where To Place The Bet

These are among the four positions where our research anticipates prominent divergence between winners and laggards over the coming forecast period. Each is grounded in the demand model, the regulatory perimeter, and the announced capacity pipeline.
01 / APPROVAL PORTFOLIO INVESTMENT

Fund approvals before funding sales coverage

Around 71% of aftermarket volume follows the equipment maker specification, which means a blender without listings is excluded from most of the market regardless of how good the product is or how low the price goes. Approval work requires rig testing, field validation and a relationship with departments that grant listings slowly, and it takes years rather than quarters to complete. Any commercial plan funding distributor coverage ahead of approval work is competing for the least attractive part of the market available.
02 / SERVICE REVENUE CONVERSION

Price condition monitoring as a product

Drain intervals near 5,000 hours keep extending and every extension removes litres nobody replaces, which puts a volume-measured business permanently on the wrong side of its own customers' interests entirely. A priced condition monitoring service reverses that: the supplier earns from confirming the fluid is still good and the customer pays for the confidence to leave it in place for longer. It also builds account-level equipment data that no competitor arriving at contract renewal can reproduce at any price at all.
03 / ELECTRIFICATION REQUALIFICATION WINDOW

Treat electric platforms as an opening, not a threat

A battery-electric excavator still holds around 340 litres, so the volume loss is smaller than most forecasts assume, and the specification changes enough that incumbent approvals do not automatically transfer to the new platform at all. Lower operating temperature, integrated pump motors and revised duty cycles all require fresh validation work that reopens listings settled several decades ago. Windows like this open perhaps twice in a working generation, and most blenders are currently reading it as a decline instead of an opening.
04 / RISK MANAGER CHANNEL

Take fire-resistant conversion to the insurance owner

Fire-resistant fluids cost roughly four times mineral oil and plant engineers reject them on unit price and on the seal compatibility work they demand, which is why the conversion has moved slowly despite an entirely obvious safety case. The risk manager runs a different calculation entirely, because insurers now price mineral oil hydraulics near molten metal at rates that make the switch cheaper overall for the plant. Nobody reverses a fire safety decision once taken, which makes each conversion effectively permanent afterwards.

Engagement Snapshot From the Field

A live engagement with an industry participant carrying material or product regulatory and market exposure ahead of a defining policy shift, showing how our research translates into a defensible multi-year portfolio strategy.
MARKET MINDS ADVISORY · CLIENT ENGAGEMENT SUMMARY
Hydraulic Fluids Producer Strategic Portfolio Review and Transition Roadmap 2026·Investment Scenario on Hydraulic Fluids Exposure Evaluation 2025-26
CLIENT PROFILE
An independent European lubricants blender with annual revenue around EUR 480 million (client-reported, unverified by MMA), of which hydraulic fluids accounted for roughly 30%. The business held equipment maker approvals with two machine builders and sold most of its volume through industrial distributors on price. Base oil was bought entirely on the merchant market with no long-term agreement in place.
STRATEGIC CHALLENGE
Hydraulic fluid volume had fallen 14% across three years (client-reported, unverified by MMA) while the equipment population it served had grown, and nobody internally could explain the gap. Margins had compressed further during the 2022 base oil movement, which the business absorbed entirely. The board wanted to know whether the decline was cyclical or permanent.
MMA APPROACH
MMA reconstructed the client's volume decline against drain interval extension across the served equipment population, separating that effect from any competitive loss. Approval coverage was mapped against the machine platforms actually operating in the client's territories through the expert interview programme. Fire-resistant and ester conversion opportunities in the client's industrial accounts were sized, and base oil contracting practice was benchmarked against comparable independents.
KEY FINDINGS
  1. Roughly two-thirds of the volume decline came from drain interval extension rather than competitive loss, which meant the business was losing to physics rather than to rivals.
  2. Approval coverage reached only about a third of the machine platforms operating in the client's territories, which capped addressable demand well below what the sales plan assumed.
  3. Four existing industrial accounts operated hydraulics near molten metal on mineral oil, and none had ever been approached about fire-resistant conversion by anybody at all.
  4. The client gave fluid analysis away free while comparable independents charged for it as a service line, which forfeited both revenue and the account data that comes with it.
CLIENT PROFILE
An independent European lubricants blender with annual revenue around EUR 480 million (client-reported, unverified by MMA), of which hydraulic fluids accounted for roughly 30%. The business held equipment maker approvals with two machine builders and sold most of its volume through industrial distributors on price. Base oil was bought entirely on the merchant market with no long-term agreement in place.
STRATEGIC CHALLENGE
Hydraulic fluid volume had fallen 14% across three years (client-reported, unverified by MMA) while the equipment population it served had grown, and nobody internally could explain the gap. Margins had compressed further during the 2022 base oil movement, which the business absorbed entirely. The board wanted to know whether the decline was cyclical or permanent.
MMA APPROACH
MMA reconstructed the client's volume decline against drain interval extension across the served equipment population, separating that effect from any competitive loss. Approval coverage was mapped against the machine platforms actually operating in the client's territories through the expert interview programme. Fire-resistant and ester conversion opportunities in the client's industrial accounts were sized, and base oil contracting practice was benchmarked against comparable independents.
KEY FINDINGS
  1. Roughly two-thirds of the volume decline came from drain interval extension rather than competitive loss, which meant the business was losing to physics rather than to rivals.
  2. Approval coverage reached only about a third of the machine platforms operating in the client's territories, which capped addressable demand well below what the sales plan assumed.
  3. Four existing industrial accounts operated hydraulics near molten metal on mineral oil, and none had ever been approached about fire-resistant conversion by anybody at all.
  4. The client gave fluid analysis away free while comparable independents charged for it as a service line, which forfeited both revenue and the account data that comes with it.
RECOMMENDED STRATEGY
Phase 1: Phase one: fund approval work on the four highest-population machine platforms currently uncovered, accepting that listings take two years to obtain. Phase 2: Phase two: convert fluid analysis from a free service into a priced monitoring line, and take fire-resistant conversion proposals to account risk managers directly. Phase 3: Phase three: negotiate a multi-year base oil supply agreement with volume commitment rather than continuing to buy at merchant prices each quarter.
OUTCOME
Approval work started on three platforms and the first listing was granted in 2026. Fluid analysis now runs as a priced service and two industrial accounts have converted to fire-resistant fluid, at a revenue effect the client reported as roughly EUR 6.4 million annually (client-reported, unverified by MMA). Base oil contracting is under negotiation.

Frequently Asked Questions

Foundational context covering the market sizes, CAGR, scope, country, region and competition that inform every finding below. This section is provided to cover basics and most often pre-purchase conversations, answered from the MMA Primary Research Dataset.

What is the current size of the Hydraulic Fluids Market?

The market was valued at USD 9.8 billion in 2025, rising to an estimated USD 10.23 billion in 2026. East Asia holds the largest regional share at 29% of value.

How large will the Hydraulic Fluids Market be by 2036?

MMA forecasts USD 15.74 billion by 2036 under the base case, an expansion multiple of 1.54 times the 2026 value. That represents USD 5.51 billion of incremental value.

What is the CAGR for the Hydraulic Fluids Market 2026 to 2036?

The base case runs at 4.4% compound annual growth between 2026 and 2036, with a bull case at 5.6% and a bear case at 3.2%. Historical growth from 2020 to 2025 was 3.4%.

Which segment is growing fastest?

Environmentally acceptable ester fluids lead at 6.6%, half again the market rate, driven by the Vessel General Permit and European Ecolabel requirements. Synthetic hydrocarbon fluids follow at 6.1%.

Who are the major companies in the Hydraulic Fluids Market?

Shell, ExxonMobil, TotalEnergies, BP Castrol and Fuchs hold 39% between them. Equipment maker approval portfolios rather than blending capacity sustain those positions across the aftermarket.

Which country is growing fastest?

India leads at 7.1%, driven by construction equipment population growth combined with maintenance practice that keeps consumption per machine well above Western levels. Both effects compound.

Report Segmentation Architecture

The full report scope spans multiple orthogonal segmentation dimensions, with cross-tabulated demand data provided for each dimension pair. Coverage extends further to regional breakdowns, trend trajectories, and the competitive detail needed to support segment-level decision-making.

By Base Chemistry

  • Mineral Oil Hydraulic Fluids
  • Synthetic Hydrocarbon Fluids
  • Fire-Resistant Water-Containing Fluids
  • Fire-Resistant Synthetic Fluids
  • Environmentally Acceptable Ester Fluids
  • Polyalkylene Glycol Fluids

By End-Use Industry

  • Construction and Mining Equipment
  • Agriculture and Forestry Machinery
  • Industrial and Manufacturing Machinery
  • Marine and Offshore
  • Metal Production and Foundry
  • Material Handling and Logistics

By Sales Channel

  • Factory Fill Supply
  • Equipment Dealer Channel
  • Industrial Distributor Channel
  • Direct Account Supply
  • Managed Fluid Service Contract

By Region

  • North America
  • Western Europe
  • East Asia
  • South Asia and Pacific
  • Latin America
  • Middle East and Africa
  • Eastern Europe

Scope, Methodology, and Coverage

Every figure in this report is reproducible from documented input assumptions. The scope below maps the historical period, the forecast horizon, the segmentation dimensions, and the countries covered, alongside the underlying primary and qualitative methodology.
Historical Period
2020 to 2025
Forecast Period
2026 to 2036
Base Year
2025 (USD billions; MMA Primary Research Dataset, August 2026)
Market Definition
The market comprises fluids formulated for hydraulic power transmission in mobile and stationary equipment, covering mineral oil, synthetic hydrocarbon, fire-resistant water-containing and synthetic, environmentally acceptable ester and polyalkylene glycol chemistries. Value is measured at blender level across factory fill and aftermarket channels, including the technical service and approval work that accompanies supply. Engine oils, transmission and gear oils, metalworking fluids, brake and clutch fluids, greases, base oil sold unblended, hydraulic components and filtration equipment fall outside scope.
Quantitative Units
USD billions (current prices); million litres of fluid supplied annually; USD per litre by base chemistry
Segmentation Dimensions
By Base Chemistry; By End-Use Industry; By Sales Channel; By Region
Regions Covered
North America, Western Europe, East Asia, South Asia and Pacific, Latin America, Middle East and Africa, Eastern Europe
Countries Covered
China, Japan, South Korea, Taiwan, India, Indonesia, Thailand, Vietnam, Australia, United States, Canada, Mexico, Germany, France, United Kingdom, Italy, Spain, Netherlands, Sweden, Finland, Poland, Czechia, Romania, Hungary, Brazil, Chile, Argentina, Saudi Arabia, United Arab Emirates, South Africa
Key Companies Profiled
Shell, ExxonMobil, TotalEnergies, BP Castrol, Fuchs, Chevron, Idemitsu Kosan, Eni, Repsol, Petronas Lubricants International, Quaker Houghton, Klüber Lubrication, Sinopec Lubricant, PetroChina Kunlun, Valvoline, Phillips 66, Nynas, Panolin, Indian Oil Corporation, Gulf Oil International
Quantitative Methodology
Primary survey, n=3,800 respondents, Q4 2025, six countries; demand-side model with trade association cross-validation
Qualitative Methodology
47 expert interviews, Q4 2025; applied to validate demand model assumptions, identify emerging dynamics, and assess competitive positioning
Report Format
PDF and XLSX data workbook (Word format preview document)
Publisher
Market Minds Advisory
Report Code
MMA-2026-CHM-525
Published
August 2026
Contact
sales@marketmindsadvisory.com | www.marketmindsadvisory.com

Purchase the full Hydraulic Fluids Market Report (2026 to 2036).

The full report sizes the global hydraulic fluids market to 2036 across six base chemistries and seven regions, measured at blender level across factory fill and aftermarket channels. It traces how equipment maker approval practice controls the majority of aftermarket demand, and separates volume erosion from drain interval extension from mix improvement throughout the analysis. Competitive analysis covers 20 participants evaluated on volume supplied, with moat and risk assessment for the two leaders. Input cost exposure runs from base oil and additive supply through to approval-locked reformulation constraints. Four quantified revenue levers close the analysis.
Six-chemistry segment sizing with segment-level growth rates
Seven-region share and growth breakdown to 2036
Twenty-participant competitive map on one supply basis
Approval coverage mapped against operating machine platforms
Input cost exposure traced to base oil and additives
Four quantified revenue levers with commercial impact ranges

Built For The People Who Decide

From boardroom strategy to bench-side execution, this report is read cover-to-cover by leaders shaping the next decade of their industry, turning demand scenarios, market dynamics and valuation benchmarks into decisions.
CXOs/ Presidents/ VPs/ Managers
M&A and Corporate Development
Strategy Teams and R&D Heads
Procurement and Product Directors
Regulatory and Compliance Leaders
Investor Relations and Equity Analysts