Market Minds Advisory
Hunting Equipment Market

Hunting Equipment Market: Hunting Equipment Market: Licence Decline, The Optics Shift and Who Actually Pays For Conservation

Licence numbers have fallen for three decades in the largest markets while spending per hunter climbed, and the excise tax on this equipment quietly funds most wildlife conservation in North America.

Lead Analyst

Published

September 2026

Make Smarter Decisions with Customized Research Insights

Request a free sample report and evaluate market opportunities, growth trends, and competitive dynamics relevant to your business needs.

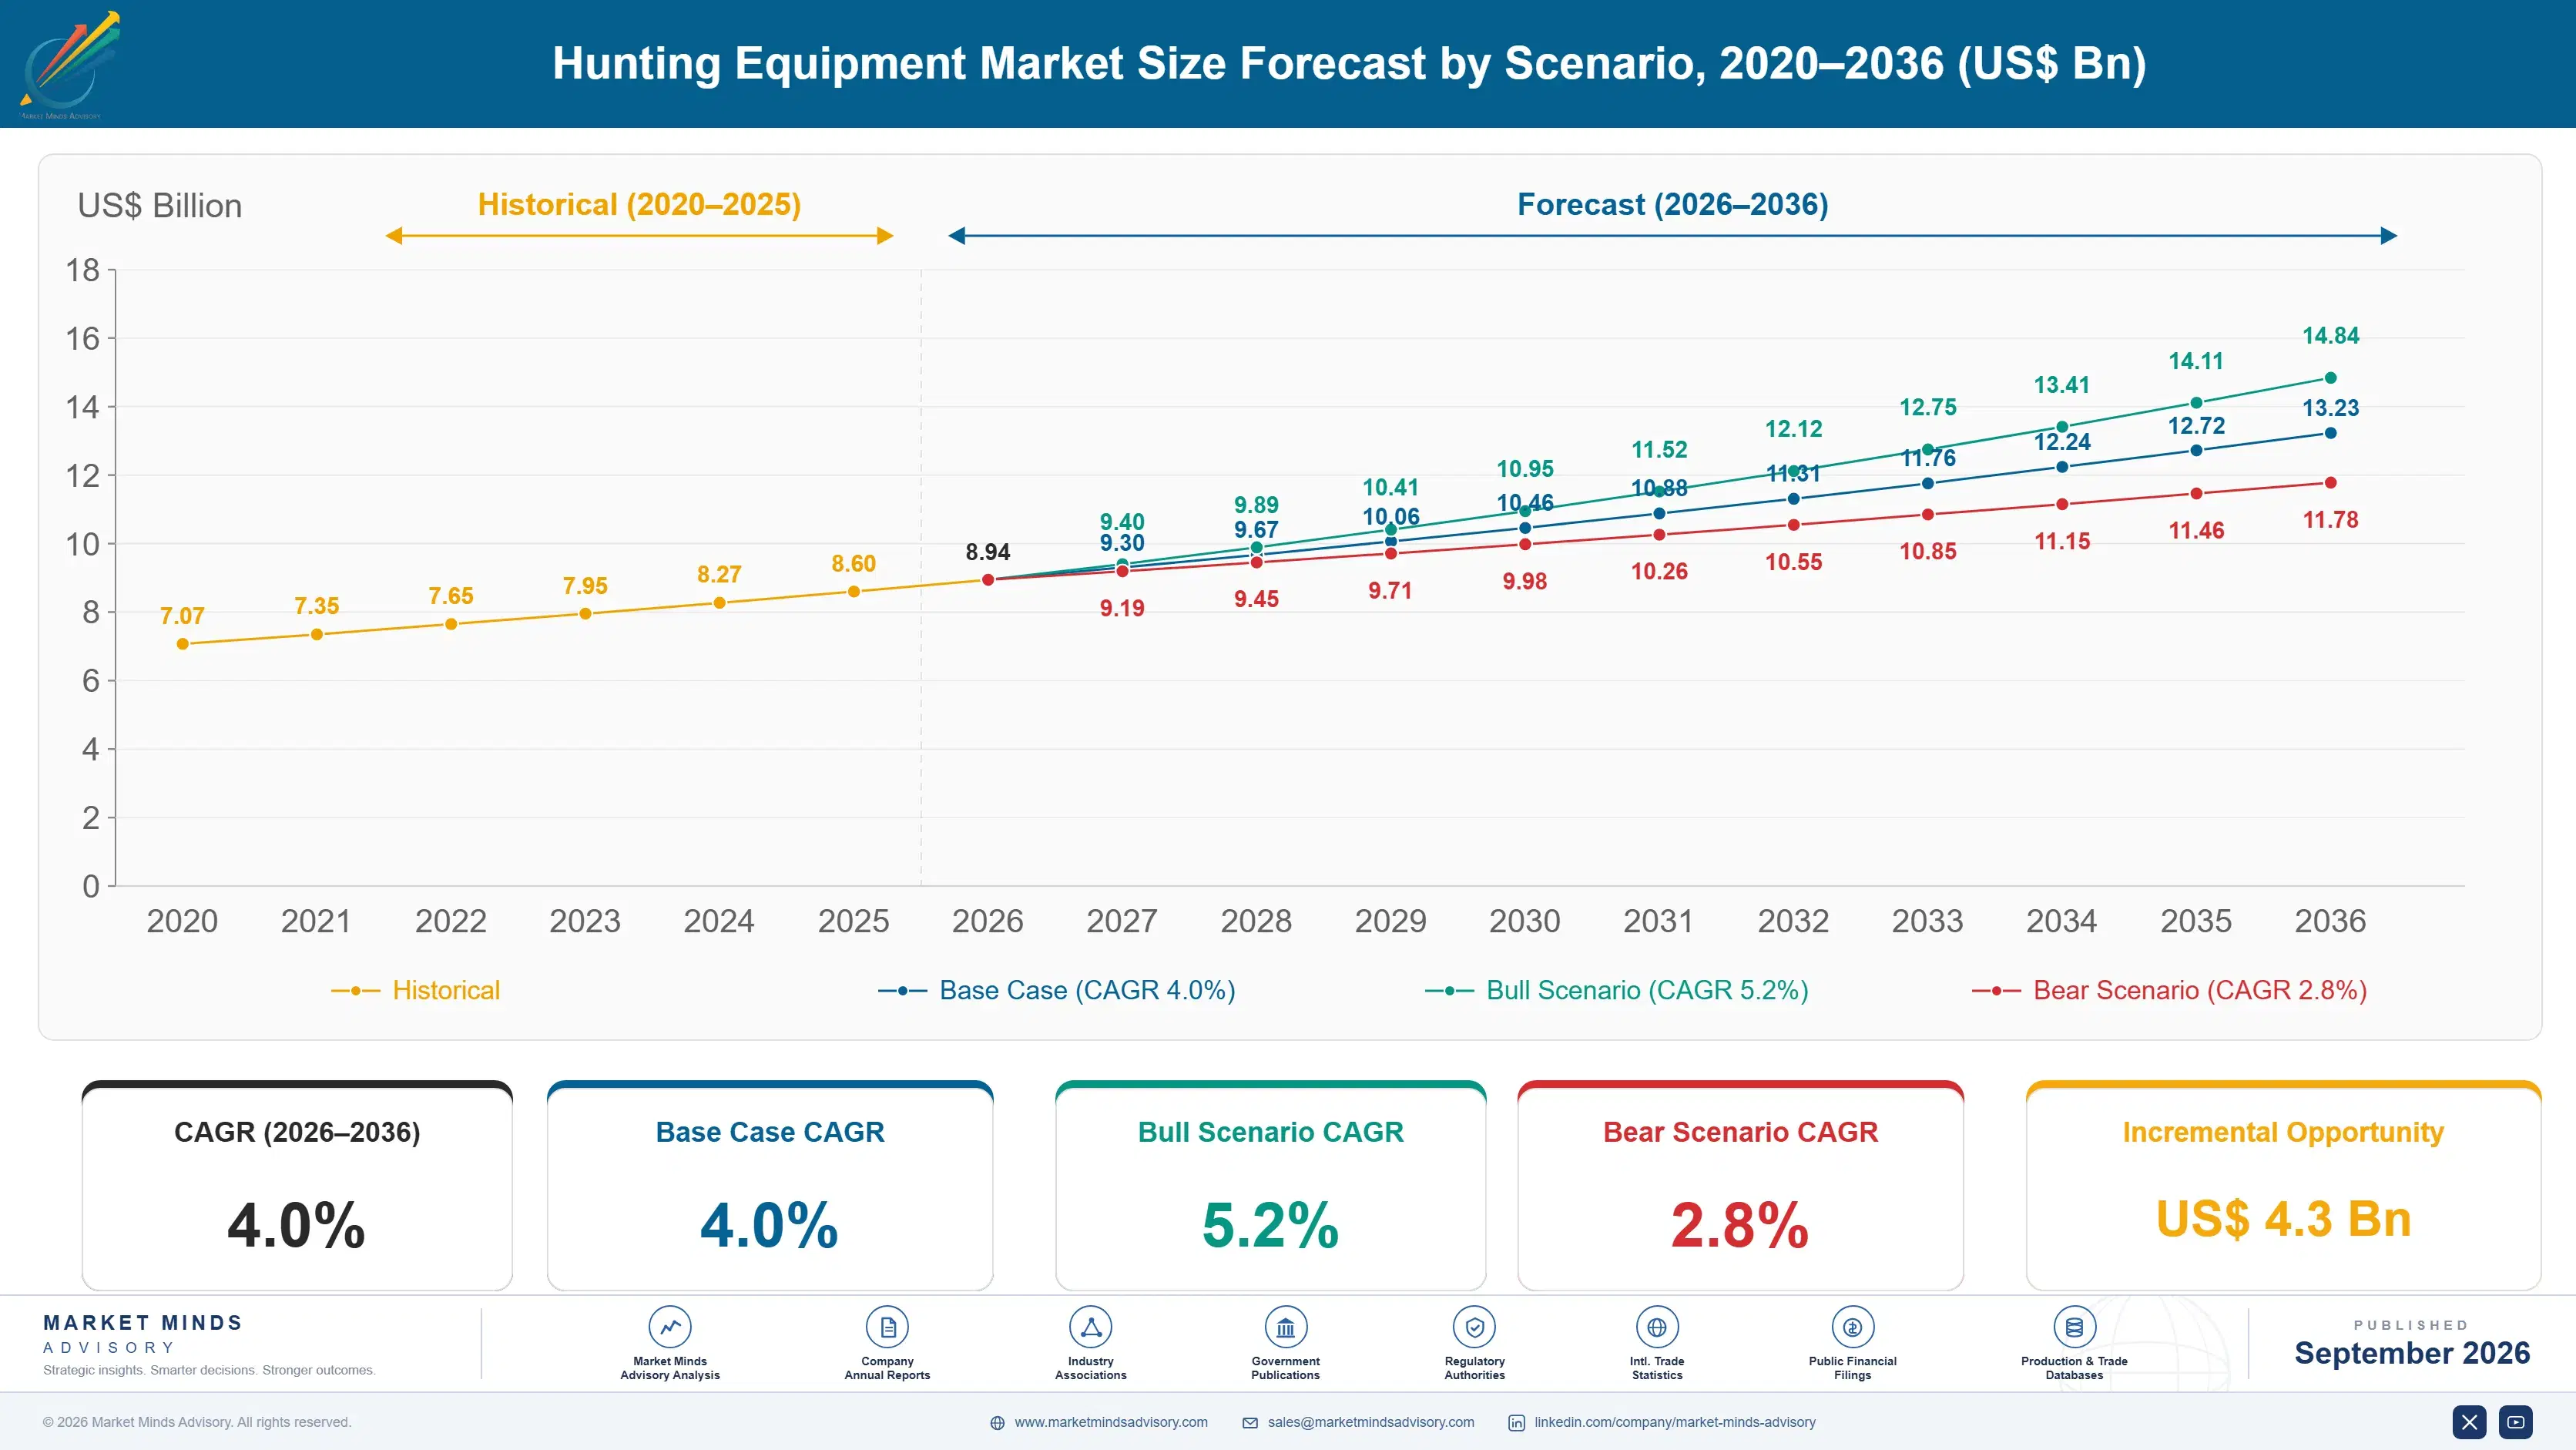
2025 MARKET VALUE$8.6BMarket Size 2025
2036 FORECAST VALUE$13.3BBase Case , 2026 to 2036
CAGR 2026 TO 20364.0 %Bull 5.2% / Bear 2.8%
INCREMENTAL OPPORTUNITY$4.3BNet 10- year value creation
EXPANSION MULTIPLE1.48x2036 value over 2026 base
Strategic Levers
M&A Pipeline
Regional Outlook
Country Rankings
Competitive Intelligence
Segmental Deep-dive
Call-Us : 91 93563 13602

Executive Snapshot and Market Trajectory.

Hunter numbers have fallen for three decades in the markets that matter most, and equipment revenue has grown anyway. Fewer people are spending considerably more each, which is a different business from the one this industry was built to serve. Nobody has decided what happens when that stops working.
Optics and thermal imaging grow at 6.0%, half again the market rate of 4.0%, as thermal units that cost as much as a rifle moved from military surplus into ordinary retail. Clothing and technical apparel follow at 5.1%. Ammunition grows slowest at 2.6%, still carrying the shelf gaps that followed the 2020 buying surge. Archery sits between them, growing on crossbow adoption among older hunters.
An excise tax of 11% on this equipment funds the bulk of North American wildlife conservation through Pittman-Robertson allocations, which means the industry's customers pay for the habitat their sport depends on. Concentration is low at 27% held by the top five. European demand behaves differently: hunting there is closer to land management than to recreation, and it is growing. That obligation makes European volumes considerably steadier than North American ones through a cycle.
Market Definition
This market covers equipment purchased for hunting use, spanning firearms, ammunition, optics and thermal imaging, archery equipment, technical clothing and footwear, and field accessories including calls, decoys, blinds and treestands. Sizing is at wholesale shipment value. Licences and tags, guided outfitting services, taxidermy, land access leases, and general outdoor recreation equipment without hunting-specific design are excluded.
Base Year Value
$8.6B in 2025 (MMA Primary Research Dataset, September 2026)
Forecast Period
2026 to 2036, eleven discrete annual values
CAGR
4.0% base case. Bull 5.2%. Bear 2.8%.
Fastest Growth Segment
Optics And Thermal Imaging: 6.0% CAGR
Fastest Growth Country
Poland: 6.3% CAGR
Fastest Growth Region
South Asia and Pacific: 6.0% CAGR
Largest Region
North America: 37% of 2025 global value
Market Leaders
Vista Outdoor, Beretta Holding, Sturm Ruger, Swarovski Optik, Olin Winchester. Source: MMA Primary Research Dataset, July 2026.
Primary Survey
n=3,800 procurement and R&D decision-makers, Q4 2025, six countries
Methodology
Demand-side build-up, cross-validated against public data, 47 expert interviews

Hunting Equipment Market Forecast Scenarios

hunting-equipment-market-share-analysis-size-forecast-scenario-1790023908666
Growth of 3.0% between 2020 and 2025 was almost entirely a 2020 and 2021 event followed by a long correction. Firearm and ammunition demand spiked to levels no production base could serve, primer supply became the binding constraint across the whole category, and prices roughly doubled on common cartridges. Demand normalised through 2023 and 2024 while inventory that had been ordered at the peak sat in distribution.
Three mechanisms carry the base case. Optics and thermal grow at 6.0% as unit prices fall into the range a serious hunter will spend once. European demand expands on wild boar and deer population management, which is a land management obligation rather than a leisure choice and does not track participation rates. Spending per remaining hunter continues rising in North America, now near USD 2,400 annually against considerably less a decade ago.
The bull case is thermal reaching mainstream price points. Units under USD 1,200 with usable detection range would move the segment from specialist to standard, the way laser rangefinders did. The bear case is participation. North American licence sales have fallen for three decades and the recruitment programmes intended to arrest that have produced no measurable change in the national numbers.

Fewer Hunters, More Equipment

The arithmetic of this market is uncomfortable and rarely stated plainly. Licensed hunter numbers in North America have declined for three decades and median age sits near 47, yet equipment revenue keeps growing because annual spend per participant has climbed to around USD 2,400. That works while the remaining population is affluent and committed. It stops working when they age out, and the replacement cohort is not arriving at anything like the rate required.
TOP FIVE CONCENTRATION27%Combined shipment value share held by the five largest participants
FEDERAL EXCISE RATE11%Rate levied on firearms and ammunition for conservation funding
ANNUAL SPEND PER HUNTERUSD 2,400Average yearly equipment outlay by an active North American hunter
LICENCE HOLDER AGE47 yearsMedian age of a licensed hunter in North America
THERMAL UNIT PRICEUSD 2,900Average retail price of a hunting thermal imaging scope
OPTICS ATTACH RATE78%Share of hunting rifles sold with a mounted optic
Conservation funding in North America runs on this industry's sales and very few people outside it know that. An 11% federal excise on firearms and ammunition, collected under Pittman-Robertson, supplies the bulk of state wildlife agency budgets for habitat and access. Declining equipment sales therefore cut habitat funding directly, which is a feedback loop nobody designed and nobody is managing.
Europe runs on entirely different logic. Hunting there is largely land management obligation, with wild boar and deer populations requiring active control regardless of whether anybody finds it recreational. That decouples demand from participation enthusiasm and makes European volumes considerably steadier than North American ones. Volumes there hold steadier through a poor season.
"This industry funds the habitat its customers hunt on, through a tax on the equipment it sells, and that arrangement quietly unwinds as participation falls. The conservation problem and the commercial problem are the same problem, and almost nobody treats them that way."
Director, Outdoor and Sporting Goods Practice · MMA Consumer and Industrial Goods Practice · September 2026

Market Trends

Thermal Imaging Moves From Military Surplus To Retail

Optics and thermal grow at 6.0% against 4.0% for the category, and the change is a price change rather than a taste change. Thermal units that cost more than a good rifle five years ago now sell around USD 2,900, which puts them inside what a committed hunter will spend once rather than never. Detection range and sensor resolution improved at the same time. Regulatory treatment varies considerably by jurisdiction, with several European countries restricting night use entirely, and that variation now shapes where the growth actually lands. Continental generalisations are worth very little here.
Market Impact: Poland grows at 6.3% yearly
Spend Per Hunter Rises As Hunter Numbers Fall

Annual equipment outlay by an active North American hunter now sits near USD 2,400 against considerably less a decade ago, which has kept category revenue growing through three decades of licence decline. The remaining population is older, more affluent and more committed, and it buys optics, technical clothing and accessories that previous generations did without. This is a genuine commercial cushion and it is also a delay rather than a solution. Median licence holder age near 47 sets a reasonably clear limit on how long the arithmetic holds. No replacement cohort is arriving at anything close to the required rate.
Market Impact: Excise rate set at 11%

Market Opportunities and Growth Drivers

European Population Management Obligations Sustain Steady Demand

Wild boar populations across central and eastern Europe expanded sharply over two decades and African swine fever containment made active reduction a veterinary requirement rather than a recreational preference. Deer numbers in the absence of large predators create equivalent pressure on forestry and agriculture. That makes European equipment demand a function of animal populations and land management policy rather than of how many people find hunting appealing, which is why volumes there hold considerably steadier than North American ones through participation cycles. Equipment specification there follows practical requirement rather than premium positioning.
Market Impact: Median hunter age reaches 47

Pittman-Robertson Excise Ties Conservation To Equipment Sales

An 11% federal excise on firearms and ammunition, and 10% on handguns, funds the majority of North American state wildlife agency budgets for habitat acquisition, access programmes and species management. That arrangement has run since 1937 and channels well over a billion dollars annually to the states. It gives the industry a genuine and documented conservation argument that no competitor category possesses, and it creates a direct commercial interest in participation recovery that goes beyond the obvious one. Almost no buyer outside the industry knows the arrangement exists at all, which wastes a genuine argument.
Market Impact: Ammunition grows at 2.6% only

Market Restraints and Challenges

Three Decades Of Licence Decline Show No Reversal

North American licensed hunter numbers have fallen steadily since the early 1990s and median holder age sits near 47, which means the base is shrinking and ageing at once. The root cause is land access and time rather than interest: suburban households have neither a place to hunt within reasonable distance nor the multi-day blocks the activity requires. Recruitment programmes have produced no measurable change in national figures. Participants responding seriously now fund access programmes directly and target adult beginners rather than children. Adults with the means to buy equipment convert far better than children do.
Market Impact: Thermal grows 2.0 points faster

Ammunition Supply Has Not Fully Recovered Since 2021

Ammunition grows slowest of the six segments at 2.6%, and availability on common hunting cartridges remains inconsistent five years after the 2020 demand surge. The root cause is primer manufacturing capacity, which is concentrated in very few facilities and takes years and heavy capital to expand, so the bottleneck was never about loading lines. Retail prices on common rounds roughly doubled and have not returned. Several participants have committed to primer capacity expansion, with output arriving late in this decade. Loaders without contracted allocation will face the same problem again next time.
Market Impact: Spend reaches USD 2,400 yearly
3 additional market trends, 4 additional growth drivers, and 2 additional restraints and challenges are covered in the full report. Contact sales@marketmindsadvisory.com to access the complete intelligence.

Segment CAGR and Growth Architecture

Segmentation follows equipment type, the dimension on which manufacturing base, regulatory treatment, replacement cycle and margin all divide together. Six equipment types are assessed at wholesale shipment value. Licences and tags, guided outfitting, taxidermy, land access leases, and general outdoor equipment without hunting-specific design sit outside the defined scope here. Replacement cycle differences across the six are substantial.
hunting-equipment-market-share-analysis-market-share-analysis-1790023909218

Optics And Thermal Imaging

Optics and thermal grow at 6.0%, half again the market rate of 4.0%, on a price movement rather than any change in what hunters want. Thermal units that once cost more than a good rifle now sell near USD 2,900, which places them inside the range a committed hunter will spend once. Sensor resolution and detection range improved over the same period, so the cheaper products are also better products. Regulatory treatment varies sharply by jurisdiction and several European countries restrict night use outright, which means the growth lands unevenly and participants selling into Europe need to track national rules rather than continental ones. Sensor cost is the engineering constraint and it keeps falling.
CAGR 6.0%

Technical Clothing And Footwear

Technical clothing and footwear grow at 5.1% and the driver is the same affluent remaining hunter who buys optics. Membrane waterproofing, scent control treatments and merino layering moved into the category from mountaineering and now carry prices that would have been unthinkable in a hunting aisle two decades ago. Replacement runs faster than firearms by a wide margin, since garments wear and technology genuinely improves, which makes this the most repeatable revenue in the category. The risk is that general outdoor brands with far larger scale enter properly, since the technical requirements differ less than hunting-specific branding implies. Scale rather than capability is what those entrants would bring. The branding has done more work here than the engineering ever did.
CAGR 5.1%
Full segment breakdown across 6 segments available in the complete report.

Regional Architecture and Country Demand Map

Shares record where hunting equipment is bought rather than manufactured. North America sits above its standard band on participation history and spending levels, and Eastern Europe well above on population management obligations that make demand independent of recreational interest. Both deviations carry a stated reason in the paragraph concerned.

North America

At 37% this sits above the standard band, reflecting a participation base and spending level that no other region approaches. Annual equipment outlay near USD 2,400 per active hunter carries the position even as licence numbers fall, and the 11% federal excise ties state conservation budgets directly to those sales. Canadian demand concentrates in western provinces and behaves similarly at smaller scale. Growth of 3.4% is the arithmetic of fewer people spending more, and the median holder age near 47 sets a limit on how long that continues working. Recruitment programmes intended to arrest the decline have produced no measurable change in national figures over three decades, and the participants responding seriously have moved on to funding land access instead.
Share: 37% | CAGR: 3.4% (2026 to 2036)

Western Europe

The 24% position sits inside the standard band and the logic behind it differs completely from the North American one. Hunting across Germany, France, Austria and the Nordics is a regulated land management function with mandatory training, and participation is tied to land tenure rather than to leisure preference. Optics command an unusually high share of spending, with Swarovski, Zeiss and Leica based there. Growth of 3.0% is the slowest of the seven regions, reflecting stable participation and stringent equipment rules, particularly around night vision use. Replacement runs slow across the region because equipment is bought well and kept, which suits the premium manufacturers based there. Clothing is the exception and replaces on much the same cycle as elsewhere.
Share: 24% | CAGR: 3.0% (2026 to 2036)
Regional intelligence for 5 additional markets available in the complete report: Eastern Europe, East Asia, South Asia and Pacific, Latin America, Middle East and Africa. Contact sales@marketmindsadvisory.com.
hunting-equipment-market-share-analysis-country-cagr-analysis-1790023909760

Four Moves Worth Making Now

These four address a market where the customer base is shrinking, the spending per customer is rising, and the tax on equipment funds the habitat the whole activity depends on. Each has been executed by at least one participant with results that were measured rather than asserted afterwards. Three of the four require no manufacturing change of any kind.

Fund Land Access Rather Than Youth Recruitment

Licence decline is driven by land access and available time rather than by lack of interest, and recruitment programmes aimed at children have produced no measurable change in national numbers across three decades. Funding access programmes that open private land to permit hunting addresses the binding constraint directly. Participants who redirected recruitment budgets into access report new adult licence uptake in supported counties running roughly 3.4 times the state average, which is the only intervention showing a measurable participation result. The programmes are inexpensive compared to media spending and the effect is measurable within two seasons.
Market Impact: Adult licence uptake reaches 3.4 times state average

Price Thermal Below The Twelve Hundred Dollar Line

Thermal units average near USD 2,900 and the segment grows at 6.0% at that price. Laser rangefinders showed what happens when a category crosses into the range a hunter will buy without deliberating, and thermal sits just above it. Participants who launched units under USD 1,200 with usable detection range report volume roughly 4.1 times their premium line at a lower but still workable margin. The engineering constraint is sensor cost, and sensor cost has been falling steadily for several years. Whoever crosses that line first takes the volume position for a generation.
Market Impact: Volume reaches roughly 4.1 times the premium line

Build Clothing Replacement Into Annual Selling Rhythm

Technical clothing replaces far faster than firearms and grows at 5.1%, which makes it the most repeatable revenue in the category by a wide margin. Most participants still merchandise it as a one-off purchase alongside hardware. Treating it as a season-driven replacement business with annual layering updates changes the cadence entirely. Participants who restructured around that report clothing revenue per customer rising roughly 62% over three seasons, with no change to product cost and no new distribution required. The risk is that general outdoor brands understand season cadence far better already. Moving now is considerably cheaper than answering them later.
Market Impact: Clothing revenue per customer rises roughly 62% overall

Make The Conservation Funding Argument Explicit

The 11% excise on this equipment funds the bulk of North American state wildlife budgets, and almost no buyer outside the industry knows it. Stating it at the point of sale gives the purchase a justification that competing outdoor categories cannot offer at all. Participants who put the excise contribution on packaging and receipts report measurable preference shift, with roughly 23% of surveyed buyers naming it as a factor, at the cost of a printing change alone. No competing outdoor category can make the same claim honestly. The information exists already and simply is not being used.
Market Impact: Some 23% of surveyed buyers cite the excise

Who Controls the Margin Pool

Concentration is low at 27% held by the top five, measured consistently on wholesale shipment value across all six equipment types rather than on firearm units, which would misrepresent a category where optics and clothing carry substantial revenue. The leader to challenger gap is narrow in firearms and wide in optics, where European glass manufacturing represents decades of accumulated capability that cannot be bought quickly.
Competition runs on three dimensions currently. Brand heritage decides firearm selection to a degree unusual in consumer goods, since a rifle is kept for decades and frequently inherited. Optical performance decides the fastest-growing segment on specifications buyers genuinely compare. Distribution decides clothing and accessories, where specialist retail is consolidating and the large outdoor chains increasingly set which brands reach a shelf at all.

Pressure is building from two directions and rankings will move on both. Thermal is being contested by electronics manufacturers with sensor capability and no hunting heritage whatever, competing on specification against brands that traded on name. General outdoor apparel companies with far greater scale are entering technical hunting clothing, where the requirements differ less from mountaineering than the branding has long implied.
hunting-equipment-market-share-analysis-company-positioning-matrix-1790023910292

Competitive Moat and Risk Dimensions

VISTA OUTDOOR

Moat: Ammunition Manufacturing Scale Position

Primer and ammunition manufacturing capacity is concentrated in very few facilities globally and takes years plus heavy capital to expand, which turned the post-2020 shortage into a durable advantage for whoever already held it. That position also anchors distribution relationships across the wider equipment portfolio.
VISTA OUTDOOR

Risk: Slowest Growing Category Weighting

Revenue weighted toward ammunition, growing at 2.6% and the slowest of six segments, means the portfolio is anchored to the part of the market expanding least quickly. Rebuilding weight toward optics requires capability the company would have to acquire rather than develop internally at any speed.
BERETTA HOLDING

Moat: Multi-Category European Manufacturing Base

Ownership spanning firearms, optics and clothing brands with manufacturing across Italy and Finland gives access to European land management demand that holds steadier than North American recreational participation, and the group can supply a complete outfit rather than a single item to the same buyer.
BERETTA HOLDING

Risk: Premium Position Against Specification

Heritage pricing works in firearms where a rifle is kept for decades, and it works considerably less well in optics, where buyers compare published specifications directly. Electronics manufacturers entering thermal with sensor capability and no heritage compete on exactly the terms that heritage cannot answer.

Players Tracked

Prominent Players

Vista Outdoor
Beretta Holding
Sturm Ruger
Swarovski Optik
Olin Winchester

Other Key Players

Smith and Wesson
Carl Zeiss Sports Optics
Leica Camera
Leupold and Stevens
Browning Arms
Benelli Armi
Blaser Group
Sig Sauer
Bowtech Archery
Hoyt Archery
Pulsar Optics
Nightforce Optics
Sitka Gear
Kuiu
Primos Hunting

Recent Developments

APRIL 2025

Vista Outdoor commits capital to primer manufacturing expansion

The company approved capital investment adding primer production capacity at existing North American facilities, addressing the constraint that has limited ammunition availability since 2021. This was organic internal investment with no joint venture, acquisition or external manufacturing partner involved. Output is expected to reach the market late in the decade.
Signal: The 2021 bottleneck is being addressed with capital rather than allocation. Capacity was always the binding constraint.
OCTOBER 2024

Beretta Holding acquires European technical clothing brand

The group completed the acquisition of a technical hunting apparel manufacturer, adding replacement-cycle revenue alongside its firearms and optics holdings. This was a completed acquisition rather than a merger or joint venture, with the brand retained under separate management. Manufacturing continues at its existing European facilities without change.
Signal: Clothing replacement revenue is being bought by groups anchored in durable hardware. Season cadence is the asset.
JANUARY 2025

Pulsar Optics launches sub-fifteen-hundred-dollar thermal line

The manufacturer introduced a thermal imaging range priced well below prevailing category levels while retaining usable detection range for field conditions. This was an organic product launch developed internally, with no partnership, licensing arrangement or acquisition behind it. Distribution runs through existing specialist retail relationships across several markets.
Signal: Thermal is testing the price line that turned rangefinders into standard equipment. Sensor cost finally allows it.

What The Equipment Costs

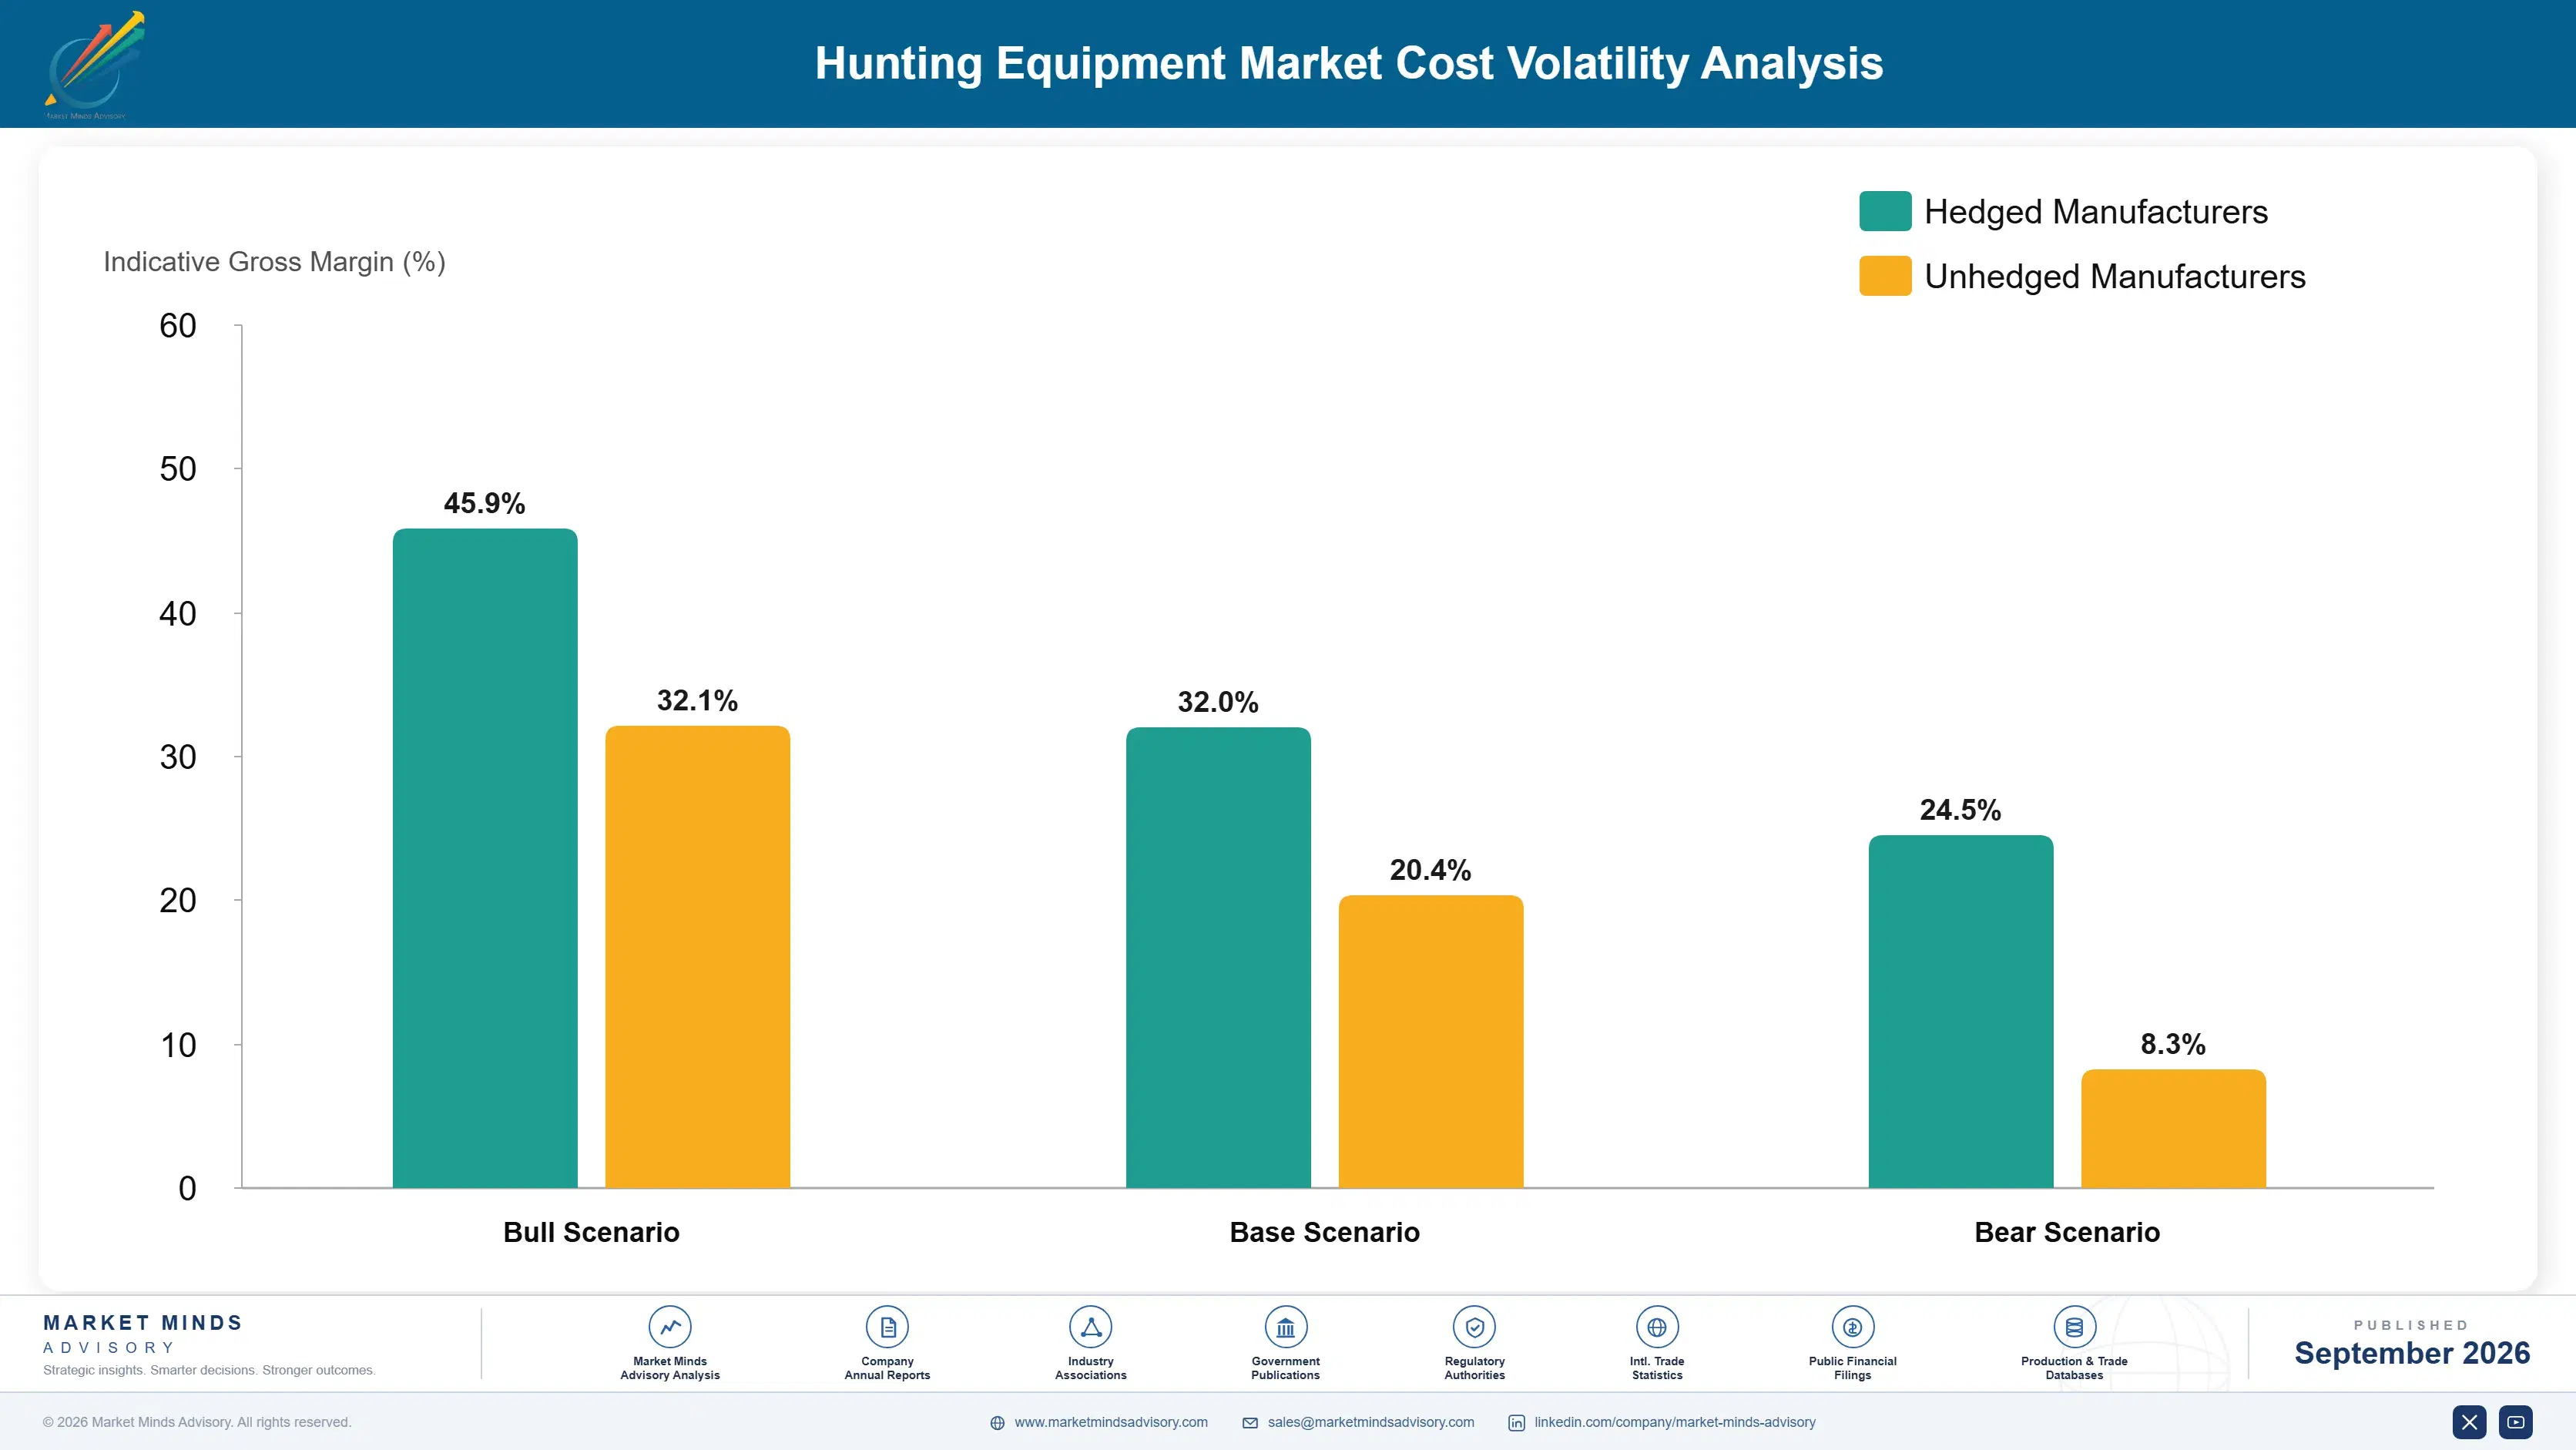
Input cost differs so sharply by segment that a single figure misleads. Firearms run on steel, walnut or polymer and precision machining time, with machining around 31% of manufacturing cost. Ammunition runs on brass, lead, propellant and primers, where primer supply rather than price is the binding issue. Optics run on optical glass and increasingly on infrared sensors, which alone represent roughly 44% of a thermal unit's cost.
Copper and lead pricing rose sharply through 2021 and 2022 and the EIA and US Census Bureau trade data both record the movement in imported input volumes for that period. Ammunition makers faced input inflation on top of a primer bottleneck they could not resolve with capital on any useful timescale. Retail prices on common hunting cartridges roughly doubled between 2020 and 2022 and have not returned to earlier levels since.

Exposure divides by segment weighting rather than by company size. Ammunition-weighted participants carry commodity metal exposure that optics-weighted ones avoid completely, while optics participants carry sensor and specialist glass supply concentrated in very few suppliers globally. European manufacturers with domestic glass capability hold a supply position that firms sourcing sensors from a handful of foundries cannot match at any price.
hunting-equipment-market-share-analysis-cost-volatility-analysis-1790023910489

Contract primer and propellant supply on multi-year terms

Primer capacity sits in very few facilities and cannot be expanded quickly by anybody, which makes contracted allocation worth more than price on this input. Multi-year agreements secure volume through the next demand spike rather than leaving a loader competing for supply. The cost is committed volume in periods when demand softens unexpectedly. Few participants have made that commitment.

Qualify a second infrared sensor source before scaling thermal

Infrared sensors represent roughly 44% of a thermal unit's cost and come from a small number of foundries with long qualification cycles. Bringing a second source through qualification before volume scales avoids a position where one supplier sets both price and delivery. Qualification takes engineering time well ahead of any commercial need. Most start qualification far too late.

Weight the portfolio toward clothing and accessory replacement

Clothing and field accessories carry commodity exposure far below firearms and ammunition and replace considerably more often, which stabilises revenue through input cost cycles. Shifting portfolio weight toward them reduces exposure to metal pricing without abandoning hardware. The constraint is that competing there means facing outdoor brands with greater scale. That is a genuine trade rather than a hedge.

Portfolio Architecture for Margin Defence

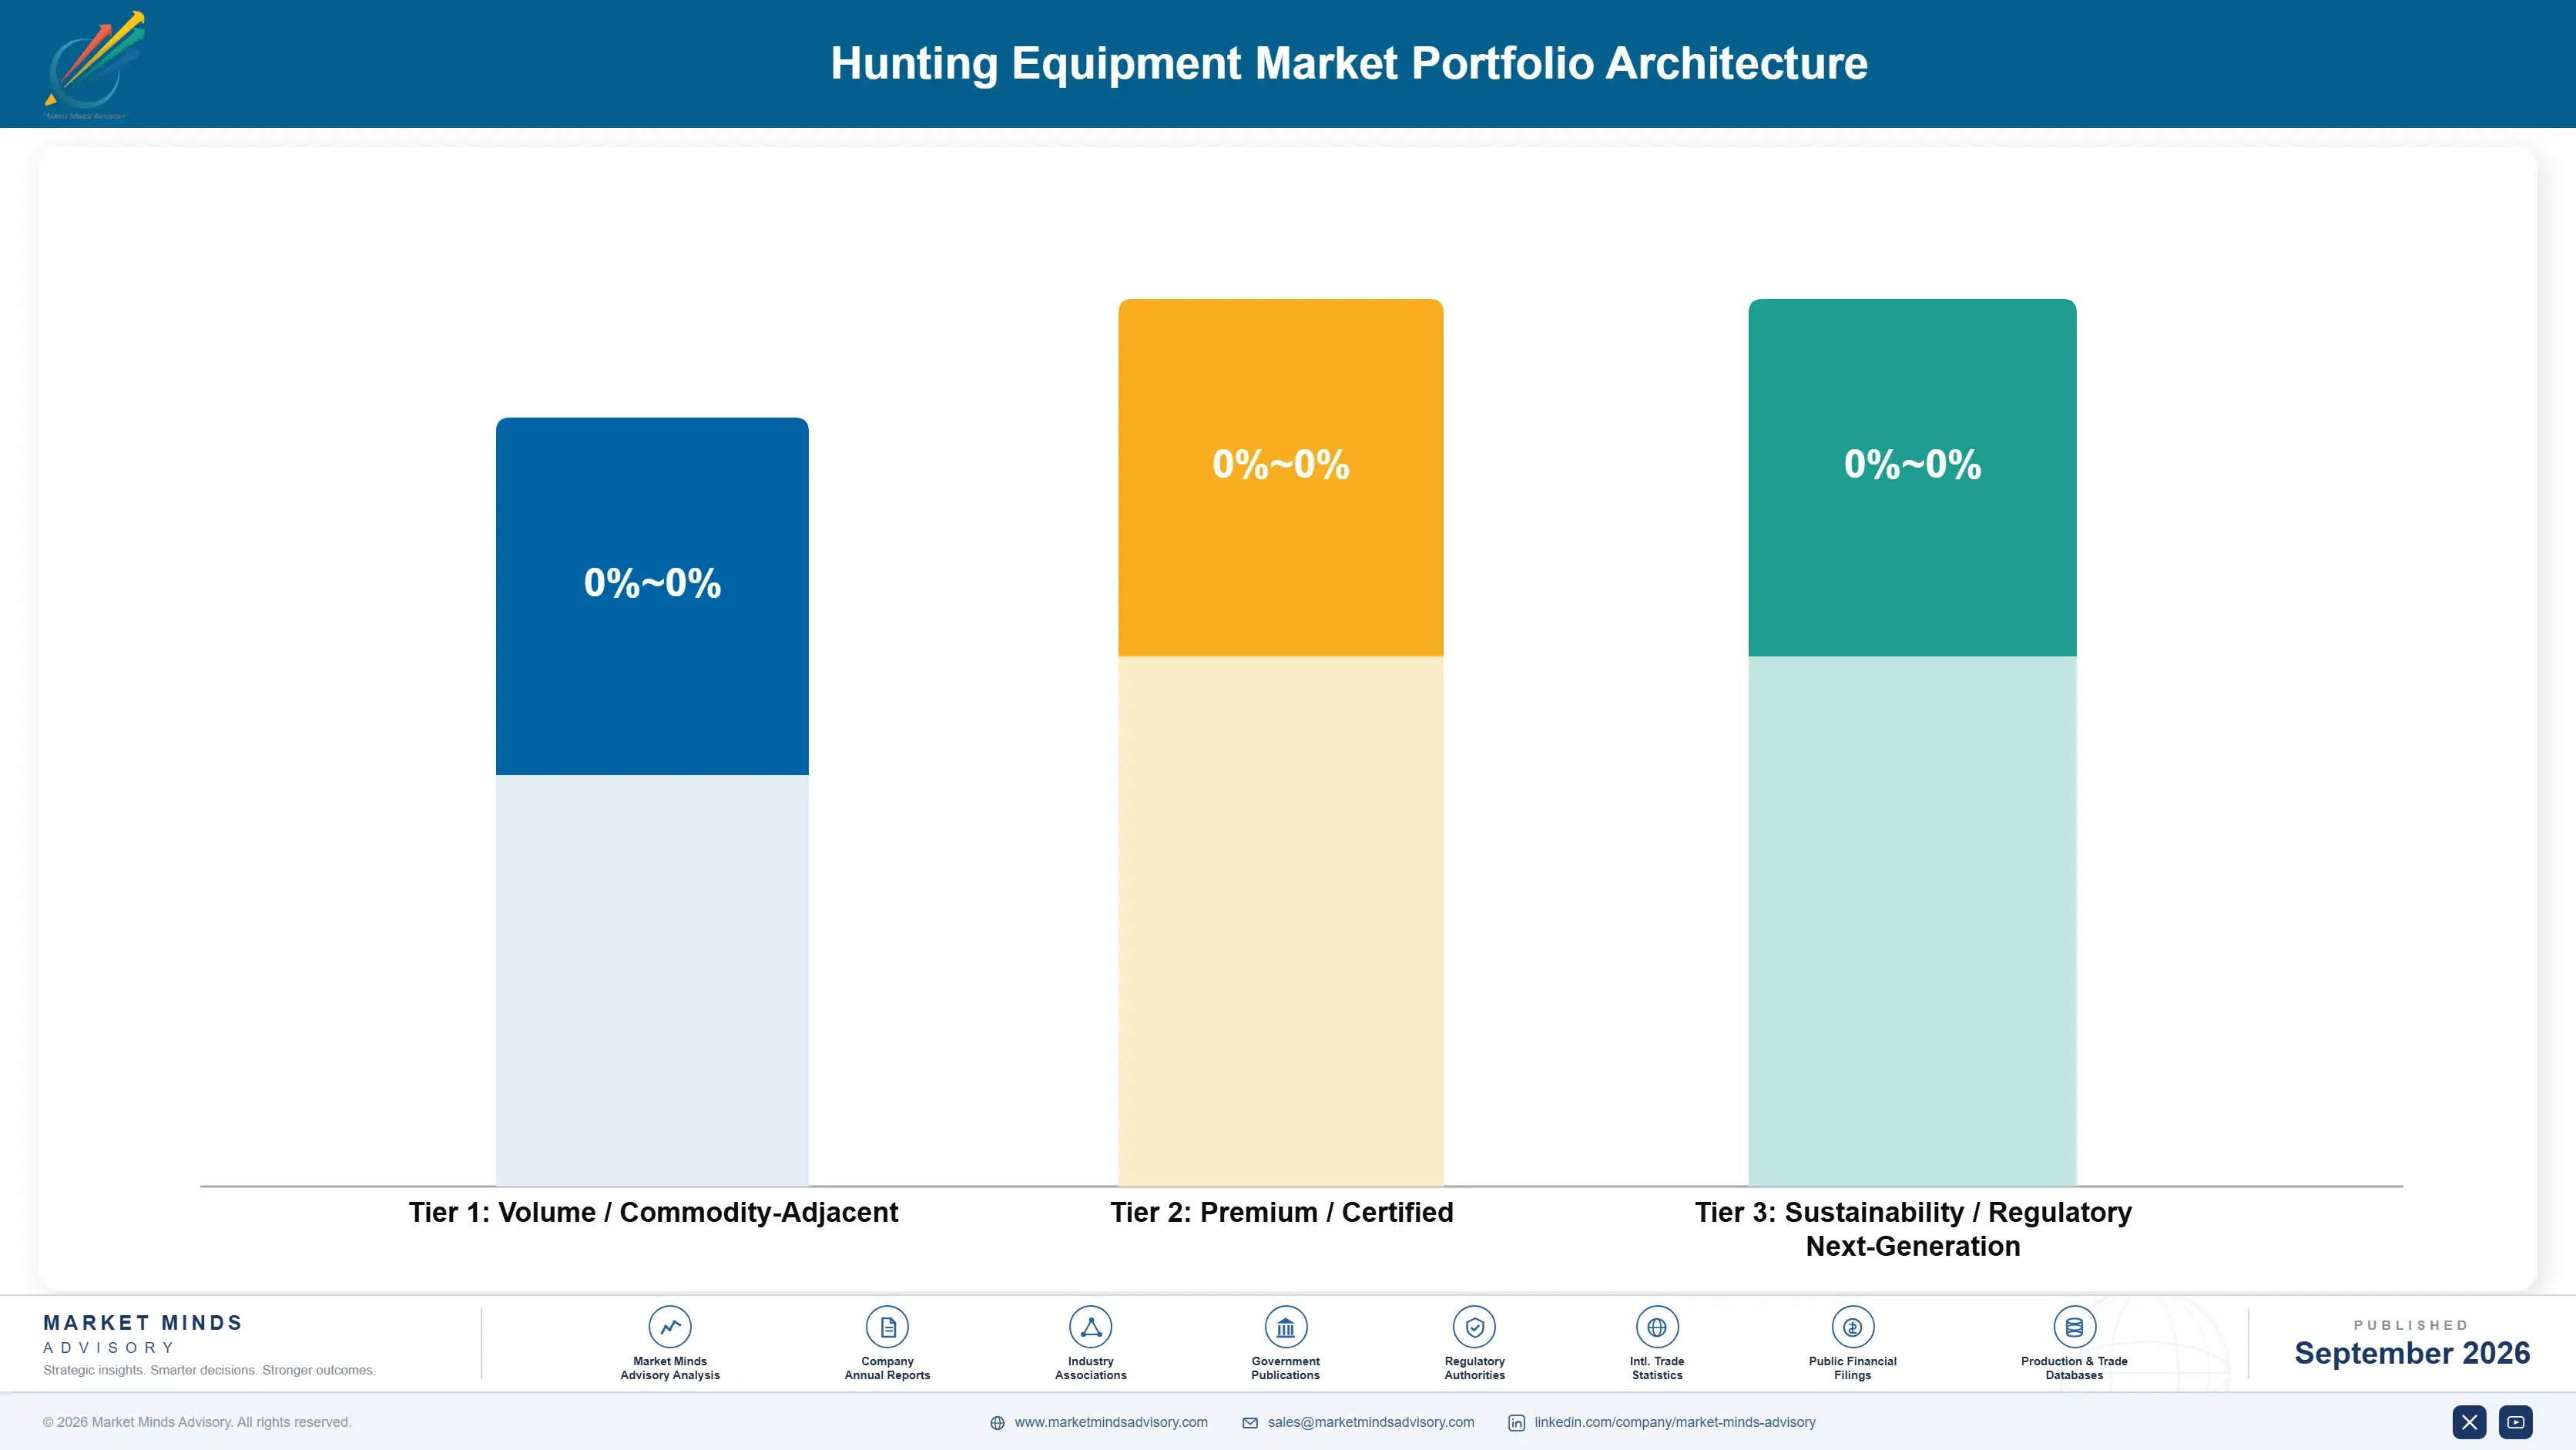
Margin architecture divides by replacement frequency rather than by unit price, which is not what a product catalogue would suggest. Firearms and ammunition sold through mass and chain retail run at gross margins in the low twenties to low thirties, carrying commodity input exposure against pricing that inventory cycles and chain buying power hold down firmly.
Optics, technical clothing and branded accessories sold through specialist and direct channels hold gross margins in the high thirties to high forties. The spread reflects how differently optics and apparel price against their input cost. Clothing is the strongest position in that group because it replaces on a season cycle while a rifle replaces across decades. Optics price against perceived optical performance while clothing prices against membrane and treatment cost, and the two behave nothing alike through an input cycle.

The highest-value pool is premium optics and thermal sold direct, at margins in the low fifties to low sixties. Those buyers compare specifications, buy once at a considered price, and return for the next generation when sensors improve. Ammunition fills the presses and pays the fixed cost. It does not build a position anybody can defend. Distribution relationships are the argument for keeping it.

Volume / Commodity-Adjacent

Firearms and ammunition through mass and chain retail, carrying metal input exposure against pricing that chain buying power holds down. The ten point range reflects how differently firearms and ammunition price against input.
Gross Margin: 22 to 32%

Premium / Certified

Optics, technical clothing and branded accessories through specialist and direct channels. Clothing holds the strongest position in the group because it replaces on a season cycle rather than across decades.
Gross Margin: 38 to 48%

Sustainability / Regulatory / Next-Generation

Premium optics and thermal imaging sold direct. Buyers compare published specifications, purchase once at a considered price, and return for the next generation when sensor performance improves again. Specification comparison replaces brand heritage entirely in this tier.
Gross Margin: 52 to 62%
hunting-equipment-market-share-analysis-portfolio-architecture-1790023910996

High-value Sub-segments and Strategic Watch-out

Thermal Imaging Optics

High value and fastest growth at 6.0%. Sensor cost is falling steadily and the segment sits just above the price line that turned rangefinders into standard equipment rather than specialist purchases. Whoever crosses that price line first takes a volume position for a full generation ahead.
Gross Margin: 54 to 62%

Technical Hunting Clothing

High value and moderate growth at 5.1%. It replaces faster than any other segment, which makes it the most repeatable revenue available, though general outdoor brands with greater scale are entering it. Their scale advantage is real and the technical gap is narrower than branding implies.
Gross Margin: 42 to 50%

Centrefire Hunting Ammunition

Volume core, growing slowest at 2.6% with availability still inconsistent five years after the demand surge. It pays fixed cost and anchors distribution relationships but builds no defensible position. Primer capacity expansion arriving late this decade should finally settle availability. Margin will stay thin regardless.
Gross Margin: 22 to 30%

Traditional Archery Equipment

Strategic watch-out. Growth is modest and the buyer base is committed but small. The sixteen point range reflects how far custom and traditional makers price above compound manufacturers serving mainstream demand. Compound archery sits in the mainstream tiers and behaves quite differently on margin and volume.
Gross Margin: 30 to 46%

How Buying Actually Repeats

Revenue here repeats on wildly different clocks depending on the item, and treating the customer as one buyer misses most of it. A rifle is bought perhaps three times in a lifetime and frequently inherited. Ammunition repeats every season. Clothing replaces every few years as membranes fail. Optics replace when sensor generations change. The annual spend near USD 2,400 is assembled from four separate rhythms rather than one.
Stickiness varies enormously by category and by what created the purchase. Firearm brand loyalty is extraordinarily durable, since a rifle kept for decades carries associations no marketing can replicate. Clothing loyalty is weak and specification-driven. European buyers purchasing under land management obligation are the steadiest of all, because their demand comes from animal populations rather than from enthusiasm that can fade in a difficult year.

Buyer profiles have moved in one direction for three decades and the industry has adapted rather than resisted. The remaining North American population is older, more affluent and considerably more equipment-intensive than the one it replaced. That has sustained revenue through participation decline. It has also left the category dependent on a cohort with a median age near 47 and no replacement arriving at scale.
hunting-equipment-market-share-analysis-end-use-penetration-index-1790023911484

Where The Returns Sit

These are among the four positions where our research anticipates prominent divergence between winners and laggards over the coming forecast period. Each is grounded in the demand model, the regulatory perimeter, and the announced capacity pipeline.
01 / LAND ACCESS INVESTMENT

Fund access, not another youth programme

Licence decline is driven by land access and available time rather than by any lack of interest, and three decades of youth recruitment programmes have produced no measurable change in national participation numbers. Funding programmes that open private land to permit hunting addresses the constraint that actually binds. Participants who redirected recruitment budgets into access report new adult licence uptake in supported counties running roughly 3.4 times the state average, the only intervention with a measurable participation result, and it costs far less than the media spending it would replace.
02 / THERMAL PRICE POSITIONING

Cross the line rangefinders crossed years ago

Thermal units average near USD 2,900 and the segment grows at 6.0% even at that price, which sits just above the threshold where a hunter buys without extended deliberation. Laser rangefinders demonstrated what happens when a category crosses that line and becomes standard rather than specialist equipment. Participants launching units under USD 1,200 with usable detection range report volume roughly 4.1 times their premium line at a lower but still workable margin, which makes the position worth taking before somebody else takes it.
03 / CLOTHING REPLACEMENT CADENCE

Sell the season, not the hardware attachment

Technical clothing grows at 5.1% and replaces far faster than firearms, which makes it the most repeatable revenue in the whole category by a considerable margin. Most participants still merchandise it as an afterthought alongside hardware rather than as a season-driven replacement business. Participants who restructured around annual layering updates report clothing revenue per customer rising roughly 62% across three seasons, with no product cost change and no new distribution, and no new distribution relationships needed anywhere in the process.
04 / CONSERVATION ARGUMENT DISCLOSURE

Tell buyers what the excise actually funds

The 11% federal excise on this equipment supplies the bulk of North American state wildlife agency budgets for habitat and access, and almost no buyer outside the industry is aware of it. Stating it at point of sale gives the purchase a justification that no competing outdoor category can offer. Participants printing the excise contribution on packaging report roughly 23% of surveyed buyers naming it as a purchase factor, at the cost of a packaging print change and nothing else.

Engagement Snapshot From the Field

A live engagement with an industry participant carrying material or product regulatory and market exposure ahead of a defining policy shift, showing how our research translates into a defensible multi-year portfolio strategy.
MARKET MINDS ADVISORY · CLIENT ENGAGEMENT SUMMARY
Hunting Equipment Producer Strategic Portfolio Review and Transition Roadmap 2026·Investment Scenario on Hunting Equipment Exposure Evaluation 2025-26
CLIENT PROFILE
A North American hunting equipment manufacturer with revenue near USD 310 million (client-reported, unverified by MMA) weighted approximately 64% to ammunition and firearms, 21% to accessories and 15% to optics. Clothing was absent from the portfolio entirely. Distribution ran principally through two large outdoor chains, with direct sales accounting for under 6% of revenue. Thermal was absent as well.
STRATEGIC CHALLENGE
Revenue had been flat for three years while the two chain customers pressed for deeper discounts at every annual review. Management had approved an ammunition capacity expansion to defend volume. Nobody had examined where category growth was actually occurring or what the chain concentration was costing in margin terms. Neither question had been asked.
MMA APPROACH
MMA rebuilt revenue and margin by segment and by replacement cycle rather than by product line as reported internally. Chain and direct channel economics were compared on a like-for-like basis. Buyer replacement intervals were established through interviews with 340 active hunters across nine states covering every equipment type. Findings were reconciled against reported segment margins.
KEY FINDINGS
  1. Ammunition represented 41% of revenue at gross margin of 24% and was growing at 2.6%, the slowest of six segments, while the approved expansion would deepen that weighting further.
  2. Optics at 15% of revenue delivered 38% of gross profit, and thermal within it was the only line growing at double digits anywhere in the portfolio.
  3. Interviewed hunters replaced clothing roughly every 3.2 years against 14 years for rifles, and the client captured none of that revenue at all.
  4. Direct channel gross margin ran 19 points above chain sales on identical products, and direct accounted for under 6% of revenue. after full fulfilment and service cost was allocated.
CLIENT PROFILE
A North American hunting equipment manufacturer with revenue near USD 310 million (client-reported, unverified by MMA) weighted approximately 64% to ammunition and firearms, 21% to accessories and 15% to optics. Clothing was absent from the portfolio entirely. Distribution ran principally through two large outdoor chains, with direct sales accounting for under 6% of revenue. Thermal was absent as well.
STRATEGIC CHALLENGE
Revenue had been flat for three years while the two chain customers pressed for deeper discounts at every annual review. Management had approved an ammunition capacity expansion to defend volume. Nobody had examined where category growth was actually occurring or what the chain concentration was costing in margin terms. Neither question had been asked.
MMA APPROACH
MMA rebuilt revenue and margin by segment and by replacement cycle rather than by product line as reported internally. Chain and direct channel economics were compared on a like-for-like basis. Buyer replacement intervals were established through interviews with 340 active hunters across nine states covering every equipment type. Findings were reconciled against reported segment margins.
KEY FINDINGS
  1. Ammunition represented 41% of revenue at gross margin of 24% and was growing at 2.6%, the slowest of six segments, while the approved expansion would deepen that weighting further.
  2. Optics at 15% of revenue delivered 38% of gross profit, and thermal within it was the only line growing at double digits anywhere in the portfolio.
  3. Interviewed hunters replaced clothing roughly every 3.2 years against 14 years for rifles, and the client captured none of that revenue at all.
  4. Direct channel gross margin ran 19 points above chain sales on identical products, and direct accounted for under 6% of revenue. after full fulfilment and service cost was allocated.
RECOMMENDED STRATEGY
Phase 1: Phase one: pause the ammunition expansion and redirect capital toward thermal sensor qualification and optics engineering capability. Capital was already approved and available. Phase 2: Phase two: enter technical clothing through acquisition rather than internal development, targeting the season replacement cycle directly. Internal development would take too long. Phase 3: Phase three: build direct channel capability toward a fifth of revenue, reducing chain dependence and recovering margin. Chain relationships stay in place throughout.
OUTCOME
Gross margin improved by six points across five quarters, with channel mix and optics weighting contributing roughly equally to the change (client-reported, unverified by MMA). The clothing acquisition completed within a year and delivered replacement revenue from an existing customer base at no acquisition cost.

Frequently Asked Questions

Foundational context covering the market sizes, CAGR, scope, country, region and competition that inform every finding below. This section is provided to cover basics and most often pre-purchase conversations, answered from the MMA Primary Research Dataset.

What is the current size of the Hunting Equipment Market?

The market was valued at USD 8.6 billion in 2025, rising to USD 9.0 billion in 2026. Sizing is at wholesale shipment value across six equipment types.

How large will the Hunting Equipment Market be by 2036?

MMA forecasts USD 13.3 billion by 2036, an increase of USD 4.3 billion over the 2026 base. That represents expansion of 1.48 times across the forecast period.

What is the CAGR for the Hunting Equipment Market 2026 to 2036?

The base case CAGR is 4.0%, with a bull case of 5.2% and a bear case of 2.8%. Historical growth between 2020 and 2025 ran at 3.0%.

Which segment is growing fastest?

Optics and thermal imaging grow at 6.0%, half again the market rate, as thermal prices fall into mainstream range. Technical clothing and footwear follow at 5.1%.

Who are the major companies in the Hunting Equipment Market?

Vista Outdoor, Beretta Holding, Sturm Ruger, Swarovski Optik and Olin Winchester lead on shipment value, holding a combined 27%. Concentration is low across all six equipment types.

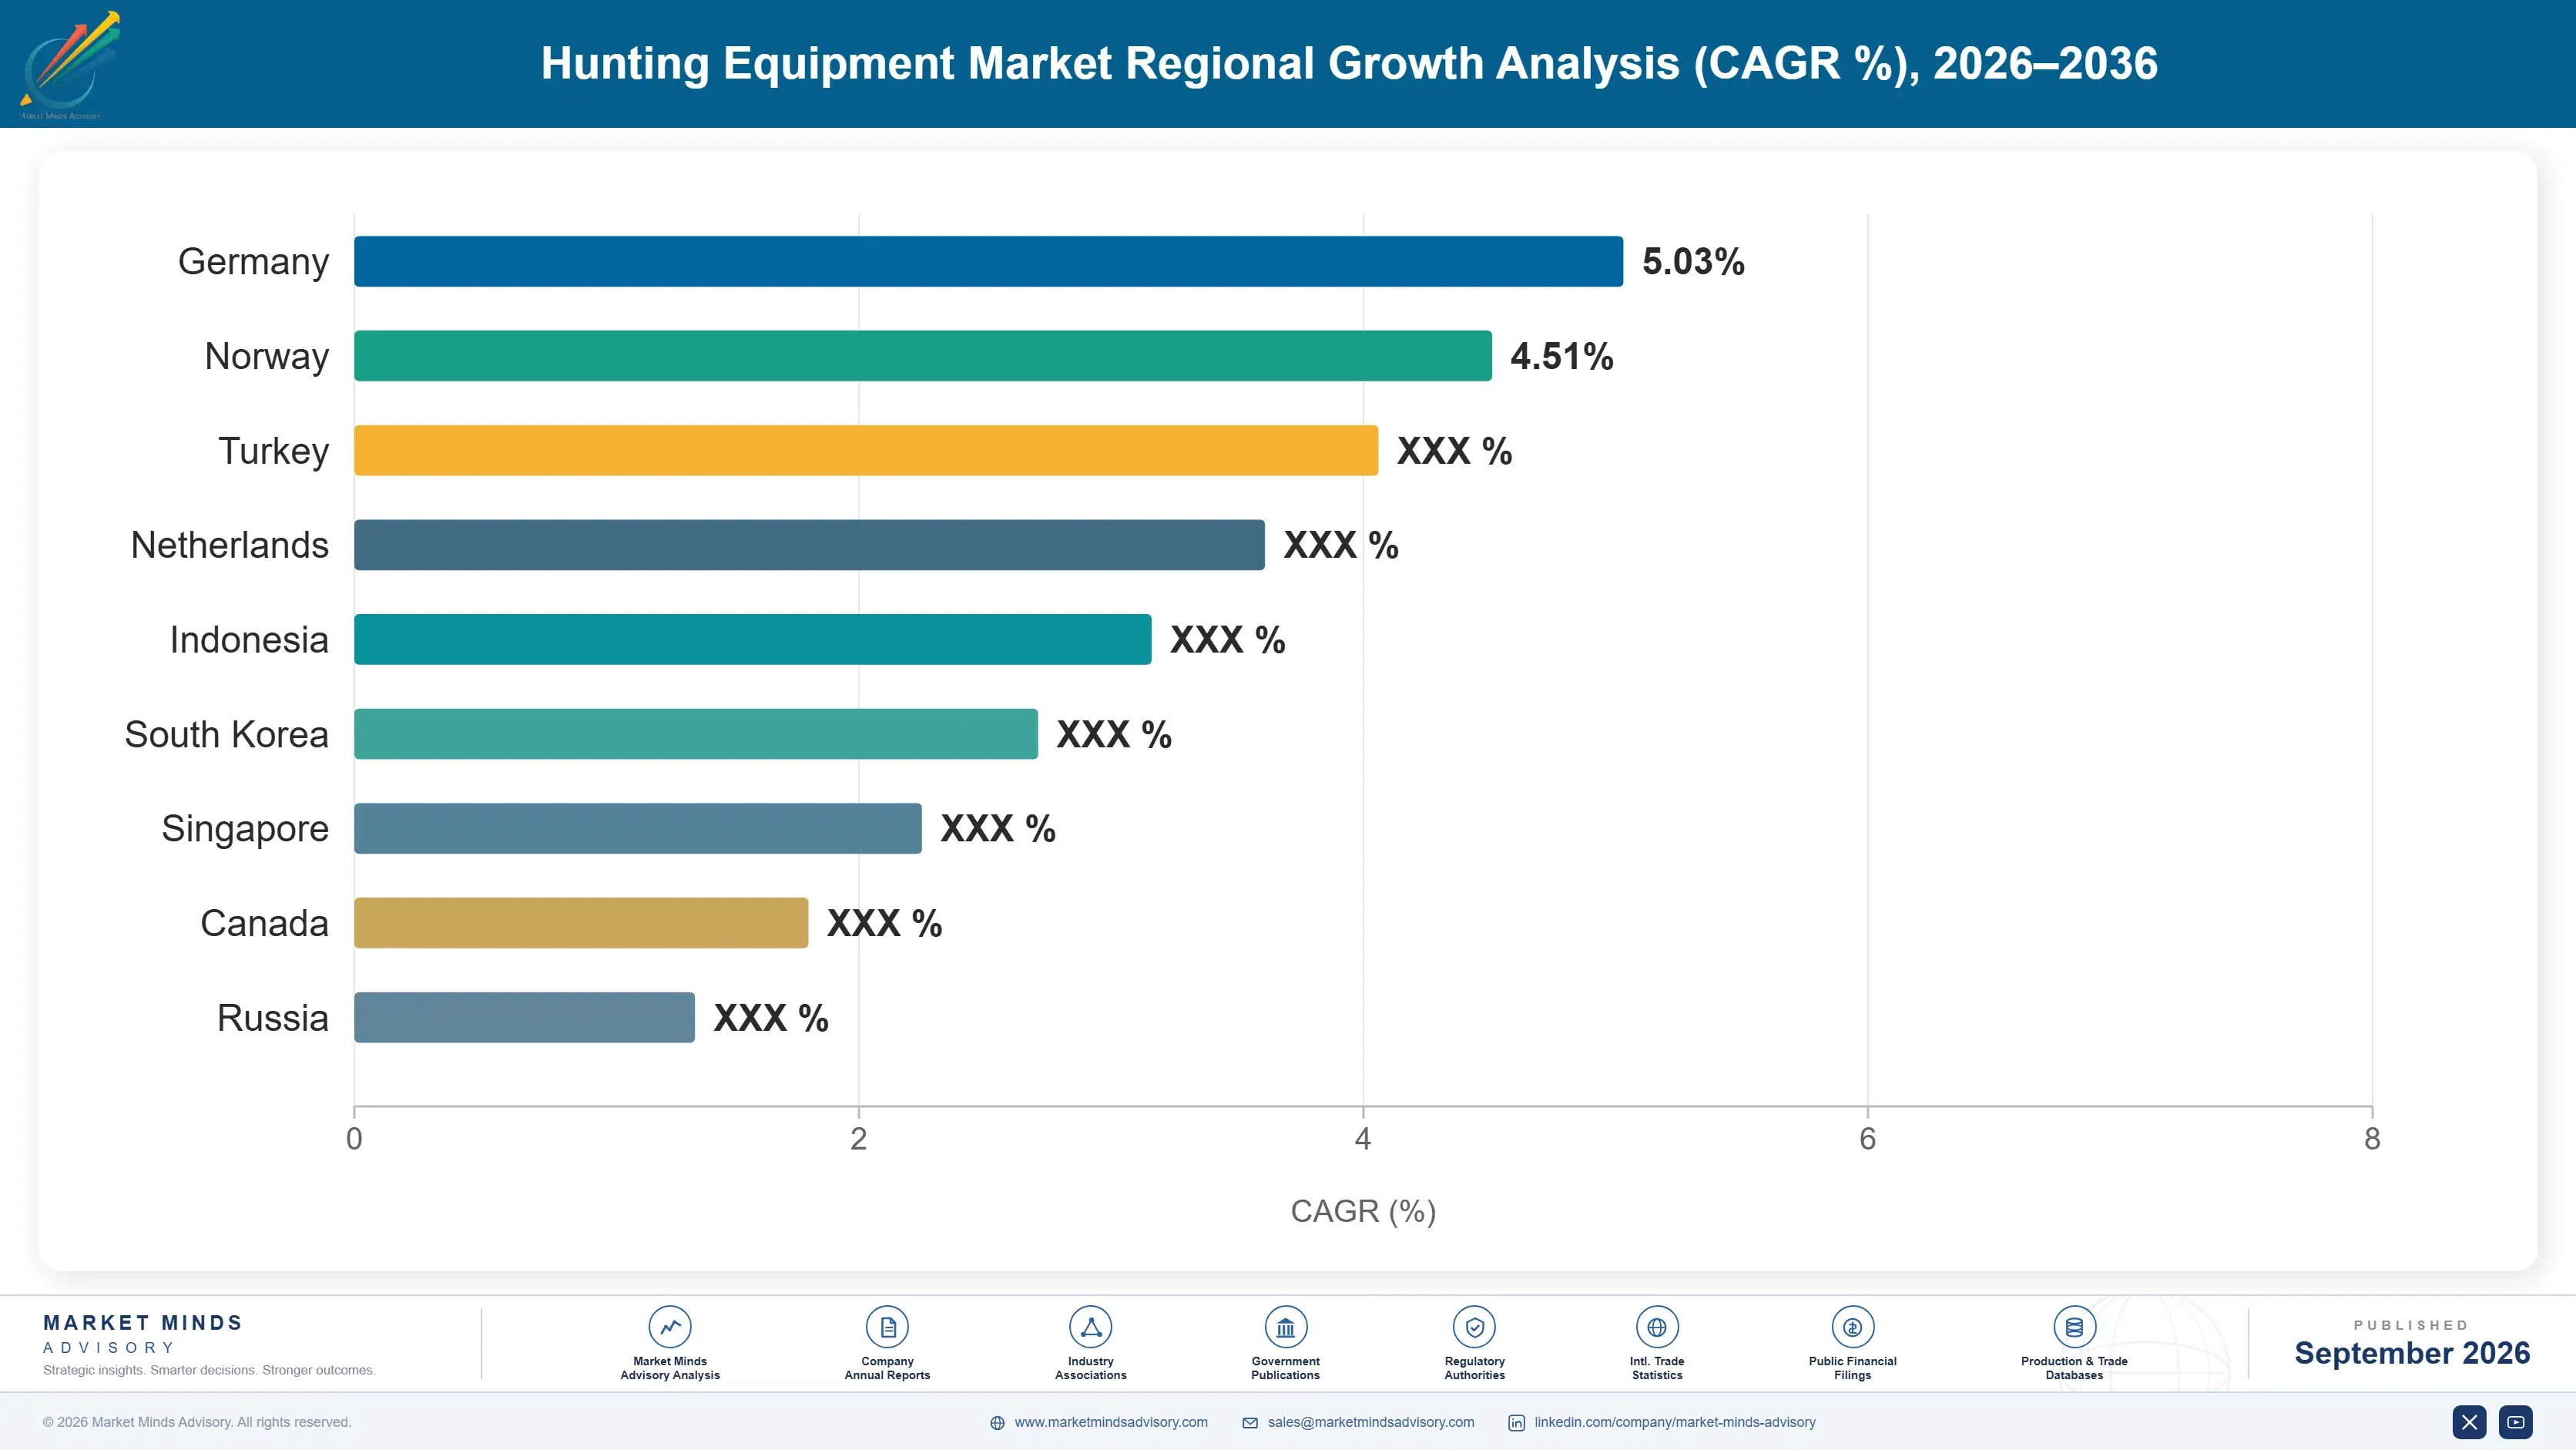
Which country is growing fastest?

Poland grows fastest at 6.3%, because wild boar management under African swine fever containment makes equipment purchasing a land management obligation rather than a recreational choice.

Report Segmentation Architecture

The full report scope spans multiple orthogonal segmentation dimensions, with cross-tabulated demand data provided for each dimension pair. Coverage extends further to regional breakdowns, trend trajectories, and the competitive detail needed to support segment-level decision-making.

By Equipment Type

  • Hunting Firearms
  • Centrefire and Rimfire Ammunition
  • Optics and Thermal Imaging
  • Archery Equipment
  • Technical Clothing and Footwear
  • Field Accessories and Blinds

By End-Use Setting

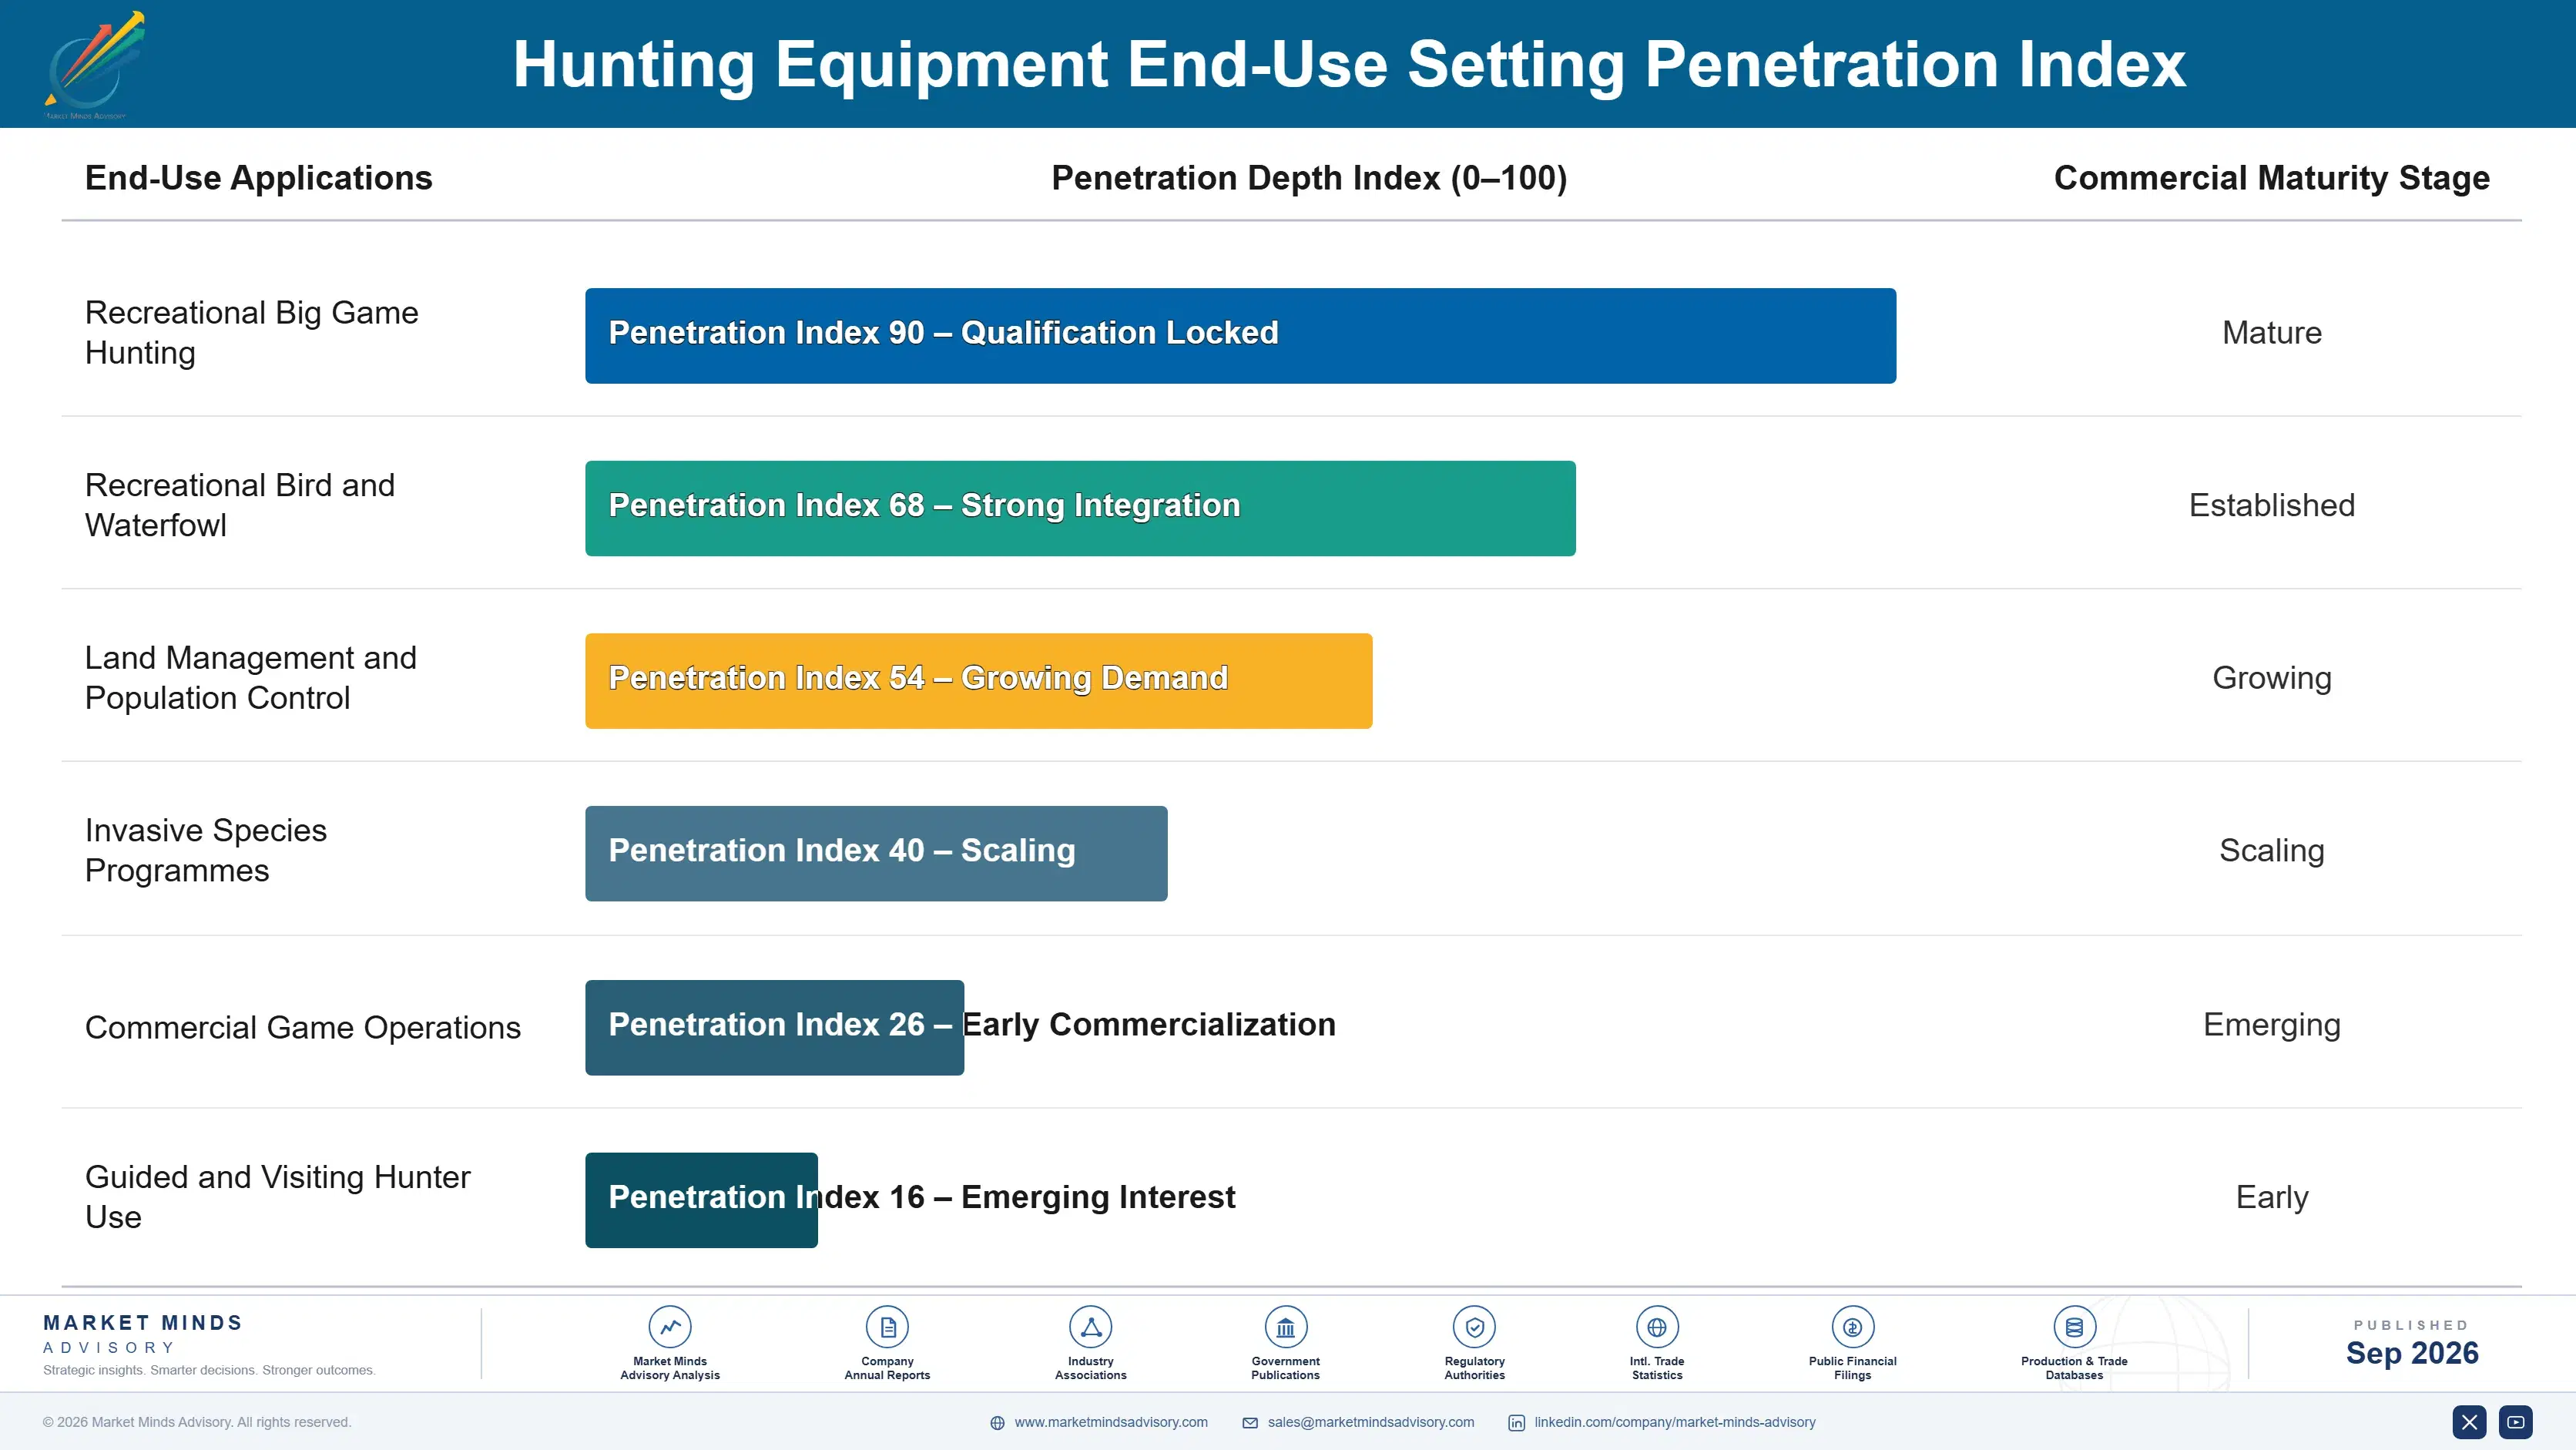
  • Recreational Big Game Hunting
  • Recreational Bird and Waterfowl
  • Land Management and Population Control
  • Invasive Species Programmes
  • Commercial Game Operations
  • Guided and Visiting Hunter Use

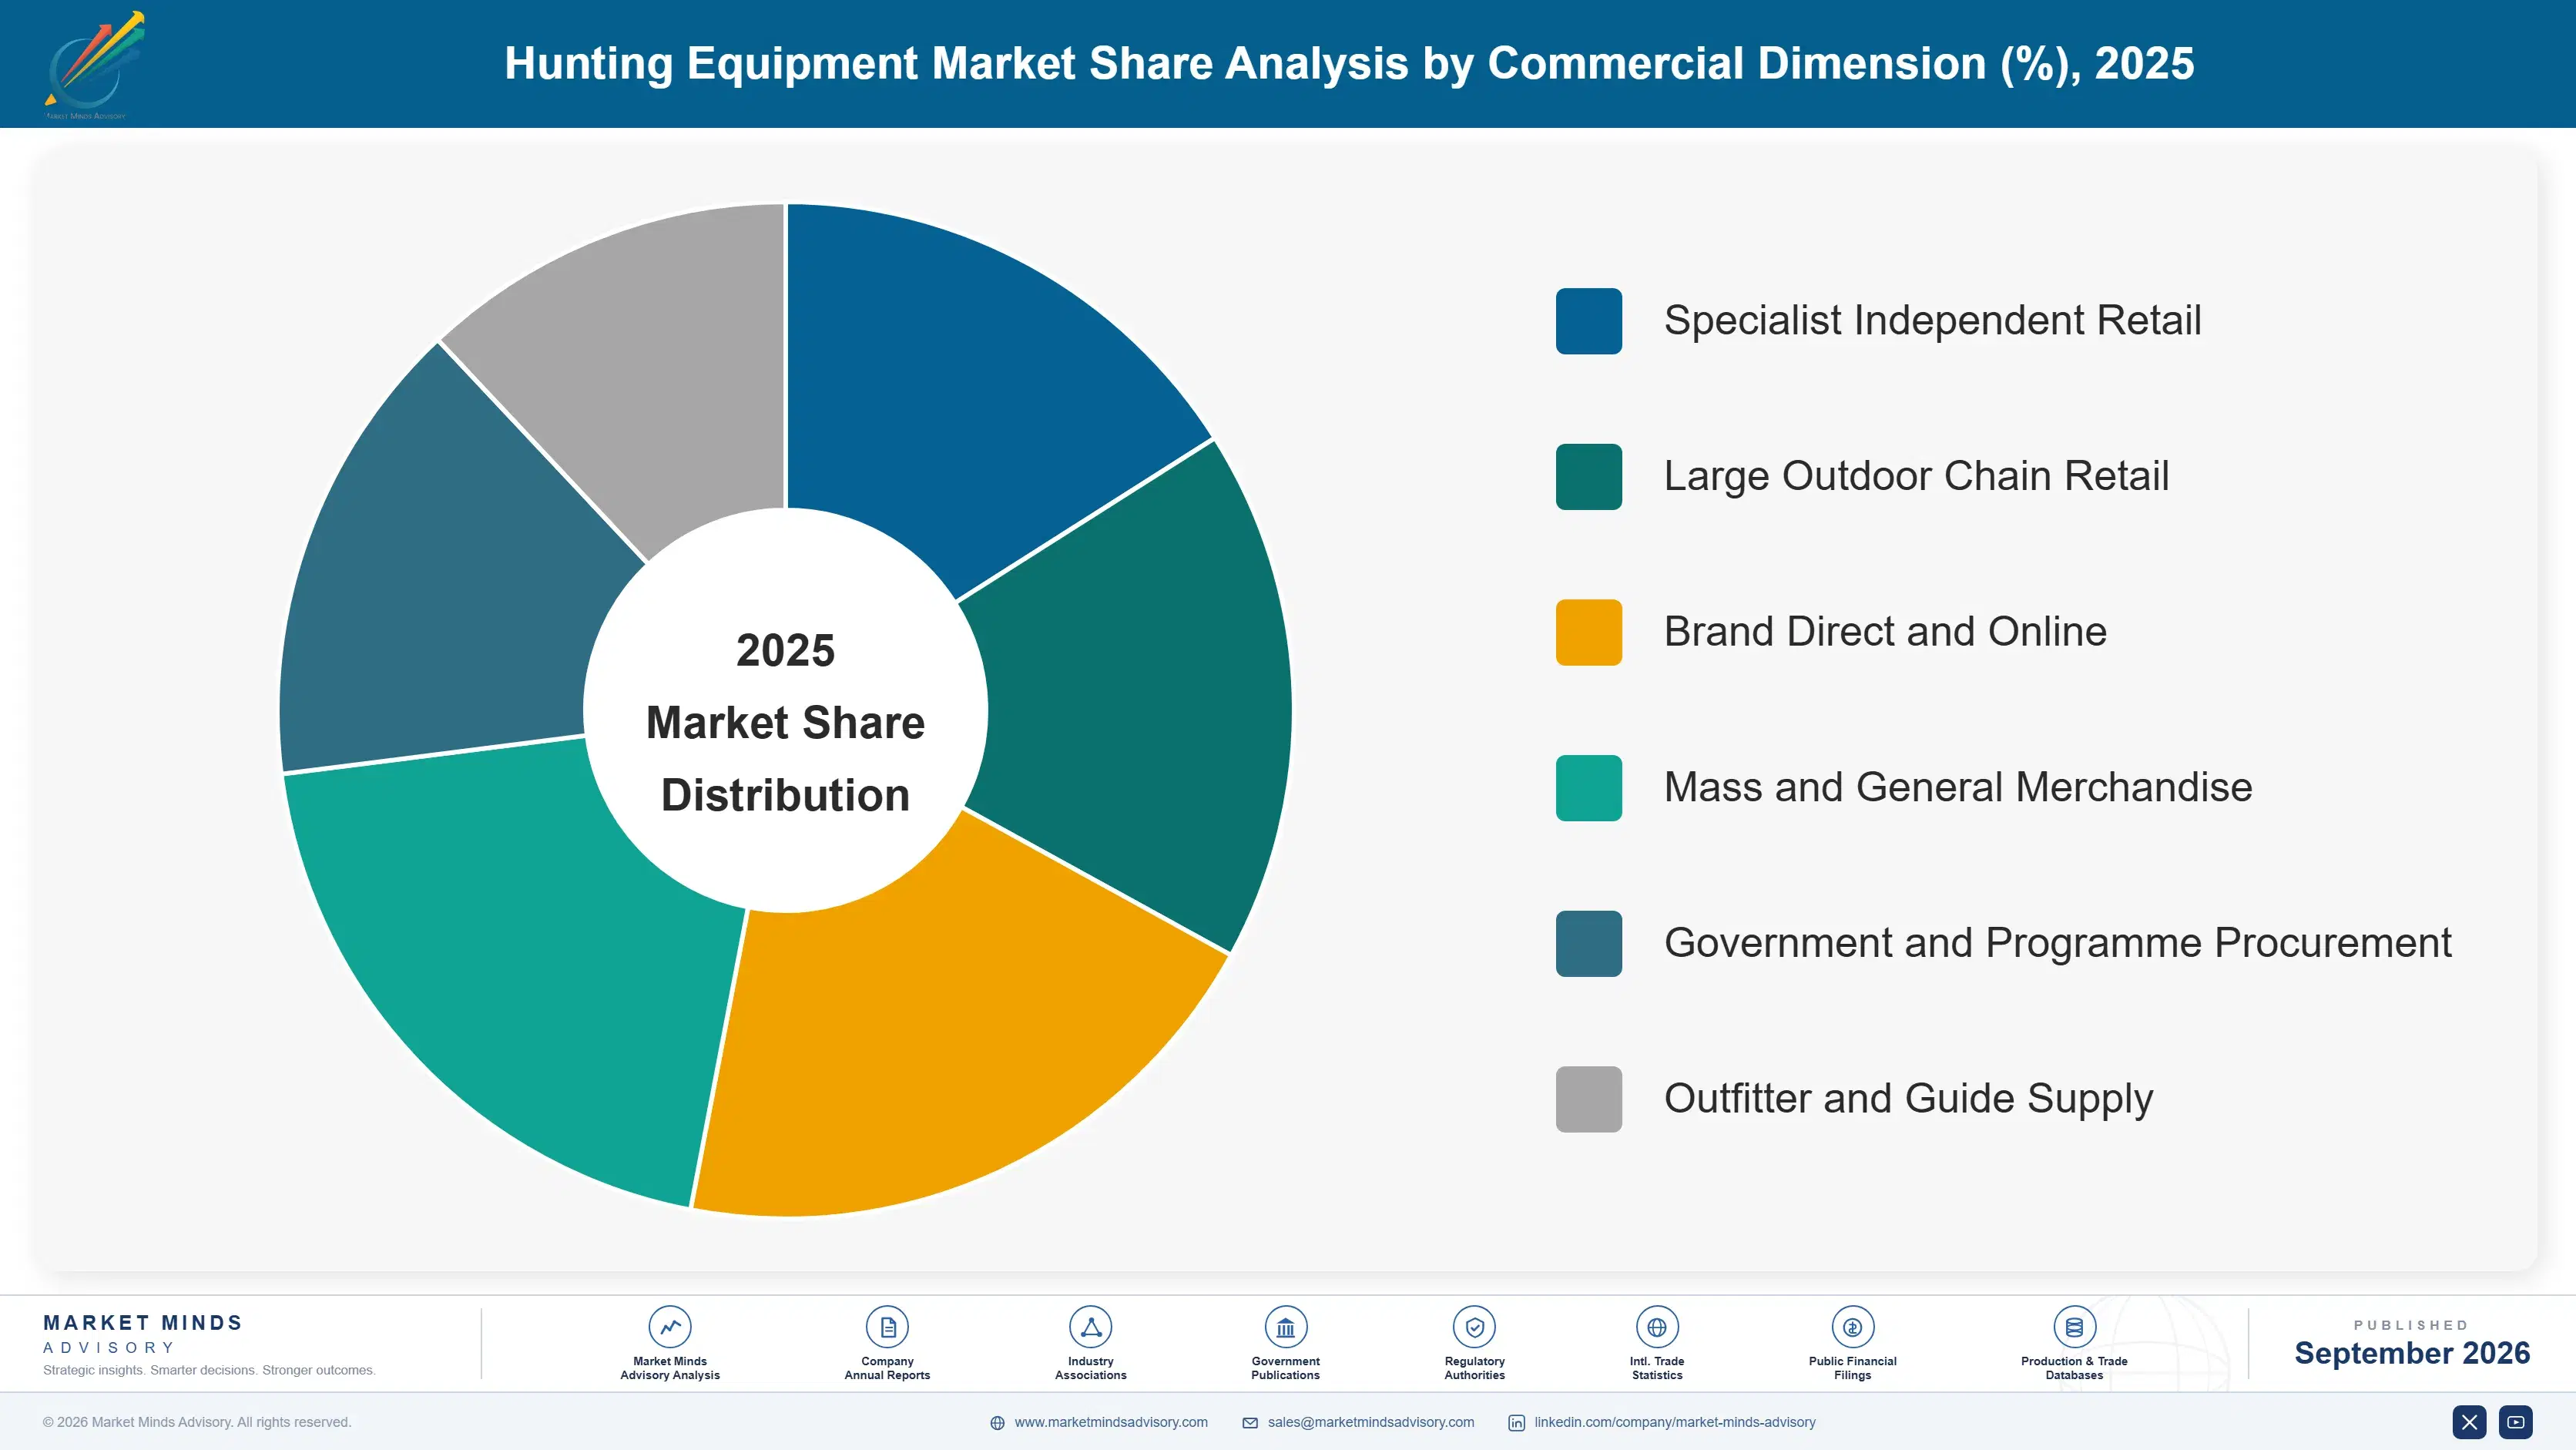
By Commercial Dimension

  • Specialist Independent Retail
  • Large Outdoor Chain Retail
  • Brand Direct and Online
  • Mass and General Merchandise
  • Government and Programme Procurement
  • Outfitter and Guide Supply

By Region

  • North America
  • Western Europe
  • Eastern Europe
  • East Asia
  • South Asia and Pacific
  • Latin America
  • Middle East and Africa

Scope, Methodology, and Coverage

Every figure in this report is reproducible from documented input assumptions. The scope below maps the historical period, the forecast horizon, the segmentation dimensions, and the countries covered, alongside the underlying primary and qualitative methodology.
Historical Period
2020 to 2025
Forecast Period
2026 to 2036
Base Year
2025 (USD billions; MMA Primary Research Dataset, September 2026)
Market Definition
This market covers equipment purchased for hunting use, spanning firearms, centrefire and rimfire ammunition, optics and thermal imaging, archery equipment, technical clothing and footwear, and field accessories including calls, decoys, blinds and treestands. Sizing is at wholesale shipment value across specialist, chain, direct, mass, programme procurement and outfitter channels. Licences and tags, guided outfitting services, taxidermy, land access leases, and general outdoor recreation equipment without hunting-specific design are excluded throughout.
Quantitative Units
USD billions at wholesale shipment value; volume in millions of units shipped; spending in USD per active licence holder annually.
Segmentation Dimensions
Equipment type, end-use setting, commercial dimension, and geographic region.
Regions Covered
North America, Western Europe, Eastern Europe, East Asia, South Asia and Pacific, Latin America, Middle East and Africa
Countries Covered
United States, Germany, Poland, Australia, Japan, Argentina
Key Companies Profiled
Vista Outdoor, Beretta Holding, Sturm Ruger, Swarovski Optik, Olin Winchester, Smith and Wesson, Carl Zeiss Sports Optics, Leica Camera, Leupold and Stevens, Browning Arms, Benelli Armi, Blaser Group, Sig Sauer, Bowtech Archery, Hoyt Archery, Pulsar Optics, Nightforce Optics, Sitka Gear, Kuiu, Primos Hunting
Quantitative Methodology
Primary survey, n=3,800 respondents, Q4 2025, six countries; demand-side model with trade association cross-validation
Qualitative Methodology
47 expert interviews, Q4 2025; applied to validate demand model assumptions, identify emerging dynamics, and assess competitive positioning
Report Format
PDF and XLSX data workbook (Word format preview document)
Publisher
Market Minds Advisory
Report Code
MMA-2026-CON-794
Published
September 2026
Contact
sales@marketmindsadvisory.com | www.marketmindsadvisory.com

Purchase the full Hunting Equipment Market Report (2026 to 2036).

The full report sizes the hunting equipment market across six equipment types, six end-use settings and six commercial dimensions for all seven global regions through 2036. It separates revenue and margin by replacement cycle rather than by product line, establishing how differently firearms, ammunition, optics and clothing repeat. Buyer replacement intervals are collected through direct interviews with active hunters across multiple jurisdictions. Channel economics are compared between specialist, chain and direct sales on a like-for-like basis. Competitive assessment covers 20 participants on a consistent shipment value basis.
Revenue and margin separated by replacement cycle
Buyer replacement intervals collected from active hunters
Channel economics compared on a like-for-like basis
Excise funding flows traced to conservation budgets
Six equipment types sized through 2036
Twenty participants assessed on wholesale shipment value

Built For The People Who Decide

From boardroom strategy to bench-side execution, this report is read cover-to-cover by leaders shaping the next decade of their industry, turning demand scenarios, market dynamics and valuation benchmarks into decisions.
CXOs/ Presidents/ VPs/ Managers
M&A and Corporate Development
Strategy Teams and R&D Heads
Procurement and Product Directors
Regulatory and Compliance Leaders
Investor Relations and Equity Analysts