

Market Minds Advisory
Humectants Cosmetic Market

Humectants Cosmetic Market: Humectants Cosmetic Market: The Direction Water Moves Below Sixty-Five Per Cent Humidity, And Why The Best Performer Is The Cheapest One, 2026 to 2036

Below roughly 65% ambient humidity a humectant pulls water out of skin rather than into it, and only 43% of formulations pair one with an adequate occlusive. Glycerin still wins on corneometry.

Lead Analyst

Published

September 2026

Make Smarter Decisions with Customized Research Insights

Request a free sample report and evaluate market opportunities, growth trends, and competitive dynamics relevant to your business needs.

2025 MARKET VALUE$2.4BMarket Size 2025
2036 FORECAST VALUE$4.8BBase Case , 2026 to 2036
CAGR 2026 TO 20366.4 %Bull 7.6% / Bear 5.2%
INCREMENTAL OPPORTUNITY$2.2BNet 10- year value creation
EXPANSION MULTIPLE1.85x2036 value over 2026 base
Strategic Levers
M&A Pipeline
Regional Outlook
Country Rankings
Competitive Intelligence
Segmental Deep-dive
Call-Us : 91 93563 13602

Executive Snapshot and Market Trajectory.

Below roughly 65% ambient humidity a humectant draws water out of the skin rather than into it. Only about 43% of formulations pair one with an occlusive layer adequate to stop that. A heated winter room sits well under the threshold. Nothing on a pack says so.
Hyaluronic acid and salts grow at 9.6%, half again the market rate of 6.4%, on a claim consumers recognise and almost nobody can verify, since only around 12% of hyaluronic claims disclose the molecular weight distribution actually used. Amino acid and betaine humectants follow at 8.4%. Glycerin grows slowest of the six segments at 4.3%. Specialty polyols take inclusion share from it on sensory grounds rather than measured hydration.
East Asia holds 38% of demand, and Chinese growth of 10.8% leads every market covered on hyaluronic production and skin care formulation together. Glycerin ranks first on measured corneometry among the six chemistries and last on price, which is why formulators dilute it and add costlier alternatives for the claim rather than the performance. Only about 43% of formulations pair an adequate occlusive, which makes the reversal a live problem rather than a theoretical one.
Market Definition
This market covers humectant ingredients used in cosmetic and personal care formulation, including glycerin, hyaluronic acid and its salts, sodium PCA and other natural moisturising factor components, sugar derived humectants, specialty polyol humectants, and amino acid and betaine humectants. It excludes occlusive and emollient agents, film formers, food and pharmaceutical grade humectants, industrial hygroscopic chemicals, and injectable hyaluronic acid products.
Base Year Value
$2.4B in 2025 (MMA Primary Research Dataset, September 2026)
Forecast Period
2026 to 2036, eleven discrete annual values
CAGR
6.4% base case. Bull 7.6%. Bear 5.2%.
Fastest Growth Segment
Hyaluronic Acid And Salts: 9.6% CAGR
Fastest Growth Country
China: 10.8% CAGR
Fastest Growth Region
South Asia and Pacific: 8.4% CAGR
Largest Region
East Asia: 38% of 2025 global value
Market Leaders
Bloomage Biotechnology, Croda International, BASF, Ashland, and Evonik Industries lead the field. Source: MMA Primary Research Dataset, July 2026.
Primary Survey
n=3,800 procurement and R&D decision-makers, Q4 2025, six countries
Methodology
Demand-side build-up, cross-validated against public data, 47 expert interviews

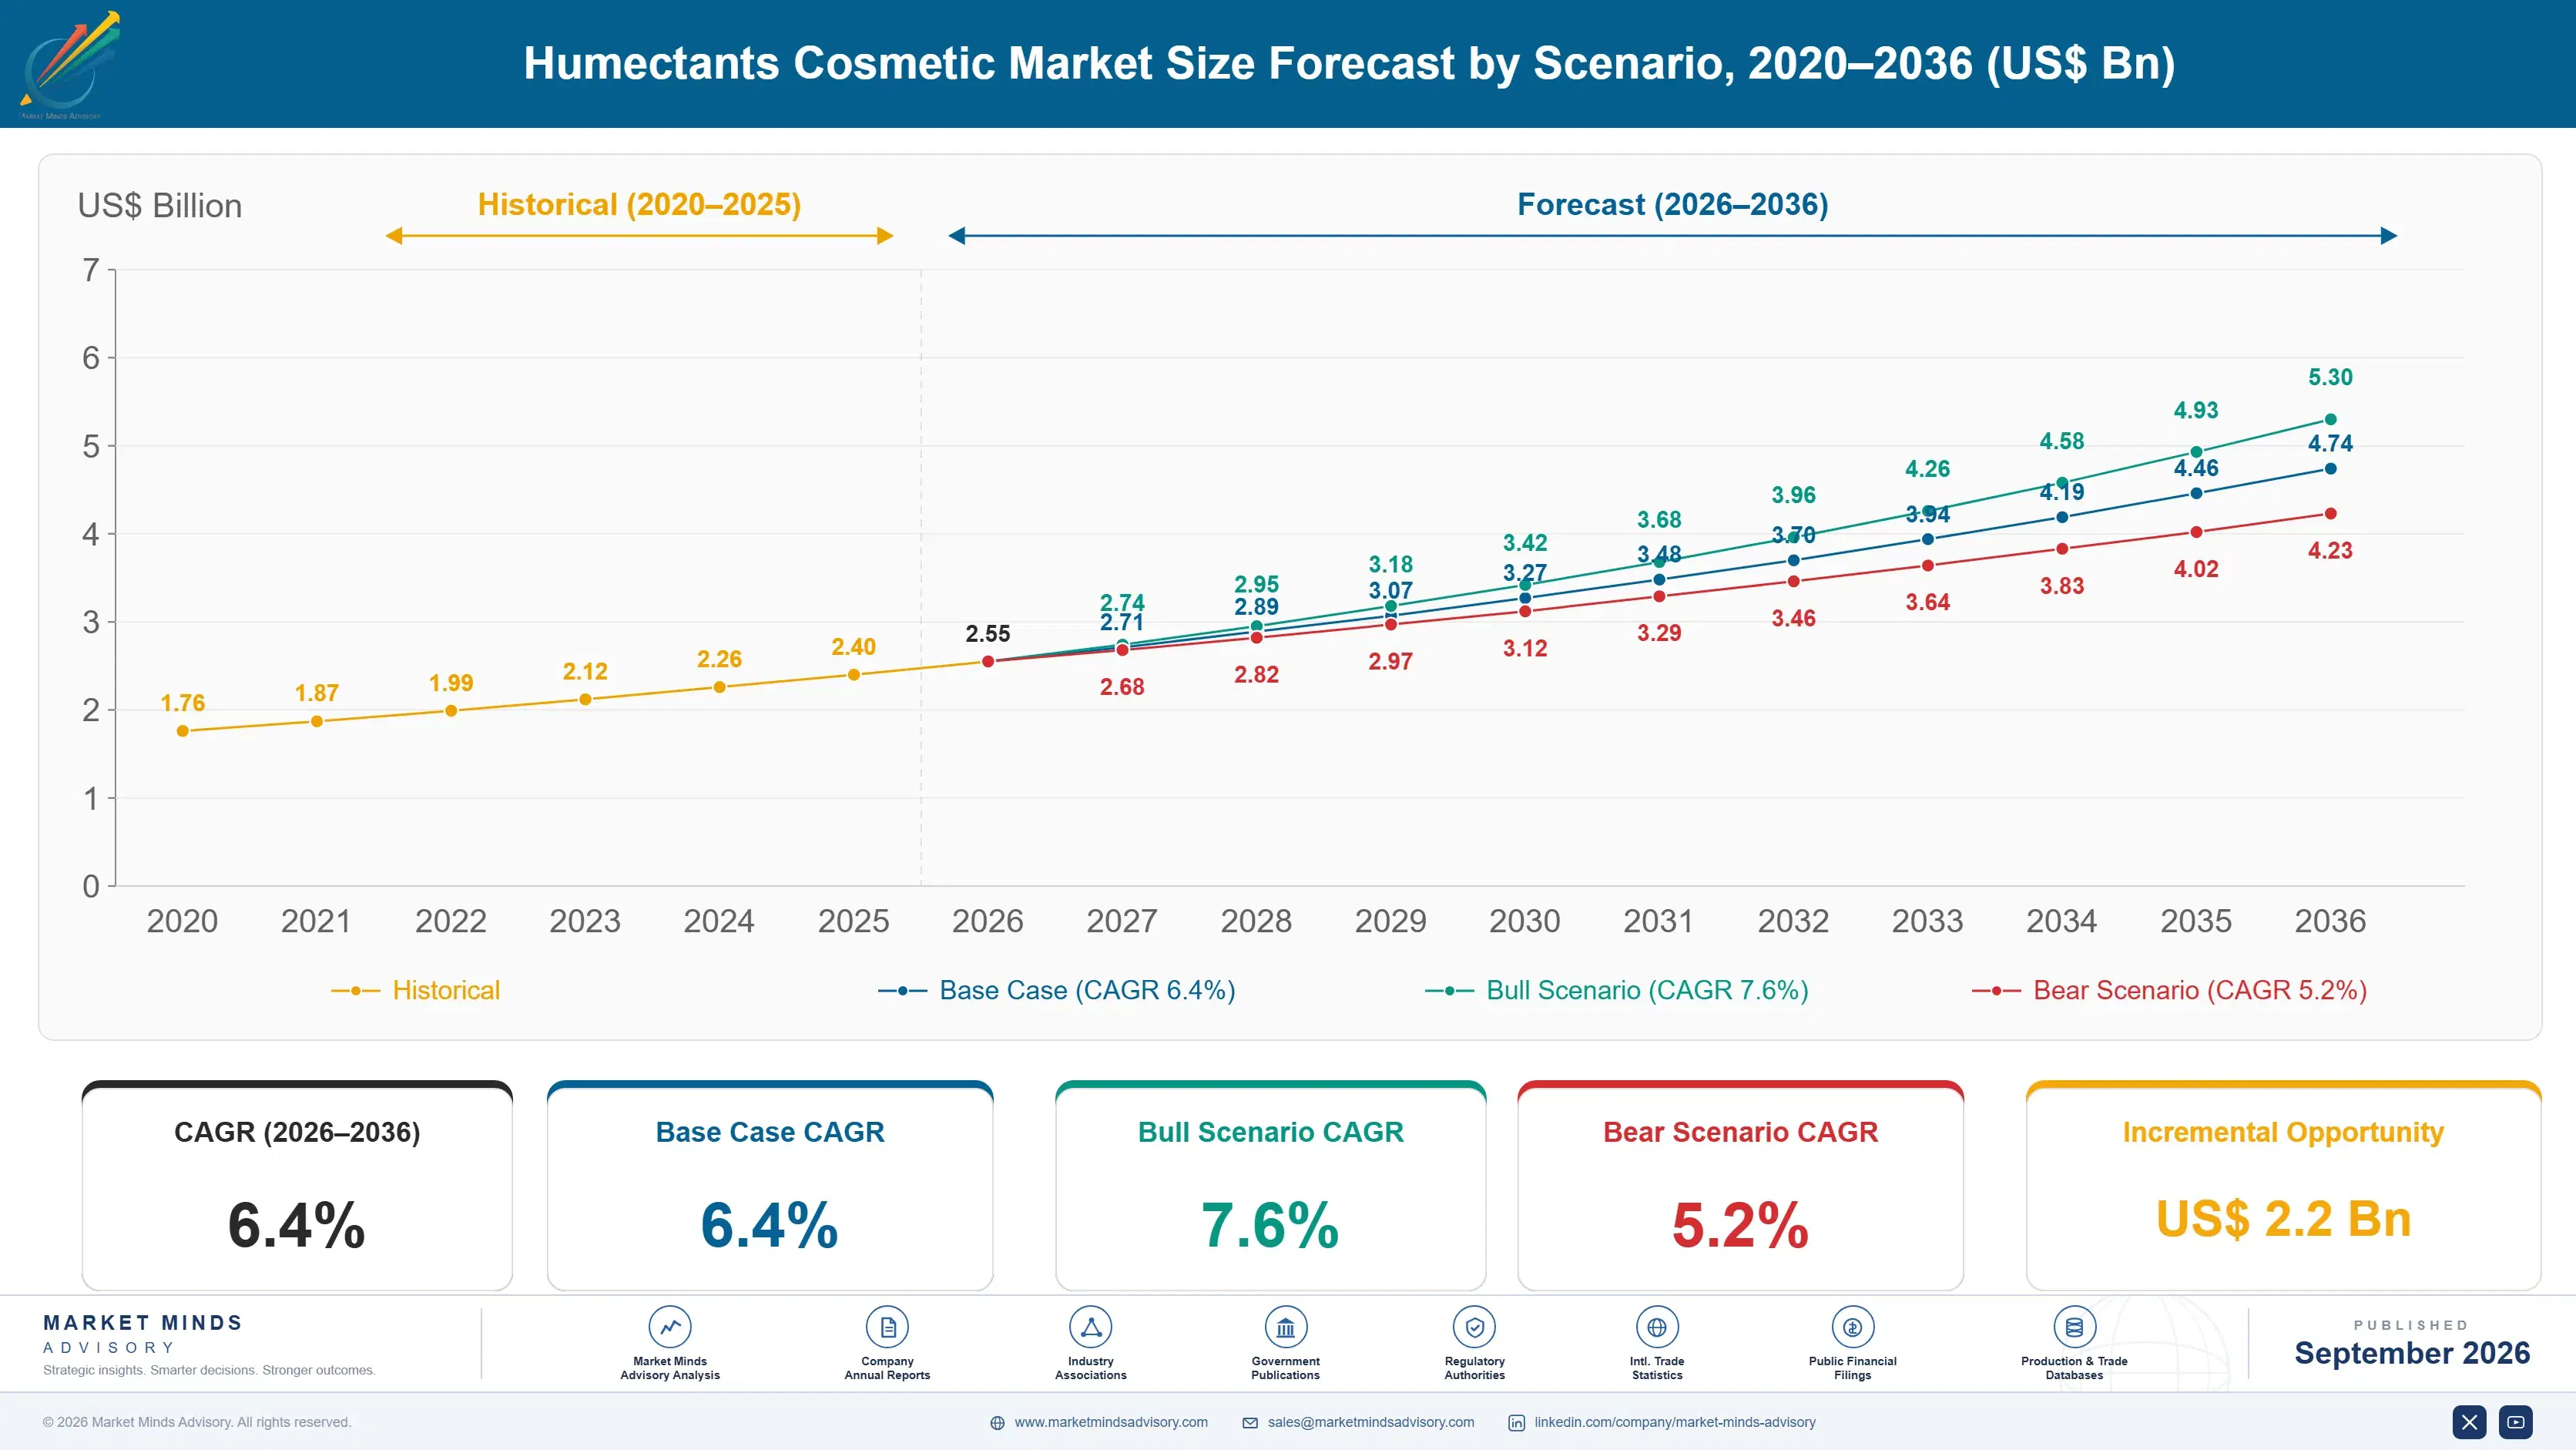
Humectants Cosmetic Market Forecast Scenarios

humectants-cosmetic-market-size-forecast-scenario-1790016824281
Growth from 2020 to 2025 ran at 5.3% and its composition shifted more than its rate did. Hyaluronic acid volumes rose sharply as Chinese fermentation capacity expanded and unit prices fell far enough to move the ingredient from premium serums into mass moisturisers. Glycerin volumes grew with overall formulation output while losing inclusion share to chemistries that feel better on application.
The base case at 6.4% rests on three mechanisms. Chinese hyaluronic capacity keeps pushing unit costs down, which widens the applications that can carry the claim. Asian skin care formulation output keeps expanding, with Chinese growth at 10.8% leading every country covered. And specialty polyols keep taking inclusion share from glycerin on sensory grounds that have nothing to do with measured hydration. None of the three assumes formulators start pairing occlusives as standard practice.
The bull case at 7.6% depends on formulators pairing humectants with adequate occlusives as a standard rather than an option, which would raise inclusion levels across the board. The bear case at 5.2% is glycerin supply: around 71% arrives as a biodiesel by-product, and a fuel policy change reducing biodiesel output would tighten the base chemistry of the whole category.

Which Way The Water Actually Moves

A humectant moves water along a gradient and the gradient runs both ways. Above roughly 65% ambient humidity it pulls moisture from the air into the outer skin, which is what everybody assumes is happening. Below that threshold it pulls from the dermis outward, and a heated room in a northern winter sits comfortably under it. Only about 43% pair one with an occlusive sufficient to stop the loss.
TOP FIVE CONCENTRATION38%Share of ingredient revenue held by the leading suppliers
REVERSAL HUMIDITY THRESHOLD65%Ambient humidity below which humectants draw water outward
OCCLUSIVE PAIRING RATE43%Formulations pairing a humectant with an adequate occlusive
GLYCERIN PERFORMANCE RANK1stRank of the cheapest chemistry on measured hydration performance
WEIGHT DISCLOSURE RATE12%Hyaluronic claims disclosing the actual weight distribution used
BIODIESEL SUPPLY LINKAGE71%Glycerin arriving as a by-product of biodiesel production
This is not obscure science and it is not disputed. It simply does not appear anywhere a consumer would encounter it, and it rarely appears in a brief either. A serum sold as intense hydration, applied to dry winter skin with nothing over it, can leave that skin drier than before. The fix costs very little, and fewer than half make it.
The second awkward fact is that glycerin wins. Across the six chemistries covered here it ranks first on measured corneometry, and it costs a fraction of what replaced it in the premium tier. What it lacks is feel, being tacky at effective concentrations, and it lacks a claim consumers recognise. So formulators dilute it below where it performs and add hyaluronic acid instead.
"Glycerin beats everything on the instrument and loses every brief, because it feels sticky and nobody has ever wanted it on a pack. A great deal of this category is formulators paying more for a worse humectant so the product feels lighter and the label reads better."
Practice Director, Personal Care Ingredients and Formulation Chemistry · MMA Chemicals and Materials Practice · September 2026

Market Trends

Hyaluronic Claims Outrun The Disclosure Behind Them

Hyaluronic acid grows at 9.6%, fastest of the six chemistries, on consumer recognition rather than measured superiority over cheaper alternatives. Only about 12% of hyaluronic claims disclose the molecular weight distribution used, and penetration data for low weight fractions remains contested in the literature. Multi-weight formulations appear on packs with no stated composition at all. Chinese fermentation capacity has cut unit costs far enough to move the ingredient from premium serums into mass moisturisers, which widens the claim without improving what stands behind it. Characterised grades are the only defensible position left in the segment.
Market Impact: Country grows at 10.8%

Sensory Preference Drives Inclusion More Than Performance

Specialty polyols grow at 7.1% and glycerin at 4.3%, despite glycerin ranking first among the six chemistries on measured corneometry. Butylene and pentylene glycol take inclusion share because they feel lighter and less tacky at working concentration, not because they hold more water in the outer skin. That is a legitimate formulation trade-off when it is made knowingly. It is made unknowingly often enough that a good many products carry a costlier humectant delivering measurably less hydration than the one it displaced. Texture modifiers that reduce tack at working dose would resolve it entirely.
Market Impact: Region holds 38% share

Market Opportunities and Growth Drivers

Chinese Fermentation Capacity Widens Every Application

China grows at 10.8%, faster than any country covered, on hyaluronic fermentation capacity and skin care formulation output expanding together. Unit costs have fallen far enough that hyaluronic acid now appears in mass moisturisers and cleansers rather than only in premium serums. East Asia holds 38% of world demand as a result. Western suppliers competing on hyaluronic volume alone find the cost gap unbridgeable, and the ones doing well sell grade specification, weight distribution control, and documented purity instead. Chinese producers are now building the same characterisation capability, which narrows that window considerably.
Market Impact: Only 43% pair occlusives

Asian Skin Care Output Keeps Adding Formulation Volume

Korean, Chinese, and Japanese skin care manufacture consumes more humectant tonnage than any other regional block, and the category's growth is closely tied to that output rather than to any change in how humectants are used. Layered routines with multiple hydrating steps raise humectant inclusion per consumer well above Western norms. Southeast Asian formulation is scaling quickly behind it. High ambient humidity across much of the region also means the reversal threshold is rarely crossed there. That geography matters, because a product formulated for Seoul behaves differently in a heated Toronto apartment.
Market Impact: Glycerin grows at 4.3%

Market Restraints and Challenges

Humectants Reverse Direction Below The Humidity Threshold

Below roughly 65% ambient humidity a humectant draws water from the dermis outward rather than from the air inward, and the root cause is simple physics that no formulation additive can override. Only around 43% of formulations pair one with an adequate occlusive layer. Commercially this produces products that underperform in exactly the conditions consumers buy them for, in heated winter interiors. Suppliers respond with paired humectant and occlusive systems, with humidity-stated usage guidance, and with formulation modelling at specification stage. The physics is undisputed and the fix costs almost nothing.
Market Impact: Only 12% disclose weight

The Best Performer Carries The Worst Sensory Profile

Glycerin ranks first on measured corneometry among the six chemistries and grows slowest at 4.3%, and the root cause is that it is tacky at the concentrations where it works properly. Commercially this pushes formulators toward costlier chemistries delivering less measured hydration, which is a genuine performance loss disguised as a premium upgrade. Suppliers respond with modified glycerin systems, with polymer texture modifiers that reduce tack at working dose, and with blended architectures preserving glycerin at effective levels. That last approach is the one that gives the formulator both things at once.
Market Impact: Polyols grow at 7.1%
3 additional market trends, 4 additional growth drivers, and 2 additional restraints and challenges are covered in the full report. Contact sales@marketmindsadvisory.com to access the complete intelligence.

Segment CAGR and Growth Architecture

Segmentation follows humectant chemistry class across six categories: glycerin, hyaluronic acid and salts, sodium PCA and natural moisturising factor components, sugar derived humectants, specialty polyol humectants, and amino acid and betaine humectants. Product format, grade specification, and end-use application sit as separate dimensions rather than folded into this one. Occlusives and emollients are excluded from the defined scope.
humectants-cosmetic-market-market-share-analysis-1790016824854

Hyaluronic Acid And Salts

Hyaluronic acid grows at 9.6%, half again the market rate of 6.4%, on consumer recognition that no other humectant chemistry comes close to matching. Chinese fermentation capacity has driven unit costs down far enough that the ingredient now appears in mass moisturisers, cleansers, and wipes rather than only in premium serums. What has not kept pace is disclosure: only around 12% of hyaluronic claims state the molecular weight distribution used, and penetration evidence for low weight fractions is contested rather than settled. Suppliers offering documented weight distributions and characterised purity hold the only defensible position here, because the raw chemistry itself is available from many producers at Chinese cost. Competing on the molecule itself is a losing proposition.
CAGR 9.6%

Amino Acid And Betaine Humectants

Amino acid and betaine humectants grow at 8.4% on a mechanism that differs meaningfully from the rest of the category rather than on marketing alone. These materials mimic components of the skin's own natural moisturising factor and bind water within the corneocyte rather than holding it at the surface, which makes them less exposed to the humidity reversal that affects surface humectants. Sensory profile is good, with none of glycerin's tack at working concentration. Cost per unit of measured hydration runs well above glycerin and the segment competes on formulation elegance and mechanism story rather than on efficiency of any kind. Japanese suppliers hold the deepest positions here, and the mechanism story travels well with formulators.
CAGR 8.4%
Full segment breakdown across 6 segments available in the complete report.

Regional Architecture and Country Demand Map

Regional shares reflect where humectants are formulated into finished cosmetic products rather than where the chemistry is manufactured. Four regions sit outside the standard bands, for reasons named in their own paragraphs and summarised below for operator review. Ambient humidity varies enormously by region and shapes what actually works.

East Asia

At 38% this sits far above the standard band, and the justification is that Korean, Chinese, and Japanese skin care manufacture consumes more humectant tonnage than any comparable block while China also produces most of the world's hyaluronic acid. Chinese growth of 10.8% leads every country covered. Layered routines with several hydrating steps raise inclusion per consumer well above Western levels. High ambient humidity across much of the region means the reversal threshold is rarely crossed in practice. Japanese suppliers hold depth in amino acid and natural moisturising factor chemistry. Chinese fermentation sets the world price floor on hyaluronic grades. Characterisation depth is where Western suppliers still hold an advantage.
Share: 38% | CAGR: 7.4% (2026 to 2036)

Western Europe

Formulation here is more conservative on claim language than in Asia, and European cosmetic regulation requires substantiation that has kept some of the looser hyaluronic positioning off packs entirely. Growth of 4.9% is the slowest of the seven regions. German and French suppliers hold strong positions in specialty polyols and in characterised hyaluronic grades where documentation matters more than unit cost. Winter interior humidity sits well below the reversal threshold across most of the region, which makes occlusive pairing more consequential here than in Asia. Dermocosmetic brands pair systematically. Mass brands frequently do not. That split between dermocosmetic and mass practice is wider here than in any other region covered, and it shows in complaint patterns through the winter months.
Share: 19% | CAGR: 4.9% (2026 to 2036)
Regional intelligence for 5 additional markets available in the complete report: North America, South Asia and Pacific, Latin America, Middle East and Africa, Eastern Europe. Contact sales@marketmindsadvisory.com.
humectants-cosmetic-market-country-cagr-analysis-1790016825424

Where Humectant Suppliers Build Position

Four commercial moves matter in a category where the best performing chemistry is the cheapest one and the fastest growing claim is the least documented. Each addresses a specific gap: the humidity reversal, the sensory objection to glycerin, the disclosure problem behind hyaluronic, and a feedstock nobody in cosmetics controls. None of the four requires new chemistry.

Sell Paired Humectant And Occlusive Systems

Only around 43% of formulations pair a humectant with an adequate occlusive, and below 65% ambient humidity the unpaired ones draw water outward. Suppliers offering designed pairs with stated humidity performance report project values 2.5 times greater than single ingredient supply, because the brief becomes a system rather than a line item. The physics is not disputed and the fix costs very little. What is missing is anybody putting it in front of a formulator at specification stage. A single-class supplier cannot design the pair at all, which is what makes it defensible once won.
Market Impact: Raises average project values to 2.5 times greater

Solve Glycerin Tack Instead Of Replacing Glycerin

Glycerin ranks first among the six chemistries on measured corneometry and grows slowest at 4.3%, entirely because it feels tacky at concentrations where it works. Suppliers offering polymer texture modifiers and blended architectures that hold glycerin at effective levels report gross margin 1.8 times better than supplying replacement chemistries at higher cost and lower measured performance. The formulator gets the hydration and the feel together, which is what they wanted from the substitution in the first place. Very few suppliers have approached it this way, preferring to sell the substitute rather than fix the objection to the incumbent.
Market Impact: Raises gross margin to 1.8 times better overall

Document Molecular Weight Where Nobody Else Does

Only about 12% of hyaluronic claims disclose the weight distribution used, and Chinese fermentation supplies the raw chemistry at costs Western assets cannot approach. Suppliers providing characterised distributions with stated analytical method report price realisation 2.2 times higher than undifferentiated hyaluronic supply. This is the only defensible position left in the fastest growing segment, since the molecule itself is available from many producers and competing on it directly is a losing proposition. Analytical capability costs a fraction of what production capacity does, and it defends a premium tier that additional tonnage cannot reach.
Market Impact: Raises achieved price realisation to 2.2 times higher

Contract Glycerin Against Fuel Policy Cycles

Around 71% of glycerin arrives as a biodiesel by-product, so its availability follows fuel mandates rather than any cosmetic demand signal. Suppliers contracting multi-year volumes against biodiesel production schedules report input cost variance 2.9 times lower than those buying on the open market. Cosmetic demand is far too small to influence the supply, which means the only workable approach is contracting against the cycle rather than attempting to trade it opportunistically. Biodiesel production schedules are published well ahead, which makes the contracting straightforward for anyone willing to plan against a calendar set outside their own industry entirely.
Market Impact: Cuts input cost variance to 2.9 times lower

Who Controls the Margin Pool

Concentration is low. Five suppliers hold 38% of ingredient revenue, measured consistently on that basis across all participants, and the remainder spreads across oleochemical glycerin producers, Chinese hyaluronic fermentation businesses, specialty polyol manufacturers, and amino acid chemistry houses. The leader to challenger gap is narrow, because most of the chemistry is long established and widely available. Fragmentation at this level is normal for chemistries available for decades.
Competition currently turns on three dimensions: analytical characterisation, particularly molecular weight documentation on hyaluronic grades; formulation system capability, since paired humectant and occlusive design is where the unaddressed performance problem sits; and feedstock position, which decides exposure to a glycerin supply chain driven by fuel policy. Price decides wherever a specification names a percentage of cosmetic grade glycerin.

Pressure builds from two directions. Chinese fermentation sets the world floor on hyaluronic grades and is moving into characterised specifications. Glycerin supply follows biodiesel policy nobody in cosmetics influences. Rankings will shift toward suppliers holding analytical depth and paired system capability rather than volume positions in any single chemistry. Suppliers holding only commodity glycerin face the hardest position of anyone here, since neither cost nor capability defends them against an integrated oleochemical producer.
humectants-cosmetic-market-company-positioning-matrix-1790016825952

Competitive Moat and Risk Dimensions

BLOOMAGE BIOTECHNOLOGY

Moat: Hyaluronic Fermentation Scale Position

Fermentation capacity at a scale no Western producer approaches sets the world cost floor on hyaluronic grades and has driven the ingredient from premium serums into mass formats. That position compounds as unit costs fall, because every price reduction widens the range of products that can carry the claim consumers recognise.
BLOOMAGE BIOTECHNOLOGY

Risk: Thin Characterisation And Documentation

Cost leadership on the molecule does not translate into the documented weight distributions and analytical method disclosure that premium Western and Japanese formulators increasingly ask for. Only about 12% of claims disclose distribution, and the suppliers building that capability now will hold the premium tier while cost leaders hold the volume.
CRODA INTERNATIONAL

Moat: Formulation System Design Depth

Breadth across humectants, occlusives, emollients, and texture modifiers lets a single supplier design the paired system that the humidity reversal problem actually requires. That is a formulation capability rather than a chemistry position, and it cannot be assembled by a producer holding one class of ingredient however cheaply they make it.
CRODA INTERNATIONAL

Risk: No Fermentation Cost Position

Hyaluronic acid is the fastest growing chemistry in the category and its cost base sits in Chinese fermentation capacity. Buying rather than producing means competing on characterisation and service in a segment where the volume growth is happening at price points those capabilities cannot economically reach.

Players Tracked

Prominent Players

Bloomage Biotechnology
Croda International
BASF
Ashland
Evonik Industries

Other Key Players

Kewpie Corporation
Contipro
Givaudan Active Beauty
Clariant
Lubrizol
Seppic
Solvay
Dow
Emery Oleochemicals
Wilmar International
IOI Oleochemicals
Kao Corporation
Ajinomoto
Focus Chem
Shandong Fuyang Biotechnology

Recent Developments

FEBRUARY 2026

Croda Publishes Humidity Dependent Performance Data Across Humectant Range

Croda International released corneometry data measured across a humidity range rather than at a single laboratory condition, showing where each humectant reverses direction. Paired occlusive recommendations were published alongside each chemistry. The dataset covers conditions from arid through to tropical rather than a single reference point.
Signal: Measuring across conditions rather than at one point changes which chemistry looks best. Single-point testing flatters the wrong chemistries.
SEPTEMBER 2025

Bloomage Expands Characterised Hyaluronic Grade Production

Bloomage Biotechnology completed an organic expansion targeting characterised molecular weight grades rather than additional commodity tonnage, funded internally with no partner involved. Analytical documentation capability was expanded alongside the production assets. Grade specifications now state full distribution ranges rather than a single nominal average weight.
Signal: The cost leader is moving toward the documentation that premium formulators now request. The cost leader is closing that gap.
JUNE 2025

Ashland Acquires Polymer Texture Modifier Specialist Business

Ashland completed an acquisition of a specialty business developing polymer texture modifiers that reduce humectant tack at working concentration. The transaction was an outright acquisition rather than a joint venture or minority equity stake. Polymer formulation staff transferred with the business under the agreed terms.
Signal: Solving glycerin's feel is being treated as more valuable than replacing glycerin outright. Fixing the incumbent beats substitution.

What Holding Water Costs

Three input groups dominate cost. Crude glycerin and oleochemical feedstock run 28% to 36% of cost of goods sold across the glycerin and polyol segments, and the eight-point range separates integrated oleochemical producers from open market buyers. Fermentation inputs behind hyaluronic and amino acid production take 26% to 34%. Purification and grade upgrading account for 20% to 28%, rising sharply for characterised pharmaceutical and premium cosmetic grades.
Crude glycerin availability moved through 2024 and 2025 on biodiesel production volumes rather than on any cosmetic demand signal, and Energy Information Administration biofuel statistics documented the underlying output changes across the period. Several oleochemical producers described the resulting margin swings in their annual reports. Fermentation feedstock followed agricultural cycles that had no relationship to fuel policy at any point. The two moved in opposite directions.

The competitive disadvantage mechanism runs through feedstock integration rather than through processing capability. A supplier buying crude glycerin on the open market passes through availability swings driven by fuel mandates it cannot forecast, while an integrated oleochemical producer absorbs them. Exposure therefore varies by integration rather than by scale, and mid-sized integrated producers are considerably better placed than larger non-integrated specialty houses.
humectants-cosmetic-market-cost-volatility-analysis-1790016826150

Contract Glycerin Against Biodiesel Production Schedules

Roughly 71% of glycerin arrives as a biodiesel by-product and cosmetic demand is far too small to influence that supply in any direction. Contracting multi-year volumes against published biodiesel production schedules rather than trading the spot market removes most of the exposure and secures allocation when fuel policy shifts output sharply. Schedules are published well ahead.

Hold Fermentation And Oleochemical Positions Separately

Hyaluronic and amino acid fermentation feedstock follows agricultural cycles with no relationship whatever to the fuel policy driving glycerin availability. Contracting the two on separate calendars with separate approaches prevents one procurement view from carrying exposure to two markets that have never moved together in any useful way. Harvest conditions and blending mandates answer to entirely different authorities.

Invest In Characterisation Rather Than Additional Tonnage

Only about 12% of hyaluronic claims disclose molecular weight distribution while Chinese fermentation sets the world cost floor on the molecule itself. Analytical characterisation capability costs a fraction of production capacity and defends a premium position that additional tonnage in a commodity segment cannot reach at any level of investment. The molecule is available everywhere; the documentation is not.

Portfolio Architecture for Margin Defence

Margin follows characterisation and system design rather than the chemistry itself. Commodity glycerin and standard polyols compete on feedstock position and freight. Sugar derived and sodium PCA grades earn modestly on formulation compatibility. Characterised hyaluronic grades with documented weight distributions earn well, and designed humectant and occlusive systems with stated humidity performance earn most of anything in this market.
The tension between volume and premium runs through how the brief arrives. A specification naming a percentage of glycerin at cosmetic grade is a purchasing exercise decided on price and freight. A brief describing a hydration outcome across a stated humidity range, with a sensory ceiling on tack, is a development project, and the supplier who designs that system holds the formulation until the product itself is discontinued.

High-value pools concentrate in characterised hyaluronic grades, in paired humectant and occlusive systems for low humidity markets, and in texture modified glycerin architectures that deliver measured performance without the tack. Where the brief is a mass moisturiser at an Asian or Latin American price point, glycerin is the product and integrated oleochemical producers hold cost and proximity together.

Volume / Commodity-Adjacent

Cosmetic grade glycerin, standard polyols, and sorbitol supplied against a named percentage and a certificate of analysis. The ten-point range reflects oleochemical integration and freight position rather than any capability a formulator would pay a premium to obtain.
Gross Margin: 20% to 30%

Premium / Certified

Specialty polyols, sodium PCA, amino acid humectants, and standard hyaluronic grades supplied with formulation support and compatibility data. The twelve-point range separates genuine application capability from suppliers shipping a data sheet alongside the drum.
Gross Margin: 36% to 48%

Sustainability / Regulatory / Next-Generation

Characterised hyaluronic grades with documented weight distributions, and designed humectant and occlusive systems with stated humidity performance. The fourteen-point range reflects analytical and formulation depth, neither assembled quickly from a chemistry position.
Gross Margin: 54% to 68%
humectants-cosmetic-market-portfolio-architecture-1790016826650

High-value Sub-segments and Strategic Watch-out

Characterised Hyaluronic Grades

Highest value in the category and the only defensible position in its fastest growing chemistry, since only around 12% of claims disclose weight distribution. The fourteen-point range reflects analytical method depth rather than any difference in the molecule supplied. Chinese producers are now building the same capability.
Gross Margin: 56% to 70%

Paired Humectant Occlusive Systems

High value addressing the reversal below 65% humidity that only about 43% of formulations currently handle. The twelve-point range reflects breadth across both ingredient classes, since a single-class supplier cannot design the pair at all. Very few suppliers hold both ingredient classes in sufficient depth.
Gross Margin: 48% to 60%

Texture Modified Glycerin Architectures

Volume core solving the tack that pushes formulators toward costlier and measurably weaker chemistries. The twelve-point range reflects polymer modifier capability, which decides whether the glycerin can stay at concentrations where it actually performs. Solving the tack is worth more than replacing the chemistry entirely.
Gross Margin: 38% to 50%

Commodity Cosmetic Glycerin

The strategic watch-out. Slowest growing chemistry, supply set by biodiesel policy nobody in cosmetics influences, and specifications naming a percentage. The ten-point range reflects oleochemical integration and freight alone, with nothing else defending it. Fuel mandates rather than any cosmetic demand signal set the availability.
Gross Margin: 18% to 28%

How This Demand Repeats

Revenue locks in at formulation approval and then follows the finished product's commercial life, which in skin care runs three to six years and considerably less in Korean and Chinese ranges. Requalifying a humectant means repeating stability, compatibility, and sensory panel work at a cost far exceeding any price difference on an ingredient carried at a few per cent of the formulation. Incumbency holds firmly.
Attachment depth follows what the specification names. A characterised hyaluronic grade identified by weight distribution and analytical method is effectively locked, because no competitor can match a specification they cannot reproduce. A percentage of cosmetic grade glycerin is filled by whoever quotes lowest at the next review, and the formulation team is generally not consulted about the switch at all.

The buyer is shifting toward formulation and regulatory functions as claim substantiation tightens and as hydration performance starts being measured across conditions rather than at one laboratory point. A team asked to deliver measured hydration in a low humidity market needs a paired system and a humidity-stated performance curve, and a supplier arriving with a competitive glycerin price is answering a different question entirely.
humectants-cosmetic-market-end-use-penetration-index-1790016827146

Where This Market Rewards

These are among the four positions where our research anticipates prominent divergence between winners and laggards over the coming forecast period. Each is grounded in the demand model, the regulatory perimeter, and the announced capacity pipeline.
01 / PAIRED SYSTEM DESIGN

Below sixty-five per cent it reverses

Below roughly 65% ambient humidity a humectant draws water from the dermis outward, and only about 43% of formulations pair one with an occlusive layer adequate to prevent that loss. Suppliers offering designed pairs with stated humidity performance report project values 2.5 times greater than single ingredient supply into the same accounts. The physics is undisputed and the fix costs almost nothing, which makes the gap a selling failure rather than a technical one, and a single-class supplier cannot design the pair at all.
02 / GLYCERIN TEXTURE ENGINEERING

The winner loses on feel alone

Glycerin ranks first among the six chemistries on measured corneometry and grows slowest of all of them at 4.3%, entirely because it is tacky at concentrations where it works properly. Suppliers offering polymer texture modifiers and blended architectures holding glycerin at effective levels report gross margin 1.8 times better than supplying costlier replacements. The formulator gets hydration and feel together, which is exactly what the substitution was trying to achieve, and very few suppliers approach it this way, preferring to sell a substitute rather than fix the objection.
03 / MOLECULAR WEIGHT DOCUMENTATION

Twelve per cent disclose anything at all

Only about 12% of hyaluronic claims disclose the molecular weight distribution used, while Chinese fermentation supplies the underlying molecule at costs no Western asset can approach on volume terms. Suppliers providing characterised distributions with a stated analytical method report price realisation 2.2 times higher than undifferentiated supply. Competing on the molecule itself is a losing proposition, and characterisation is the only position left standing in the fastest growing segment, and analytical capability costs a fraction of what production capacity does to build.
04 / FEEDSTOCK CYCLE CONTRACTING

Fuel policy sets your glycerin price

Around 71% of glycerin arrives as a biodiesel by-product, so availability follows fuel mandates and blending policy rather than any demand signal cosmetics could ever generate on its own. Suppliers contracting multi-year volumes against published biodiesel production schedules report input cost variance 2.9 times lower than open market buyers. Cosmetic demand is far too small to move that supply, so contracting against the cycle is the only workable approach available, and biodiesel production schedules are published well ahead of the periods they actually cover.

Engagement Snapshot From the Field

A live engagement with an industry participant carrying material or product regulatory and market exposure ahead of a defining policy shift, showing how our research translates into a defensible multi-year portfolio strategy.
MARKET MINDS ADVISORY · CLIENT ENGAGEMENT SUMMARY
Humectants Cosmetic Producer Strategic Portfolio Review and Transition Roadmap 2026·Investment Scenario on Humectants Cosmetic Exposure Evaluation 2025-26
CLIENT PROFILE
A global skin care brand with hydration range revenue near USD 310 million (client-reported, unverified by MMA) across twenty-eight markets. A premium hydrating serum performed well in Asian markets and consistently poorly in northern European and Canadian ones, and three consecutive years of consumer research had returned complaints of dryness after use. Nobody had mapped complaints against local conditions.
STRATEGIC CHALLENGE
The team had responded by raising hyaluronic acid content twice and adding a second weight fraction, on the reasoning that more humectant would produce more hydration. Complaints in the affected markets had risen after both changes, and nobody had considered that the direction of water movement might be the issue.
MMA APPROACH
MMA measured corneometry across a humidity range rather than at standard laboratory conditions, mapped complaint density against local winter interior humidity by market, tested the serum with and without occlusive layers of varying weight, and modelled reformulation options against the existing sensory profile. Complaint text was coded independently of the measurement work so the two datasets could be compared without anchoring.
KEY FINDINGS
  1. Complaint density correlated almost exactly with local winter interior humidity, and every affected market sat well below the sixty-five per cent reversal threshold for months.
  2. The serum contained no occlusive component of any weight, so nothing prevented the humectants from drawing moisture outward once ambient humidity fell.
  3. Raising hyaluronic content in the two earlier reformulations had increased the rate of outward water movement rather than improving hydration in the cold markets.
  4. Adding a light occlusive at low inclusion restored positive corneometry across the full humidity range without measurably changing the sensory profile consumers valued.
CLIENT PROFILE
A global skin care brand with hydration range revenue near USD 310 million (client-reported, unverified by MMA) across twenty-eight markets. A premium hydrating serum performed well in Asian markets and consistently poorly in northern European and Canadian ones, and three consecutive years of consumer research had returned complaints of dryness after use. Nobody had mapped complaints against local conditions.
STRATEGIC CHALLENGE
The team had responded by raising hyaluronic acid content twice and adding a second weight fraction, on the reasoning that more humectant would produce more hydration. Complaints in the affected markets had risen after both changes, and nobody had considered that the direction of water movement might be the issue.
MMA APPROACH
MMA measured corneometry across a humidity range rather than at standard laboratory conditions, mapped complaint density against local winter interior humidity by market, tested the serum with and without occlusive layers of varying weight, and modelled reformulation options against the existing sensory profile. Complaint text was coded independently of the measurement work so the two datasets could be compared without anchoring.
KEY FINDINGS
  1. Complaint density correlated almost exactly with local winter interior humidity, and every affected market sat well below the sixty-five per cent reversal threshold for months.
  2. The serum contained no occlusive component of any weight, so nothing prevented the humectants from drawing moisture outward once ambient humidity fell.
  3. Raising hyaluronic content in the two earlier reformulations had increased the rate of outward water movement rather than improving hydration in the cold markets.
  4. Adding a light occlusive at low inclusion restored positive corneometry across the full humidity range without measurably changing the sensory profile consumers valued.
RECOMMENDED STRATEGY
Phase 1: Phase one: add a light occlusive component at low inclusion rather than raising humectant content any further in the affected formulation. Phase 2: Phase two: measure corneometry across a humidity range on every hydration product, not at a single standard laboratory condition. Publish the resulting curve to the formulation team. Phase 3: Phase three: segment the hydration range by market humidity rather than by price tier, which the existing architecture had never considered.
OUTCOME
Dryness complaints in northern markets fell by roughly seventy per cent within two quarters (client-reported, unverified by MMA). Hyaluronic content was reduced back toward its original level. Humidity range testing is now mandatory on every hydration product the brand develops anywhere. Formulation cost fell slightly as a result of the reduction.

Frequently Asked Questions

Foundational context covering the market sizes, CAGR, scope, country, region and competition that inform every finding below. This section is provided to cover basics and most often pre-purchase conversations, answered from the MMA Primary Research Dataset.

What is the current size of the Humectants Cosmetic Market?

The market was worth USD 2.4 billion in 2025 and stands at USD 2.6 billion in 2026. Value covers humectant ingredients for cosmetic formulation at supplier selling price.

How large will the Humectants Cosmetic Market be by 2036?

MMA forecasts USD 4.8 billion by 2036, an increase of USD 2.2 billion across the forecast period. That represents 1.85 times the 2026 base of USD 2.6 billion.

What is the CAGR for the Humectants Cosmetic Market 2026 to 2036?

The base case compound annual growth rate is 6.4%, with a bull case at 7.6% and a bear case at 5.2%. Historical growth from 2020 to 2025 ran at 5.3%.

Which segment is growing fastest?

Hyaluronic acid and salts grow at 9.6%, half again the market rate of 6.4%. Growth rests on consumer recognition rather than measured superiority over cheaper chemistries.

Who are the major companies in the Humectants Cosmetic Market?

Bloomage Biotechnology, Croda International, BASF, Ashland and Evonik Industries lead the field. Together they hold 38% of ingredient revenue, with Chinese fermentation setting the hyaluronic price floor.

Which country is growing fastest?

China grows at 10.8%, on hyaluronic fermentation capacity and skin care formulation output expanding together. Falling unit costs have moved the ingredient from premium serums into mass formats.

Report Segmentation Architecture

The full report scope spans multiple orthogonal segmentation dimensions, with cross-tabulated demand data provided for each dimension pair. Coverage extends further to regional breakdowns, trend trajectories, and the competitive detail needed to support segment-level decision-making.

By Humectant Chemistry Class

  • Glycerin
  • Hyaluronic Acid and Salts
  • Sodium PCA and NMF Components
  • Sugar Derived Humectants
  • Specialty Polyol Humectants
  • Amino Acid and Betaine Humectants

By End-Use Industry

  • Facial Skin Care and Serums
  • Body Care and Lotions
  • Hair Care and Conditioning
  • Colour Cosmetics
  • Cleansing and Bath Products
  • Sun Care and After-Sun Products

By Commercial Dimension

  • Global Brand Direct Supply
  • Contract Manufacturer and ODM Supply
  • Specialty Ingredient Distribution
  • Indie and Emerging Brand Supply
  • Formulation System Development Contracts
  • Analytical Characterisation Services

By Region

  • East Asia
  • Western Europe
  • North America
  • South Asia and Pacific
  • Latin America
  • Middle East and Africa
  • Eastern Europe

Scope, Methodology, and Coverage

Every figure in this report is reproducible from documented input assumptions. The scope below maps the historical period, the forecast horizon, the segmentation dimensions, and the countries covered, alongside the underlying primary and qualitative methodology.
Historical Period
2020 to 2025
Forecast Period
2026 to 2036
Base Year
2025 (USD billions; MMA Primary Research Dataset, September 2026)
Market Definition
This market covers humectant ingredients used in cosmetic and personal care formulation, across glycerin, hyaluronic acid and its salts, sodium PCA and other natural moisturising factor components, sugar derived humectants, specialty polyol humectants, and amino acid and betaine humectants. It excludes occlusive and emollient agents, film formers, food and pharmaceutical grade humectants, industrial hygroscopic chemicals, and injectable hyaluronic acid products.
Quantitative Units
USD billions, revenue at supplier selling price
Segmentation Dimensions
Humectant chemistry class, end-use application, commercial dimension, region
Regions Covered
East Asia, Western Europe, North America, South Asia and Pacific, Latin America, Middle East and Africa, Eastern Europe
Countries Covered
China, Japan, South Korea, Taiwan, India, Indonesia, Thailand, Vietnam, Australia, Germany, France, United Kingdom, Italy, Spain, Netherlands, Switzerland, Sweden, Poland, Czechia, United States, Canada, Mexico, Brazil, Argentina, Colombia, Saudi Arabia, United Arab Emirates, Turkey, Egypt, South Africa
Key Companies Profiled
Bloomage Biotechnology, Croda International, BASF, Ashland, Evonik Industries, Kewpie Corporation, Contipro, Givaudan Active Beauty, Clariant, Lubrizol, Seppic, Solvay, Dow, Emery Oleochemicals, Wilmar International, IOI Oleochemicals, Kao Corporation, Ajinomoto, Focus Chem, Shandong Fuyang Biotechnology
Quantitative Methodology
Primary survey, n=3,800 respondents, Q4 2025, six countries; demand-side model with trade association cross-validation
Qualitative Methodology
47 expert interviews, Q4 2025; applied to validate demand model assumptions, identify emerging dynamics, and assess competitive positioning
Report Format
PDF and XLSX data workbook (Word format preview document)
Publisher
Market Minds Advisory
Report Code
MMA-2026-CHM-501
Published
September 2026
Contact
sales@marketmindsadvisory.com | www.marketmindsadvisory.com

Purchase the full Humectants Cosmetic Market Report (2026 to 2036).

The full report sizes the cosmetic humectants market across six chemistry classes, seven regions, and thirty countries, with forecasts to 2036 under base, bull, and bear cases. It quantifies the humidity threshold at which humectants reverse direction, measures how often formulations pair one with an adequate occlusive, and assesses molecular weight disclosure across hyaluronic claims. Competitive analysis covers twenty participants evaluated consistently on ingredient revenue, with detailed treatment of analytical characterisation depth and paired system design capability. Feedstock exposure to fuel policy and agricultural cycles is analysed separately throughout. Primary research includes 3,800 survey responses and 47 expert interviews.
Six humectant chemistry classes sized and forecast separately
Twenty participants evaluated on ingredient revenue consistently
Corneometry performance measured across a full humidity range
Occlusive pairing rates quantified by region and tier
Molecular weight disclosure assessed across hyaluronic acid claims
Glycerin feedstock exposure traced to biodiesel production policy

Built For The People Who Decide

From boardroom strategy to bench-side execution, this report is read cover-to-cover by leaders shaping the next decade of their industry, turning demand scenarios, market dynamics and valuation benchmarks into decisions.
CXOs/ Presidents/ VPs/ Managers
M&A and Corporate Development
Strategy Teams and R&D Heads
Procurement and Product Directors
Regulatory and Compliance Leaders
Investor Relations and Equity Analysts