Market Minds Advisory
Household Kitchen Appliances Market

Household Kitchen Appliances Market: Household Kitchen Appliances Market: Shrinking Service Life, Connectivity Nobody Activates and Countertop Dormancy, 2026 to 2036

A control board costs more than half a new machine and stops being stocked after seven years, which is how a fifteen-year appliance quietly became a nine-year one instead of it.

Lead Analyst

Published

September 2026

Make Smarter Decisions with Customized Research Insights

Request a free sample report and evaluate market opportunities, growth trends, and competitive dynamics relevant to your business needs.

2025 MARKET VALUE$242.0BMarket Size 2025
2036 FORECAST VALUE$396.8BBase Case , 2026 to 2036
CAGR 2026 TO 20364.6 %Bull 5.8% / Bear 3.4%
INCREMENTAL OPPORTUNITY$143.7BNet 10- year value creation
EXPANSION MULTIPLE1.57x2036 value over 2026 base
Strategic Levers
M&A Pipeline
Regional Outlook
Country Rankings
Competitive Intelligence
Segmental Deep-dive
Call-Us : 91 93563 13602

Executive Snapshot and Market Trajectory.

Major kitchen appliances now last around 9.4 years against the fifteen to twenty that earlier generations managed. About 46% of terminal faults are electronic rather than mechanical, and nobody set out to shorten anything. It happened one sensible cost reduction at a time. The shortening was never anybody's stated intention.
Beverage preparation grows at 6.9%, half again the market rate of 4.6%, on coffee systems that recruit a household into a consumable relationship rather than a single purchase. Food preparation follows at 6.1%. Refrigeration and cooking, which carry most of the value, grow at barely three quarters of the category rate on replacement cycles alone. Ventilation and dishwashing sit between the two. Ventilation and dishwashing sit between them.
Connectivity appears on almost every specification sheet and roughly 23% of connected appliances are ever actually connected by an owner. Manufacturers continue fitting it because it reads well on a comparison table and produces usage data, which are commercial reasons rather than anything the household asked for. Around 58% of countertop appliances stop being used within a year of purchase, which is the same story told about a different part of the kitchen.
Market Definition
This market covers household kitchen appliances sold for domestic use, including refrigeration and food preservation, cooking and heating, dishwashing and cleaning, food preparation and processing, beverage preparation, and ventilation and air management appliances. It excludes commercial and professional catering equipment, laundry appliances, floor care and vacuum products, water heating and treatment systems, and fitted kitchen furniture, worktops and cabinetry.
Base Year Value
$242.0B in 2025 (MMA Primary Research Dataset, September 2026)
Forecast Period
2026 to 2036, eleven discrete annual values
CAGR
4.6% base case. Bull 5.8%. Bear 3.4%.
Fastest Growth Segment
Beverage Preparation: 6.9% CAGR
Fastest Growth Country
India: 9.8% CAGR
Fastest Growth Region
South Asia and Pacific: 6.6% CAGR
Largest Region
East Asia: 39% of 2025 global value
Market Leaders
Haier Smart Home, Midea Group, Whirlpool Corporation, BSH Home Appliances, and Electrolux Group lead the field. Source: MMA Primary Research Dataset, July 2026.
Primary Survey
n=3,800 procurement and R&D decision-makers, Q4 2025, six countries
Methodology
Demand-side build-up, cross-validated against public data, 47 expert interviews

Household Kitchen Appliances Market Forecast Scenarios

household-kitchen-appliances-market-size-forecast-scenario-1790015651551
Between 2020 and 2025 the category grew at 3.6% through a distorted cycle nobody would have designed. Households confined at home bought appliances heavily and then bought nothing for two years, small countertop products boomed and then collapsed, and component shortages disrupted production across the same period. Underneath it, service life continued the decline that began when mechanical controls gave way to electronics.
The base case at 4.6% rests on three mechanisms. Indian and Southeast Asian household penetration rises fastest of any region as incomes support first appliance purchases rather than replacements. Beverage systems keep recruiting households into consumable relationships that generate revenue between equipment purchases. And shortening service life pulls replacement forward, which raises unit volume while doing nothing good for anybody who owns one. None of the three requires household penetration in mature markets to rise.
The bull case at 5.8% depends on repairability regulation forcing longer parts availability, since a properly supported appliance base sustains a service business worth more than the units. The bear case at 3.4% is exactly the same force running the other way: if regulation extends service life materially, replacement volume falls in mature markets faster than emerging penetration replaces it.

How Long These Things Last

Nobody in this industry decided to make appliances last less time. It happened through a long sequence of individually sensible choices: mechanical timers replaced by control boards, boards specified for a design life shorter than the machine, and parts stocking horizons set by accounting rather than by engineering. The result is an average service life around 9.4 years where fifteen to twenty was once ordinary.
TOP FIVE CONCENTRATION39%Share of category revenue held by the leading manufacturers
AVERAGE SERVICE LIFE9.4 yearsWorking life of a major appliance before replacement now
CONTROL BOARD FAILURE SHARE46%Terminal faults traced to electronics rather than mechanical parts
CONNECTED APPLIANCE ACTIVATION23%Networked appliances ever actually connected by their owners
SMALL APPLIANCE DORMANCY58%Countertop appliances unused within a year of purchase
REPAIR VERSUS REPLACE THRESHOLD42%Share of new price above which owners decline any repair
The economics of repair explain the rest. Roughly 46% of terminal faults are electronic, a replacement control board plus labour typically exceeds 42% of a new machine's price, and owners decline repair above that threshold almost universally. A board that is no longer stocked ends the question entirely. The appliance is otherwise sound, and it goes to recycling because one component is unavailable.
Connectivity is the other thing this category does for reasons of its own. Roughly 23% of connected appliances are ever joined to a network, and among those that are, most use amounts to firmware updates the owner did not request. The feature appears on specification sheets where it wins comparisons, and it produces usage data manufacturers value. Neither of those is a benefit a household asked for.
"We replaced a mechanical timer that lasted twenty years with a board that lasts eight and stops being stocked at seven. Every step made sense on its own spreadsheet. Collectively we halved the life of the product and then acted surprised when regulators started writing rules about spare parts."
Practice Director, Domestic Appliances and Household Equipment · MMA Construction and Industrial Equipment Practice · September 2026

Market Trends

Repairability Regulation Confronts A Business Model

Rules requiring spare part availability for defined periods are spreading beyond the markets that introduced them first, and they collide directly with a replacement cycle that shortened to around 9.4 years partly because parts stopped being stocked. Manufacturers face longer obligations on components specified for shorter lives. The honest position is that extended parts support requires designing boards to last as long as the machine, which raises unit cost in a category that competes hard on price. Nobody in the industry will defend the shortening publicly, which is why the regulation exists at all.
Market Impact: Country grows at 9.8%
Beverage Systems Now Recruit Consumable Relationships

Beverage preparation grows at 6.9%, the fastest rate here, because a coffee system sells a machine once and then supplies it continuously for years afterwards. That annuity is worth considerably more than the appliance margin, and it explains why manufacturers accept equipment pricing that would be uneconomic in any other kitchen category. Households understand the arrangement perfectly well and accept it, which is unusual among lock-in models of this kind. Competition in that segment is fought over the consumable rather than the machine, and the machine functions as an entry ticket to a relationship measured in years.
Market Impact: Life fell to 9.4 years

Market Opportunities and Growth Drivers

Indian Household Penetration Rises Fastest Anywhere

Indian growth of 9.8% leads every country covered, driven by first appliance purchases rather than replacements as incomes reach the level where refrigeration and cooking equipment become affordable to considerably more households. That demand behaves differently from mature market replacement: buyers have no installed base, no brand history, and no expectations set by a previous machine. Domestic manufacturers and international brands compete on entirely level terms for it. Electricity supply reliability rather than income is the binding constraint in several of the markets immediately behind India on the same trajectory.
Market Impact: Causes 46% of write-offs

Shortening Service Life Pulls Replacement Forward

Average service life of around 9.4 years against fifteen to twenty a generation ago means the installed base turns over considerably faster, which raises unit volume in every mature market whether or not anybody wanted that outcome. Manufacturers benefit commercially from a trend none of them will defend publicly. The volume it generates is genuine and it is also precisely what repairability regulation is now designed to reverse. Repairability regulation is designed specifically to reverse it, which puts the industry in the position of defending volume it would rather not explain.
Market Impact: Dormancy reaches 58% overall

Market Restraints and Challenges

Electronic Failure Ends Otherwise Sound Machines

Around 46% of terminal appliance faults are electronic, and the root cause is that control boards are specified for a design life shorter than the mechanical parts they govern. Commercially it produces disposal of machines whose motors, compressors, and cabinets remain entirely serviceable. Manufacturers respond with modular board designs, with extended parts commitments, and with diagnostic systems that identify a fault before it becomes terminal for the whole appliance. A machine goes to recycling because one component is no longer stocked anywhere. Motors, compressors, and cabinets remain entirely serviceable throughout.
Market Impact: Service life sits at 9.4 years

Countertop Appliances Stop Being Used Quickly

About 58% of small kitchen appliances are unused within a year of purchase, and the root cause is that most are bought on a specific enthusiasm rather than a recurring need. Commercially it suppresses repeat purchasing and second-machine sales across the whole small appliance segment. Manufacturers respond with multifunction designs replacing several single-purpose devices, and with recipe and content programmes intended to sustain use past the novelty period. A machine replacing a task earns its counter space and one adding a task competes with everything else the household might do instead.
Market Impact: Segment grows at 6.9%
4 additional market trends, 3 additional growth drivers, and 2 additional restraints and challenges are covered in the full report. Contact sales@marketmindsadvisory.com to access the complete intelligence.

Segment CAGR and Growth Architecture

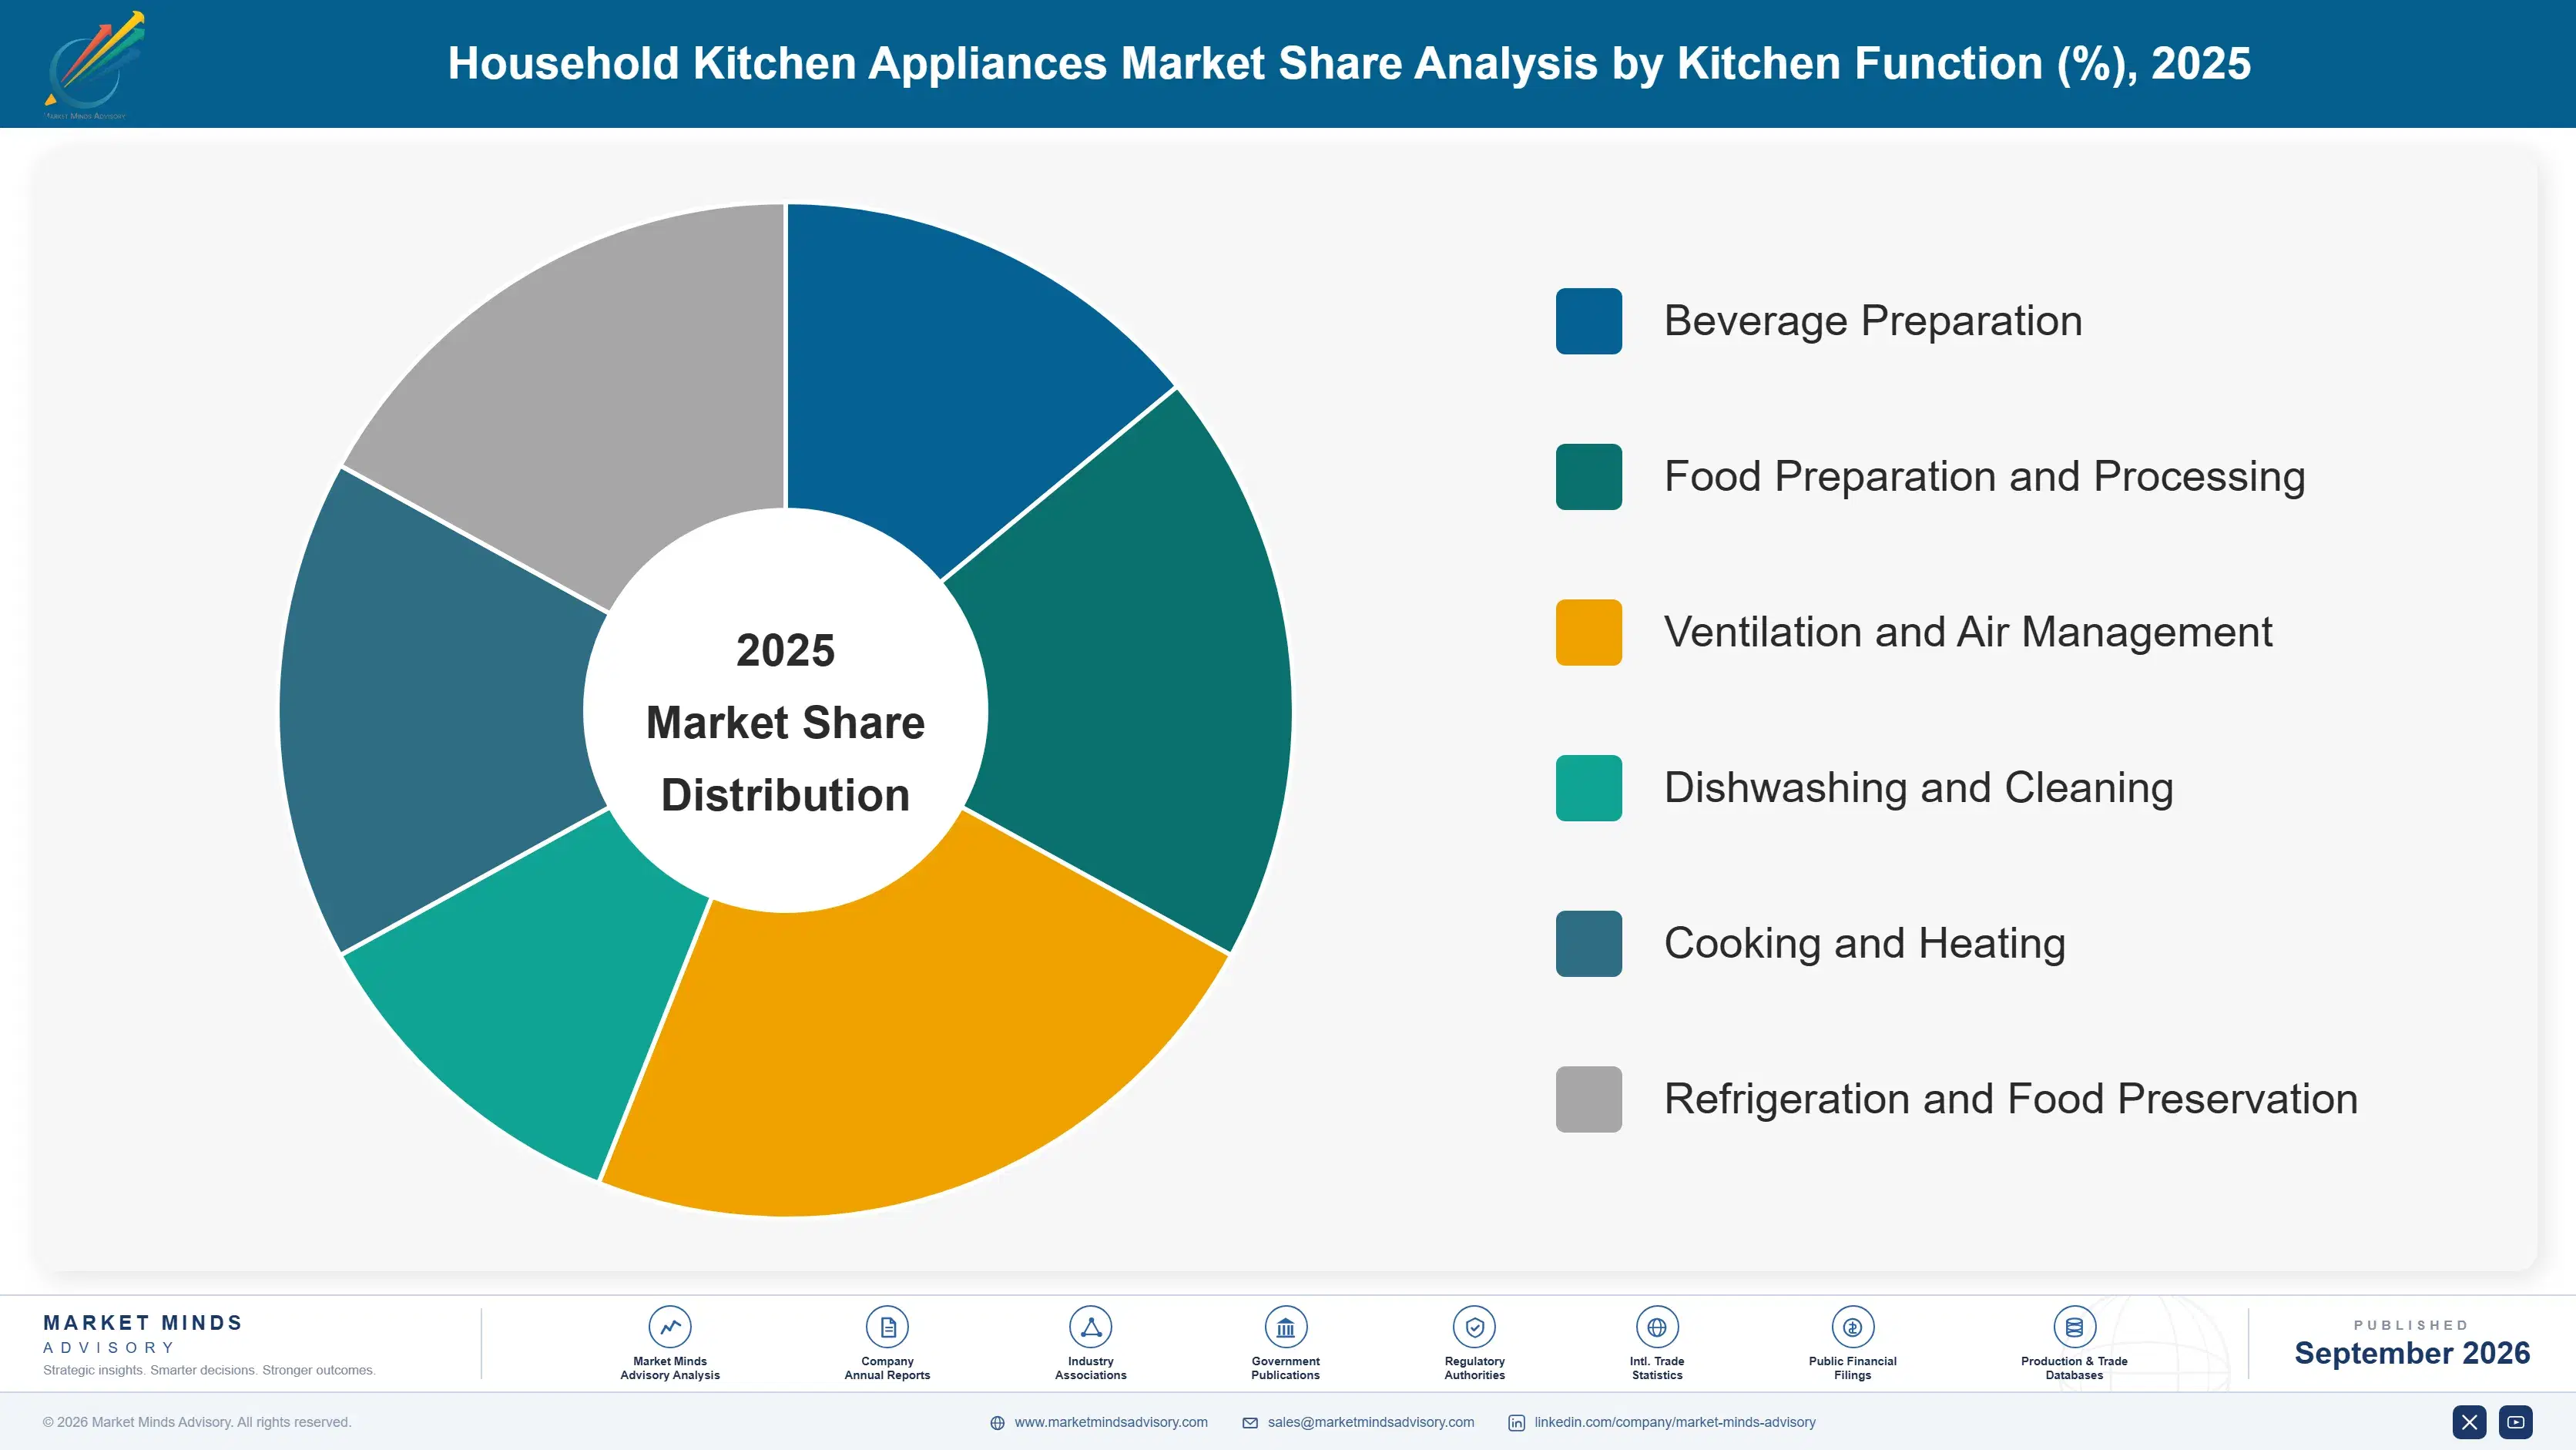
Segmentation follows kitchen function across six categories: beverage preparation, food preparation and processing, ventilation and air management, dishwashing and cleaning, cooking and heating, and refrigeration and food preservation. Appliance size, installation type, and distribution channel are treated as separate dimensions rather than mixed into this hierarchy. Consumables are counted within the appliance function they serve.
household-kitchen-appliances-market-market-share-analysis-1790015652163

Beverage Preparation

Beverage preparation grows at 6.9%, half again the market rate of 4.6%, on an economic structure no other kitchen category matches. A coffee system is sold once and then supplied continuously with capsules, beans, or pods for years afterwards, and that consumable stream is worth considerably more than the equipment margin. Manufacturers price machines accordingly, sometimes below what the hardware alone would justify. Households understand the arrangement and accept it willingly, which distinguishes this from most lock-in models. Competition is fought over the consumable rather than the appliance, and the appliance is simply the entry ticket. Very few other appliance categories can construct anything comparable. Households accept the arrangement willingly, which is unusual.
CAGR 6.9%

Food Preparation And Processing

Food preparation grows at 6.1% on multifunction designs that consolidate several single-purpose devices into one machine, which is a direct response to the dormancy problem that has always limited this segment. Around 58% of countertop appliances stop being used within a year, and a machine covering six functions survives longer in a kitchen than six machines covering one each. Premium multifunction systems have also established genuine repeat purchase through accessory ranges. The segment remains vulnerable to novelty cycles, and the products that endure are those replacing a task rather than adding one. Accessory ranges have established genuine repeat purchasing in premium multifunction systems, which no single-purpose device has managed at any price point.
CAGR 6.1%
Full segment breakdown across 6 segments available in the complete report.

Regional Architecture and Country Demand Map

Regional shares here reflect where household kitchen appliances are actually being purchased rather than where they are manufactured, since Chinese production supplies buyers in every region. Four regions sit outside the standard bands, for reasons named in their own paragraphs and summarised for operator review.

East Asia

At 39% this sits well above the standard band, and the justification runs both ways: China manufactures the majority of world appliance output and is also the largest single market by units sold. Growth of 5.6% exceeds the world rate. Domestic Chinese brands have moved from price competition into genuine technical leadership on induction cooking and integrated ventilation. Japanese and Korean households replace appliances more frequently than any other mature market, which sustains volume despite saturated penetration. Domestic brands have moved from price competition into genuine technical leadership on induction cooking and integrated ventilation over the past decade. Japanese and Korean households replace more frequently than any other mature market, which sustains volume despite entirely saturated penetration.
Share: 39% | CAGR: 5.6% (2026 to 2036)

North America

Kitchen renovation drives more appliance purchasing here than outright failure, which means the replacement decision is aesthetic and dimensional as often as it is functional. Growth of 4.2% tracks close to the world rate. Freestanding formats dominate to a degree seen nowhere else, and appliance suites bought as matched sets are common. Repairability regulation is developing at state level rather than federally, which produces a patchwork manufacturers find hard to plan around. Appliance suites bought as matched sets are common, which raises transaction value considerably and ties replacement decisions together across several categories at once. State-level repairability rules produce a patchwork that manufacturers find harder to plan around than any single national requirement would be.
Share: 21% | CAGR: 4.2% (2026 to 2036)
Regional intelligence for 5 additional markets available in the complete report: Western Europe, South Asia and Pacific, Latin America, Middle East and Africa, Eastern Europe. Contact sales@marketmindsadvisory.com.
household-kitchen-appliances-market-country-cagr-analysis-1790015652697

Where Manufacturers Build Durable Value

Four commercial moves separate manufacturers building durable positions from those defending market share on price against Chinese producers with equivalent technology. Each addresses something this industry knows and avoids discussing: service life, repair economics, connectivity nobody uses, and countertop products that stop being used. Two of the four raise unit cost and lower total cost.

Design Control Boards To Match Machine Life

Around 46% of terminal faults are electronic, on boards specified for a design life shorter than the compressors and motors they govern. Manufacturers matching board life to mechanical life report warranty cost 2.4 times lower and service life extension buyers notice directly. It raises unit cost modestly in a price-competitive category, and it is the only route to meeting spare part obligations without carrying inventory of a component that keeps failing. Regulation is making the obligation unavoidable in any case. Unit cost rises modestly in a category that competes hard on price.
Market Impact: Cuts warranty cost to 2.4 times lower overall

Build The Service Business Quite Deliberately

Repair is declined above roughly 42% of new machine price, which puts most electronic failures beyond the threshold once labour is included. Manufacturers operating their own service networks with modular parts report aftermarket revenue 3.1 times higher than those referring owners to independent technicians. An installed base of appliances lasting longer is worth considerably more as a service annuity than as a shortened replacement cycle. An installed base living longer has to earn something, and repair revenue is the only mechanism that converts longevity into money rather than into lost replacement volume.
Market Impact: Raises aftermarket revenue to 3.1 times higher overall

Justify Connectivity Or Remove The Cost

Roughly 23% of connected appliances are ever joined to a network, and most of that use amounts to firmware updates nobody requested. Manufacturers building genuinely useful connected functions report activation rates of 51% to 64% against the category baseline. The alternative is honest too: removing an unused module lowers cost and shortens the specification sheet, which competes badly and delivers exactly what most buyers actually use. Removing an unused module lowers cost and shortens a specification sheet, which competes badly and delivers what buyers actually use. Most buyers never use it at all.
Market Impact: Raises activation rates to between 51 and 64%

Replace Tasks Rather Than Adding Devices

About 58% of countertop appliances are unused within a year, because most were bought on an enthusiasm rather than a recurring need. Manufacturers building multifunction machines that replace several single-purpose devices report continued use at twelve months 2.7 times higher. A machine that removes a task from a kitchen earns its counter space, and one that adds a task competes with every other thing the household could be doing instead. Six machines covering one function each do not survive a kitchen. Novelty cycles punish everything else in the segment. Counter space is genuinely finite.
Market Impact: Raises continued use to 2.7 times higher overall

Who Controls the Margin Pool

Concentration is moderate. Five manufacturers hold 39% of category revenue, measured consistently on that basis across all participants, and the gap between the Chinese volume leaders and the European premium specialists is wide in scale while considerably narrower in technology than it was a decade ago. Barriers to entry in assembly are low and in electronics integration considerably higher, which is where cost and reliability are both decided.
Competition currently turns on three dimensions: component and electronics integration depth, which decides both cost and reliability; service network reach, which determines whether an installed base generates revenue or resentment; and consumable attachment in beverage and food preparation, where the annuity outweighs the equipment. Repairability compliance has become a fourth dimension, and manufacturers who specified boards properly face a considerably easier transition than those who did not.

Pressure builds from two directions. Chinese manufacturers have closed the technology gap while retaining a cost position nobody matches. Meanwhile repairability regulation raises obligations on everybody. Rankings will shift toward manufacturers who build service businesses, since a longer-lived base has to earn its keep somehow. Parts availability commitments are becoming a purchase argument rather than a compliance footnote.
household-kitchen-appliances-market-company-positioning-matrix-1790015653223

Competitive Moat and Risk Dimensions

HAIER SMART HOME

Moat: Scale And Brand Portfolio Breadth

Manufacturing scale across every kitchen appliance category, combined with a brand portfolio spanning value to premium positions acquired across several regions, lets the business serve each market at its own price expectation. Component volumes at that scale produce cost positions European manufacturers cannot approach on equivalent specification.
HAIER SMART HOME

Risk: Premium Perception Still Building

Kitchen renovation buyers working through designers and specialist retailers still favour European brands on perceived build quality, and that channel carries the highest margins in the category. Acquired premium brands help, though the association takes years to establish with specifiers who recommend from experience. Specifiers recommend from experience rather than specification.
BSH HOME APPLIANCES

Moat: Specification Channel And Reliability

Standing with kitchen designers and specialist retailers built on decades of demonstrable reliability produces specification in exactly the projects carrying the best margins. That reputation also positions the business advantageously as repairability regulation makes service life a stated commitment rather than a claim. Reliability is becoming a stated commitment rather than a reputation.
BSH HOME APPLIANCES

Risk: Cost Position Against Asian Scale

European manufacturing cost cannot match Asian scale on equivalent specification, and the technology gap that once justified the difference has narrowed considerably. Defending premium pricing increasingly depends on reliability and service commitments rather than on any capability a buyer can identify in a showroom. That is a narrower defence than technology once provided.

Players Tracked

Prominent Players

Haier Smart Home
Midea Group
Whirlpool Corporation
BSH Home Appliances
Electrolux Group

Other Key Players

Samsung Electronics
LG Electronics
Panasonic
Arcelik
Gorenje
Miele
SEB Group
De'Longhi
Philips
Hisense
Robam Appliances
Vatti Corporation
Sharp Corporation
Rinnai
Smeg

Recent Developments

FEBRUARY 2026

BSH Publishes Spare Part Availability Commitments Across Full Range

BSH Home Appliances published guaranteed spare part availability periods by component category across its full range, extending commitments beyond regulatory minimums and stating board availability separately from mechanical parts. Commitments exceed regulatory minimums across every category, and board availability is stated separately from mechanical parts for the first time.
Signal: Parts availability becomes a purchase argument rather than a compliance obligation. Competitors must now publish or explain the omission.
SEPTEMBER 2025

Midea Expands Kitchen Appliance Production Capacity

Midea Group completed an organic capacity expansion for kitchen appliance manufacture, funded internally with no partner involved, after domestic demand and export orders together outran available assembly and electronics throughput at existing plants. Electronics assembly rather than mechanical capacity had been the limiting step. Output serves both demand streams.
Signal: Chinese capacity continues expanding while European output stays broadly flat. European output remains broadly flat by comparison.
MAY 2025

SEB Group Acquires Multifunction Cooking Appliance Brand

SEB Group completed an acquisition of a multifunction cooking appliance brand with strong continued-use rates, adding a product architecture that replaces several single-purpose devices rather than adding another one to a kitchen. Continued use at twelve months was the metric that justified the price paid.
Signal: Multifunction design is being bought as an answer to countertop dormancy. Dormancy is finally being treated as a design problem.

What An Appliance Costs

Three input groups dominate cost. Compressors, motors, and electronic control systems run 34% to 42% of cost of goods sold, and the eight-point range separates basic mechanical products from connected appliances carrying multiple boards. Steel, aluminium, glass, and plastics take 32% to 40%. Assembly labour and outbound logistics add 20% to 28%, with bulky refrigeration at the upper end.
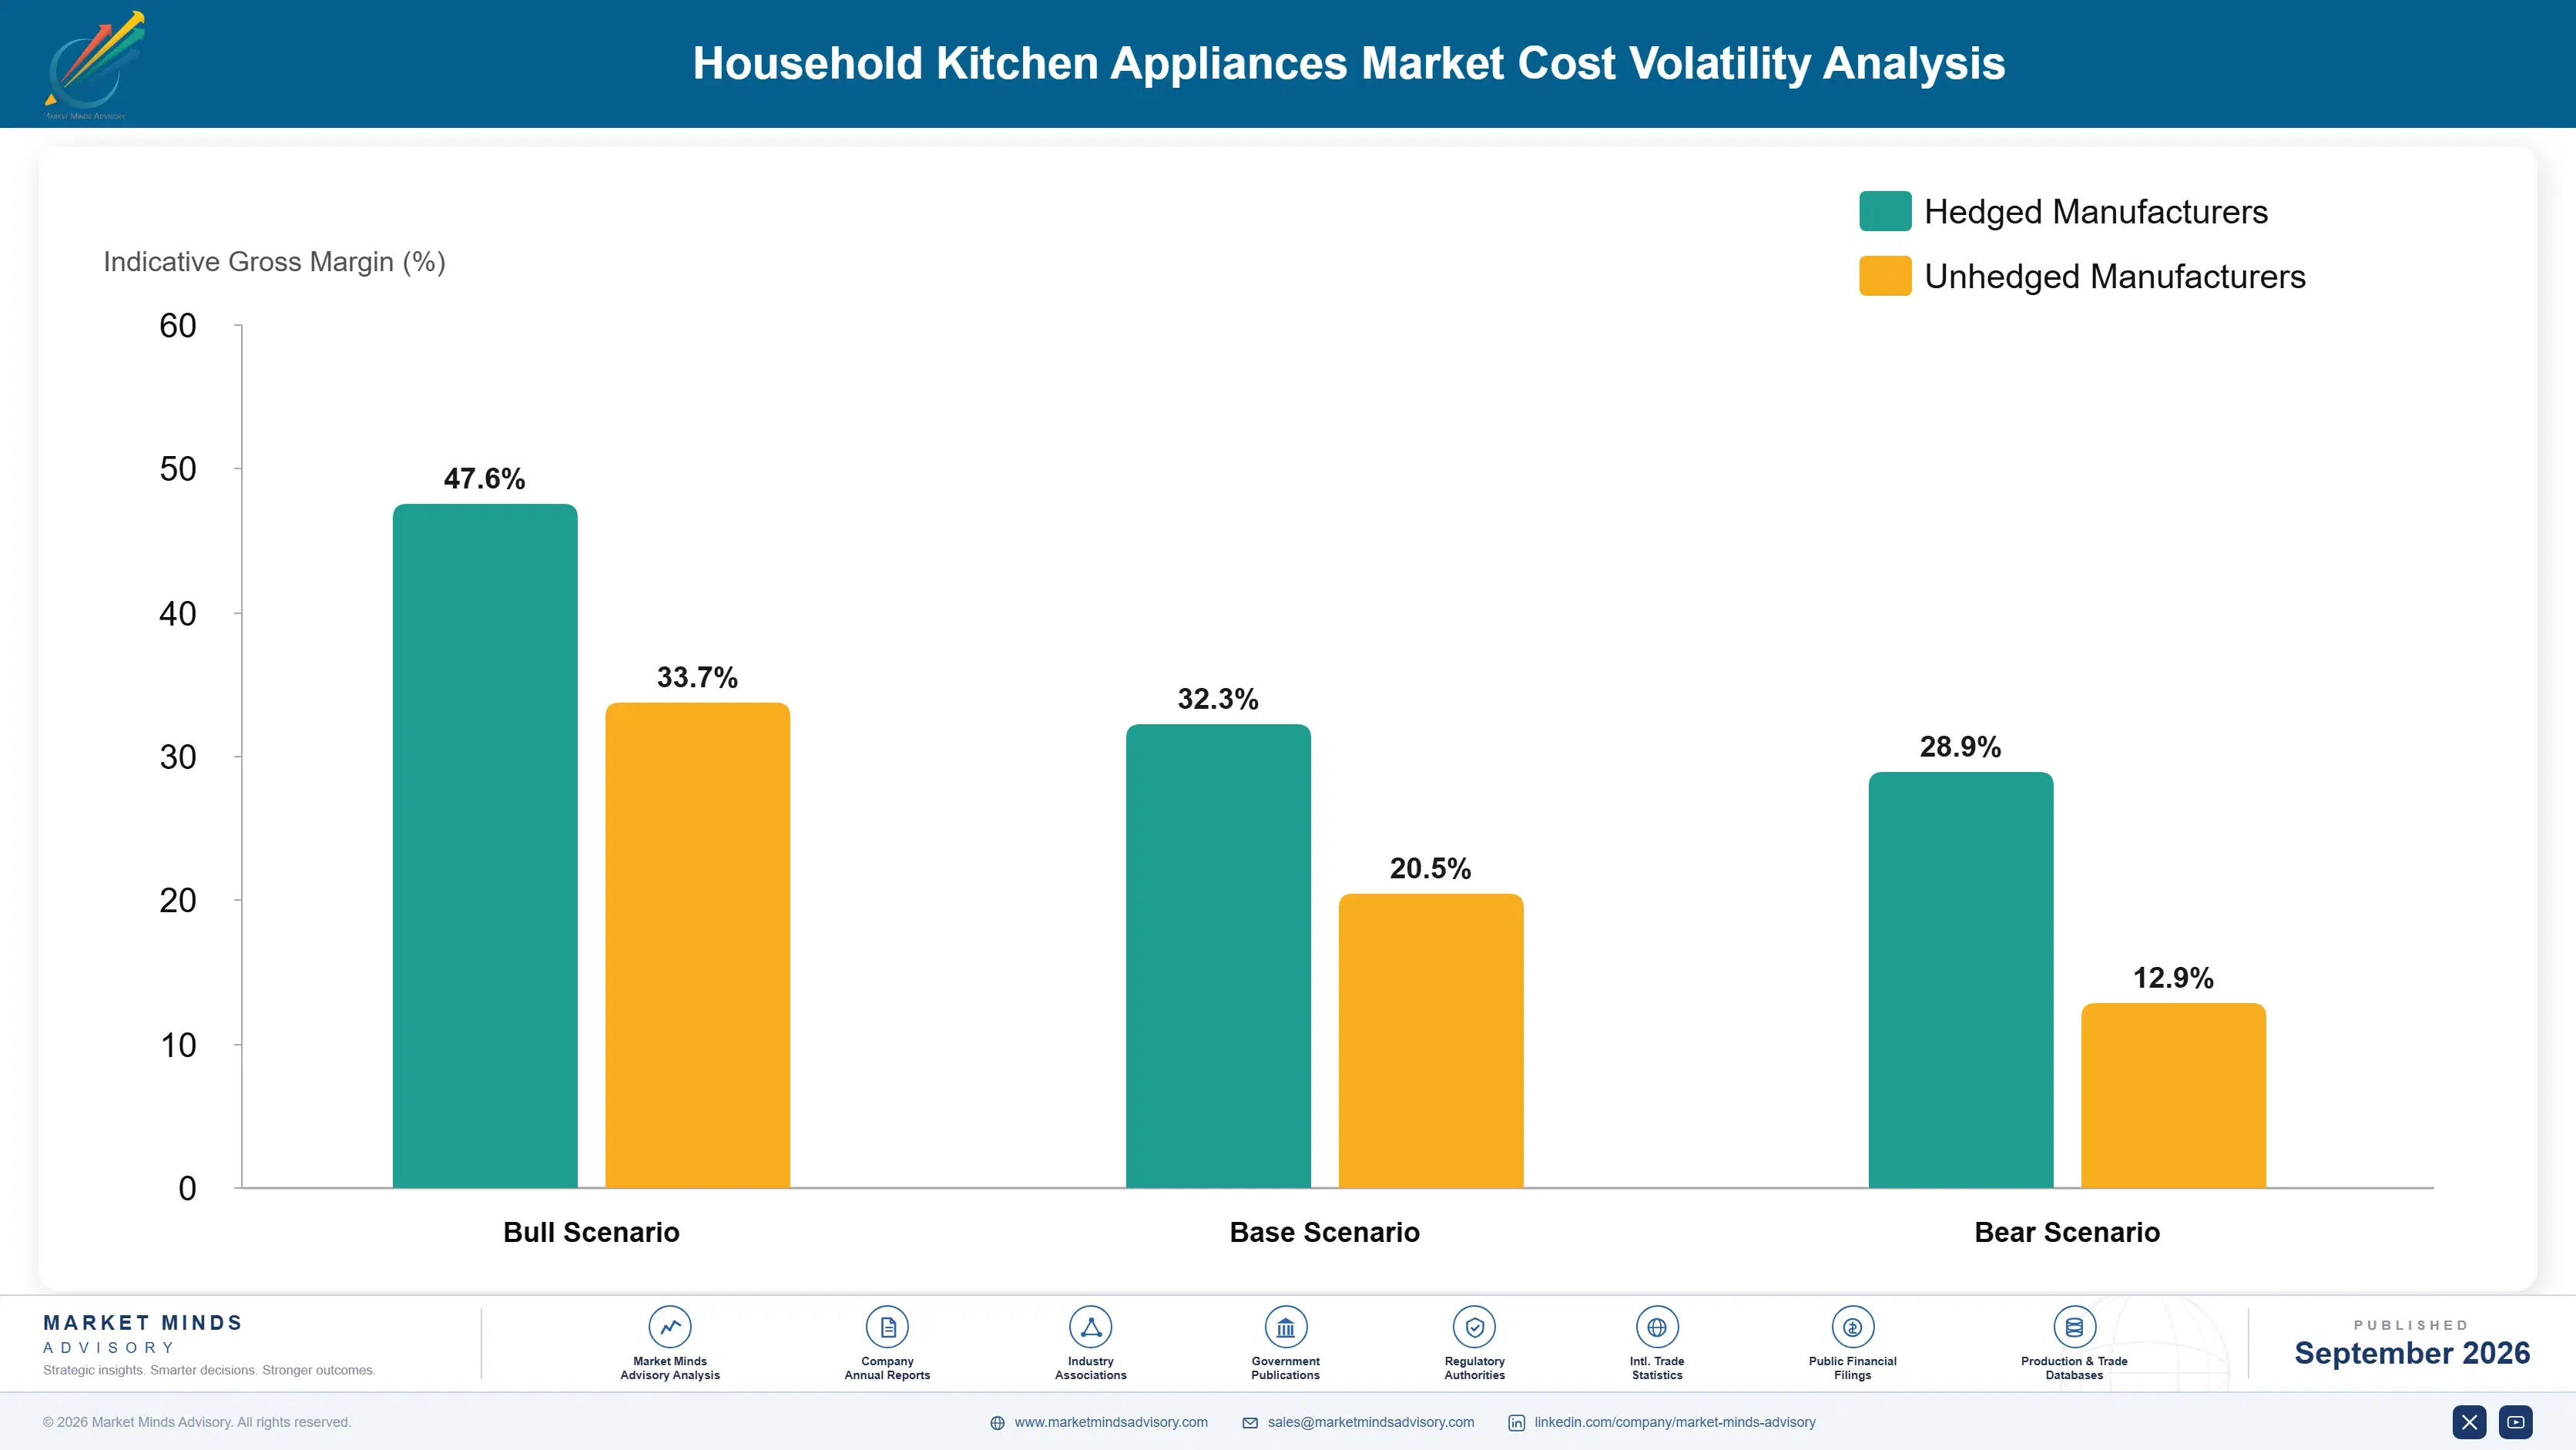
Power semiconductor and control component pricing moved through 2024 and 2025 as automotive and industrial demand competed for the same device families, and SEMI industry statistics documented the underlying capacity movements. Several manufacturers described the resulting margin pressure in their annual reports. Steel pricing followed energy costs and regional trade measures on entirely separate and considerably slower cycles. Neither cycle had anything to do with appliance demand.

The competitive disadvantage mechanism runs through electronics integration rather than through material purchasing. A manufacturer buying complete control modules pays margin to somebody else on the most failure-prone and increasingly regulated component in the machine, while one designing its own can specify board life to match the appliance. Exposure varies by integration depth rather than by scale or purchasing skill.
household-kitchen-appliances-market-cost-volatility-analysis-1790015653420

Specify Board Life Against Mechanical Life

Control boards fail before the compressors and motors they govern, and roughly 46% of terminal faults are electronic as a direct result. Specifying board design life against the mechanical life of the machine costs modestly more per unit and removes both the warranty exposure and the spare part obligation that regulation is now imposing regardless.

Contract Semiconductors Against Automotive Cycles

Power device and controller pricing follows automotive and industrial demand across markets far larger than domestic appliances, and this category exerts no influence over any of it. Contracting against those cycles rather than reacting to them secures allocation when device supply tightens and removes most of the price exposure. Allocation matters more than price when supply tightens.

Design For Modular Rather Than Monolithic Repair

A failure that requires replacing a whole control assembly costs more than most owners will pay, while a modular design replaces the failed section at a fraction of that. Modularity raises design cost once and lowers service cost across the entire installed base for as long as the product remains supported. Most owners will not pay for a whole assembly.

Portfolio Architecture for Margin Defence

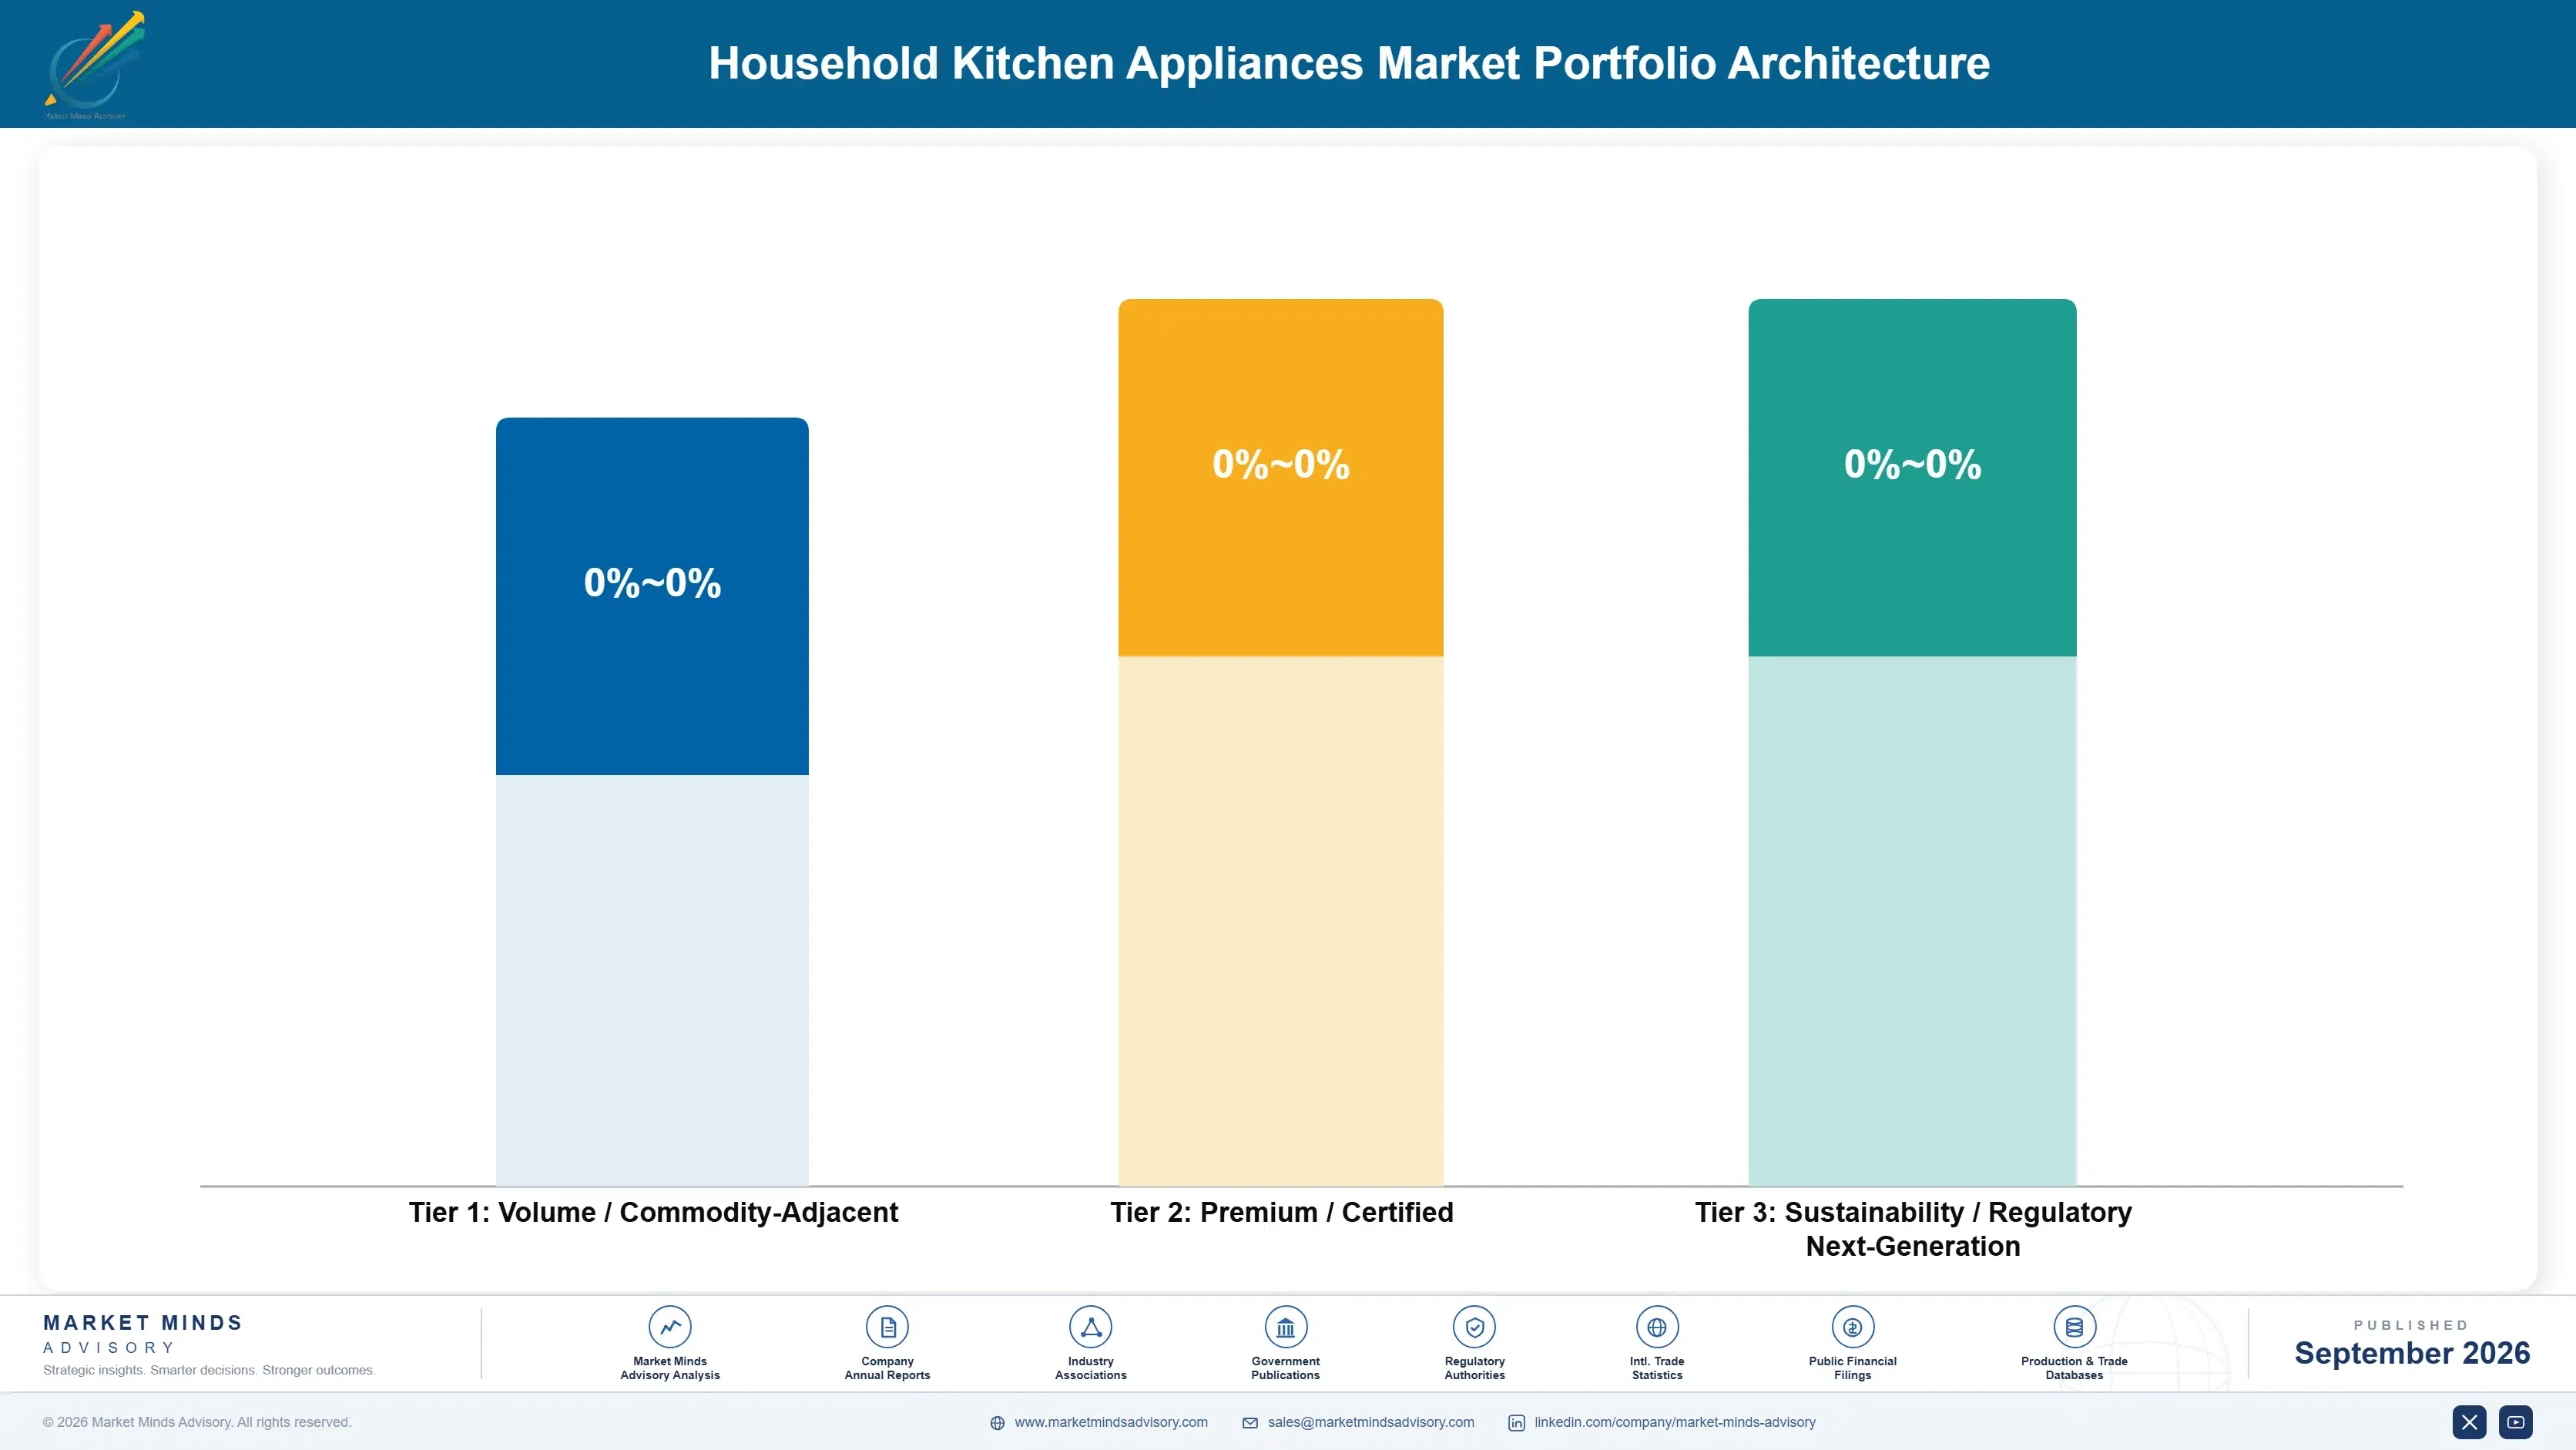
Margin follows annuity and specification channel rather than appliance category. Entry refrigeration and cooking compete close to commodity terms against Chinese production of equivalent specification. Dishwashing and ventilation earn moderately. Premium built-in appliances specified through kitchen design channels earn better, and beverage systems with consumable attachment earn most, because the machine is only the beginning of the relationship. The margin spread across those four groups is wide for a manufactured durable.
The tension between volume and premium runs through the purchase route. An appliance replacing a broken one is chosen on dimensions, availability, and price within days. An appliance specified during a kitchen renovation is selected months ahead alongside cabinetry and worktops, carries several times the value, and involves nobody comparing prices in an aisle.

High-value pools concentrate where the relationship continues after purchase: beverage systems supplying consumables for years, premium built-in ranges backed by manufacturer service networks, and any installed base where parts and repair generate revenue. Where the purchase is an entry refrigerator into rental housing, price decides and nothing else enters the decision at all. That divide follows the relationship rather than the product.

Volume / Commodity-Adjacent

Entry refrigeration, cooking, and countertop appliances sold on price into replacement and rental supply where specification barely differs. The ten-point range reflects manufacturing scale and component purchasing rather than any capability a buyer would identify.
Gross Margin: 16% to 26%

Premium / Certified

Built-in appliances and premium freestanding ranges specified through kitchen design and specialist retail channels. The twelve-point range separates manufacturers with integrated electronics and service networks from those assembling bought-in modules into a cabinet.
Gross Margin: 30% to 42%

Sustainability / Regulatory / Next-Generation

Beverage systems with consumable attachment and appliances carrying extended parts commitments and manufacturer service. The sixteen-point range reflects whether the relationship continues after purchase or ends at the delivery van.
Gross Margin: 44% to 60%
household-kitchen-appliances-market-portfolio-architecture-1790015653924

High-value Sub-segments and Strategic Watch-out

Beverage Systems With Consumables

Highest value in the category, since the machine is sold once and supplied continuously for years afterwards. The sixteen-point range reflects consumable margin and whether the format is proprietary or open to third party competition. Households accept the arrangement willingly. Switching means replacing the machine.
Gross Margin: 46% to 62%

Manufacturer Service And Parts

High value where an installed base generates repair revenue rather than resentment and premature disposal. The fourteen-point range reflects network reach and modular design, since a monolithic assembly cannot be repaired economically. Regulation is extending the obligation regardless. Modularity decides repair economics. Network reach decides the outcome.
Gross Margin: 38% to 52%

Premium Built-In Specification

Volume core reached through kitchen designers months before installation rather than through price comparison in an aisle. The twelve-point range reflects specification channel relationships, which take years to establish and outlast individual products. Nobody compares prices in that channel. Relationships outlast individual products. Designers specify months ahead.
Gross Margin: 32% to 44%

Entry Replacement Appliances

The strategic watch-out. Chinese production matches specification at lower cost, buyers compare on dimensions and price, and nothing about the product resists that comparison. The ten-point range reflects scale and purchasing leverage alone. Availability decides more than brand does. Specification barely differs at all. Price settles it entirely.
Gross Margin: 14% to 24%

How Appliance Demand Recurs

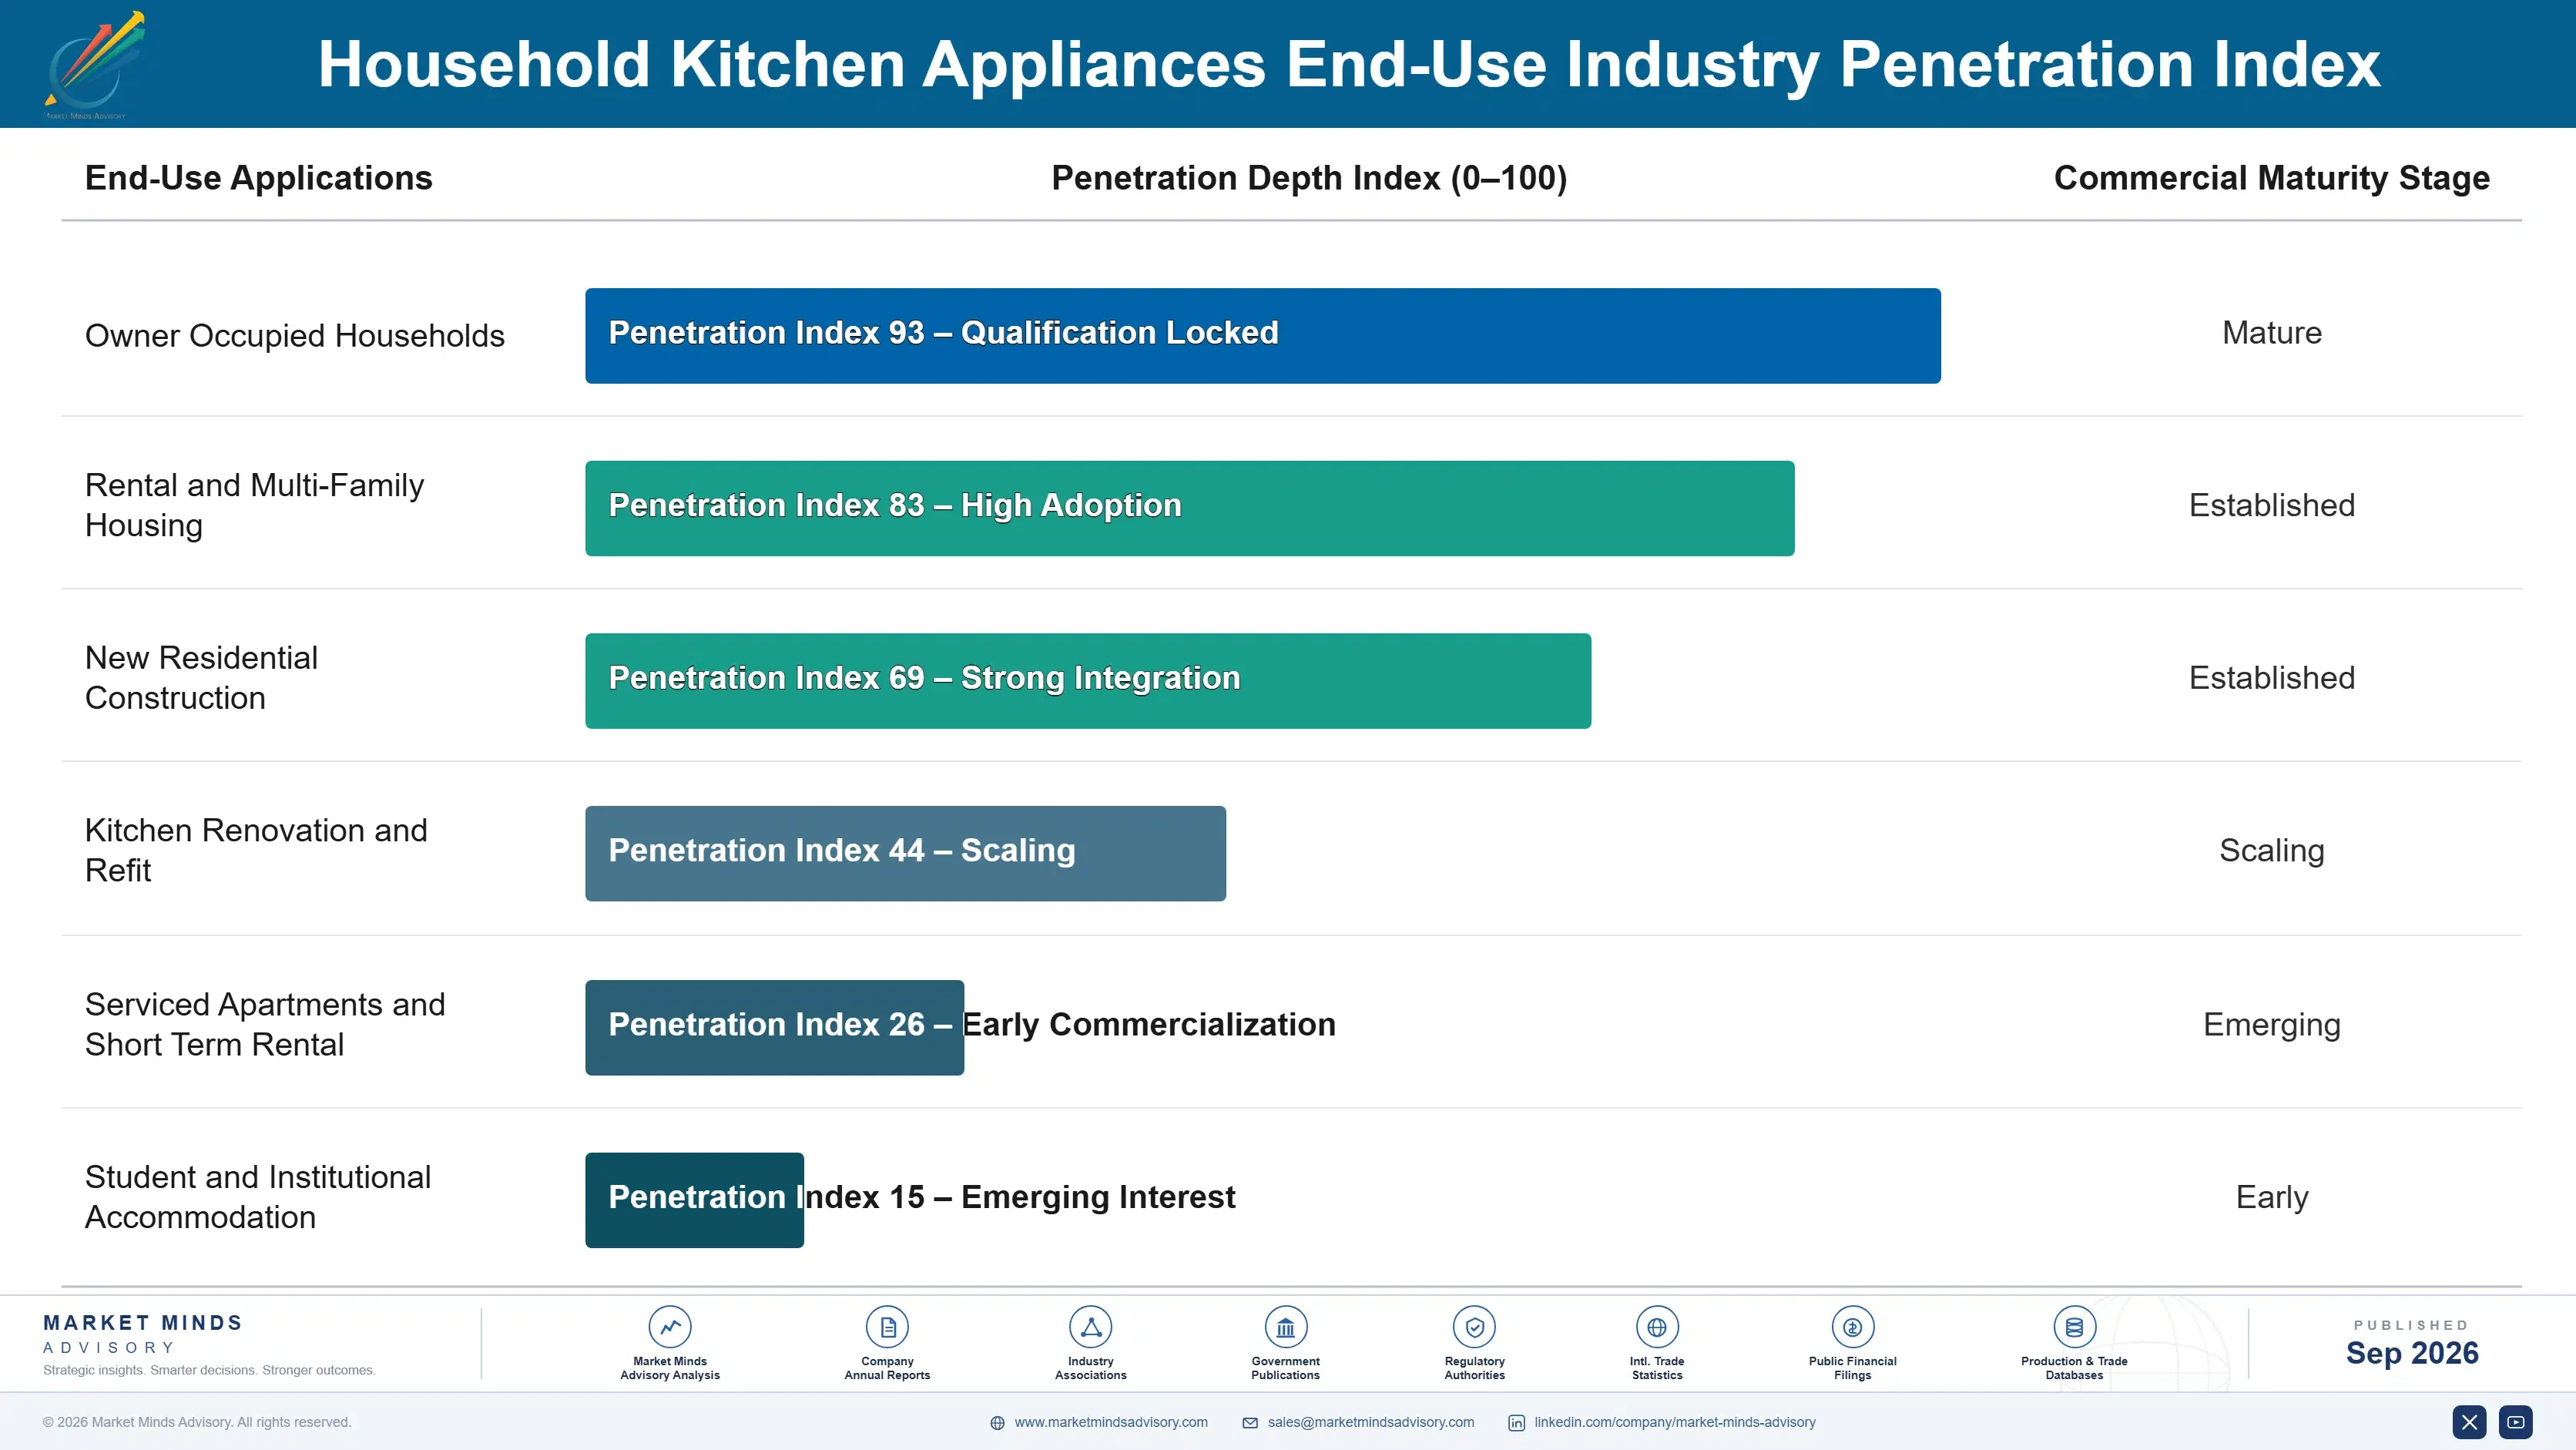
Replacement drives almost all mature market volume and it happens on two very different triggers. A failure produces a purchase within days chosen on dimensions and availability, with brand barely entering the decision. A renovation produces a purchase months ahead chosen alongside cabinetry, carrying several times the value and considerable brand consideration. Service life determines how often the first happens, which is why it matters commercially far more than the industry admits.
Attachment depth follows whether anything continues after delivery. Beverage system owners buy consumables for years and stay with a format because switching means replacing the machine. Owners of a refrigerator have no further contact with the manufacturer unless something breaks, and if it breaks badly they associate the brand with the failure. Service networks are the only mechanism converting an installed base into a relationship.

The buyer profile is shifting toward first purchase in Asia and toward renovation in mature markets, which pulls in opposite directions. One group has no expectations and buys on visible features at accessible prices. The other has owned appliances before, expects them to last, and is increasingly aware that they no longer do. Manufacturers serving both are effectively running two different businesses.
household-kitchen-appliances-market-end-use-penetration-index-1790015654417

Where This Market Rewards

These are among the four positions where our research anticipates prominent divergence between winners and laggards over the coming forecast period. Each is grounded in the demand model, the regulatory perimeter, and the announced capacity pipeline.
01 / BOARD LIFE SPECIFICATION

The electronics fail before the motor

Roughly 46% of terminal appliance faults are electronic, sitting on control boards specified for a design life shorter than the compressors and motors they actually govern. Manufacturers matching board design life to mechanical life report warranty cost 2.4 times lower, alongside a service life extension that buyers notice directly. It is also the only practical route to meeting spare part obligations without stocking a component that keeps failing, and regulation is making that obligation unavoidable across most major markets anyway.
02 / SERVICE NETWORK BUILDING

A longer life must earn something

Repair gets declined above roughly 42% of a new machine's price, which puts most electronic failures beyond that threshold once labour has been included. Manufacturers operating their own service networks with modular parts report aftermarket revenue 3.1 times higher than competitors who refer owners to independent technicians instead. An installed base living longer is worth considerably more as a service annuity than as a shortened replacement cycle, and repair revenue is the only mechanism that converts longevity into money at all.
03 / CONNECTIVITY COST JUSTIFICATION

Fewer than a quarter connect it

About 23% of connected appliances are ever joined to a network by an owner, and most of that use amounts to firmware updates nobody ever requested. Manufacturers building genuinely useful connected functions report activation rates of 51% to 64% measured against that same baseline. The honest alternative is removing an unused module entirely, which lowers cost and delivers precisely what most buyers actually use in practice, which competes badly on a comparison table and rather well in an actual kitchen.
04 / TASK REPLACEMENT DESIGN

Adding a device wins nothing

Around 58% of countertop appliances go unused within a year of purchase, because most were bought on a specific enthusiasm rather than any recurring household need. Manufacturers building multifunction machines that replace several single-purpose devices report continued use at twelve months 2.7 times higher. A machine removing a task earns its counter space, while one adding a task competes with everything else the household might do, and six machines covering one function each do not survive a kitchen for long.

Engagement Snapshot From the Field

A live engagement with an industry participant carrying material or product regulatory and market exposure ahead of a defining policy shift, showing how our research translates into a defensible multi-year portfolio strategy.
MARKET MINDS ADVISORY · CLIENT ENGAGEMENT SUMMARY
Household Kitchen Appliances Producer Strategic Portfolio Review and Transition Roadmap 2026·Investment Scenario on Household Kitchen Appliances Exposure Evaluation 2025-26
CLIENT PROFILE
A European appliance manufacturer with kitchen appliance revenue near EUR 1.8 billion (client-reported, unverified by MMA), selling refrigeration, cooking, and dishwashing across twenty-three markets. Warranty claim costs had risen for four consecutive years while manufacturing quality metrics improved throughout, and the board could not reconcile the two trends. The board wanted the contradiction explained before any policy change was made.
STRATEGIC CHALLENGE
Quality management attributed rising claims to more demanding consumers and had proposed tightening warranty terms. Nobody had analysed which components were failing, or whether the electronics specification had changed as models added connectivity and digital controls over the same period. Consumer expectation and component specification imply entirely different remedies at very different costs.
MMA APPROACH
MMA analysed four years of warranty claims by failed component, compared board design life specifications against mechanical component ratings, reviewed parts stocking horizons against actual failure timing, and modelled outcomes under warranty restriction, board respecification, and service network investment. Board specifications were compared across four model generations, which nobody within the business had previously assembled in one place.
KEY FINDINGS
  1. Around 62% of in-warranty failures were electronic, and the affected boards carried design life ratings materially shorter than the compressors and motors in the same machines.
  2. Board specification had been progressively value-engineered across four model generations while mechanical component ratings remained unchanged throughout the same period. Nobody had connected the two decisions.
  3. Parts stocking horizons ended before the median failure age of several board variants, which converted repairable machines into write-offs the business absorbed under warranty.
  4. Tightening warranty terms would have transferred cost to owners on failures the business had itself specified into the product across successive cost reduction rounds.
CLIENT PROFILE
A European appliance manufacturer with kitchen appliance revenue near EUR 1.8 billion (client-reported, unverified by MMA), selling refrigeration, cooking, and dishwashing across twenty-three markets. Warranty claim costs had risen for four consecutive years while manufacturing quality metrics improved throughout, and the board could not reconcile the two trends. The board wanted the contradiction explained before any policy change was made.
STRATEGIC CHALLENGE
Quality management attributed rising claims to more demanding consumers and had proposed tightening warranty terms. Nobody had analysed which components were failing, or whether the electronics specification had changed as models added connectivity and digital controls over the same period. Consumer expectation and component specification imply entirely different remedies at very different costs.
MMA APPROACH
MMA analysed four years of warranty claims by failed component, compared board design life specifications against mechanical component ratings, reviewed parts stocking horizons against actual failure timing, and modelled outcomes under warranty restriction, board respecification, and service network investment. Board specifications were compared across four model generations, which nobody within the business had previously assembled in one place.
KEY FINDINGS
  1. Around 62% of in-warranty failures were electronic, and the affected boards carried design life ratings materially shorter than the compressors and motors in the same machines.
  2. Board specification had been progressively value-engineered across four model generations while mechanical component ratings remained unchanged throughout the same period. Nobody had connected the two decisions.
  3. Parts stocking horizons ended before the median failure age of several board variants, which converted repairable machines into write-offs the business absorbed under warranty.
  4. Tightening warranty terms would have transferred cost to owners on failures the business had itself specified into the product across successive cost reduction rounds.
RECOMMENDED STRATEGY
Phase 1: Phase one: halt the warranty restriction and respecify control board design life against mechanical component ratings across all new models. Phase 2: Phase two: extend parts stocking horizons past the median failure age of every board variant currently in the installed base. Phase 3: Phase three: build modular board architecture so a failure replaces a section rather than a complete assembly. Assembly replacement exceeds most repair thresholds.
OUTCOME
Warranty claim cost fell 19% within five quarters as respecified boards entered the installed base (client-reported, unverified by MMA). Out-of-warranty repair completion rose sharply once parts remained available. The proposed warranty restriction was abandoned entirely. Board life is now specified against mechanical ratings in every new development brief.

Frequently Asked Questions

Foundational context covering the market sizes, CAGR, scope, country, region and competition that inform every finding below. This section is provided to cover basics and most often pre-purchase conversations, answered from the MMA Primary Research Dataset.

What is the current size of the Household Kitchen Appliances Market?

The market was worth USD 242.0 billion in 2025 and reaches USD 253.1 billion in 2026. Value covers household kitchen appliances across all functional categories.

How large will the Household Kitchen Appliances Market be by 2036?

MMA forecasts USD 396.8 billion by 2036, an increase of USD 143.7 billion across the forecast period. That represents 1.57 times the 2026 base of USD 253.1 billion.

What is the CAGR for the Household Kitchen Appliances Market 2026 to 2036?

The base case compound annual growth rate is 4.6%, with a bull case at 5.8% and a bear case at 3.4%. Historical growth from 2020 to 2025 ran at 3.6%.

Which segment is growing fastest?

Beverage preparation grows at 6.9%, half again the market rate of 4.6%. Coffee systems recruit households into consumable relationships worth more than the equipment margin.

Who are the major companies in the Household Kitchen Appliances Market?

Haier Smart Home, Midea Group, Whirlpool Corporation, BSH Home Appliances, and Electrolux Group lead. Together they hold 39% of revenue, with European specialists holding premium specification channels.

Which country is growing fastest?

India grows at 9.8%, the fastest of any country covered here. First appliance purchases rather than replacements drive it, as incomes reach the level where refrigeration and cooking equipment become affordable.

Report Segmentation Architecture

The full report scope spans multiple orthogonal segmentation dimensions, with cross-tabulated demand data provided for each dimension pair. Coverage extends further to regional breakdowns, trend trajectories, and the competitive detail needed to support segment-level decision-making.

By Kitchen Function

  • Beverage Preparation
  • Food Preparation and Processing
  • Ventilation and Air Management
  • Dishwashing and Cleaning
  • Cooking and Heating
  • Refrigeration and Food Preservation

By End-Use Industry

  • Owner Occupied Households
  • Rental and Multi-Family Housing
  • New Residential Construction
  • Kitchen Renovation and Refit
  • Serviced Apartments and Short Term Rental
  • Student and Institutional Accommodation

By Commercial Dimension

  • Kitchen Design and Specification Channels
  • Appliance Retail Chains
  • Online Retail and Marketplaces
  • Housebuilder and Developer Supply
  • Independent Appliance Dealers
  • Manufacturer Service and Parts

By Region

  • East Asia
  • North America
  • Western Europe
  • South Asia and Pacific
  • Latin America
  • Middle East and Africa
  • Eastern Europe

Scope, Methodology, and Coverage

Every figure in this report is reproducible from documented input assumptions. The scope below maps the historical period, the forecast horizon, the segmentation dimensions, and the countries covered, alongside the underlying primary and qualitative methodology.
Historical Period
2020 to 2025
Forecast Period
2026 to 2036
Base Year
2025 (USD billions; MMA Primary Research Dataset, September 2026)
Market Definition
This market covers household kitchen appliances sold for domestic use, across beverage preparation, food preparation and processing, ventilation and air management, dishwashing and cleaning, cooking and heating, and refrigeration and food preservation appliances. It excludes commercial and professional catering equipment, laundry appliances, floor care and vacuum products, water heating and treatment systems, and fitted kitchen furniture, worktops and cabinetry.
Quantitative Units
USD billions, retail value at manufacturer selling price
Segmentation Dimensions
Kitchen function, household type, commercial dimension, region
Regions Covered
East Asia, North America, Western Europe, South Asia and Pacific, Latin America, Middle East and Africa, Eastern Europe
Countries Covered
China, Japan, South Korea, Taiwan, United States, Canada, Mexico, Germany, Italy, France, United Kingdom, Spain, Netherlands, Sweden, Poland, Czechia, India, Indonesia, Vietnam, Thailand, Australia, Brazil, Colombia, Chile, Argentina, Saudi Arabia, United Arab Emirates, Egypt, Nigeria, South Africa
Key Companies Profiled
Haier Smart Home, Midea Group, Whirlpool Corporation, BSH Home Appliances, Electrolux Group, Samsung Electronics, LG Electronics, Panasonic, Arcelik, Gorenje, Miele, SEB Group, De'Longhi, Philips, Hisense, Robam Appliances, Vatti Corporation, Sharp Corporation, Rinnai, Smeg
Quantitative Methodology
Primary survey, n=3,800 respondents, Q4 2025, six countries; demand-side model with trade association cross-validation
Qualitative Methodology
47 expert interviews, Q4 2025; applied to validate demand model assumptions, identify emerging dynamics, and assess competitive positioning
Report Format
PDF and XLSX data workbook (Word format preview document)
Publisher
Market Minds Advisory
Report Code
MMA-2026-CON-401
Published
September 2026
Contact
sales@marketmindsadvisory.com | www.marketmindsadvisory.com

Purchase the full Household Kitchen Appliances Market Report (2026 to 2036).

The full report sizes the household kitchen appliance market across six functional categories, seven regions, and thirty countries, with forecasts to 2036 under base, bull, and bear cases. It traces how service life fell to around nine years through electronics specification and parts stocking decisions, measures how rarely connected appliances are ever connected, and quantifies countertop dormancy across small appliance categories. Competitive analysis covers twenty participants evaluated consistently on category revenue, with detailed treatment of electronics integration depth. Cost structure, repair economics, and consumable annuity models are analysed throughout. Primary research includes 3,800 survey responses and 47 expert interviews.
Six functional categories sized and forecast separately
Twenty participants evaluated on category revenue consistently
Service life decline traced to component specification decisions
Repair economics modelled against replacement price thresholds
Connected appliance activation measured against fitment rates
Consumable annuity models compared across beverage and food preparation

Built For The People Who Decide

From boardroom strategy to bench-side execution, this report is read cover-to-cover by leaders shaping the next decade of their industry, turning demand scenarios, market dynamics and valuation benchmarks into decisions.
CXOs/ Presidents/ VPs/ Managers
M&A and Corporate Development
Strategy Teams and R&D Heads
Procurement and Product Directors
Regulatory and Compliance Leaders
Investor Relations and Equity Analysts