

Market Minds Advisory
Hospital Capacity Management Solutions Market

Hospital Capacity Management Solutions Market: Virtual Bed Economics, Module Bundling, and Behavioural Implementation

A three hundred bed hospital that lifts throughput by five per cent has created fifteen beds without laying a brick, and construction costs roughly a million dollars a bed, which is the whole argument.

Lead Analyst

Alice Ballenger

Published

September 2026

Make Smarter Decisions with Customized Research Insights

Request a free sample report and evaluate market opportunities, growth trends, and competitive dynamics relevant to your business needs.

2025 MARKET VALUE$3.4BMarket Size 2025
2036 FORECAST VALUE$10.7BBase Case , 2026 to 2036
CAGR 2026 TO 203611.0 %Bull 12.3% / Bear 9.8%
INCREMENTAL OPPORTUNITY$7.0BNet 10- year value creation
EXPANSION MULTIPLE2.84x2036 value over 2026 base
Strategic Levers
M&A Pipeline
Regional Outlook
Country Rankings
Competitive Intelligence
Segmental Deep-dive
Call-Us : 91 93563 13602

Executive Snapshot and Market Trajectory

The product being sold here is beds, not software. A three hundred bed hospital lifting effective throughput by five per cent has created roughly fifteen beds it did not have, against construction costs near a million dollars each. Every deal turns on that comparison. Nothing else compares on paper.
Predictive capacity forecasting compounds at 16.5%, a full 1.50x the market rate, by telling a bed manager which patients will actually leave today rather than describing the ward as it already is. North America holds 38% of value, above the band MMA normally applies, because United States hospital information technology spending per bed exceeds every other health system by a wide margin and the command centre model originated and scaled there.
Concentration is low at 34%, split between electronic record vendors bundling capacity modules and specialists who have to prove they beat something a hospital already owns. Epic Systems and TeleTracking Technologies represent the two ends of that argument precisely. Implementation is where value is most often lost, because the constraint is discharge behaviour rather than information. Roughly 46% of hospitals already use a bundled record module, which is what every specialist is now selling against.
Market Definition
This market covers software and associated services used by hospitals to manage inpatient capacity, patient flow and clinical resource utilisation, spanning bed management and placement systems, patient flow and command centre platforms, operating theatre scheduling and utilisation software, clinical workforce scheduling solutions, real-time location and asset tracking systems, and predictive capacity forecasting analytics. Measurement covers licence, subscription, implementation and support revenue. Electronic health record core platforms, revenue cycle management, clinical decision support, and physical construction or bed hardware are excluded.
Base Year Value
$3.4B in 2025 (MMA Primary Research Dataset, August 2026)
Forecast Period
2026 to 2036, eleven discrete annual values
CAGR
11.0% base case. Bull 12.3%. Bear 9.8%.
Fastest Growth Segment
Predictive Capacity Forecasting and Analytics: 16.5% CAGR
Fastest Growth Country
India: 15.2% CAGR
Fastest Growth Region
South Asia and Pacific: 13.2% CAGR
Largest Region
North America: 38% of 2025 global value
Market Leaders
Epic Systems, Oracle Health, GE HealthCare, TeleTracking Technologies, and Philips. Source: MMA Primary Research Dataset, July 2026.
Primary Survey
n=3,800 procurement and R&D decision-makers, Q4 2025, six countries
Methodology
Demand-side build-up, cross-validated against public data, 47 expert interviews

Hospital Capacity Management Solutions Market Forecast Scenarios

hospital-capacity-management-solutions-market-size-forecast-scenario-1787303491304
Growth ran at roughly 9.7% between 2020 and 2025, and the pandemic supplied both a demonstration and a distortion. Capacity management stopped being an administrative concern and became a public emergency, and hospitals bought command centre platforms and surge planning tools quickly under emergency funding. That spending then paused sharply through 2023 as budgets tightened, before resuming on a different argument built around workforce shortage rather than surge.
Base case growth of 11.0% rests on three mechanisms. Staffing shortage has made throughput improvement the only realistic way to add capacity, since a hospital cannot hire nurses that do not exist. Predictive analytics has moved from describing current state to forecasting discharge, which is what bed managers actually need. And workforce scheduling has become an urgent purchase for chief nursing officers, opening a second buying centre alongside the operational one.
The bull case at 12.3% assumes predictive discharge forecasting demonstrates reproducible length of stay reduction across enough sites to become a standard expectation. The bear case at 9.8% reflects module displacement: if electronic record vendors continue bundling adequate capacity functionality at near-zero incremental cost, specialists lose the ability to price separately regardless of how much better their products perform.

Capacity Software: Virtual Beds and Bundled Competition

The economics of this category are unusually clean. A hospital bed costs roughly a million dollars to build and years to open, while software that raises effective throughput by a few percentage points delivers equivalent capacity within a year. A three hundred bed hospital improving flow by five per cent has created fifteen beds. No other hospital technology purchase compares that favourably on paper, and buyers know it.
TOP FIVE CONCENTRATION34%Record vendors and flow specialists compete from entirely different positions
AVERAGE BED OCCUPANCY87%Inpatient occupancy across tracked acute hospital systems worldwide
DISCHARGE BEFORE NOON21%Discharges completed early enough to free beds for admissions
IMPLEMENTATION CYCLE LENGTH11 monthsTypical duration from contract signature to measured operational benefit
AVERAGE CONTRACT VALUEUSD 340,000Annual subscription value across acute hospital customers of all sizes
RECORD MODULE ATTACH RATE46%Hospitals using capacity functionality bundled within their record platform
Delivery is where the argument gets harder. Discharge before noon still sits near 21% across tracked systems, and that figure has barely moved in a decade of software investment. The reason is that the constraint is behavioural rather than informational: consultants round late, pharmacy dispenses slowly, transport is unavailable and families arrive at five. Software that tells a bed manager about all of this changes nothing on its own.
Competitive structure is defined by bundling. Epic Systems and Oracle Health include capacity functionality within platforms hospitals already own, at little or no incremental cost, and roughly 46% of hospitals now use those modules. Specialists including TeleTracking, LeanTaaS and Qventus must demonstrate measurable outcomes beyond something free. That is a far harder sale than competing against another paid product.
"Every hospital chief operating officer can recite the arithmetic on virtual beds, and most of them have bought the software twice. The reason it did not work the first time is that nobody was willing to make consultants round before ten, and no dashboard has ever solved that."
Director, Health System Operations and Digital Infrastructure Practice · MMA Tec

Market Trends

Predictive discharge forecasting replaces descriptive capacity dashboards

First-generation systems described the hospital as it currently stood, showing which beds were occupied and which were being cleaned. Bed managers already knew that. Predictive platforms forecast which patients will actually be discharged today and which will not, using clinical, operational and historical signals, which is the information that lets placement decisions be made hours earlier. Adoption has accelerated since 2024 as models trained on multi-site data began outperforming ward-level clinical judgement consistently enough for operational teams to trust the output. That is also the one dimension where record platform ownership confers no advantage at all.
Market Impact: Occupancy running near 87%
Workforce scheduling opens a second hospital buying centre

Bed management is bought by chief operating officers and patient flow directors. Clinical workforce scheduling is bought by chief nursing officers, and it became urgent when the staffing crisis made agency spending the largest uncontrolled line in many hospital budgets. That is a different buyer, a different budget and a different evaluation process running in parallel. Vendors spanning both have found the workforce conversation opens doors that operational flow selling had not, because the financial pain is immediate and visible in monthly reporting. A staffed bed and an available bed are ultimately the same constraint.
Market Impact: Breach reporting across 4 hours

Market Opportunities and Growth Drivers

Staffing shortage makes throughput the only route to capacity

A hospital facing sustained nursing and medical vacancies cannot open beds it has no staff to run, so physical expansion stops being an option regardless of capital availability. Improving throughput is what remains. Average occupancy across tracked acute systems sits near 87%, well above the level at which flow deteriorates sharply, and every hour of avoidable length of stay removed adds usable capacity without a single additional appointment. That argument has moved capacity software from an operational nicety into a board-level priority. Physical expansion has stopped being an option regardless of how much capital a board is willing to commit.
Market Impact: Modules now cover 46% of hospitals

Emergency department crowding creates political and regulatory pressure

Corridor care, ambulance handover delays and four-hour breach reporting have become politically visible in the United Kingdom, Australia, Canada and increasingly across Europe, with published performance data that ministers are questioned about directly. Emergency crowding is fundamentally an inpatient flow problem rather than an emergency department one, since patients wait because no ward bed is available. That reframing has directed capital toward flow and discharge tools rather than toward emergency department expansion in several national systems. Patients wait in corridors because no ward bed is available, which makes this an inpatient discharge problem rather than an emergency department one.
Market Impact: Discharge before noon stuck at 21%

Market Restraints and Challenges

Record vendors bundle capacity modules at near-zero incremental cost

Epic Systems and Oracle Health include bed management and flow functionality within platforms hospitals have already bought, and roughly 46% of hospitals now use those modules rather than a specialist product. The root cause is that capacity data lives inside the record system, so the incumbent vendor has both the data and the integration advantage without doing anything additional. Commercial impact falls entirely on specialists, who must prove measurable outcome improvement over something already paid for. Successful ones sell on demonstrated length of stay reduction rather than on functionality comparison.
Market Impact: Frees beds 4 hours earlier

Behavioural constraints defeat software that works perfectly

Discharge before noon sits near 21% and has barely moved across a decade of investment, because the binding constraints are ward round timing, pharmacy turnaround, transport availability and family collection rather than any absence of information. The root cause is that hospitals bought technology to avoid difficult conversations about clinical working patterns. Commercial impact is a long trail of implementations that delivered no measured benefit and poisoned reference selling. Vendors are responding by bundling operational change consulting and by contracting on outcomes rather than on deployment. Outcome-linked contracting is the only credible answer anybody has found.
Market Impact: Agency spend exceeding 15% of payro
3 additional market trends, 4 additional growth drivers, and 2 additional restraints and challenges are covered in the full report. Contact sales@marketmindsadvisory.com to access the complete intelligence.

Segment CAGR and Growth Architecture

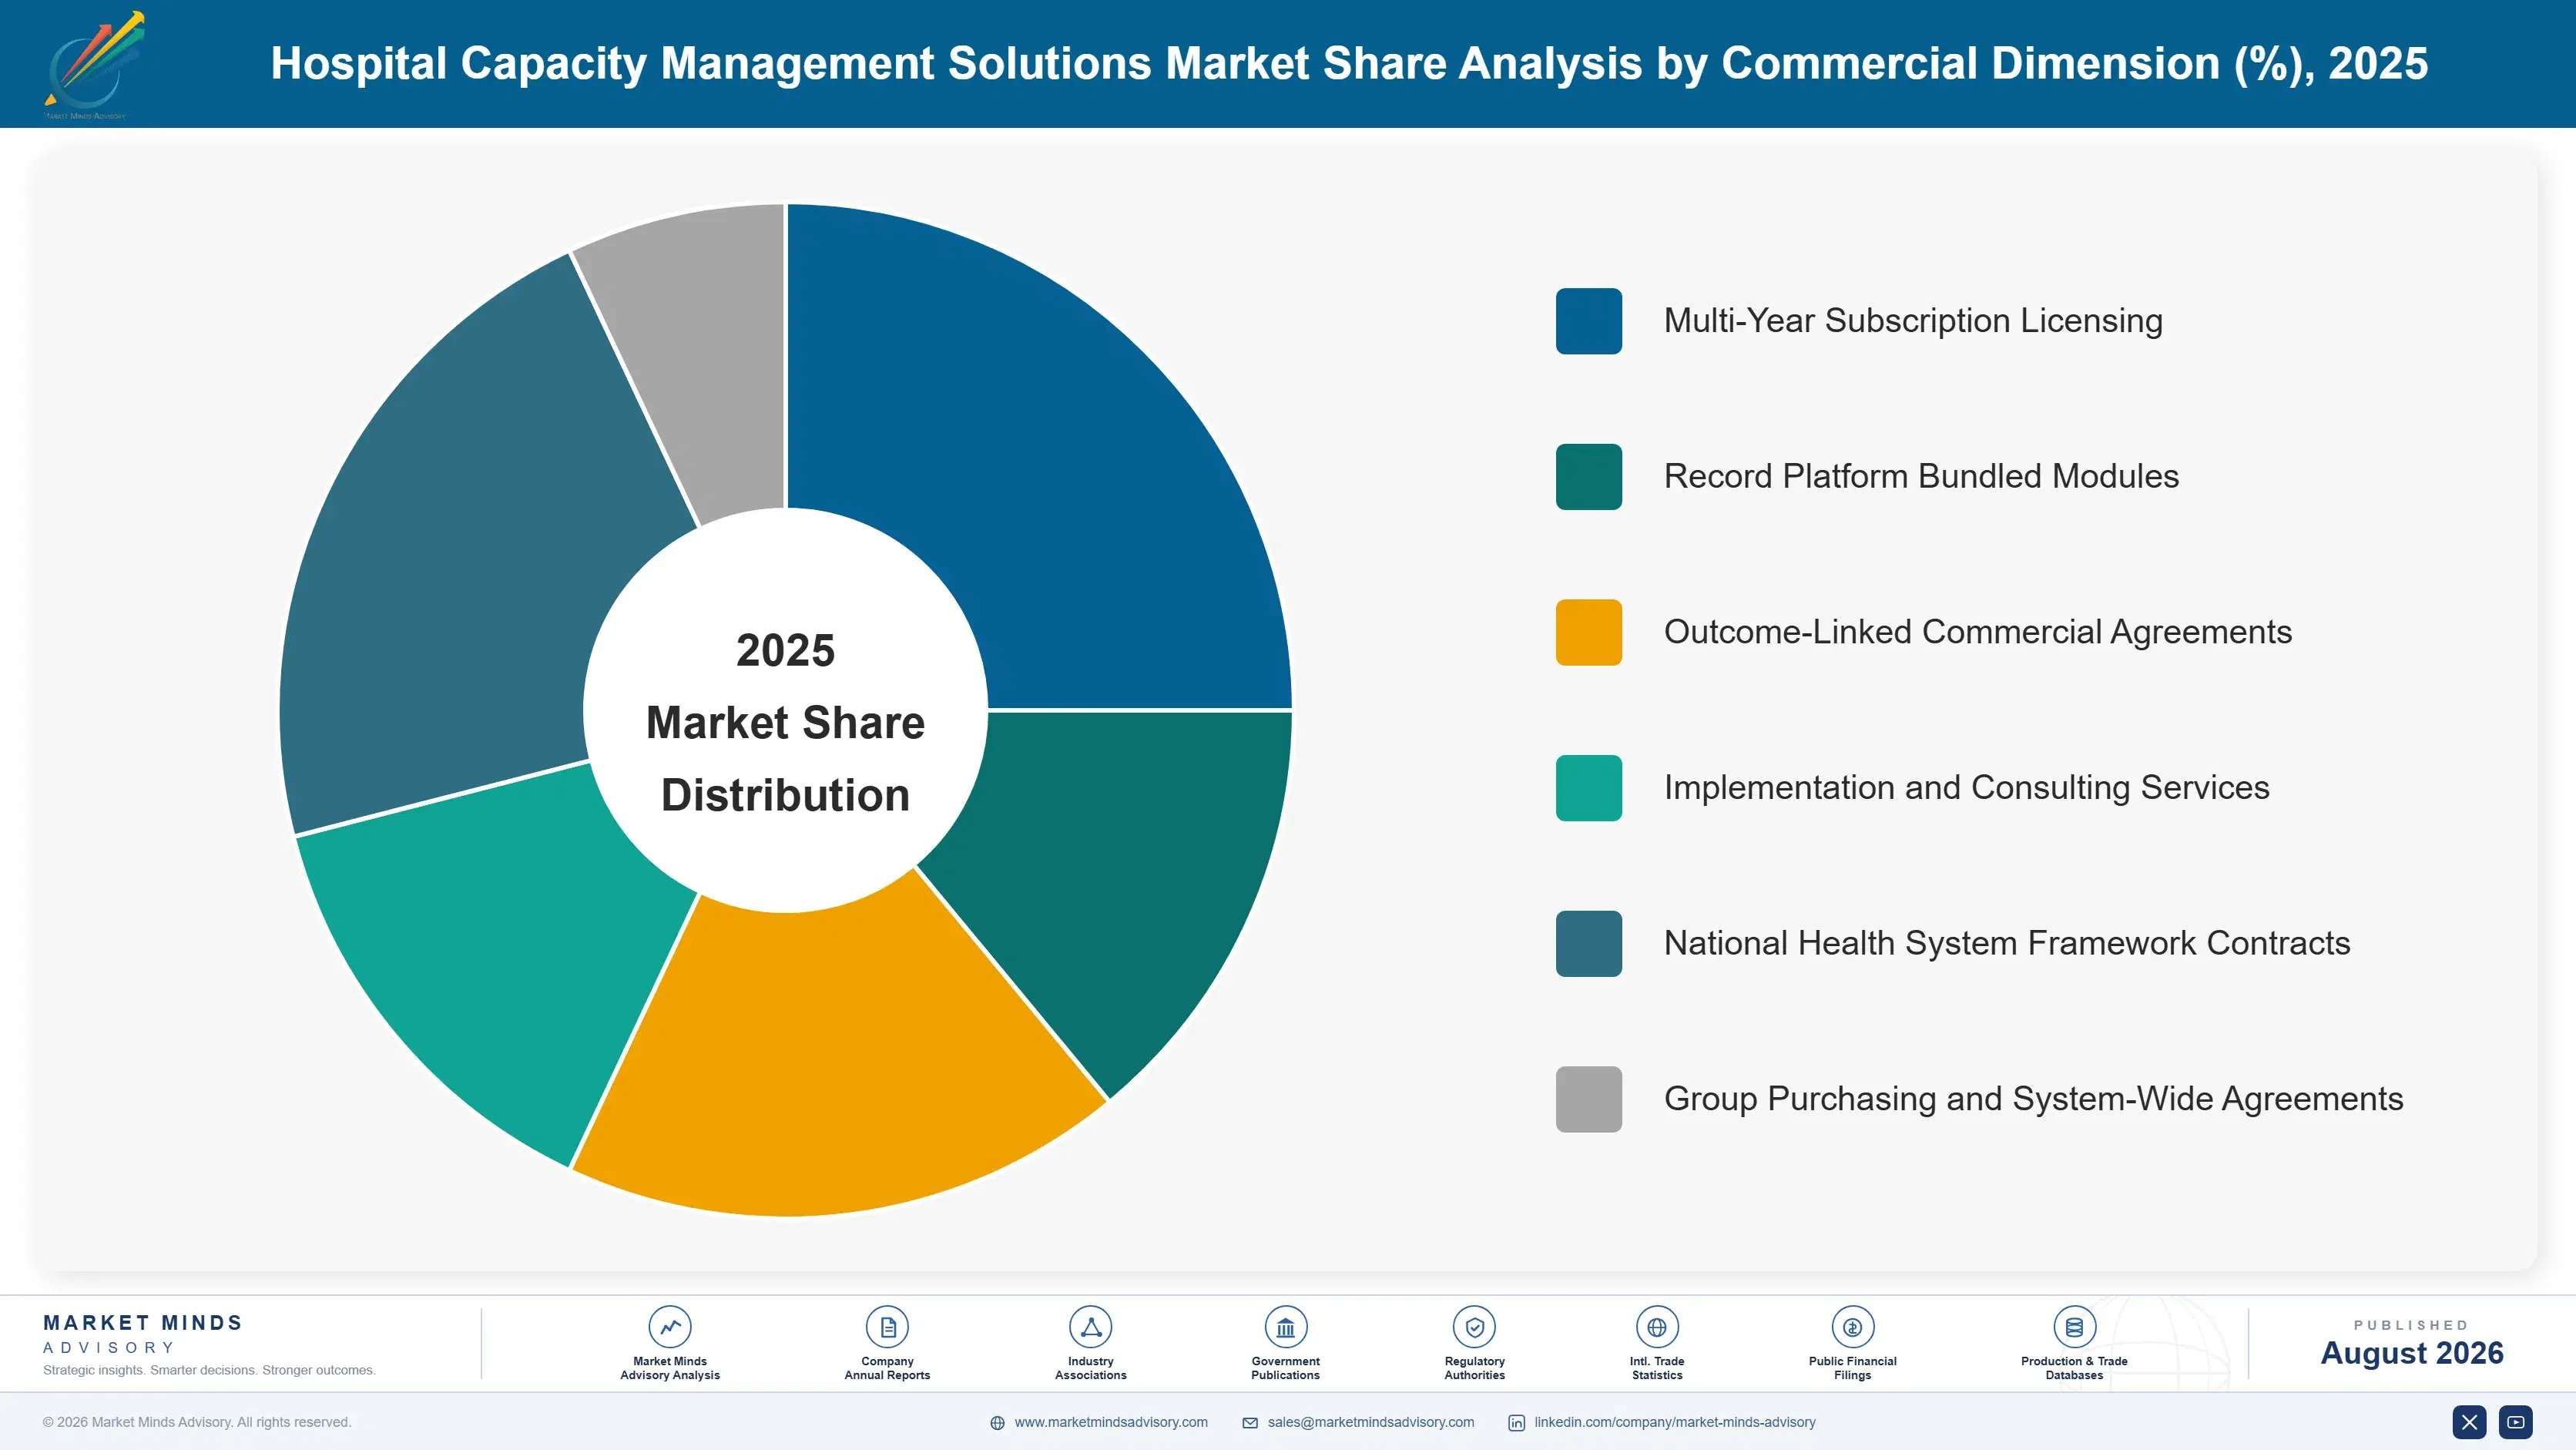
Segmentation follows solution category, because category determines the buying centre inside the hospital, the budget it comes from, the integration required and the outcome against which the purchase is judged. Six categories cover hospital capacity management without overlap. Deployment model, whether cloud, hosted or on-premise, cuts across every category and is treated as a delivery attribute here.
hospital-capacity-management-solutions-market-market-share-analysis-1787303491838

Predictive Capacity Forecasting and Analytics

Growing at 16.5%, a full 1.50x the market rate, predictive platforms forecast which patients will be discharged today rather than describing which beds are currently occupied. That distinction matters commercially because bed managers already know the current state and gain nothing from being shown it again. Models trained across multi-site data now outperform ward-level judgement consistently enough that operational teams act on the output, freeing beds several hours earlier in the day. This is also the segment where record vendors are weakest, because model quality depends on training data breadth rather than on owning the underlying clinical record. Contract language governing de-identified operational data rights therefore decides which vendor accumulates the advantage over time.
CAGR 16.5%

Patient Flow and Command Centre Platforms

Command centre platforms grow at 13.6% by combining real-time flow visibility with physically co-located operational staff, an approach pioneered at large academic centres and since adopted across health systems in several countries. The uncomfortable finding for software vendors is that co-location and staffing produce much of the measured benefit, and the dashboards alone reliably do not. That makes the sale a service and operating model engagement rather than a licence transaction. Deals are larger and slower than any other segment here, and they are considerably harder for a record vendor to bundle away. Hospitals restructure their operations around the arrangement rather than merely installing software, which makes these engagements the stickiest in the market.
CAGR 13.6%
Full segment breakdown across 6 segments available in the complete report.

Regional Architecture and Country Demand Map

Regional value tracks hospital information technology spending per bed rather than bed numbers or clinical need, and those diverge enormously. Health systems with capital-constrained budgets often carry the worst capacity pressure and the least ability to fund software addressing it. Spending follows budget capacity rather than clinical pressure.

North America

North America holds 38% of value, above the band MMA normally applies. Note: this share is stated out of band because United States hospital information technology spending per bed genuinely exceeds every other health system by a wide margin, and the command centre operating model originated and scaled here before being exported. Epic Systems and Oracle Health dominate the underlying record layer, which shapes every capacity purchase made on top of it. Health system consolidation has produced buyers evaluating capacity software across dozens of hospitals at once. Growth at 10.0% is moderate because penetration is already high and module bundling suppresses specialist pricing. Outcome-linked commercial terms have emerged here first for exactly that reason.
Share: 38% | CAGR: 10.0% (2026 to 2036)

Western Europe

Twenty-four per cent of value, growing at 9.6%. Emergency department crowding has become politically visible across the United Kingdom, Ireland and the Nordic countries, with published breach performance that ministers answer for directly, and that has directed national capital toward flow and discharge tools. The National Health Service has funded capacity programmes centrally at times and cut them at others, which makes demand unusually lumpy. German and Dutch hospitals buy through individual institutional budgets with longer evaluation cycles. Record platform penetration is lower and more fragmented than in North America, which leaves considerably more room for specialist vendors. Political visibility of emergency performance is the single strongest demand driver across the region.
Share: 24% | CAGR: 9.6% (2026 to 2036)
Regional intelligence for 5 additional markets available in the complete report: East Asia, South Asia and Pacific, Latin America, Middle East and Africa, Eastern Europe. Contact sales@marketmindsadvisory.com.
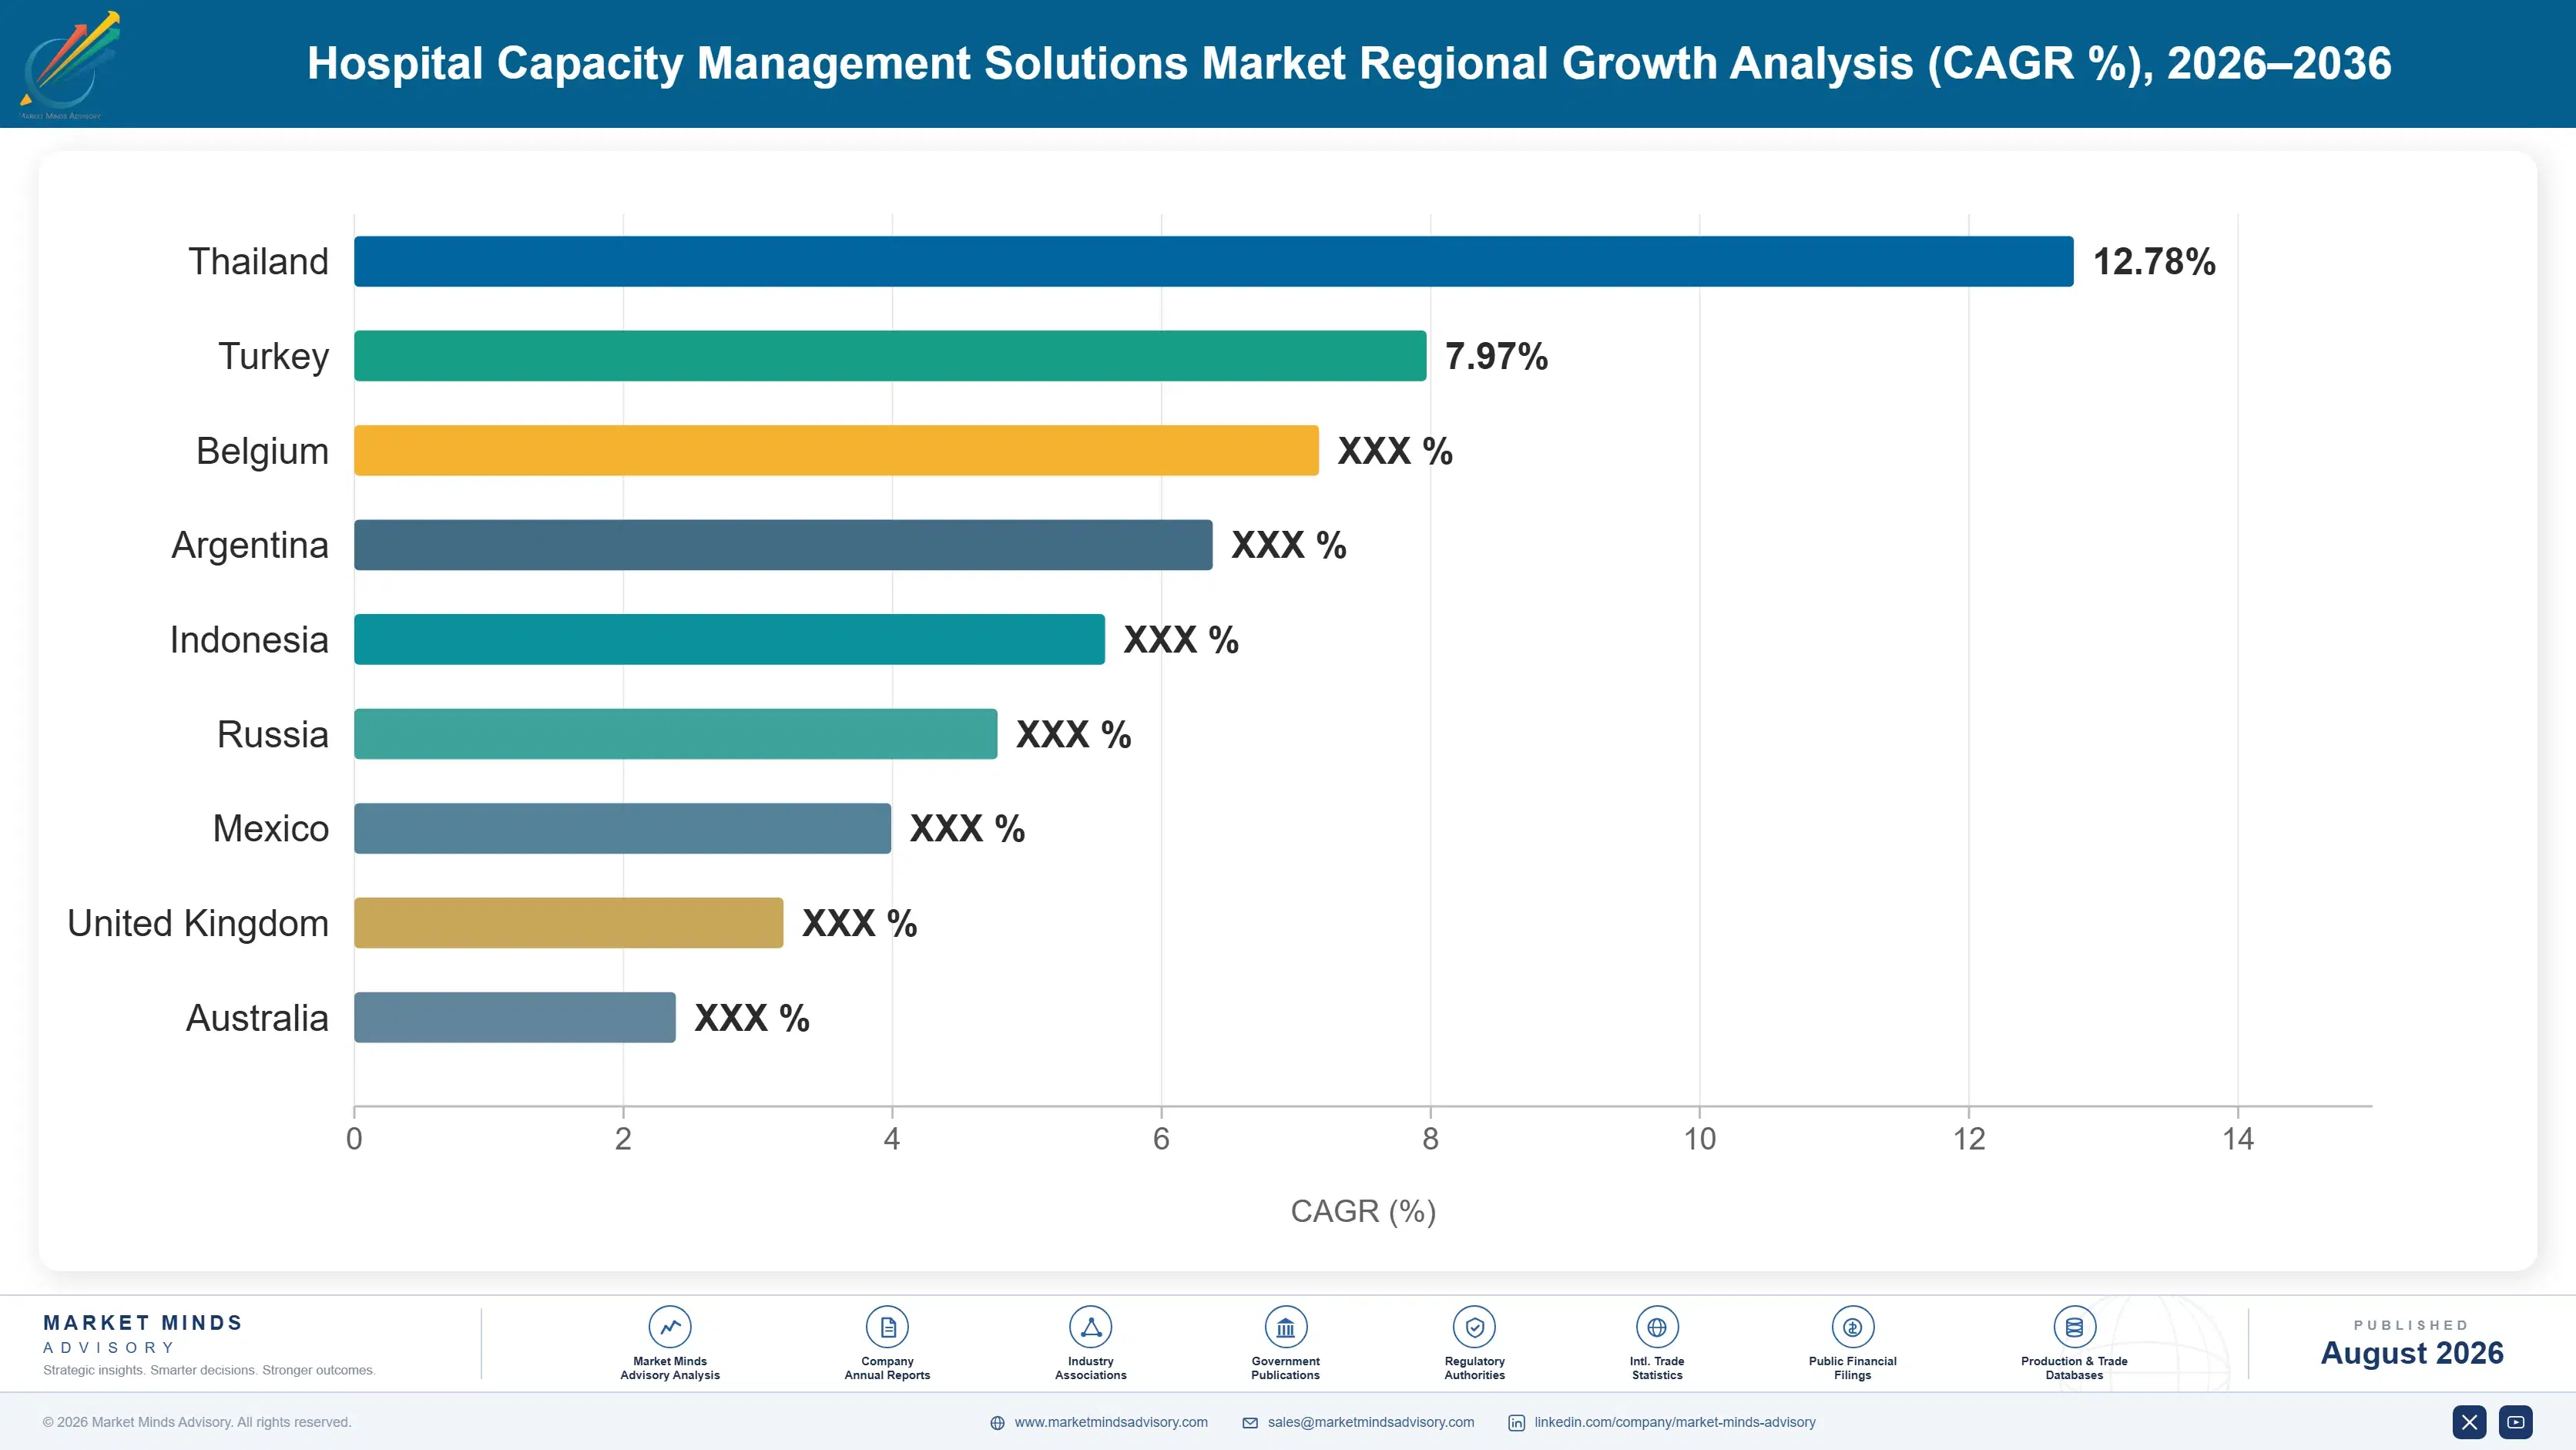
hospital-capacity-management-solutions-market-country-cagr-analysis-1787303492360

Where Capacity Software Value Is Won

Record vendors give away adequate functionality, so nothing durable is won on feature comparison. Value accrues to demonstrated length of stay reduction, to the operating model work that makes software actually deliver, and to buying centres the record vendor does not already own inside the hospital. Feature comparison decides very little at all now.

Contract on measured outcomes rather than on software deployment

A specialist competing against a bundled module cannot win on functionality, because the module is adequate and already paid for. Contracting on measured length of stay reduction or discharge timing improvement changes the comparison entirely, since a record vendor will not underwrite an operational outcome it does not control. Vendors offering outcome-linked commercial terms close roughly 30% more competitive evaluations against bundled alternatives. It requires genuine confidence in delivery and it filters out the implementations that were always going to fail. It also filters out implementations that were always going to fail.
Market Impact: Closes about 30% more competitive h

Sell the operating model, not the dashboard

Command centre results come substantially from physically co-locating flow staff and changing escalation practice, and the software supports that rather than causing it. Vendors who sell an operating model with embedded change consulting deliver measured benefit where licence-only deployments frequently deliver none, and discharge before noon has sat near 21% across a decade of software-only investment. Deal sizes run several times larger and sales cycles considerably longer. It also makes the engagement much harder for a record vendor to displace at renewal. Record vendors cannot bundle operating model work at any price.
Market Impact: Discharge timing remains stuck at 2

Open the nursing workforce buying centre alongside operations

Bed management is bought by chief operating officers and clinical workforce scheduling by chief nursing officers, from different budgets on different evaluation cycles. Agency staffing now exceeds 15% of payroll in many hospitals and appears in monthly financial reporting, which makes the nursing conversation far more urgent than the flow one. Vendors spanning both find the workforce discussion opens accounts that operational selling could not reach, and the two solutions reinforce each other because staffed beds and available beds are the same constraint. Two approvals become one conversation when both are held.
Market Impact: Agency spend runs above 15% of hosp

Build predictive models on multi-site rather than single-site data

Discharge prediction quality depends on training data breadth, which is the one dimension where record vendors hold no inherent advantage over specialists. A model trained across dozens of hospitals outperforms one trained on a single institution's history, and that gap widens as the installed base grows. Vendors who secured multi-site data rights early now hold accuracy that competitors cannot replicate by hiring. Contract language governing data use is where this is won or lost, and it is routinely negotiated far too casually. Models trained across dozens of hospitals free beds up to 4 hours earlier than single-site equivalents manage.
Market Impact: Frees hospital beds up to 4 hours e

Who Controls the Margin Pool

Concentration is low at 34% across the top five, measured on annual revenue from hospital capacity, patient flow and workforce scheduling software and associated services, the single basis applied throughout. Epic Systems and Oracle Health lead through capacity modules bundled inside record platforms hospitals already own. GE HealthCare, TeleTracking and Philips follow through command centre and flow positions built on operational outcomes rather than data ownership.
Competition runs almost entirely on the bundling question. A record vendor supplies adequate capacity functionality at little incremental cost and holds the underlying data, so specialists compete by demonstrating measurable operational improvement the module cannot claim. That contest is decided on reference outcomes and on willingness to contract against results. Workforce scheduling runs as a separate competition, since buyer, budget and criteria all differ from the operational purchase.

Pressure builds from two directions. Record vendors keep extending module capability, and each functional gap they close removes a specialist selling argument permanently. Separately, analytics specialists including LeanTaaS and Qventus compete on prediction quality built from multi-site data, which is the one dimension where record ownership confers no advantage. Rankings shift most where a specialist converts a software relationship into an operating model engagement.
hospital-capacity-management-solutions-market-company-positioning-matrix-1787303492884

Competitive Moat and Risk Dimensions

EPIC SYSTEMS

Moat: Record platform data ownership

Capacity management runs on data that already lives inside the electronic record, and Epic owns both the data and the integration path in a very large share of North American hospitals. Bundling capacity functionality at little incremental cost means a specialist must demonstrate measurable improvement over something the hospital has already paid for and already runs.
EPIC SYSTEMS

Risk: Operational outcome credibility

Record vendors sell software rather than operational change, and much of the measured benefit in this category comes from co-located staffing and altered escalation practice rather than from information. Epic will not contract against length of stay outcomes it does not control. Predictive model quality also depends on multi-site training data rather than on record ownership.
TELETRACKING TECHNOLOGIES

Moat: Operational flow implementation depth

TeleTracking built its position on patient flow operations rather than on software alone, with implementation methodology, transport and environmental services integration and command centre design accumulated across many health systems. That operational depth is what record vendors cannot bundle, and it is what makes measured throughput improvement reproducible across different hospital cultures.
TELETRACKING TECHNOLOGIES

Risk: Bundled module displacement

Every functional gap the record vendors close removes a selling argument, and roughly 46% of hospitals now use bundled capacity modules. Competing against free requires demonstrated outcomes and outcome-linked commercial terms that carry genuine delivery risk. Analytics specialists are meanwhile competing on prediction quality from a different technical direction entirely.

Players Tracked

Prominent Players

Epic Systems
Oracle Health
GE HealthCare
TeleTracking Technologies
Philips

Other Key Players

symplr
QGenda
UKG
LeanTaaS
Qventus
Central Logic
Care Logistics
Securitas Healthcare
CenTrak
Zebra Technologies
InterSystems
Altera Digital Health
Dedalus
Nervecentre Software
MEDHOST

Recent Developments

APRIL 2025

LeanTaaS expands predictive capacity platform across multi-site health systems

LeanTaaS extended its predictive capacity and scheduling platform across additional multi-site health systems, an organic commercial expansion rather than an acquisition, building the multi-hospital training data breadth on which discharge prediction accuracy depends far more than on record platform ownership. No acquisition formed part of the expansion.
Signal: Prediction accuracy is built from data bre
SEPTEMBER 2025

National Health Service directs capital toward hospital flow and discharge programmes

The National Health Service directed further capital toward hospital flow and discharge improvement programmes following continued emergency department performance pressure, reframing corridor care and ambulance handover delay as an inpatient capacity problem rather than an emergency department one. Capital was directed toward discharge rather than emergency capacity.
Signal: Emergency crowding is now being funded as
FEBRUARY 2026

Epic Systems widens bundled capacity and scheduling module functionality

Epic Systems extended the capacity management and clinical scheduling functionality bundled within its record platform, an organic product expansion that closes several functional gaps specialist vendors had used as differentiators in competitive hospital evaluations over recent years. No acquisition or partner product was involved in the release.
Signal: Each functional gap that a record vendor c

Engineering, Implementation and Cloud Cost Exposure

Cost structures here are dominated by people rather than infrastructure. Software engineering and data science labour accounts for roughly 41% of cost of delivery, and clinical implementation consultants contribute a further 24%, which is unusually high for a software category and reflects how much of the value depends on operational change rather than deployment. Cloud infrastructure and hosting sit at around 11%, rising with the shift toward predictive workloads.
The 2022 to 2024 technology labour market showed the exposure clearly. Competition for engineering and data science talent from outside healthcare pushed compensation sharply higher while hospital software contracts were priced annually and could not be reopened, and Oracle and GE HealthCare both referenced technology labour cost pressure in their reporting across those years. Health software vendors compete for the same engineers as far better-funded technology employers and generally lose on compensation.

The disadvantage falls hardest on specialists without scale. A vendor serving a few dozen hospitals amortises engineering cost across a small revenue base while a record vendor spreads identical development across thousands of institutions. Implementation consulting is harder still: it does not scale with software, and clinical change specialists are scarce and impossible to recruit quickly.
hospital-capacity-management-solutions-market-cost-volatility-analysis-1787303493082

Productise implementation methodology rather than staffing each deployment

Clinical change consulting does not scale with software and consumes the margin on every deployment. Codifying methodology into structured playbooks, configuration templates and trained hospital-side champions reduces consultant days per site substantially. It also improves consistency of measured outcome, which matters more commercially than the cost saving because reference results are what wins the next competitive evaluation.

Secure multi-site data rights at contract rather than afterwards

Predictive model accuracy depends on training breadth across many hospitals, and rights to use de-identified operational data are far cheaper to secure at initial signature than to renegotiate later. Vendors who left this to standard contract templates found themselves unable to build the multi-site models that now differentiate the category most clearly. Standard contract templates surrender it by default.

Price contracts with annual technology labour cost adjustment

Multi-year hospital software agreements written at fixed pricing transferred the whole engineering compensation increase onto vendors during the last cycle. Newer agreements increasingly carry narrow adjustment tied to published technology sector wage indices. Health systems accept that more readily than a general escalator, since the underlying data is public and clearly outside any single vendor's control.

Portfolio Architecture for Margin Defence

Margin architecture divides on whether a record vendor can bundle the capability away. Bed management and basic flow visibility are being commoditised inside record platforms and earn accordingly. Workforce scheduling holds better, because the buyer and the integration path both sit outside the operational record layer. Predictive analytics and command centre operating models earn most, protected respectively by multi-site training data and by implementation depth that cannot be bundled.
The volume versus premium tension runs between licence and engagement. Licence-only deployments scale well, cost little to deliver and frequently produce no measured benefit, which eventually poisons reference selling and renewal. Operating model engagements deliver results, command several times the contract value, and consume scarce implementation consultants who cannot be recruited quickly. Every specialist in this category is managing that trade rather than solving it.

High-value pools sit where the record vendor has no answer. Discharge prediction built on multi-site data, command centre design and staffing models, and outcome-linked commercial arrangements all fall outside what a bundled module can credibly offer. Basic bed status visibility and simple placement workflow sit at the opposite extreme entirely, and specialists still selling those are competing directly against something the hospital already owns.

Volume / Commodity-Adjacent Tier

Bed status visibility, basic placement workflow and standard flow dashboards, functionality that record vendors now bundle at little incremental cost inside platforms hospitals have already bought and already operate daily.
Gross Margin: 42-56%

Premium / Certified Tier

Clinical workforce scheduling, theatre utilisation optimisation and real-time location systems, protected by separate buying centres, distinct integration requirements and budgets that sit outside the operational record layer entirely. Different approvals and different evaluation cycles insulate these purchases from operational flow bundling.
Gross Margin: 60-72%

Sustainability / Regulatory / Next-Generation Tier

Predictive discharge forecasting and command centre operating model engagements, protected by multi-site training data and by implementation depth that no record vendor can bundle. Best returns and the least contested positions available.
Gross Margin: 68-80%
hospital-capacity-management-solutions-market-portfolio-architecture-1787303493587

Subscription Revenue Against Episodic Purchasing

Revenue arrives as multi-year subscription and renews reliably where measured benefit exists, which makes this look like a conventional software annuity. Purchasing behaviour does not cooperate. Hospitals buy capacity software after a crisis rather than before one, so demand clusters around winter pressure events, published performance failures and leadership changes. Pipeline forecasting is correspondingly difficult, and vendors routinely misjudge timing even when the eventual decision is certa
Stickiness depends almost entirely on whether the implementation delivered. Systems that produced measured length of stay improvement renew indefinitely, because nobody removes something demonstrably creating capacity. Deployments that went live and changed nothing get displaced at the first budget review, frequently by a bundled record module that costs nothing. Command centre engagements are stickiest of all, since the hospital has rebuilt its operations around the arrangement.

Buyer profiles have broadened considerably. A decade ago the chief operating officer or a patient flow director made these decisions alone. Today chief nursing officers buy workforce scheduling from separate budgets, chief information officers govern integration and data rights, and multi-hospital system executives evaluate across entire estates at once. Vendors organised around a single operational relationship increasingly find three separate approvals standing between them and a signature.
hospital-capacity-management-solutions-market-end-use-penetration-index-1787303494079

Where Capacity Strategy Must Land

These are among the four positions where our research anticipates prominent divergence between winners and laggards over the coming forecast period. Each is grounded in the demand model, the regulatory perimeter, and the announced capacity pipeline.
01 / OUTCOME CONTRACTING DISCIPLINE

Competing against free requires underwriting the result

Record vendors bundle adequate capacity functionality at little incremental cost, and roughly 46% of hospitals already use those modules, so no specialist wins a functionality comparison against something already paid for. Contracting on measured length of stay or discharge timing improvement changes the comparison entirely, because a record vendor will not underwrite an operational outcome it does not control. Vendors offering outcome-linked commercial terms close roughly 30% more competitive evaluations, and the discipline usefully filters out implementations that were always going to fail.
02 / OPERATING MODEL SELLING

The dashboard was never what produced the improvement

Discharge before noon has sat near 21% across a decade of software investment because the binding constraints are ward round timing, pharmacy turnaround and transport availability rather than any absence of information. Command centre results come substantially from co-locating flow staff and changing escalation practice, with software supporting that rather than causing it. Vendors selling an operating model with embedded change consulting deliver measured benefit where licence-only deployments have repeatedly delivered none at all, at several times the contract value.
03 / DATA RIGHTS NEGOTIATION

Multi-site training data is the one unbundleable advantage

Discharge prediction accuracy depends on training breadth across many hospitals rather than on owning any single institution's clinical record, which makes it the one dimension where record vendors hold no advantage whatsoever. A model trained across dozens of sites outperforms one built on a single hospital's history, and that gap keeps widening as the installed base grows. Contract language governing de-identified operational data use is routinely negotiated far too casually at signature, and renewal is the moment to correct it.
04 / SECOND BUYING CENTRE

Nursing budgets open doors operational selling cannot reach

Bed management is bought by chief operating officers, while clinical workforce scheduling is bought instead by chief nursing officers, from entirely separate budgets running on quite different evaluation cycles and timelines. Agency staffing now exceeds 15% of payroll at many hospitals and appears directly in monthly financial reporting, which makes that particular conversation considerably more urgent than operational flow. The two solutions reinforce each other directly, because a staffed bed and an available bed are ultimately the very same constraint.

Engagement Snapshot From the Field

A live engagement with an industry participant carrying material or product regulatory and market exposure ahead of a defining policy shift, showing how our research translates into a defensible multi-year portfolio strategy.
MARKET MINDS ADVISORY · CLIENT ENGAGEMENT SUMMARY
Hospital Capacity Management Solutions Producer Strategic Portfolio Review and Transition Roadmap 2026·Investment Scenario on Hospital Capacity Management Solutions Exposure Evaluation 2025-26
CLIENT PROFILE
A patient flow and bed management software vendor serving acute hospitals across North America and the United Kingdom, with annual recurring revenue of approximately USD 96 million (client-reported, unverified by MMA). Roughly 70% came from bed management and flow visibility licences sold to hospital operations departments. The company held a small predictive analytics capability and no formal implementation consulting practice at all.
STRATEGIC CHALLENGE
Record platform vendors had bundled comparable bed management functionality into systems the client's prospects already owned, and win rates in competitive evaluations had fallen for three consecutive years. The board wanted to know whether to compete on price and functional depth against bundled modules, or to reposition around predictive analytics and operating model engagements where the record vendors had no equivalent offering.
MMA APPROACH
MMA conducted 47 expert interviews across hospital chief operating officers, chief nursing officers, flow directors, chief information officers and procurement leads in six countries. A quantitative survey of 3,800 respondents established purchasing authority, evaluation criteria and measured outcome expectations by solution category. We then modelled win rate and contract value under both options against observed bundling trajectories and reference outcome data in each market.
KEY FINDINGS
  1. Hospital operations leaders selected bundled record modules over specialist products in most evaluations unless the specialist presented measured length of stay outcomes from comparable institutions.
  2. Discharge before noon had not improved measurably at any site where the client had deployed software without accompanying operational change work, across the entire reference base examined.
  3. Chief nursing officers held separate budgets for workforce scheduling and had not been approached by the client in any account, despite the operations relationship already existing.
  4. Predictive discharge model accuracy correlated directly with the number of hospitals contributing training data, and the client's contracts granted no rights to use operational data across sites.
CLIENT PROFILE
A patient flow and bed management software vendor serving acute hospitals across North America and the United Kingdom, with annual recurring revenue of approximately USD 96 million (client-reported, unverified by MMA). Roughly 70% came from bed management and flow visibility licences sold to hospital operations departments. The company held a small predictive analytics capability and no formal implementation consulting practice at all.
STRATEGIC CHALLENGE
Record platform vendors had bundled comparable bed management functionality into systems the client's prospects already owned, and win rates in competitive evaluations had fallen for three consecutive years. The board wanted to know whether to compete on price and functional depth against bundled modules, or to reposition around predictive analytics and operating model engagements where the record vendors had no equivalent offering.
MMA APPROACH
MMA conducted 47 expert interviews across hospital chief operating officers, chief nursing officers, flow directors, chief information officers and procurement leads in six countries. A quantitative survey of 3,800 respondents established purchasing authority, evaluation criteria and measured outcome expectations by solution category. We then modelled win rate and contract value under both options against observed bundling trajectories and reference outcome data in each market.
KEY FINDINGS
  1. Hospital operations leaders selected bundled record modules over specialist products in most evaluations unless the specialist presented measured length of stay outcomes from comparable institutions.
  2. Discharge before noon had not improved measurably at any site where the client had deployed software without accompanying operational change work, across the entire reference base examined.
  3. Chief nursing officers held separate budgets for workforce scheduling and had not been approached by the client in any account, despite the operations relationship already existing.
  4. Predictive discharge model accuracy correlated directly with the number of hospitals contributing training data, and the client's contracts granted no rights to use operational data across sites.
RECOMMENDED STRATEGY
Phase 1: Phase one: renegotiate contract terms at renewal to secure de-identified multi-site operational data rights, which the predictive capability depends on entirely. Phase 2: Phase two: build a productised implementation methodology and offer outcome-linked commercial terms on length of stay in competitive evaluations against bundled modules. Phase 3: Phase three: open the chief nursing officer relationship with a workforce scheduling offering, using operations accounts already held as the entry point.
OUTCOME
The client secured multi-site data rights across roughly two thirds of its installed base within a year and launched outcome-linked commercial terms (client-reported, unverified by MMA). Competitive win rates against bundled modules recovered materially, average contract value rose about forty per cent where implementation work was included, and workforce scheduling opened eleven new buying relationships.

Frequently Asked Questions

Foundational context covering the market sizes, CAGR, scope, country, region and competition that inform every finding below. This section is provided to cover basics and most often pre-purchase conversations, answered from the MMA Primary Research Dataset.

What is the current size of the Hospital Capacity Management Solutions Market?

The global hospital capacity management solutions market was valued at USD 3.4 billion in 2025, covering bed management, patient flow platforms, theatre scheduling, workforce scheduling, location tracking and predictive analytics. Core electronic record platforms fall outside this definition.

How large will the Hospital Capacity Management Solutions Market be by 2036?

MMA forecasts the market at USD 10.72 billion by 2036, expanding 2.84 times from the 2026 base of USD 3.77 billion. That represents roughly USD 6.95 billion of incremental value across the forecast decade.

What is the CAGR for the Hospital Capacity Management Solutions Market 2026 to 2036?

The base case compound annual growth rate is 11.0%, with a bull case of 12.3% and a bear case of 9.8%. The bear case reflects continued bundling of capacity functionality inside electronic record platforms.

Which segment is growing fastest?

Predictive capacity forecasting and analytics grows at 16.5%, a full 1.50x the overall market rate. It forecasts which patients will actually be discharged today rather than describing beds a manager can already see.

Who are the major companies in the Hospital Capacity Management Solutions Market?

Epic Systems, Oracle Health, GE HealthCare, TeleTracking Technologies and Philips together hold 34% of revenue. Record vendors compete by bundling functionality while specialists compete on demonstrated operational outcomes.

Which country is growing fastest?

India grows fastest at 15.2%, where private hospital groups build new facilities digitally from the outset rather than retrofitting older estates. South Asia and Pacific is the fastest region overall at 13.2%.

Report Segmentation Architecture

The full report scope spans multiple orthogonal segmentation dimensions, with cross-tabulated demand data provided for each dimension pair. Coverage extends further to regional breakdowns, trend trajectories, and the competitive detail needed to support segment-level decision-making.

By Solution Category

  • Bed Management and Placement Systems
  • Patient Flow and Command Centre Platforms
  • Operating Theatre Scheduling and Utilisation Software
  • Clinical Workforce Scheduling Solutions
  • Real-Time Location and Asset Tracking Systems
  • Predictive Capacity Forecasting and Analytics

By End-Use Industry

  • Acute Care Hospitals
  • Multi-Hospital Health Systems
  • Academic Medical Centres
  • Emergency and Urgent Care Networks
  • Specialty and Rehabilitation Facilities
  • National and Regional Health Authorities

By Commercial Dimension

  • Multi-Year Subscription Licensing
  • Record Platform Bundled Modules
  • Outcome-Linked Commercial Agreements
  • Implementation and Consulting Services
  • National Health System Framework Contracts
  • Group Purchasing and System-Wide Agreements

By Region

  • North America
  • Western Europe
  • East Asia
  • South Asia and Pacific
  • Latin America
  • Middle East and Africa
  • Eastern Europe

Scope, Methodology, and Coverage

Every figure in this report is reproducible from documented input assumptions. The scope below maps the historical period, the forecast horizon, the segmentation dimensions, and the countries covered, alongside the underlying primary and qualitative methodology.
Historical Period
2020 to 2025
Forecast Period
2026 to 2036
Base Year
2025 (USD billions; MMA Primary Research Dataset, August 2026)
Market Definition
This market comprises software and associated services used by hospitals to manage inpatient capacity, patient flow and clinical resource utilisation, measured at licence, subscription, implementation and support revenue across acute hospitals, multi-hospital systems and national health authorities. Coverage spans bed management and patient placement systems, patient flow and command centre platforms including associated operating model consulting, operating theatre scheduling and utilisation optimisation software, clinical workforce and nurse scheduling solutions, real-time location systems used for patient and asset tracking within capacity workflows, and predictive capacity forecasting and discharge analytics. Core electronic health record platforms, revenue cycle management and billing systems, clinical decision support and diagnostic software, laboratory and radiology information systems, physical bed and furniture hardware, hospital construction and estates services, and general enterprise resource planning fall outside scope.
Quantitative Units
USD billions (current prices); installed hospital counts by solution category; average annual contract value; implementation cycle duration; measured length of stay and discharge timing outcomes
Segmentation Dimensions
By Solution Category; By End-Use Industry; By Commercial Dimension; By Region
Regions Covered
North America, Western Europe, East Asia, South Asia and Pacific, Latin America, Middle East and Africa, Eastern Europe
Countries Covered
United States, Canada, United Kingdom, Ireland, Germany, France, Netherlands, Sweden, Denmark, Spain, Italy, China, Japan, South Korea, Taiwan, India, Australia, New Zealand, Singapore, Malaysia, Indonesia, Brazil, Mexico, Chile, Colombia, Saudi Arabia, United Arab Emirates, Israel, South Africa, Poland, Czechia, Hungary, Romania, and additional markets relevant to hospital digital operations analysis
Key Companies Profiled
Epic Systems, Oracle Health, GE HealthCare, TeleTracking Technologies, Philips, symplr, QGenda, UKG, LeanTaaS, Qventus, Central Logic, Care Logistics, Securitas Healthcare, CenTrak, Zebra Technologies, InterSystems, Altera Digital Health, Dedalus, Nervecentre Software, MEDHOST
Quantitative Methodology
Primary survey, n=3,800 respondents, Q4 2025, six countries; demand-side model with trade association cross-validation
Qualitative Methodology
47 expert interviews, Q4 2025; applied to validate demand model assumptions, identify emerging dynamics, and assess competitive positioning
Report Format
PDF and XLSX data workbook (Word format preview document)
Publisher
Market Minds Advisory
Report Code
MMA-2026-TEC-150
Published
August 2026
Contact
sales@marketmindsadvisory.com | www.marketmindsadvisory.com

Purchase the full Hospital Capacity Management Solutions Market Report (2026 to 2036).

The full MMA report treats capacity software as a virtual bed business, quantifying the throughput arithmetic that drives every purchase and identifying where implementations fail to deliver it. It sizes six solution categories and seven regions to 2036, modelling installed hospital counts, contract values and measured outcomes separately so that deployment growth can be distinguished from realised benefit. Competitive assessment covers twenty vendors on one consistent revenue basis, with particular attention to record platform bundling. Cost exposure is traced through engineering labour, implementation consulting scarcity and cloud infrastructure. Four commercial levers and a strategic verdict close the report, grounded in 47 expert interviews and a 3,800-respondent survey.
Six solution categories sized separately to 2036
Record platform bundling impact quantified across hospital evaluations
Implementation outcome data mapped against deployment counts
Twenty vendors assessed on one consistent basis
Predictive model data breadth modelled as competitive advantage
Anonymised client engagement with tested strategic recommendations

Built For The People Who Decide

From boardroom strategy to bench-side execution, this report is read cover-to-cover by leaders shaping the next decade of their industry, turning demand scenarios, market dynamics and valuation benchmarks into decisions.
CXOs/ Presidents/ VPs/ Managers
M&A and Corporate Development
Strategy Teams and R&D Heads
Procurement and Product Directors
Regulatory and Compliance Leaders
Investor Relations and Equity Analysts