Market Minds Advisory
Hospital-Acquired Infection Control Market

Hospital-Acquired Infection Control Market: Buying Products To Solve A Behaviour Problem

Hand hygiene compliance sits near 40% after fifty years of campaigns, and most acquired infections are preventable with measures hospitals already own. The market keeps selling more products into that gap.

Lead Analyst

Alice Ballenger

Published

September 2026

Make Smarter Decisions with Customized Research Insights

Request a free sample report and evaluate market opportunities, growth trends, and competitive dynamics relevant to your business needs.

2025 MARKET VALUE$22.8BMarket Size 2025
2036 FORECAST VALUE$46.0BBase Case , 2026 to 2036
CAGR 2026 TO 20366.6 %Bull 7.8% / Bear 5.4%
INCREMENTAL OPPORTUNITY$21.8BNet 10- year value creation
EXPANSION MULTIPLE1.89x2036 value over 2026 base
Strategic Levers
M&A Pipeline
Regional Outlook
Country Rankings
Competitive Intelligence
Segmental Deep-dive
Call-Us : 91 93563 13602

Executive Snapshot and Market Trajectory

Roughly 7% of admitted patients in developed systems pick up an infection they did not arrive with, and something like 55% of those are preventable using measures the hospital already owns and stocks. The problem is compliance, not product. The market reaches USD 22.8 billion in 2025.
Automated room and surface decontamination grows fastest at 9.9%, exactly 1.50 times the market rate, because it is the one intervention that does not depend on anybody remembering to perform it correctly. East Asia holds 27% of value on the largest hospital bed population in the world alongside heavy post-pandemic investment. South Asia and Pacific takes 13%, above the band this framework applies, on accreditation-driven private expansion.
Concentration is low at 34% across the top five, in a field spanning chemicals, capital equipment, disposables, and software that no single supplier covers at all convincingly. Competition turns on validated efficacy claims, on how well the product fits ward workflow, and increasingly on demonstrated infection rate reduction. Reimbursement penalties moved the purchase decision from the infection prevention nurse up to the chief financial officer, and the whole argument changed with it.
Market Definition
The hospital-acquired infection control market covers products and services used to prevent healthcare-associated infection, spanning automated room and surface decontamination, endoscope reprocessing systems, sterilisation equipment and consumables, disinfectants and antiseptics, and protective barriers and hand hygiene systems. Therapeutic antibiotics and antifungals, diagnostic microbiology testing, surgical implants with antimicrobial coatings, general facility cleaning outside clinical areas, and hospital waste disposal services are excluded.
Base Year Value
$22.8B in 2025 (MMA Primary Research Dataset, August 2026)
Forecast Period
2026 to 2036, eleven discrete annual values
CAGR
6.6% base case. Bull 7.8%. Bear 5.4%.
Fastest Growth Segment
Automated Room and Surface Decontamination: 9.9% CAGR
Fastest Growth Country
India: 9.8% CAGR
Fastest Growth Region
South Asia and Pacific: 8.6% CAGR
Largest Region
East Asia: 27% of 2025 global value
Market Leaders
Ecolab, STERIS, Solventum, Getinge, Advanced Sterilization Products. Source: MMA Primary Research Dataset, July 2026.
Primary Survey
n=3,800 procurement and R&D decision-makers, Q4 2025, six countries
Methodology
Demand-side build-up, cross-validated against public data, 47 expert interviews

Hospital-Acquired Infection Control Market Forecast Scenarios

hospital-acquired-infection-control-market-size-forecast-scenario-1787297662161
Between 2020 and 2025 the market surged and then had to justify itself again. Pandemic spending on disinfection, barrier products, and room decontamination ran far ahead of any evidence base, and much of it reversed sharply from 2022 as budgets tightened. Underlying infection control spend kept growing throughout. A 5.5% historical CAGR averages a spike and a correction around a steady baseline.
Three mechanisms carry the 6.6% base case. Antimicrobial resistance is the largest, since infections that were once treatable now are not and prevention becomes the only reliable control. Reimbursement penalties are the second, which put avoided cost rather than avoided infection into the business case and moved the decision upward. And hospital construction across Asia is the third, adding sterilisation and reprocessing capacity that did not previously exist. None of the three depends on new science.
The 7.8% bull case turns on mandatory infection rate reporting spreading beyond the handful of systems publishing it today, since transparency has moved spending faster than any clinical argument ever has. The 5.4% bear case is the continued unwinding of pandemic-era purchasing, where several product categories were bought in volumes that clinical need never supported and inventories are still being worked down.

The Problem Is Nobody Doing It

Everything that works in infection control has been known for decades. Hand hygiene, aseptic technique, catheter removal on schedule, and proper instrument reprocessing prevent the majority of healthcare-associated infection, and around 55% of those infections are considered avoidable with exactly those measures. Hospitals own the products. Observed hand hygiene compliance still sits near 40% on a normal ward.
TOP FIVE CONCENTRATION34%A fragmented field spanning chemicals, equipment, disposables, and software
PATIENTS ACQUIRING INFECTION7%Share of admitted patients developing an infection during their stay
COST PER EPISODEUSD 14,000Additional treatment expense attributable to a single acquired infection
HAND HYGIENE COMPLIANCE40%Observed adherence to required moments during routine ward care
ENDOSCOPE REPROCESSING CYCLES40,000Procedures a flexible scope typically undergoes before eventual retirement
PREVENTABLE INFECTION SHARE55%Acquired infections considered avoidable using measures already available
That gap is what this market actually sells into. Every new dispenser, monitoring badge, coated surface, and decontamination robot is a response to the same underlying fact: relying on tired people to do something correctly forty times a shift does not work at any scale. Products that remove the human from the loop entirely grow fastest, and that is not a coincidence.
Reimbursement changed who decides. Once payers stopped funding the treatment of conditions patients acquired in hospital, an infection stopped being a clinical event and became a financial one at roughly USD 14,000 an episode. That moved the purchasing conversation from an infection prevention nurse arguing for a budget line to a finance director calculating avoided penalties, and suppliers who did not follow it upward lost access.
"Show me a hospital that has solved hand hygiene through training. I have been looking for twenty years. What actually moves the number is removing the decision from the person, and everybody knows it and very few will say it out loud."
Director, Infection Prevention Practice · MMA Healthcare Practice ·

Market Trends

Automation Removes The Compliance Variable Entirely

Ultraviolet and hydrogen peroxide room systems, automated endoscope reprocessors, and monitored dispensing all address the same problem, which is that manual protocols depend on people executing them correctly under pressure. A machine that runs a validated cycle does not get busy, distracted, or interrupted halfway through. Hospitals adopting automated terminal decontamination report reductions in environmental contamination that manual cleaning audits had never achieved. That is why this is the fastest segment at 9.9%, and the argument is about human reliability rather than about disinfection chemistry. Room turnaround time is the practical limit on deployment.
Market Impact: Penalties reach 1% of payments
Antimicrobial Resistance Makes Prevention The Only Control

Infections caused by carbapenem-resistant organisms and by Candida auris are increasingly difficult or impossible to treat, which removes the fallback that made imperfect prevention tolerable for decades. Where treatment fails, prevention is the entire strategy, and infection control budgets have been argued successfully on that basis in systems that previously resisted them. Outbreak costs are also far higher when the organism is resistant, since isolation, screening, and ward closure follow. This is the most durable driver in the market because nothing about it reverses. Nothing about the trajectory reverses within any forecast period.
Market Impact: Asia adds 200,000 beds annually

Market Opportunities and Growth Drivers

Reimbursement Penalties Made Infection A Financial Event

Payers in several countries stopped funding treatment for conditions acquired during a hospital stay, and some now publish comparative infection rates or adjust payment against them directly. An acquired infection at roughly USD 14,000 an episode became a cost the hospital absorbs rather than one it bills for. That put infection control into a finance conversation about avoided penalty rather than a clinical conversation about avoided harm, and it unlocked capital that clinical argument alone never had. Suppliers who reframed accordingly gained access to budgets they had not previously reached.
Market Impact: Fewer than 20% have clinical evidence

Asian Hospital Construction Adds Reprocessing Capacity

China, India, and Southeast Asia are building acute care capacity at a pace no developed market approaches, and every new hospital requires a central sterile services department, endoscope reprocessing, and the consumable streams attached to both. Chinese endoscopy volumes in particular have grown steeply with gastric cancer screening programmes, and each additional scope carries reprocessing requirements throughout its working life. This is new installed capacity rather than replacement, which is why the growth rates in those regions run well above the mature markets. Every new department arrives with a consumable stream attached.
Market Impact: Inventory overhang lasted 3 years

Market Restraints and Challenges

Efficacy Claims Rarely Translate Into Rate Reduction

A disinfectant that kills organisms on a test coupon in a laboratory does not reliably reduce infection rates on a ward, because the pathway from surface contamination to patient infection runs through many steps a product cannot control. The root cause is that most evidence in this field is surrogate rather than clinical. Commercially it makes procurement sceptical of premium claims and pushes purchasing toward price. Participants are mitigating with cluster-randomised studies, real-world rate data from adopting hospitals, and outcome-linked contracting that puts the supplier's revenue behind the claim. Procurement has learned to discount the claims accordingly.
Market Impact: Manual cleaning misses 50% of surfaces

Pandemic Purchasing Left Inventory And Scepticism

Hospitals bought disinfection and barrier products in volumes far beyond clinical need through 2020 and 2021, and several categories were still working through that inventory years later. The root cause was procurement under emergency conditions with no time to evaluate anything properly. Commercially it depressed volumes through the correction and left procurement teams considerably more sceptical of urgency-based selling than they were before. Suppliers are mitigating by rebuilding on evidence and total cost arguments rather than on risk messaging that has now been heavily discounted. Urgency-based selling now meets a considerably colder reception.
Market Impact: Resistant infections cost 3 times more
3 additional market trends, 2 additional growth drivers, and 4 additional restraints and challenges are covered in the full report. Contact sales@marketmindsadvisory.com to access the complete intelligence.

Segment CAGR and Growth Architecture

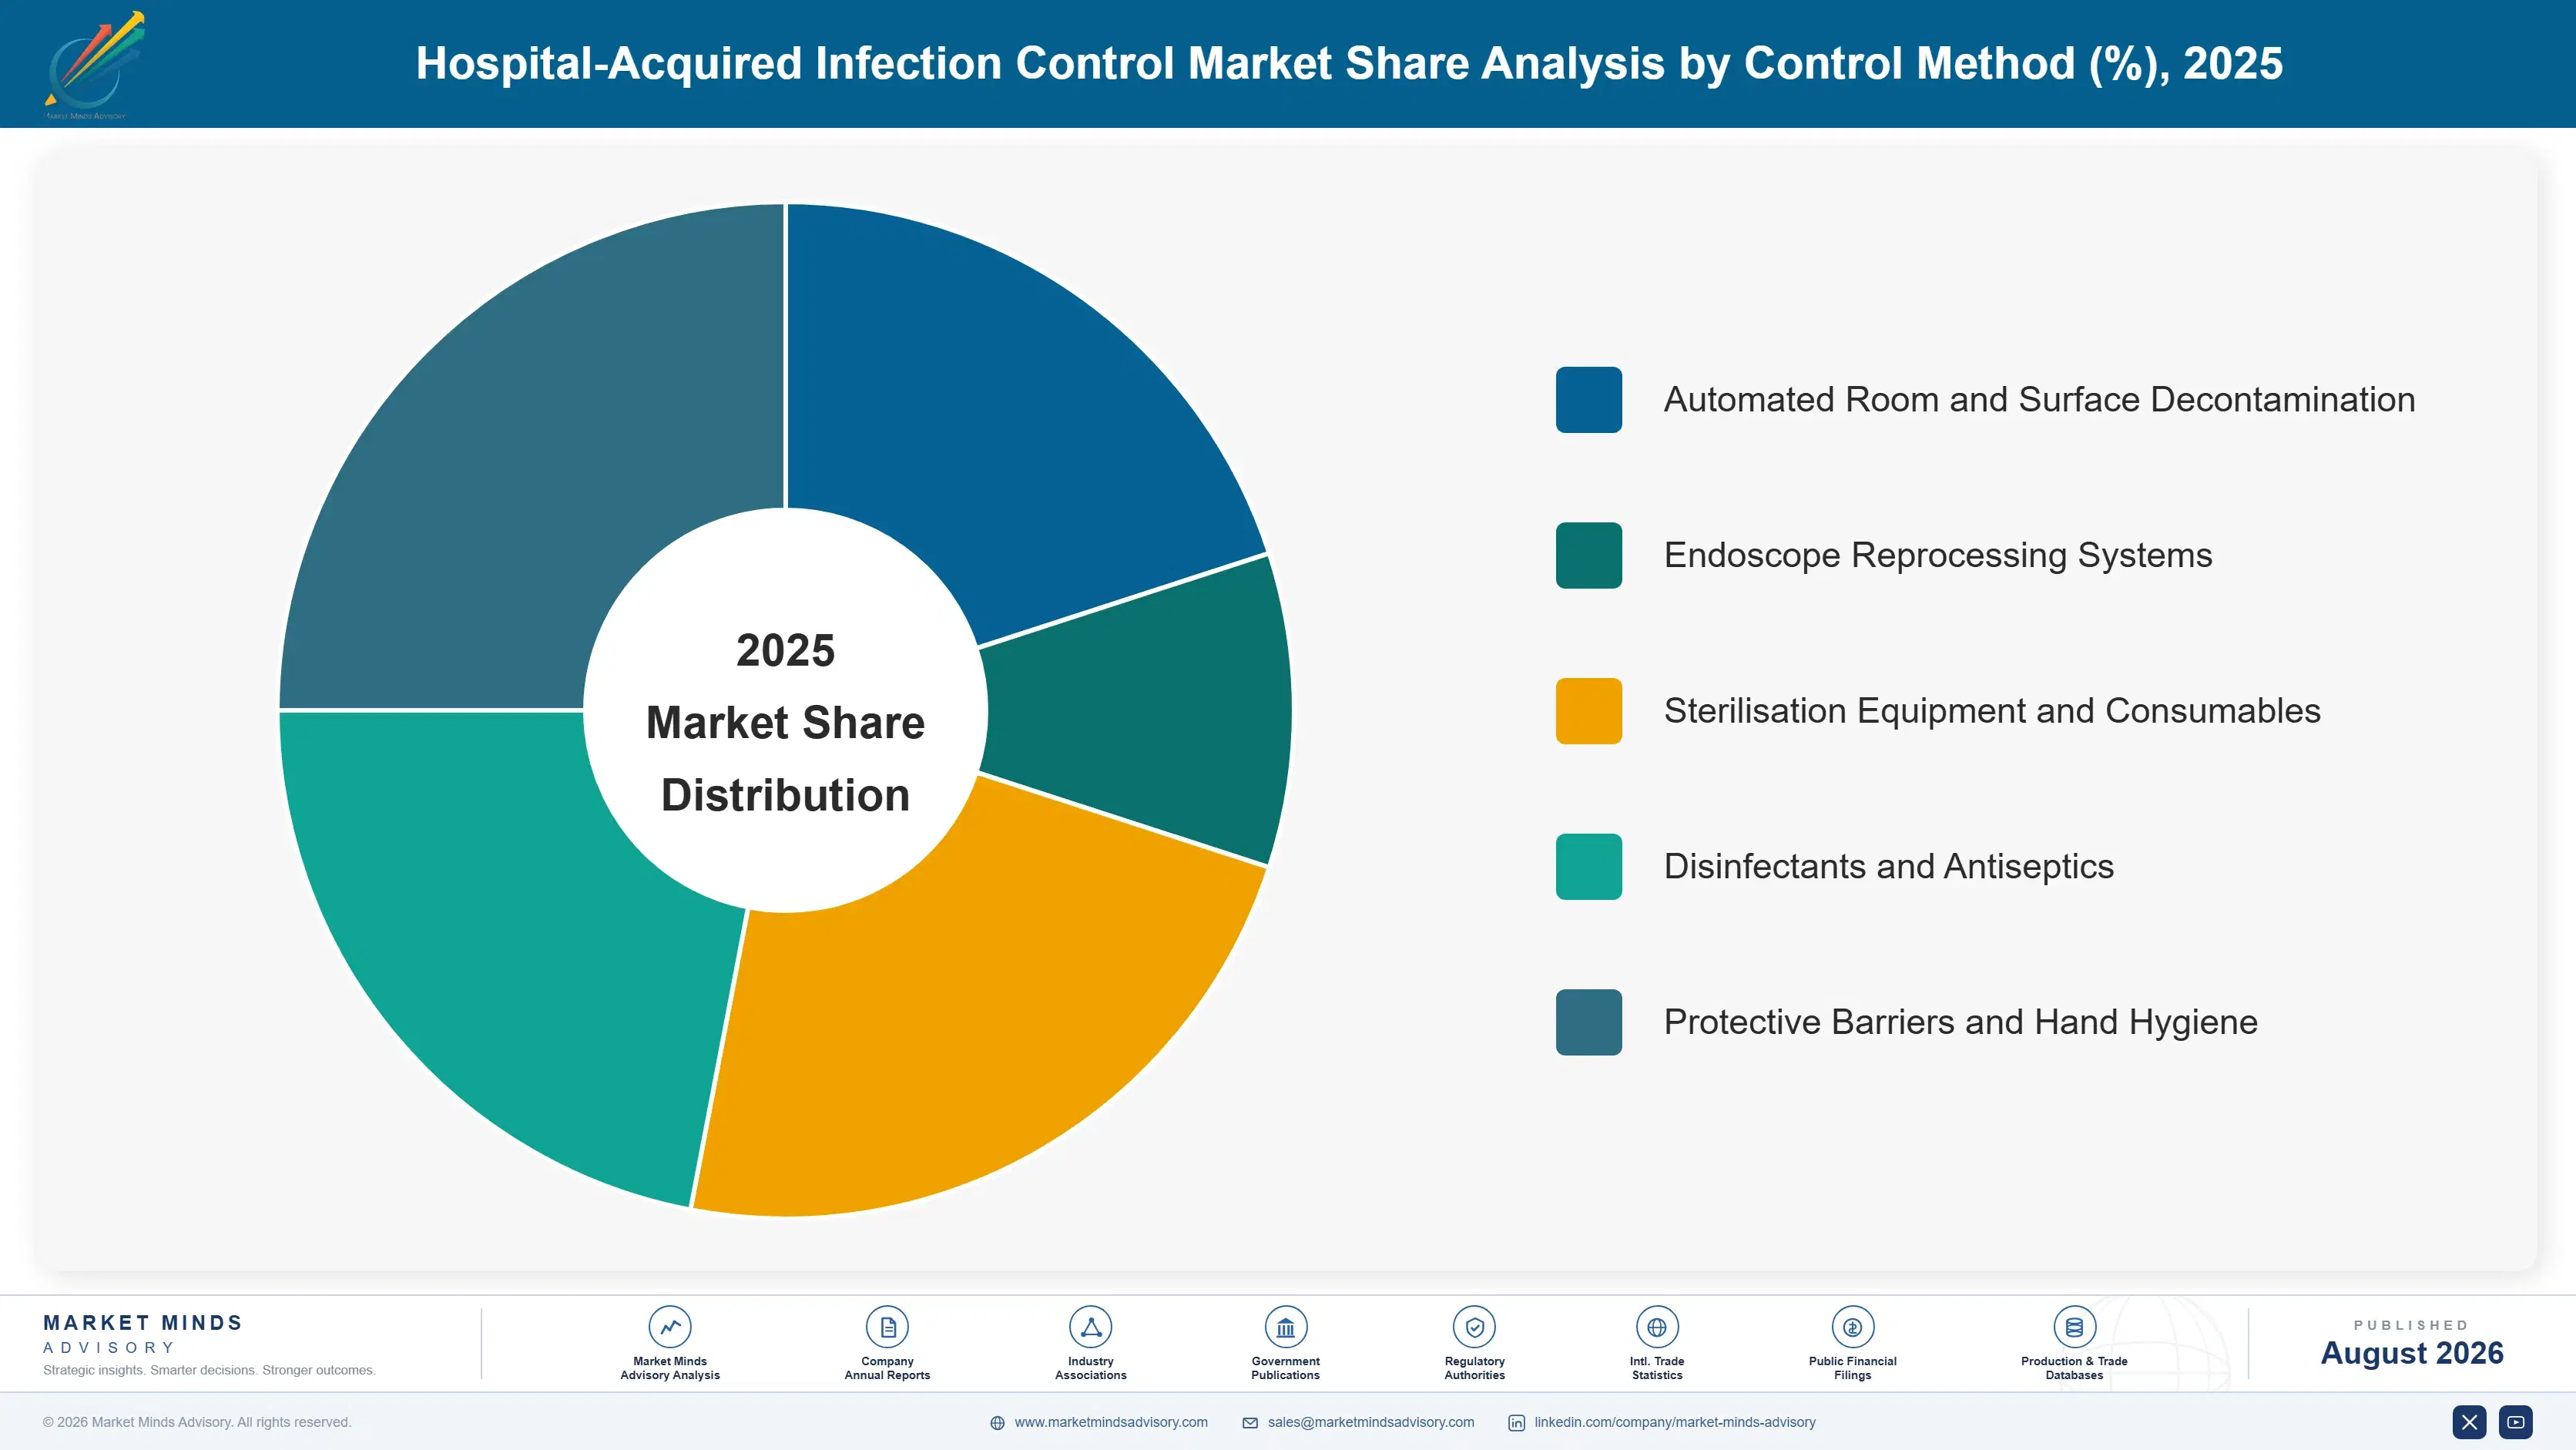
Segmentation follows control method, because what a product physically does determines the evidence it needs to carry, the budget it comes out of, and how heavily it depends on somebody performing a task correctly. Pathogen type, care setting, and hospital department are handled in the framework and commentary rather than being treated as segments here.
hospital-acquired-infection-control-market-market-share-analysis-1787297662711

Automated Room and Surface Decontamination

Automated decontamination grows fastest at 9.9%, exactly 1.50 times the market rate, and the reason is human rather than microbiological. Manual terminal cleaning misses roughly half the surfaces it is supposed to cover, and audits have shown that consistently for years without the number improving much. An ultraviolet or hydrogen peroxide system runs a validated cycle regardless of how busy the ward is or who is on shift. Capital cost is significant and room turnaround time is the practical constraint on how often it can be used. Hospitals adopting it report contamination reductions that no amount of cleaning training had achieved. The argument being made is about human reliability rather than about disinfection chemistry.
CAGR 9.9%

Endoscope Reprocessing Systems

Endoscope reprocessing grows at 8.4%, driven by procedure volume and by a series of outbreaks that made the difficulty of cleaning a flexible scope impossible to ignore. Duodenoscopes in particular have narrow channels and an elevator mechanism that manual cleaning cannot reliably reach, and transmission events involving resistant organisms forced regulatory attention. Automated reprocessors, single-use components, and traceability systems all follow from that. Asian endoscopy volumes are rising steeply with gastric cancer screening, and each scope carries reprocessing consumables and validation throughout a working life of tens of thousands of procedures. Regulatory attention rather than commercial preference has driven most of this adoption. Manual cleaning of these instruments simply cannot be made reliable.
CAGR 8.4%
Full segment breakdown across 5 segments available in the complete report.

Regional Architecture and Country Demand Map

Regional shares here follow acute care capacity and regulatory pressure rather than infection burden, which runs highest in exactly the systems that spend least on prevention. Bed numbers, procedure volumes, and whether anybody publishes infection rates explain this map far better than clinical need does.

East Asia

East Asia takes 27% of value, the largest share of any region, on hospital bed numbers that dwarf anywhere else and heavy post-pandemic infection control investment. China operates by far the largest acute bed population in the world and has expanded central sterile services and endoscope reprocessing capacity substantially, with domestic manufacturers supplying much of the equipment. Chinese endoscopy volumes have grown steeply under gastric cancer screening, which drives reprocessing consumables directly. Japanese and Korean provision is technically demanding and comprehensively regulated. Growth at 7.4% exceeds the global rate on capacity additions and rising procedure volume together. Domestic manufacturers supply most of the routine consumable volume. International suppliers hold the demanding equipment categories.
Share: 27% | CAGR: 7.4% (2026 to 2036)

South Asia and Pacific

Fastest growth sits in South Asia and Pacific at 8.6%, on 13% of global value against a 12% ceiling in this framework. Indian private hospital chains have expanded rapidly and compete partly on accreditation, which requires documented infection control programmes and the equipment to support them. Public sector provision lags considerably and infection rates in many facilities are far above what any reporting system captures. Australian and Singaporean standards are among the highest anywhere. Growth comes from new acute capacity being built with infection control designed in rather than retrofitted afterwards. Public sector rates remain far above anything reported. Accreditation is doing the work regulation does elsewhere. Growth follows construction more than policy.
Share: 13% | CAGR: 8.6% (2026 to 2036)
Regional intelligence for 5 additional markets available in the complete report: North America, Western Europe, Latin America, Middle East and Africa, Eastern Europe. Contact sales@marketmindsadvisory.com.
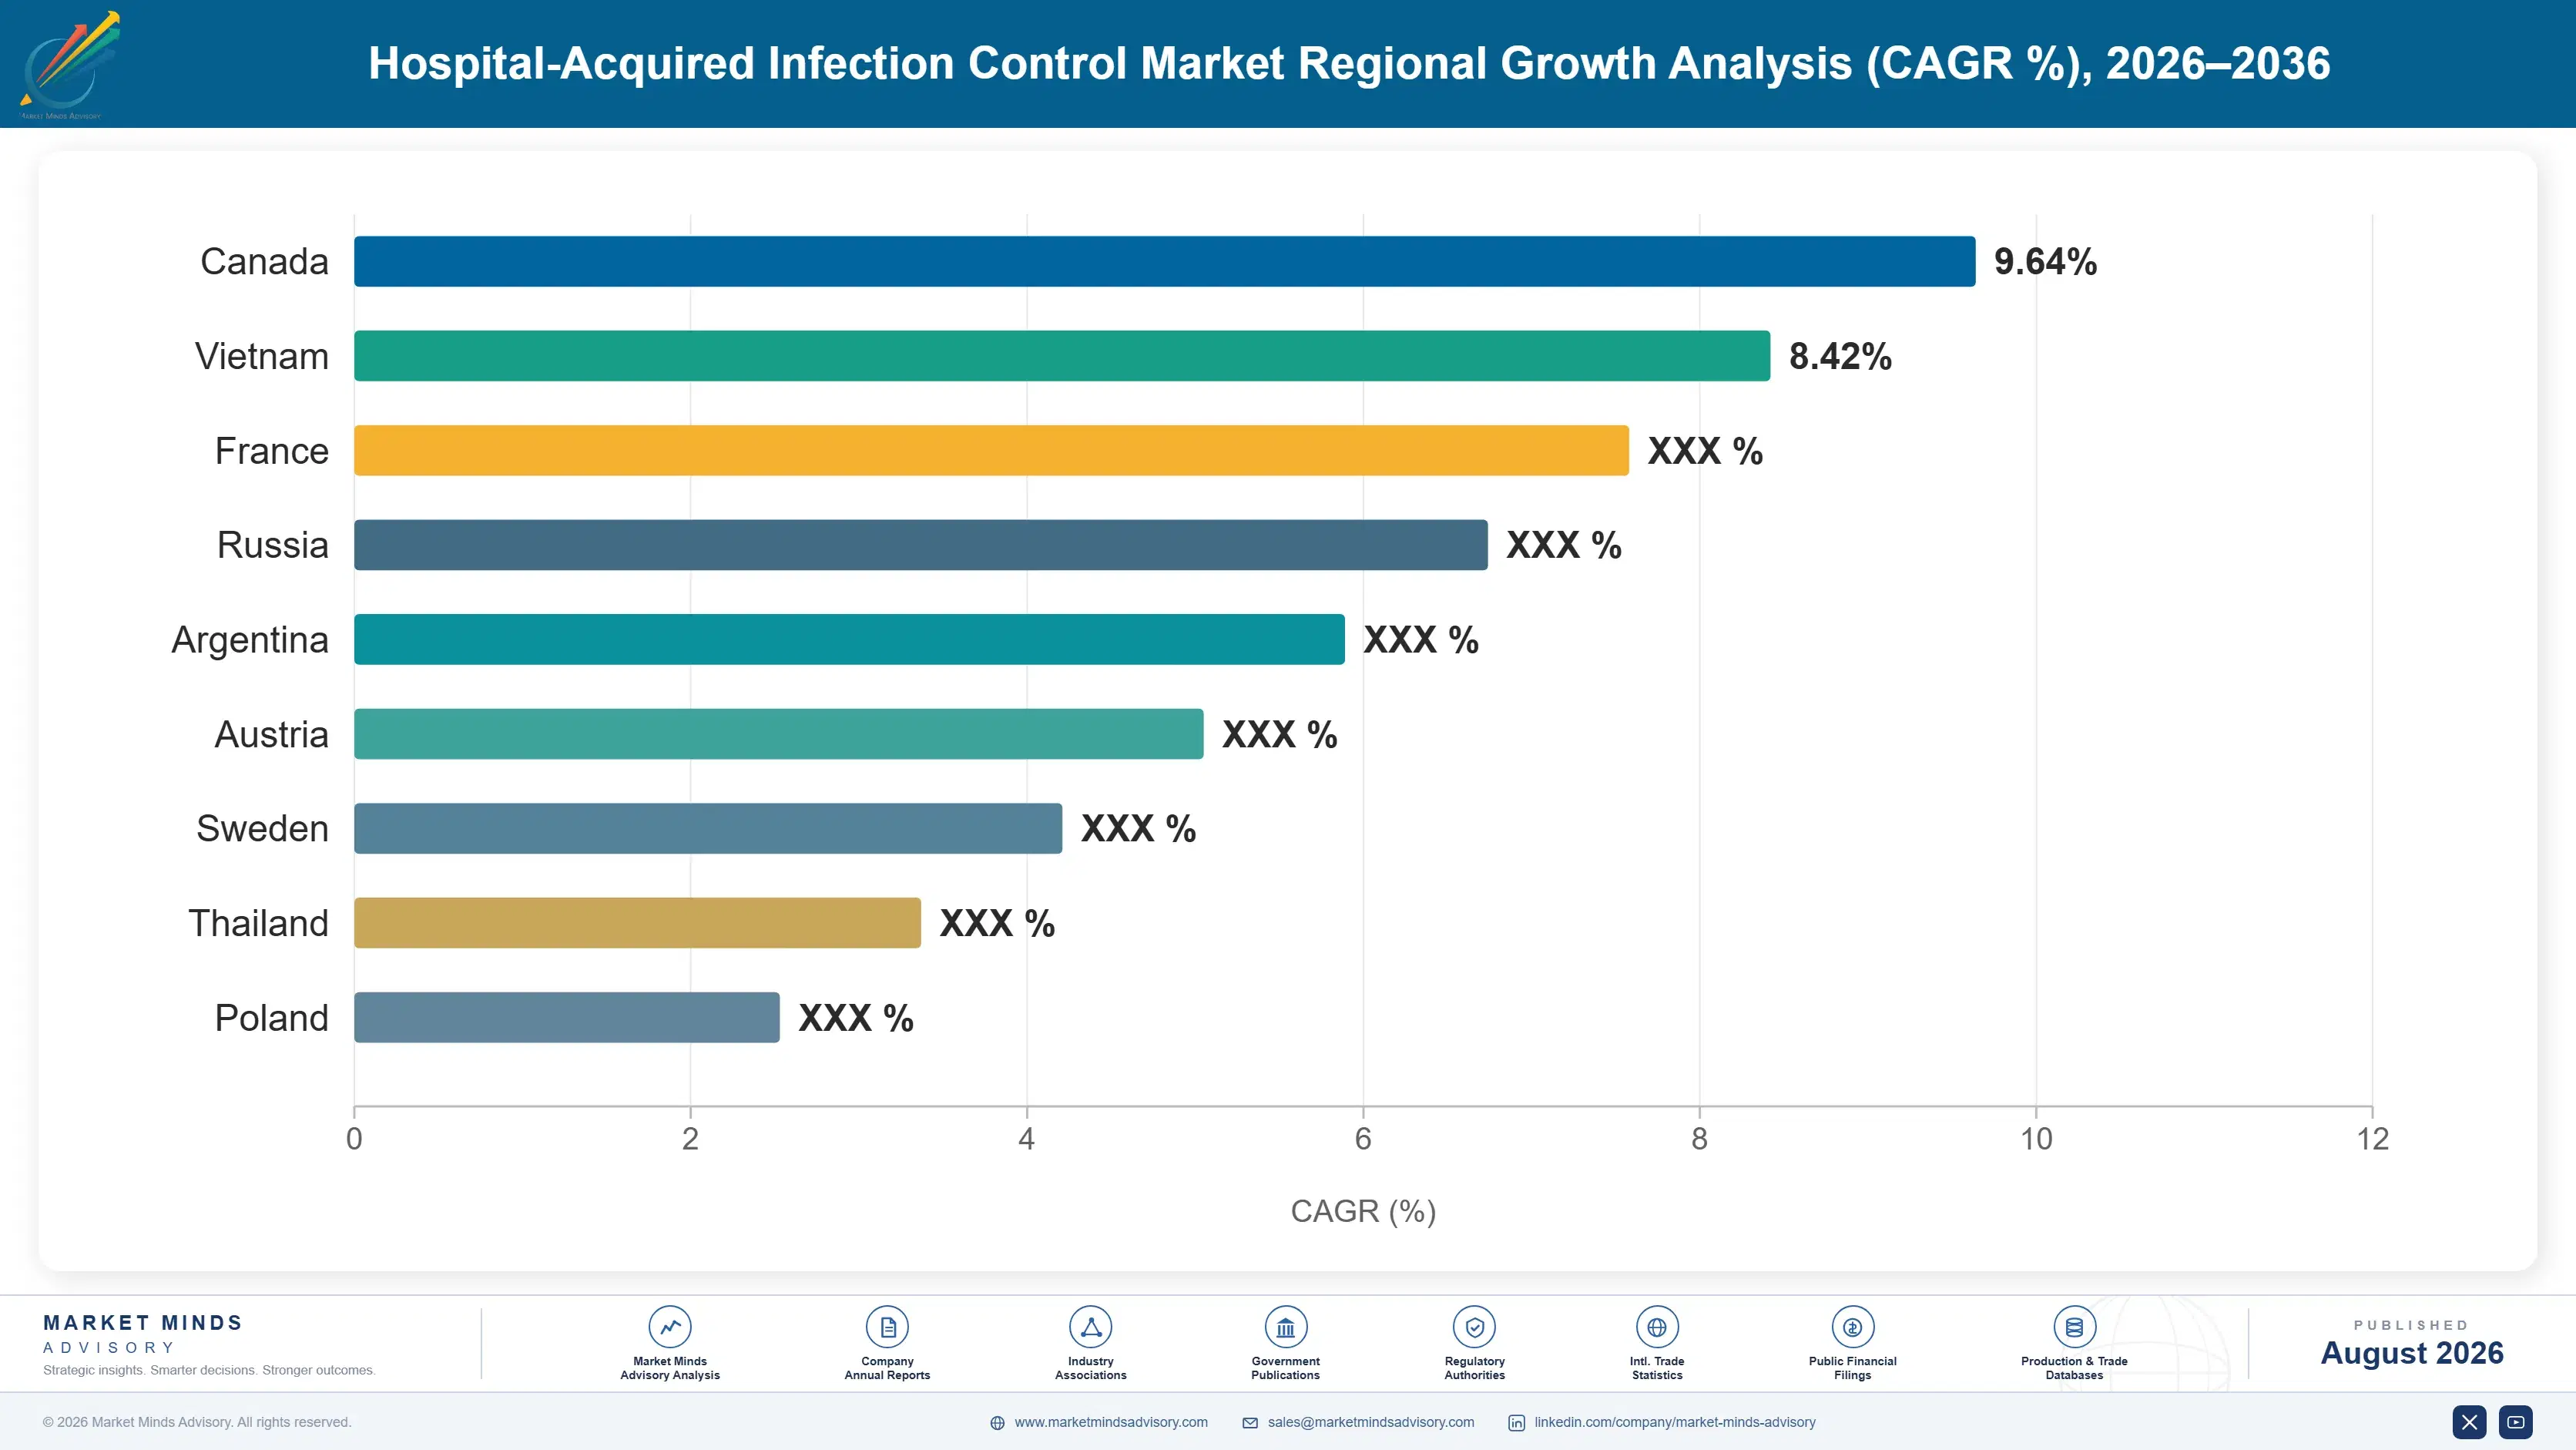
hospital-acquired-infection-control-market-country-cagr-analysis-1787297663234

Where Infection Control Suppliers Actually Earn

Selling a disinfectant against another disinfectant is a price conversation with a procurement officer who has forty suppliers in the category. Money comes from taking the human variable out of a protocol, from putting revenue behind an infection rate rather than a product claim, and from the consumables attached to equipment already installed in the building.

Contract Against Infection Rates, Not Product Claims

Procurement has heard every efficacy claim and discounts all of them, because laboratory kill data has never reliably predicted what happens on a ward. Outcome-linked contracts putting a portion of supplier revenue behind a measured infection rate change the conversation completely and reach the finance director who owns the penalty exposure. At roughly USD 14,000 an avoided episode the arithmetic works comfortably at a 20% to 30% price premium. Very few suppliers will accept that risk, which is exactly why it differentiates. Accepting downside risk is what makes the offer credible.
Market Impact: Outcome contracts support 20 to 30 percent premium

Automate The Step People Keep Getting Wrong

Manual terminal cleaning misses roughly half the surfaces it should cover and hand hygiene compliance sits near 40%, and fifty years of training has not moved either number much. Products that execute a validated cycle without depending on a person command capital budgets rather than consumable budgets, at USD 80,000 to USD 140,000 per room decontamination system. The argument is about human reliability under pressure, which every infection prevention team already accepts privately and few suppliers say out loud. Capital budgets are a different conversation from consumable ones. They are also considerably larger.
Market Impact: Systems cost 80,000 to 140,000 dollars per room

Own The Consumable Stream Behind Installed Equipment

A sterilisation autoclave or automated endoscope reprocessor runs for fifteen years and consumes chemistry, indicators, filters, and validation supplies continuously across that whole life. Those consumables recover 25% to 40% of equipment value annually at margins the capital sale never approaches. Third-party suppliers take a share wherever validation permits it, which makes protocol lock and warranty terms genuinely commercial decisions rather than technical ones. Suppliers pricing equipment to place it and earning afterwards do considerably better. Equipment margin is the smaller number by a wide margin. Third parties take the rest wherever validation allows it.
Market Impact: Consumables recover 25 to 40 percent every year

Who Controls the Margin Pool

Concentration is low at 34% across the top five measured on infection control revenue, because the category spans chemicals, capital equipment, disposables, and software with no supplier credible right across all of it. Ecolab leads through disinfection chemistry and hygiene programmes, STERIS through sterilisation equipment and services, and Solventum through barrier and monitoring products. Getinge and Advanced Sterilization Products hold strong sterile processing positions. Below them the fie
Competition currently turns on validated efficacy that survives procurement scepticism, on fitting into ward and sterile services workflow without adding any steps, and on whether a supplier will stand behind an infection rate. Price decides routine consumable business almost entirely on its own. Capital equipment decisions increasingly involve finance rather than only clinical staff.

Pressure comes from regional chemical and disposable manufacturers who supply the routine categories at prices global suppliers simply cannot match, and from the continued unwinding of pandemic purchasing. Rankings will shift toward suppliers who can demonstrate genuine infection rate reduction rather than laboratory efficacy, because that is the evidence finance directors are now asking for and very few of them can actually produce it.
hospital-acquired-infection-control-market-company-positioning-matrix-1787297663760

Competitive Moat and Risk Dimensions

ECOLAB

Moat: Programme delivery and account depth

Ecolab sells hygiene programmes rather than chemicals, embedding monitoring, training, and audit into an account so that the product becomes part of how a hospital runs rather than something it buys. Displacing that means unpicking a service relationship touching several departments at once, which procurement rarely attempts for the sake of a chemical price comparison.
ECOLAB

Risk: Chemistry commoditising underneath programmes

The underlying disinfectants are increasingly available from regional manufacturers at a fraction of the price, and sophisticated procurement teams have begun separating the programme from the chemistry to tender each independently. Where that unbundling succeeds the service wrapper has to justify itself alone, and it becomes considerably harder to defend on cost.
STERIS

Moat: Sterile processing installed base

STERIS holds a very large installed base of sterilisers, washers, and reprocessing equipment, each running fifteen years and consuming validated chemistry, indicators, and service throughout. Central sterile services departments are conservative for good reason, and revalidating a reprocessing protocol around different equipment is an exercise nobody undertakes without a compelling reason to.
STERIS

Risk: Capital cycles delay revenue recognition

Sterile processing equipment is bought against hospital capital budgets that get deferred whenever operating pressure builds, which makes revenue lumpy and exposed to conditions the company cannot influence. Consumables cushion that but do not eliminate it, and a deferred equipment cycle pushes the entire consumable annuity that follows it several years to the right.

Players Tracked

Prominent Players

Ecolab
STERIS
Solventum
Getinge
Advanced Sterilization Products

Other Key Players

Solenis
PDI
GOJO Industries
Metrex
Belimed
Matachana
Xenex Disinfection Services
Cardinal Health
Owens and Minor
Becton Dickinson
Baxter International
Sotera Health
Tuttnauer
Shinva Medical
MELAG

Recent Developments

FEBRUARY 2025

Health system tied supplier payment to measured infection rates

A hospital group signed an outcome-linked infection control contract that placed part of the supplier payment against measured infection rates across participating wards. Procurement had grown unwilling to pay premiums for laboratory efficacy claims that had never demonstrably translated into any change in ward-level outcomes.
Signal: Buyers have stopped paying for efficacy claims entirely and started paying for measured clinical outcomes instead.
AUGUST 2024

Regulator tightened duodenoscope reprocessing requirements

A regulator tightened the requirements for duodenoscope reprocessing following further transmission events involving resistant organisms, pushing hospitals toward single-use components and towards fully automated reprocessing systems instead. Manual cleaning of the elevator mechanism had repeatedly proved unreliable, regardless of how carefully any protocol was written.
Signal: Where manual cleaning cannot be made reliable, the regulators eventually mandate removing the manual step entirely.
NOVEMBER 2024

Hospital group standardised automated terminal decontamination

A hospital group standardised automated ultraviolet decontamination for terminal cleaning of isolation rooms after audits found manual cleaning covering roughly half the surfaces required. Room turnaround time rather than capital cost proved to be the binding operational constraint on how widely it could be deployed.
Signal: Audit data rather than any clinical argument is what finally moved capital budgets on terminal cleaning.

Actives, Resins, Packaging, And Energy

Active chemical ingredients carry roughly 24% to 32% of cost of goods across the disinfection categories, principally quaternary ammonium compounds, hydrogen peroxide, peracetic acid, and alcohols drawn from broad commodity chemical supply. Polymer resins for wipes, barriers, and packaging add 18% to 24%. Stainless steel and controls dominate the sterilisation equipment cost base, while energy for manufacturing and for sterilisation validation accounts for most of the remainder.
Alcohol, quaternary compound, and nonwoven substrate pricing all spiked through 2020 and 2021 as pandemic demand consumed available capacity, and several inputs remained elevated well into 2023. European Commission energy statistics record industrial electricity roughly doubling at the 2022 peak. Ecolab and STERIS both reported raw material, freight, and energy cost pressure across that period, and suppliers holding hospital contract pricing absorbed most of it before renegotiation.

Exposure divides by product category rather than by geography. Disinfectant manufacturers buy commodity chemicals with transparent pricing and reasonable substitution options between actives. Equipment manufacturers carry steel and electronics exposure on long-lead capital products quoted well before delivery. Disposable and barrier suppliers sit worst, since nonwoven substrate supply proved genuinely fragile under stress and there is limited scope to redesign around it.
hospital-acquired-infection-control-market-cost-volatility-analysis-1787297663957

Formulate across interchangeable active ingredient families

Registered disinfectant formulations are tied to specific actives, and a supplier registered on only one has no way to move when that active tightens. Maintaining registrations across several active families costs regulatory work upfront and preserves genuine purchasing choice afterwards. The obstacle is that each registration is separate and expensive, so most manufacturers register the minimum.

Index long-lead equipment quotations to steel benchmarks

Sterilisation equipment is quoted many months before delivery against a steel and electronics cost base that moves throughout. Index provisions tied to published benchmarks transfer that exposure to the buyer, and hospital procurement resists them until the alternative risk premium is quantified. Establishing the clause at tender is far easier than raising it later.

Qualify multiple nonwoven substrate suppliers in advance

Wipe and barrier substrate supply disappeared entirely under pandemic demand, and a converting line without substrate produces nothing at all. Qualifying alternative materials requires revalidating efficacy and physical performance on each one, which takes months. That work has to be finished before the next disruption rather than started during it. Most manufacturers discover the exposure only once it bites.

Portfolio Architecture for Margin Defence

Margin here tracks how much the buyer depends on the supplier being right. A wipe or a bottle of disinfectant is bought against dozens of alternatives on price alone, and the specification is easy for procurement to interpret. A validated sterilisation cycle, a reprocessing protocol, or an outcome-linked programme carries consequences the hospital cannot absorb if it fails, and pricing reflects the risk transferred rather than the input cost.
The volume tension is between consumable turnover and capital placement. Consumables are ordered continuously, fund the service organisation, and are the most contested part of the market on price. Capital equipment is lumpy, deferred whenever operating budgets tighten, and it places the installed base that consumables then attach to for fifteen years. Neither half of this business functions properly without the other.

High-value pools sit in three places. Automated decontamination that removes the compliance variable altogether, endoscope reprocessing where regulatory pressure has removed the option of doing it manually, and outcome-linked contracting that puts supplier revenue behind an infection rate. All three earn well because the hospital is buying certainty rather than buying any particular product.

Volume / Commodity-Adjacent Tier

Routine disinfectants, wipes, hand hygiene consumables, and protective barrier products bought against extensive alternatives. The range reflects how differently branded programme supply and regional commodity manufacture carry an equivalent product.
Gross Margin: 24-34%

Premium / Certified Tier

Sterilisation equipment, validated chemistry and indicators, and hygiene programmes with monitoring and audit attached to them. Validation, service, and the consequences of failure sustain the margin here rather than any difference in input cost.
Gross Margin: 38-50%

Sustainability / Regulatory / Next-Generation Tier

Automated room decontamination, endoscope reprocessing systems with traceability, and outcome-linked infection reduction contracts. The wide range reflects genuinely different economics between capital systems and revenue placed at risk against measured results.
Gross Margin: 46-62%
hospital-acquired-infection-control-market-portfolio-architecture-1787297664464

High-value Sub-segments and Strategic Watch-out

Automated Room Decontamination

Growing at 9.9% because it removes the compliance variable that fifty years of training has failed to fix. Sold against audit data showing manual cleaning missing half the surfaces, which is an argument procurement finds unusually hard to dismiss. Capital budgets rather than consumable budgets fund it.
Gross Margin: 48-62%

Endoscope Reprocessing And Traceability

Regulatory pressure following transmission outbreaks has progressively removed the option of relying on manual cleaning for complex scopes. Consumables, single-use components, and traceability all attach to an installed base with a very long working life. Transmission outbreaks removed the option of doing this manually. Traceability requirements keep tightening.
Gross Margin: 44-58%

Routine Disinfectants And Consumables

The volume base of this market and the most contested part of it, bought against dozens of alternatives on price alone. It funds the service organisation and the account relationships through which everything else eventually gets sold. It is contested every tender and impossible to abandon.
Gross Margin: 24-34%

Outcome-Linked Contracting

Placing supplier revenue behind a measured infection rate reaches the finance director who owns the penalty exposure directly. The watch-out is real downside risk, since ward-level outcomes depend on many things a supplier does not control. Very few competitors will accept that downside at all.
Gross Margin: 42-60%

What Keeps The Hospital Reordering

Infection control is a permanent operating expense rather than a project, which makes it one of the more predictable annuities in healthcare supply. Disinfectants, wipes, hand hygiene product, sterilisation chemistry, and indicators are consumed daily and reordered without any decision being made. Capital equipment installed today generates a consumable stream for fifteen years afterwards, which is where suppliers who price the machine to place it end up considerably ahead.
Stickiness varies by how much validation sits behind the product. A validated sterilisation cycle or reprocessing protocol is genuinely difficult to change, because revalidation means documentation, testing, and a period where the department carries risk for no benefit. Routine disinfectants and wipes are the opposite and move at every tender on price. Hygiene programmes sit between the two, sticky until somebody unbundles them.

Buyer profiles have moved upward and split apart. Consumables are bought by procurement against a category budget with dozens of suppliers to compare. Capital equipment involves sterile services management and increasingly finance. Outcome-linked contracts and penalty-driven investment reach the chief financial officer directly. Suppliers organised around the infection prevention team alone are talking to the person with the least budget authority in the chain.
hospital-acquired-infection-control-market-end-use-penetration-index-1787297664958

Where To Compete Here

These are among the four positions where our research anticipates prominent divergence between winners and laggards over the coming forecast period. Each is grounded in the demand model, the regulatory perimeter, and the announced capacity pipeline.
01 / OUTCOME RISK ACCEPTANCE

Put revenue behind the infection rate

Procurement has heard every laboratory efficacy claim in this category and discounts all of them, because kill data on a test coupon has never reliably predicted anything that happens on a ward. Contracts placing part of supplier revenue against a measured infection rate reach the finance director who owns the penalty exposure and change the entire basis of comparison. At roughly fourteen thousand dollars an avoided episode the arithmetic supports a substantial premium, and almost no competitor will accept that risk.
02 / COMPLIANCE REMOVAL DESIGN

Automate what people keep getting wrong

Hand hygiene compliance sits near 40% and manual terminal cleaning misses roughly half the surfaces it is supposed to cover, and fifty years of training has moved neither number very far at all. Products executing a validated cycle without depending on a tired person reach capital budgets rather than consumable budgets and command prices accordingly. Every infection prevention team already accepts all of this privately, and suppliers willing to make the argument explicitly meet far less resistance than they had expected.
03 / INSTALLED BASE MONETISATION

Place the machine, earn on the chemistry

A steriliser or automated reprocessor runs for fifteen years and consumes validated chemistry, indicators, filters, and service continuously across the whole of that working life. Those consumables recover somewhere between a quarter and two fifths of equipment value every single year, at margins the capital sale itself never comes close to approaching. Suppliers defending equipment margin at the expense of new placements are protecting much the smaller number, while third-party consumable suppliers take the larger one wherever validation terms permit them to.
04 / PROGRAMME UNBUNDLING DEFENCE

Make the service worth its own price

Procurement teams have now started tendering disinfection chemistry separately from the hygiene programmes historically bundled around it, which exposes exactly how much of the programme price was being carried by commodity chemicals all along. Suppliers whose service wrapper cannot justify itself standing entirely alone will lose the chemistry first and then lose the programme shortly afterwards. Building monitoring, audit, and outcome reporting that a hospital would genuinely pay for on its own terms is the only durable answer available here.

Engagement Snapshot From the Field

A live engagement with an industry participant carrying material or product regulatory and market exposure ahead of a defining policy shift, showing how our research translates into a defensible multi-year portfolio strategy.
MARKET MINDS ADVISORY · CLIENT ENGAGEMENT SUMMARY
Hospital-Acquired Infection Control Producer Strategic Portfolio Review and Transition Roadmap 2026·Investment Scenario on Hospital-Acquired Infection Control Exposure Evaluation 2025-26
CLIENT PROFILE
An acute hospital group operating eleven separate sites with roughly 4,200 beds and annual infection control spend near USD 38 million (client-reported, unverified by MMA). Reported healthcare-associated infection rates varied by more than a factor of three across the group, despite broadly identical protocols, product ranges, and training programmes at every one of the sites.
STRATEGIC CHALLENGE
Executive pressure to reduce infection rates had produced repeated rounds of additional product purchasing, none of which had moved the group average at all. Management needed to understand whether the variation between sites was explained by anything they were buying, or by something else entirely that further procurement would never address.
MMA APPROACH
MMA compared the eleven sites on product usage, protocol compliance measured by direct observation, staffing ratios, bed occupancy, and environmental audit results. Infection rates were then regressed against each of those factors. Automated decontamination deployment was then modelled against the sites where compliance rather than product access explained the shortfall.
KEY FINDINGS
  1. Product range and spend per bed showed no relationship whatever to infection rates across any of the eleven sites examined (client-reported, unverified by MMA).
  2. Observed hand hygiene compliance ranged from 28% to 71% between sites and correlated strongly with infection rate, explaining most of the variation.
  3. Bed occupancy above 90% predicted both lower compliance and higher infection rates, and four of the sites operated above that level continuously.
  4. Environmental audit scores at the three worst sites showed manual terminal cleaning missing over half the required surfaces despite adequate staffing on paper.
CLIENT PROFILE
An acute hospital group operating eleven separate sites with roughly 4,200 beds and annual infection control spend near USD 38 million (client-reported, unverified by MMA). Reported healthcare-associated infection rates varied by more than a factor of three across the group, despite broadly identical protocols, product ranges, and training programmes at every one of the sites.
STRATEGIC CHALLENGE
Executive pressure to reduce infection rates had produced repeated rounds of additional product purchasing, none of which had moved the group average at all. Management needed to understand whether the variation between sites was explained by anything they were buying, or by something else entirely that further procurement would never address.
MMA APPROACH
MMA compared the eleven sites on product usage, protocol compliance measured by direct observation, staffing ratios, bed occupancy, and environmental audit results. Infection rates were then regressed against each of those factors. Automated decontamination deployment was then modelled against the sites where compliance rather than product access explained the shortfall.
KEY FINDINGS
  1. Product range and spend per bed showed no relationship whatever to infection rates across any of the eleven sites examined (client-reported, unverified by MMA).
  2. Observed hand hygiene compliance ranged from 28% to 71% between sites and correlated strongly with infection rate, explaining most of the variation.
  3. Bed occupancy above 90% predicted both lower compliance and higher infection rates, and four of the sites operated above that level continuously.
  4. Environmental audit scores at the three worst sites showed manual terminal cleaning missing over half the required surfaces despite adequate staffing on paper.
RECOMMENDED STRATEGY
Phase 1: Phase one: stop buying additional products at the underperforming sites, since spend per bed was demonstrably unrelated to the outcome being targeted. Phase 2: Phase two: deploy automated terminal decontamination at those high occupancy sites where compliance under sustained pressure was the measured constraint. Phase 3: Phase three: report compliance observation rather than product spend to the executive, so the conversation moves to the variable that actually predicts outcomes.
OUTCOME
The group halted incremental product purchasing and deployed automated decontamination at its four highest occupancy sites, reporting group average infection rates falling roughly 22% within eighteen months on lower total product spend (client-reported, unverified by MMA). Executive reporting moved to observed compliance, and site variation narrowed considerably over the same period.

Frequently Asked Questions

Foundational context covering the market sizes, CAGR, scope, country, region and competition that inform every finding below. This section is provided to cover basics and most often pre-purchase conversations, answered from the MMA Primary Research Dataset.

What is the current size of the Hospital-Acquired Infection Control Market?

The market reached USD 22.8 billion in 2025 and is forecast at USD 24.30 billion for 2026. Spending follows acute care capacity and regulatory pressure rather than infection burden itself.

How large will the Hospital-Acquired Infection Control Market be by 2036?

MMA forecasts USD 46.05 billion by 2036, an increase of USD 21.75 billion over 2026. That represents an expansion multiple of 1.89 times across the forecast period.

What is the CAGR for the Hospital-Acquired Infection Control Market 2026 to 2036?

The base case CAGR is 6.6%, with a bull case at 7.8% and a bear case at 5.4%. The bear case reflects continued unwinding of pandemic-era purchasing across several product categories.

Which segment is growing fastest?

Automated room and surface decontamination grows fastest at 9.9%, exactly 1.50 times the market rate. It is the one intervention that does not depend on anybody remembering to perform it correctly.

Who are the major companies in the Hospital-Acquired Infection Control Market?

Ecolab, STERIS, Solventum, Getinge, and Advanced Sterilization Products lead the market. The top five hold roughly 34% of revenue, which is low because the category spans chemicals, equipment, disposables, and software.

Which country is growing fastest?

India grows fastest at 9.8%, driven by private hospital expansion where accreditation requires documented infection control programmes. New acute capacity is being built with infection control designed in rather than retrofitted.

Report Segmentation Architecture

The full report scope spans multiple orthogonal segmentation dimensions, with cross-tabulated demand data provided for each dimension pair. Coverage extends further to regional breakdowns, trend trajectories, and the competitive detail needed to support segment-level decision-making.

By Control Method

  • Automated Room and Surface Decontamination
  • Endoscope Reprocessing Systems
  • Sterilisation Equipment and Consumables
  • Disinfectants and Antiseptics
  • Protective Barriers and Hand Hygiene

By End-Use Industry

  • Acute Care Hospitals
  • Ambulatory Surgical Centres
  • Long-Term Care Facilities
  • Diagnostic and Endoscopy Units
  • Dental and Outpatient Clinics

By Commercial Dimension

  • Group Purchasing Organisation Contracts
  • Direct Hospital Supply
  • Hygiene Programme Service Contracts
  • Outcome-Linked Agreements
  • Distributor and Wholesaler Channel

By Region

  • East Asia
  • South Asia and Pacific
  • North America
  • Western Europe
  • Latin America
  • Middle East and Africa
  • Eastern Europe

Scope, Methodology, and Coverage

Every figure in this report is reproducible from documented input assumptions. The scope below maps the historical period, the forecast horizon, the segmentation dimensions, and the countries covered, alongside the underlying primary and qualitative methodology.
Historical Period
2020 to 2025
Forecast Period
2026 to 2036
Base Year
2025 (USD billions; MMA Primary Research Dataset, August 2026)
Market Definition
The hospital-acquired infection control market comprises products, equipment, and services used to prevent healthcare-associated infection within clinical environments, valued at supplier selling prices to hospitals, ambulatory surgical centres, long-term care facilities, endoscopy units, and outpatient clinics. It spans automated room and surface decontamination systems, endoscope reprocessing equipment and consumables, sterilisation equipment with validated chemistry and indicators, disinfectants and antiseptics, protective barriers and hand hygiene systems, together with the hygiene programme services, monitoring, audit, and surveillance software supplied alongside them. Therapeutic antibiotics, antifungals and antivirals, diagnostic microbiology and surveillance testing, implants and devices with integral antimicrobial coatings, general facility cleaning outside clinical areas, laundry services, and clinical waste collection and disposal are excluded.
Quantitative Units
USD billions (current prices); volume in consumable units and systems installed
Segmentation Dimensions
By Control Method; By End-Use Industry; By Commercial Dimension; By Region
Regions Covered
East Asia, South Asia and Pacific, North America, Western Europe, Latin America, Middle East and Africa, Eastern Europe
Countries Covered
China, Japan, South Korea, Taiwan, India, Australia, Singapore, Indonesia, Thailand, Malaysia, Vietnam, USA, Canada, Mexico, Brazil, Argentina, Colombia, Chile, Germany, France, UK, Netherlands, Sweden, Denmark, Italy, Spain, Switzerland, Poland, Romania, Greece, Czechia, Hungary, Saudi Arabia, United Arab Emirates, Qatar, Egypt, South Africa, Nigeria, Kenya, and additional markets relevant to this sector
Key Companies Profiled
Ecolab, STERIS, Solventum, Getinge, Advanced Sterilization Products, Solenis, PDI, GOJO Industries, Metrex, Belimed, Matachana, Xenex Disinfection Services, Cardinal Health, Owens and Minor, Becton Dickinson, Baxter International, Sotera Health, Tuttnauer, Shinva Medical, MELAG
Quantitative Methodology
Primary survey, n=3,800 respondents, Q4 2025, six countries; demand-side model with trade association cross-validation
Qualitative Methodology
47 expert interviews, Q4 2025; applied to validate demand model assumptions, identify emerging dynamics, and assess competitive positioning
Report Format
PDF and XLSX data workbook (Word format preview document)
Publisher
Market Minds Advisory
Report Code
MMA-2026-HLT-708
Published
August 2026
Contact
sales@marketmindsadvisory.com | www.marketmindsadvisory.com

Purchase the full Hospital-Acquired Infection Control Market Report (2026 to 2036).

The full report examines hospital-acquired infection control demand across seven regions and five control methods, with particular attention to why compliance rather than product availability limits infection reduction almost everywhere. It quantifies the gap between laboratory efficacy claims and measured ward outcomes, and models where automated intervention pays for itself against penalty exposure. Competitive analysis covers twenty participants assessed on infection control revenue, including where procurement unbundling is exposing service pricing built on commodity chemistry. Regional chapters map acute capacity and regulatory pressure against infection burden separately.
Seven-region capacity and regulatory pressure analysis
Five control method segmentation with growth rates
Twenty participant competitive assessment and channel positioning
Compliance measurement against infection rate correlation
Outcome-linked contracting economics and risk modelling
Installed equipment consumable annuity benchmarking by category

Built For The People Who Decide

From boardroom strategy to bench-side execution, this report is read cover-to-cover by leaders shaping the next decade of their industry, turning demand scenarios, market dynamics and valuation benchmarks into decisions.
CXOs/ Presidents/ VPs/ Managers
M&A and Corporate Development
Strategy Teams and R&D Heads
Procurement and Product Directors
Regulatory and Compliance Leaders
Investor Relations and Equity Analysts