Market Minds Advisory
Hops Market Share Analysis

Hops Market Share Analysis: Hops Market Share Analysis. Craft Beer Correction, Lupulin Products, and Climate Pressure Reshape Supplier Positions.

Hops supply is being reshaped by a craft beer slowdown, demand for lupulin concentrates and non-alcoholic beer, and hotter growing seasons, while long contracts and processing capacity decide who keeps position with global brewers.

Lead Analyst

Published

September 2026

Make Smarter Decisions with Customized Research Insights

Request a free sample report and evaluate market opportunities, growth trends, and competitive dynamics relevant to your business needs.

2025 MARKET VALUE$3.4BMarket Size 2025
2036 FORECAST VALUE$5.3BBase Case , 2026 to 2036
CAGR 2026 TO 20364.2 %Bull 5.5% / Bear 2.9%
INCREMENTAL OPPORTUNITY$1.8BNet 10- year value creation
EXPANSION MULTIPLE1.51x2036 value over 2026 base
Strategic Levers
M&A Pipeline
Regional Outlook
Country Rankings
Competitive Intelligence
Segmental Deep-dive
Call-Us : 91 93563 13602

Executive Snapshot and Market Trajectory.

Hops is a small crop that punches far above its acreage. A few hundred grams per hectoliter of beer set aroma and bitterness, and brewers contract years ahead. After a craft boom that ended in oversupply, the industry is resetting around concentrated products and climate risk.
Lupulin-enriched products and hop oils are growing fastest, helped by dry-hopped and non-alcoholic beer styles, while pellets anchor volume. Western Europe holds the largest share because Germany's Hallertau and the Czech Republic supply most aroma and bittering hops and host leading processors, and North America follows through Yakima Valley production and the largest craft segment. Australia and New Zealand add counter-seasonal aroma supply, and Asian brewers sign long contracts for premium varieties from Europe.
The competitive field is concentrated. A handful of merchants and processors, including Barth-Haas, Hopsteiner, and Yakima Chief Hops, control most trade, while family growers hold acreage and sell under contract. Advantage comes from variety portfolios, extraction and pelletizing capacity, and long brewer relationships rather than price. Regulation and sustainability rules add pressure on water, pesticides, and traceability. Buyers reward documented variety identity, consistent oil content, and reliable delivery.
Market Definition
Hops comprise the dried cones of the hop plant, Humulus lupulus, and products derived from them, including pellets, whole cones, CO2 and isomerized extracts, lupulin-enriched pellets, and hop oils, sold to breweries, non-alcoholic beverage makers, and non-brewing users. The scope excludes malted barley, brewer's yeast, finished beer and beverages, hop shoots sold as vegetables, and hop-based medicinal or cosmetic finished products.
Base Year Value
$3.4B in 2025 (MMA Primary Research Dataset, September 2026)
Forecast Period
2026 to 2036, eleven discrete annual values
CAGR
4.2% base case. Bull 5.5%. Bear 2.9%.
Fastest Growth Segment
Lupulin-Enriched Hop Products: 9.0% CAGR
Fastest Growth Country
China: 6.2% CAGR
Fastest Growth Region
South Asia and Pacific: 6.3% CAGR
Largest Region
Western Europe: 30% of 2025 global value
Market Leaders
Barth-Haas Group, Hopsteiner, Yakima Chief Hops, HVG, Crosby Hop Farm. Source: MMA Analysis, company annual reports.
Primary Survey
n=3,800 procurement and R&D decision-makers, Q4 2025, six countries
Methodology
Demand-side build-up, cross-validated against public data, 47 expert interviews

Hops Market Forecast Scenarios

hops-market-share-analysis-size-forecast-scenario-1789757416591
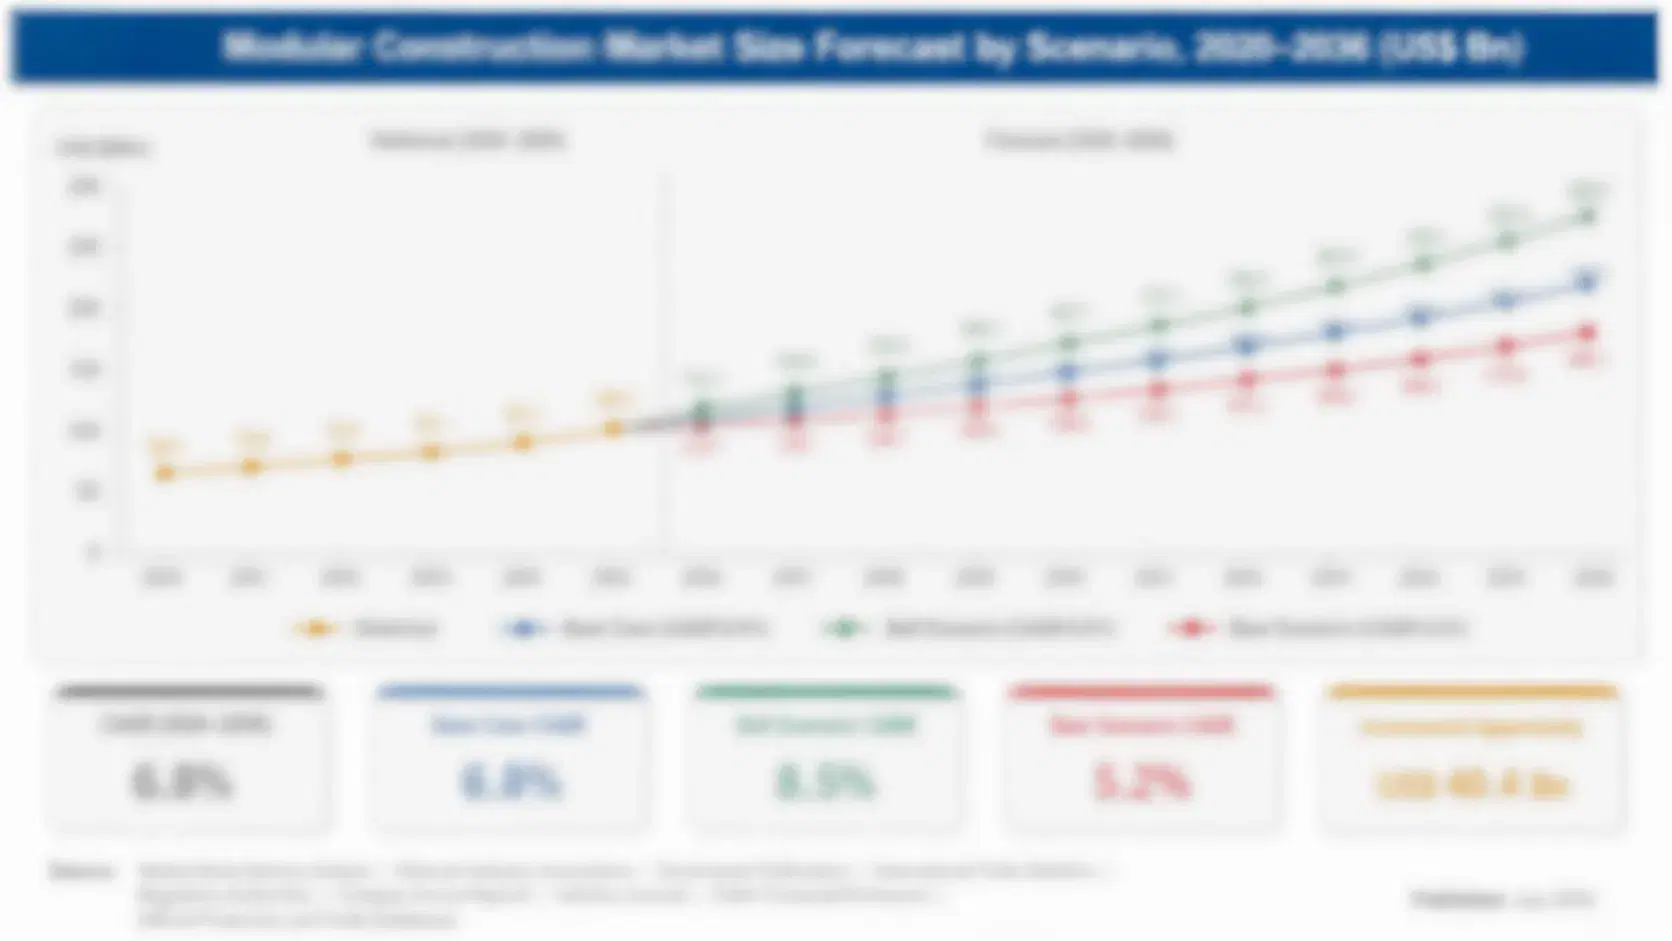
Between 2020 and 2025, hops grew slowly as the craft beer boom peaked, brewers cut hop use per barrel, and stockpiles built after years of expanded acreage. Growth averaged 3.6% a year, with lupulin-enriched products and extracts outpacing whole cone and standard pellets, while drought and heat in Europe in 2022 and 2023 cut yields and lifted prices for some aroma varieties.
The base case assumes 4.2% annual growth through 2036, built on three named mechanisms: rising use of lupulin concentrates and oils that let brewers deliver more aroma per unit of plant material, expanding non-alcoholic and low-alcohol beer where hop flavor carries more weight, and steady growth in Asia, where beer premiumization and craft styles are spreading. Acreage rationalization in the United States restores balance between supply and demand. Each mechanism reinforces the others.
The bull case, at 5.5%, needs faster growth in non-alcoholic beer and hop-forward styles alongside stable harvests. The bear case, at 2.9%, reflects prolonged beer volume decline in mature markets, further hop stock overhang, and substitution toward artificial or synthetic flavor systems in cost-driven brewing. Either scenario leaves the underlying demand base intact, though pricing and mix would differ noticeably from the base path.

Contract Coverage and Processing Capacity Decide Hop Positions

Hops are grown on tall trellises, harvested in late summer, dried in kilns, and processed into pellets, extracts, or whole cones. Alpha acids deliver bitterness, while essential oils deliver aroma. Varieties are protected and geographically tied, so brewers specify origin. Because plants take three years to reach full yield, acreage decisions lag demand and create booms and stock overhangs. Quality is set in the field.
MARKET CONCENTRATION46% CR5Top five merchants control nearly half of global trade
AVERAGE SELLING PRICE$14 per kgAroma varieties sell well above bittering hop pellets
TOP PRODUCING COUNTRY34% shareGermany supplies about one third of world hops
ALPHA ACID CONTENT10%Typical modern hop varieties carry a modest bittering share
CONTRACT COVERAGE80%Most hop volume is sold under multi-year brewer contracts
ENERGY COST SHARE14% of COGSKilning and pelletizing consume substantial fuel and power
Buyers use hops in different ways. Large brewers buy bittering pellets and extracts for consistent, low-cost bitterness, craft brewers buy aroma varieties and lupulin products for dry hopping, non-alcoholic beer makers use hop oils and concentrates to build flavor, and a small non-brewing segment uses hop acids as natural antimicrobials and nutraceuticals. Specifications cover alpha content, oil profile, moisture, and pesticide residue.
The industry is concentrated in trade and fragmented in farming. Barth-Haas, Hopsteiner, and Yakima Chief Hops handle most volume, family growers in Germany, the United States, the Czech Republic, and Slovenia hold acreage, and contracts of three to five years underpin investment. Climate, water, and craft beer demand shape planting, and processors are adding lupulin and extract capacity to capture value.
"Brewers tend to describe hops as an agricultural commodity. The market behaves like a processing business with a farm attached. The suppliers that turn plant material into concentrates, oils, and consistent contracts are taking share from those that only sell cones."
Practice Lead, Agricultural Products and Brewing Ingredients Practice · MMA Agricultural Products and Brewing Ingredients Practice · September 2026

Market Trends

Lupulin Concentrates Replace Standard Pellets in Dry-Hopped Beer Styles

Brewers are shifting from whole pellets toward lupulin-enriched pellets and concentrated extracts, which deliver more oil and resin per kilogram, reduce vegetative matter, and cut beer loss and transport cost in dry hopping. Cryogenic processing separates lupulin glands from leaf, and suppliers report that brewers use 40% to 60% less material per barrel. Processors invest in cryo lines, and brewers sign multi-year agreements to secure limited concentrate capacity. Brewers also report cleaner tank cleanouts and less beer trapped in leaf matter, and large brewers run trials that compare yield and aroma across pellet types.
Market Impact: Asian premium beer growing 6% yearly
Non-Alcoholic Beer Growth Lifts Demand for Hop Oils and Isolates

Non-alcoholic and low-alcohol beer is growing quickly, and because alcohol carries flavor and body, brewers rely more heavily on hop oils, terpene isolates, and dry hopping to build taste. Growth rates in non-alcoholic beer run near double digits in the United States and Europe, and large brewers launch new lines. Hop suppliers develop flavor isolates and oil blends, and sales into this segment carry higher margins than bittering hops. Brewers report that dosing oils at the whirlpool and in dry hop tanks restores mouthfeel and aroma lost after dealcoholization, and suppliers offer trial kits.
Market Impact: non-brewing volume under 3% of total

Market Opportunities and Growth Drivers

Asian Premium Beer Growth Raises Hop Inclusion and Import Volume

Asian beer markets are premiumizing, and China, Japan, Vietnam, and Thailand are seeing growth in craft and imported styles that use more aroma hops. Large regional brewers such as China Resources Beer and Asahi add hoppier lines, and brewpubs in major cities test new varieties. Higher-priced beer carries higher hop inclusion rates per hectoliter, and multi-year import contracts give suppliers volume visibility in a region where barley and hop supply are limited. Vietnam and Thailand are adding brewery capacity, and imported hops travel by sea in six to eight weeks, so brewers plan orders early.
Market Impact: US acreage down 12% since peak

Non-Brewing Uses of Hop Acids Open Higher-Margin Natural Preservative Demand

Hop acids also show antimicrobial and health-related properties, and food, feed, and nutraceutical makers are testing them as natural alternatives to synthetic preservatives and antibiotics in livestock. Beta acids protect against gram-positive bacteria, and ethanol producers use them to replace antibiotics in fermentation. Volumes remain small, but margins are high, and the segment diversifies hop revenue beyond a beer market with flat volume in mature countries. Regulators in several countries review hop acids as feed additives, and if approvals arrive, poultry and swine producers seeking antibiotic alternatives could create volume that dwarfs today's non-brewing demand.
Market Impact: Hallertau yields fell up to 20%

Market Restraints and Challenges

Craft Beer Decline Creates Hop Stock Overhang and Acreage Cuts

Craft beer volume in the United States has declined since 2022, and brewers cut hop purchases, leaving growers and merchants with unsold stock and pushing acreage down, according to USDA National Agricultural Statistics Service hop reports. The root cause is market saturation, price inflation, and shifting consumer tastes. Contract cancellations hurt smaller growers. Mitigation includes acreage rationalization, diversified products, and shifting sales to Asia and non-alcoholic segments. Several growers ripped out plants rather than replant, and merchants reported contract volumes below 2021 levels, so surplus varieties sat in cold storage for more than a year.
Market Impact: brewers use 40-60% less material

Heat and Drought Cut European Hop Yields and Alpha Content

Hop yields fell sharply in Europe during the hot, dry summers of 2018 and 2022, with Hallertau yields down as much as 20% in some years, according to German hop grower association data. The root cause is heat stress, water shortage, and disease pressure on shallow-rooted plants. Lower yields raise costs and reduce alpha content. Mitigation includes drought-tolerant varieties, drip irrigation, and shifting acreage to cooler regions. Shallow roots make hop bines sensitive to water stress, and high temperatures reduce alpha acid formation, so brewers must buy more material to reach target bitterness.
Market Impact: non-alcoholic beer volume up 10% annually
3 additional market trends, 4 additional growth drivers, and 3 additional restraints and challenges are covered in the full report. Contact sales@marketmindsadvisory.com to access the complete intelligence.

Segment CAGR and Growth Architecture

Hops are segmented by product form, because processing depth, oil and resin concentration, and shelf life determine price, brewer usage rates, and buyer type more directly than variety or origin does. Lupulin-enriched products attract the most new investment as brewers convert efficiency and flavor claims into multi-year purchase specifications and suppliers add cryogenic capacity.
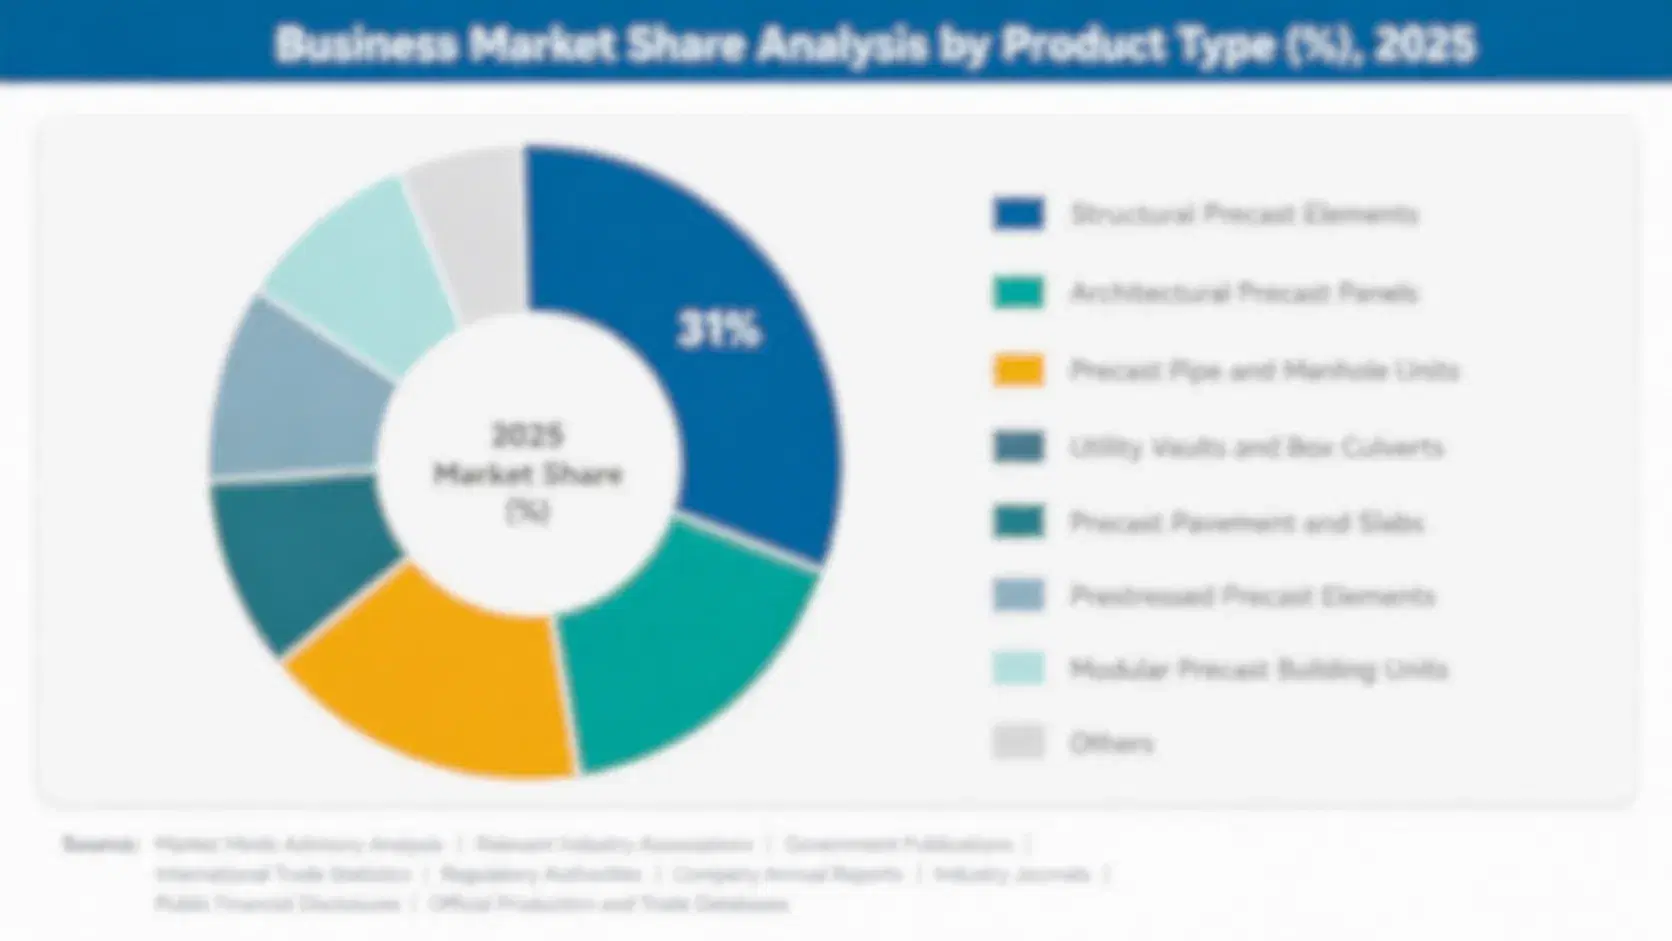
hops-market-share-analysis-market-share-analysis-1789757416877

Lupulin-Enriched Hop Products

Lupulin-enriched hop products are the fastest-growing segment, made by cryogenic or mechanical separation of lupulin glands from leaf, then pelletizing the concentrated fraction. Brewers pay premiums of 40% to 80% per kilogram because the product delivers two to three times the oil and resin of standard pellets and reduces waste. Processing capacity is limited and patents apply, so suppliers such as Yakima Chief Hops hold strong positions and sign multi-year brewer agreements. Yakima Chief Hops holds key patents on its process, and competitors have launched similar lines, so brewers benchmark product quality and price, while the first movers with strong sensory data retain most large accounts even as new capacity arrives from German and Czech processors.
CAGR 9.0%

Hop Oils and Terpene Isolates

Hop oils and terpene isolates are the second-fastest segment, produced by steam distillation or CO2 extraction and sold to brewers for controlled aroma dosing, especially in non-alcoholic and low-alcohol beer. Oils allow consistent flavor across batches, cut solid waste, and can be dosed in small quantities. Prices per kilogram are very high, and volumes are small, so suppliers with distillation capacity and flavor science, such as Kalsec and Barth-Haas, lead. Dosing is precise, so a few grams can flavor an entire batch, and brewers value consistency when scaling recipes across plants. Terpene isolates such as linalool and geraniol can be added to boost citrus and floral notes, though cost per liter is high and regulatory acceptance of isolates differs.
CAGR 7.6%
Full segment breakdown across 6 segments available in the complete report.

Regional Architecture and Country Demand Map

Hop value follows farmland, processing capacity, and brewing culture. Western Europe leads through German and Czech acreage and merchant control, North America follows through Yakima Valley supply and the craft segment, and China is the fastest-growing market as premium beer spreads in Asia. Australia adds niche aroma supply.

North America

North America holds 28% share, led by the United States, where Washington's Yakima Valley, Oregon's Willamette Valley, and Idaho grow most aroma hops and Yakima Chief Hops, Hopunion, and John I. Haas run processing. The craft segment is the largest in the world, though it has declined since 2022, and growers adjust acreage. Non-alcoholic beer and lupulin products offer growth, while water availability and labor cost shape planting decisions each season. Oregon and Idaho growers add volume, and family farms in Washington hold long contracts with Yakima Chief Hops and Hopunion. Acreage fell about 12% from its peak as craft brewers cut purchases, so growers now emphasize concentrate-ready varieties, and water rights shape margins.
Share: 28% | CAGR: 4.7% (2026 to 2036)

Western Europe

Western Europe holds 30% share, above its usual band, because Germany's Hallertau produces about one third of global hops, and Germany, the United Kingdom, Slovenia-adjacent Austria, and France host leading merchants and processors such as Barth-Haas and Hopsteiner in Nuremberg and Mainburg. Value sits where farms, processing, and brewers meet, so the region leads on scale and trade control in commercial terms. Climate stress and brewing volume declines add pressure. Hallertau growers supply German lager brewers and export aroma hops worldwide, while English, French, and Belgian growers add specialty varieties. Merchants in Nuremberg and Mainburg control large shares of trade, and energy costs and dry summers push processors to invest in irrigation and heat recovery, which raises capital intensity.
Share: 30% | CAGR: 2.7% (2026 to 2036)
Regional intelligence for 5 additional markets available in the complete report: East Asia, South Asia and Pacific, Latin America, Middle East and Africa, Eastern Europe. Contact sales@marketmindsadvisory.com.
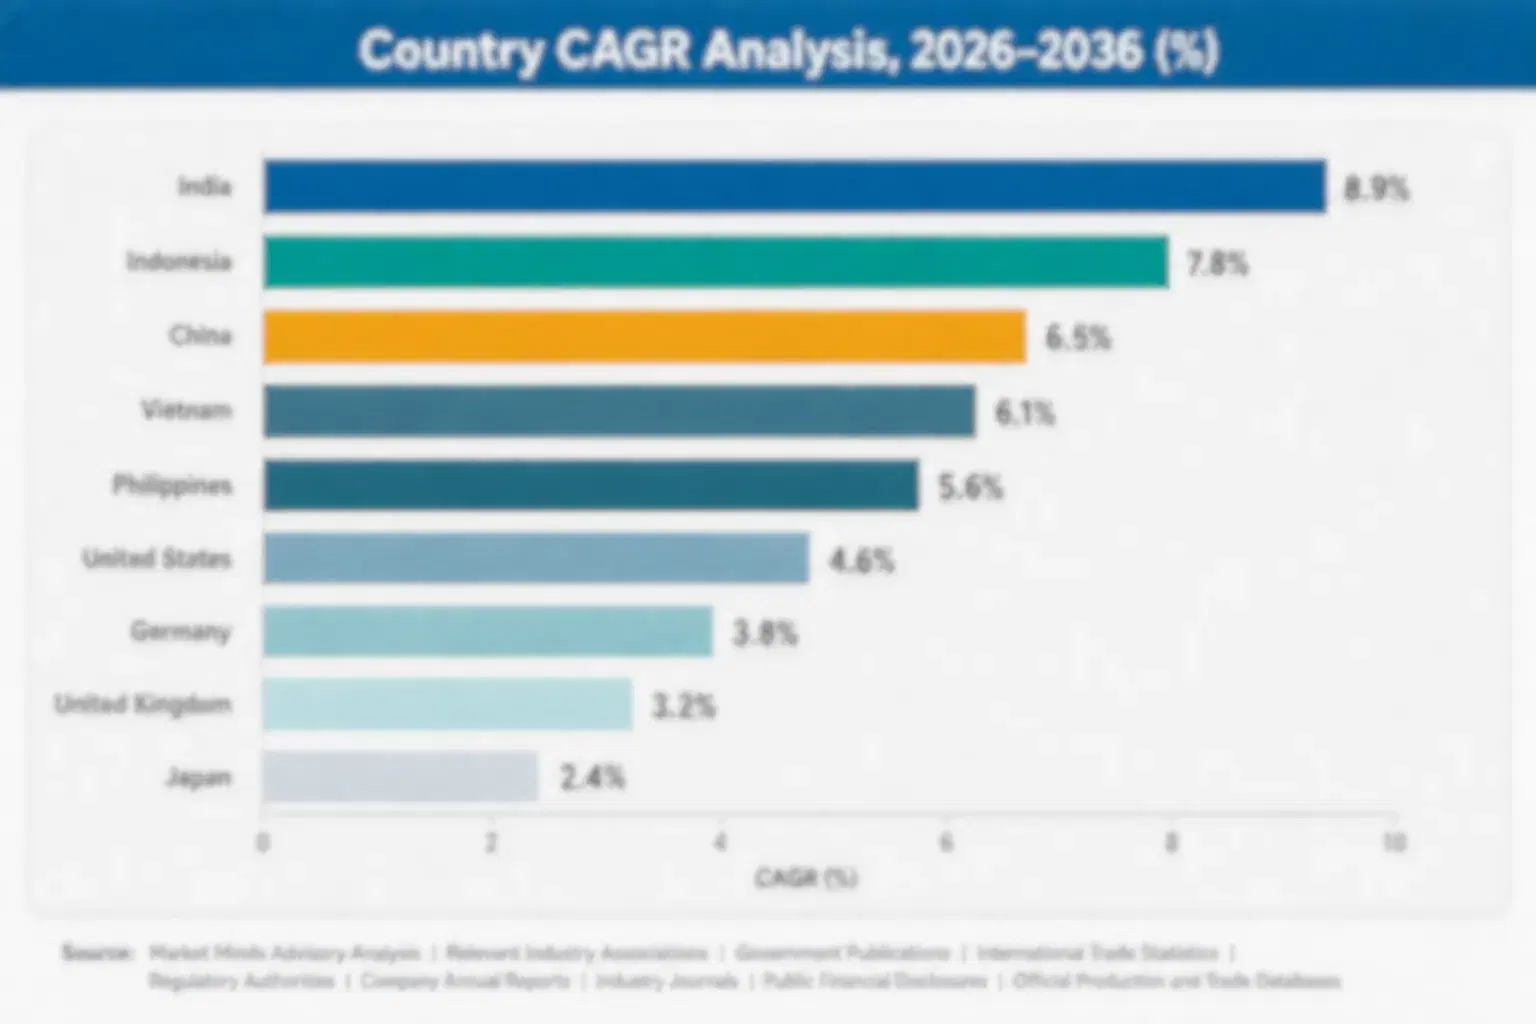
hops-market-share-analysis-country-cagr-analysis-1789757417166

Four Margin Levers for Hop Suppliers

Margin in hops comes from moving beyond standard pellets toward lupulin concentrates, oils, and long contracts that brewers cannot easily replace. Suppliers that invest in cryogenic processing, secure multi-year commitments, diversify into non-alcoholic and non-brewing uses, and manage climate risk earn more per kilogram than merchants selling only commodity pellets. Each route needs different capital.

Investing in Cryogenic Processing to Capture Lupulin Concentrate Premiums

Lupulin-enriched products earn 40% to 80% more per kilogram than standard pellets, and brewers use 40% to 60% less material per barrel, which creates value for both sides. Cryo lines cost several million dollars and need steady raw hop supply, but suppliers with contracted volumes see payback within four to five years. Patent positions and process know-how protect pricing against rivals. Brewers negotiate volume commitments across three years, and cryo partners often secure raw hops from contracted growers, which links processing capacity to farm supply and reduces the risk of idle equipment during weak harvest seasons that limit output.
Market Impact: lupulin grades earn 40% to 80% more per kilogram

Building Multi-Year Brewer Contracts With Volume and Price Floors

Contracts of three to five years cover about 80% of hop volume, and merchants that offer price bands and volume flexibility keep large brewers loyal through cycles. After the craft correction, brewers value flexibility, so suppliers that pair firm pricing with options to swap varieties earn renewal rates above 90%. Contracts also support grower financing and stabilize processing utilization across seasons. Merchants also share market data with growers each quarter, which helps growers plan acreage, and brewers value predictable volumes, so suppliers that publish forecasts and adjust variety mix early avoid the sudden contract cancellations that hurt smaller merchants.
Market Impact: multi-year contracts keep brewer renewal rates above 90%

Developing Oils and Isolates for Non-Alcoholic Beer Customers

Non-alcoholic beer needs strong flavor without alcohol, so hop oils and terpene isolates dosed in small quantities can earn 25% to 45% more margin than pellets. Suppliers with distillation, CO2 extraction, and sensory laboratories help brewers design recipes and reach consistency. Volumes are still small, but growth of about 10% a year in non-alcoholic beer offers reliable expansion through the decade. Sensory panels, gas chromatography, and pilot brewing systems help suppliers prove flavor results, and brewers often need three to six months of trials before switching formats, so early investment in laboratory capability shortens the sales cycle.
Market Impact: oil and isolate lines earn 25% to 45% more margin

Adopting Drought-Tolerant Varieties and Irrigation to Protect Yield

Yield losses of up to 20% in dry years cost growers and merchants heavily, so drought-tolerant varieties, drip irrigation, and soil moisture sensors protect volume and alpha content. Grower investment costs $4,000 to $8,000 per hectare, but yield stability supports contract compliance and protects margin of 3 to 5 points. Merchants often co-fund irrigation to secure supply from their best growers. Moisture sensors reduce irrigation volume by 15% to 25% while maintaining yield, and new varieties bred for heat tolerance are entering commercial trials, so growers that adopt them early can meet contract specifications even in dry summers.
Market Impact: irrigation and new varieties protect 3 to 5 margin points

Who Controls the Margin Pool

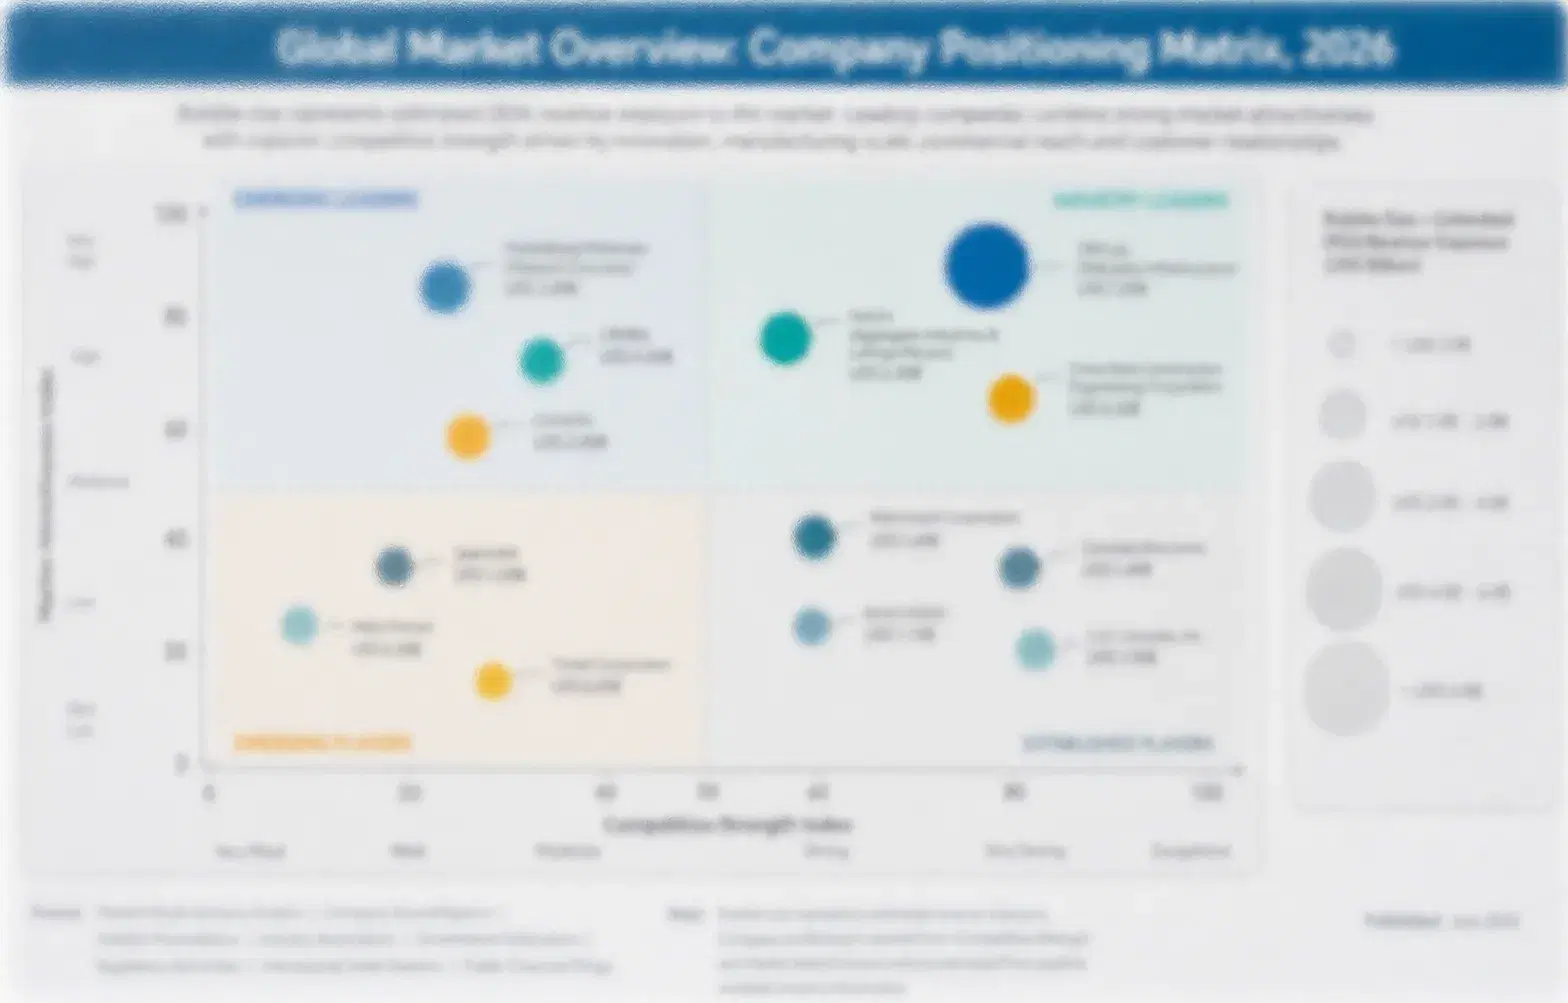
The hop industry is highly concentrated in trade, with the top five merchants and processors holding about 46% of global revenue, the basis used throughout this section. Barth-Haas Group, Hopsteiner, Yakima Chief Hops, HVG, and Crosby Hop Farm lead through variety portfolios, processing capacity, and brewer relationships, while hundreds of family farms hold acreage and sell under contract. The gap between leaders and challengers is wide.
Competition centers on three dimensions: variety portfolios and protected genetics, processing capacity for pellets, extracts, and lupulin concentrates, and long brewer relationships backed by multi-year contracts. Leaders invest in cryo lines and sensory laboratories, while challengers compete on price and niche varieties. Sustainability reporting, water use, and traceability add another layer of differentiation, especially for large European and Asian brewers.

Emerging pressure comes from acreage growth in Australia, New Zealand, and China, from brewers integrating backward into hop sourcing, and from synthetic flavor systems in cost-driven brewing. Rankings shift where suppliers win lupulin and oil contracts, secure protected varieties, or absorb stock overhang. Acquisitions of regional merchants and licensing of variety genetics will reorder positions faster than organic growth in a flat beer market.
hops-market-share-analysis-company-positioning-matrix-1789757417475

Competitive Moat and Risk Dimensions

BARTH-HAAS GROUP

Moat: Global Trade Scale and Extraction

Barth-Haas Group is one of the world's largest hop merchants and processors, with operations in Germany, the United States, and other regions, covering pellets, extracts, oils, and brewing science services. Its scale gives it access to varieties and growers, its extraction capacity supports flavor and bittering products, and its long relationships with global brewers support multi-year contracts.
BARTH-HAAS GROUP

Risk: Exposure to Beer Volume Decline

Barth-Haas depends on brewer demand, and beer volume is declining in mature markets and craft segments, which reduces hop use. Its size makes it exposed to stock overhang, and specialist competitors can move faster in lupulin products and non-alcoholic flavor systems, limiting Barth-Haas's ability to command premiums in fast-growing niches.
YAKIMA CHIEF HOPS

Moat: Grower-Owned Model and Cryo Innovation

Yakima Chief Hops is a grower-owned company in Washington that pioneered cryogenic lupulin products and has strong relationships with craft and large brewers. Its grower ownership supports variety development, acreage commitments, and brewer trust, while its cryo and extract capacity gives it a leading position in the fastest-growing product segment, and its research farm and sensory laboratory support brewer collaboration.
YAKIMA CHIEF HOPS

Risk: US Acreage and Craft Exposure

Yakima Chief Hops relies heavily on United States acreage and craft brewers, so the craft slowdown, water constraints, and local weather affect volume. Larger European merchants can offer broader variety portfolios, and if brewers move away from dry-hopped styles or rival processors match cryo capacity, its premium position could narrow.

Players Tracked

Prominent Players

Barth-Haas Group
Hopsteiner
Yakima Chief Hops
HVG
Crosby Hop Farm

Other Key Players

Charles Faram
Hop Products Australia
Hopunion
Loftus Ranches
Roy Farms
Freestyle Hops
Kalsec
New Zealand Hops
Brewers Supply Group
Kerry Group
Doehler Group
Cargill
Lallemand
Novonesis
Agrana Group

Recent Developments

MARCH 2026

Yakima Chief Hops Expands Cryogenic Lupulin Processing Capacity

Yakima Chief Hops completed an organic capacity expansion at its Washington facility, adding cryogenic separation and pelletizing lines for lupulin-enriched hop products. The project is internal capital spending, not an acquisition. It increases supply of concentrated products for brewers and improves recovery of oil and resin from raw hops.
Signal: Shows leading hop processors investing in lupulin capacity to serve dry-hopped and non-alcoholic beer demand worldwide.
OCTOBER 2025

Hopsteiner Signs Multi-Year Supply Agreements With Large Brewers

Hopsteiner signed multi-year supply agreements with large brewers for bittering pellets and extracts, fixing volumes and pricing bands. The deals are commercial contracts, not equity stakes. They give brewers supply security after variable harvests, give Hopsteiner predictable demand, and support investment in processing and irrigation projects at partner farms.
Signal: Confirms multi-year brewer contracts are becoming standard for securing bittering and extract supply after harvest volatility.
JANUARY 2026

Barth-Haas Acquires Regional Hop Merchant in New Zealand

Barth-Haas Group completed the acquisition of a hop merchant with New Zealand grower relationships and processing capacity for aroma varieties. The purchase adds Southern Hemisphere supply and counter-seasonal harvest timing, and it gives Barth-Haas access to craft brewers seeking varieties. Management said the business will follow Barth-Haas quality systems.
Signal: Reflects global merchants buying Southern Hemisphere capacity to diversify supply and harvest calendar risk over time.

What Drives Hop Production Costs

Farm production accounts for roughly 55% of merchant cost of goods, covering land, trellis, labor, and irrigation on farms in Germany, the United States, the Czech Republic, and Slovenia. Kilning, pelletizing, and extraction energy adds about 14%, with packaging, cold storage, and freight making up most of the remainder, so yields and energy cost together determine gross margin for most suppliers.
European gas and electricity prices spiked in 2022, according to European Commission energy reports, and hot dry summers cut yields in Germany and the Czech Republic, according to German hop grower association data. Growers and merchants reported higher drying costs and lower volumes, added surcharges on some contracts, and in some cases delayed deliveries, while United States growers faced falling demand and stock overhang from the craft slowdown.

Exposure varies by player type and geography. Integrated merchants with contract farms and irrigation absorb shocks better than small growers relying on spot sales. European growers face the highest energy and labor cost, while Australian and New Zealand growers benefit from counter-seasonal supply, and lupulin and oil products pass costs through more easily than commodity bittering pellets sold on price.
hops-market-share-analysis-cost-volatility-analysis-1789757417834

Signing Multi-Year Grower and Brewer Contracts With Price Bands

Merchants negotiate three to five year agreements with both growers and brewers, fixing price bands and volumes and swapping varieties as demand shifts. Contracts reduce spot exposure and improve planning, though they lock in prices when harvests are strong. Growers gain predictable income and financing access, which builds loyalty and protects merchants against poaching by rival buyers.

Installing Irrigation, Drought-Tolerant Varieties, and Heat Recovery

Drip irrigation, new varieties, and heat recovery on kilns cut water and energy use per kilogram of finished hops, and some plants use biomass or solar heat. Savings of 10% to 20% are common in energy, and yield stability improves. Capital cost is meaningful, but payback usually arrives within a few seasons when weather volatility and energy prices remain elevated.

Diversifying Into Extracts, Oils, and Southern Hemisphere Supply

Suppliers shift part of volume into extracts and oils, which need fewer hectares per unit of flavor, and source aroma varieties from Australia and New Zealand to balance harvest calendars. Diversification requires processing capacity and quality systems in several regions, but it protects customer commitments during poor Northern Hemisphere harvests and improves negotiating position with large brewers.

Portfolio Architecture for Margin Defence

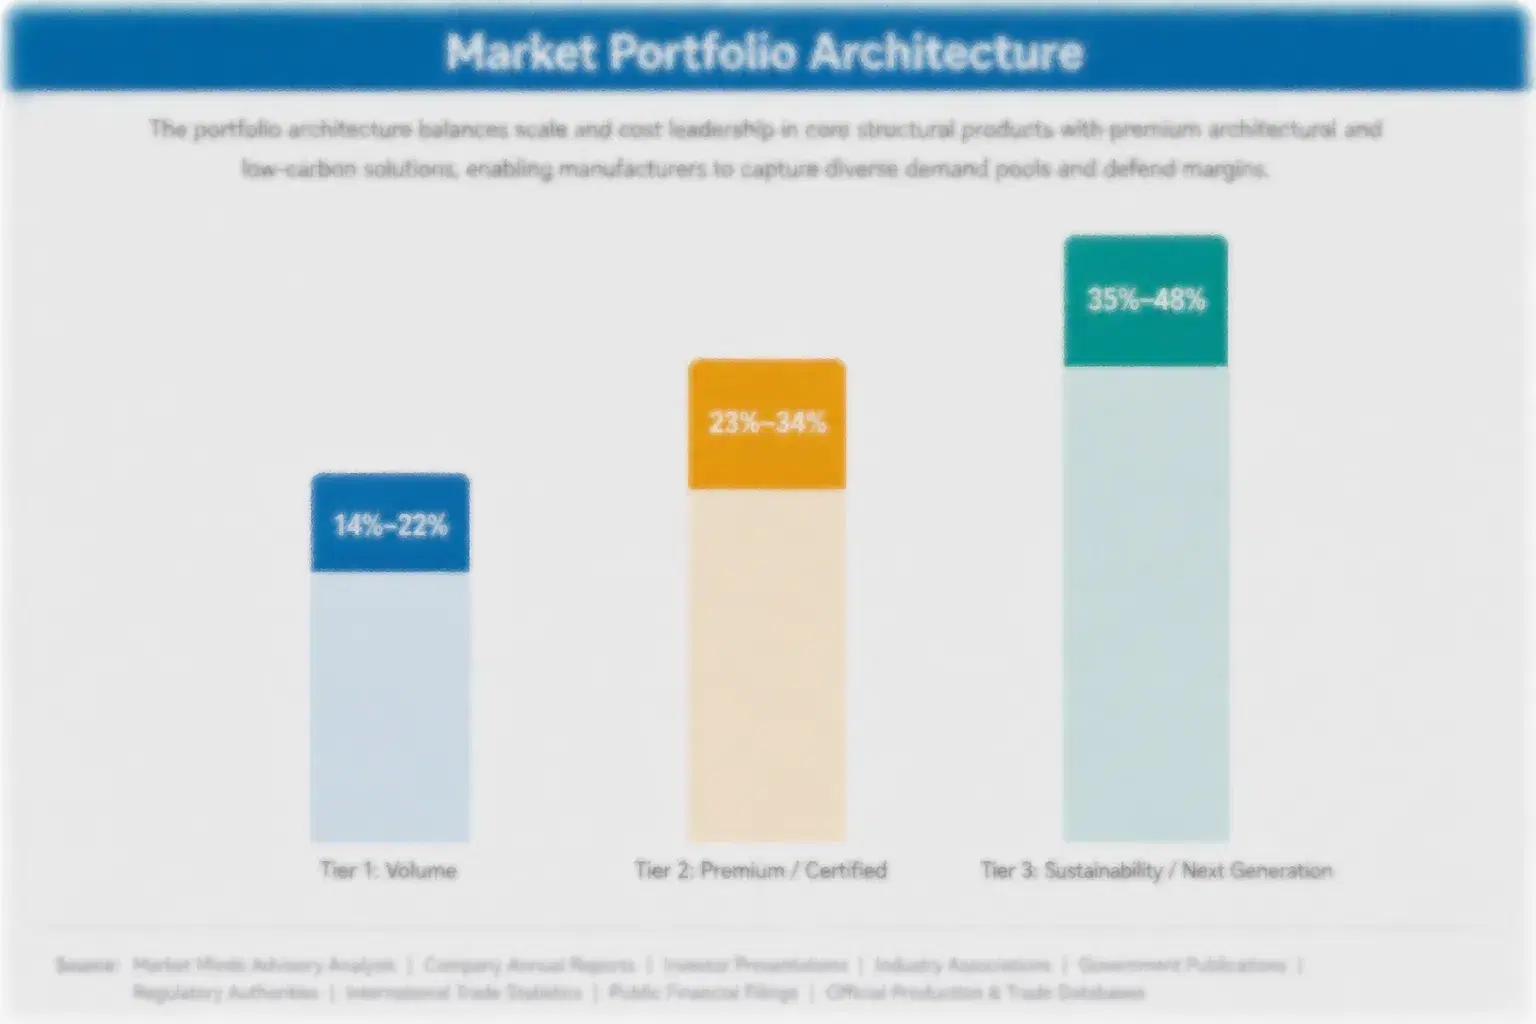
Margins run from thin returns on standard bittering pellets to strong profits on lupulin-enriched products, oils, and organic or protected aroma varieties, with gross margin roughly doubling between the volume tier and the top tier. Processing depth, genetics, and brewer service add pricing power over what starts as the same crop, and buyers pay for reliability because a failed hop supply can halt a brewery's signature product.
Volume and premium pull in different directions. Standard pellets and bittering extracts sell in large lots to major brewers at thin margins and face constant pressure from stock overhang and low-cost origins. Lupulin concentrates and oils sell in smaller lots at much higher margins but need cryogenic capacity, distillation, and sensory support, so suppliers must choose how much capital to commit to premium positioning.

High-value pools concentrate in lupulin-enriched products for dry-hopped beer, oils and isolates for non-alcoholic beer, and protected aroma varieties for premium craft and import brands. These segments benefit from recurring orders, documented specifications, and limited competition from small growers. Suppliers combining variety genetics, processing capacity, and brewer relationships hold advantages that are difficult to copy quickly.

Volume / Commodity-Adjacent Tier

Bittering pellets and standard extracts sold to large brewers under long contracts on price, with thin margins, exposure to stock overhang, and competition from low-cost origins and merchants worldwide, including Chinese and Eastern European suppliers.
Gross Margin: 12%-20%

Premium / Certified Tier

Aroma variety pellets and organic hops with protected genetics and traceable origin, sold under annual contracts to craft and import brewers that require documented variety identity, consistent oil content, and reliable delivery after each harvest.
Gross Margin: 22%-32%

Sustainability / Regulatory / Next-Generation Tier

Lupulin-enriched products, oils, and isolates with sensory support and process patents, positioned for dry-hopped and non-alcoholic beer, water and pesticide reduction goals, and next-generation flavor systems across developed and emerging markets.
Gross Margin: 30%-45%
hops-market-share-analysis-portfolio-architecture-1789757418119

High-value Sub-segments and Strategic Watch-out

Lupulin-Enriched Hop Products

Lupulin concentrates combine the fastest growth with strong pricing, as brewers pay for higher oil content and lower waste. Cryogenic capacity and patents limit competition, though suppliers must secure raw hop volumes and keep quality consistent to honor multi-year brewer contracts and keep premium customers.
Gross Margin: 30%-45%

Hop Oils and Terpene Isolates

Oils and isolates offer solid growth and strong premiums, because non-alcoholic and low-alcohol brewers need controlled flavor dosing. Distillation capacity and flavor science build barriers, while volumes remain small and synthetic alternatives loom, so suppliers need sensory laboratories and brewer collaboration to keep customers over time.
Gross Margin: 28%-42%

Standard Hop Pellets

Standard pellets remain the volume core, moving the largest tonnage to major brewers at modest prices. Margins depend on crop yield, kilning cost, and buyer negotiation, and stock overhang pressures prices, so returns rely on cost discipline and scale rather than differentiation or premium product features.
Gross Margin: 12%-20%

Synthetic Flavor Systems and Brewing Efficiency

Synthetic flavor systems and brewing practices that cut hop use are the main strategic watch-out, since they target cost-driven brewers with lower spending and stable supply. If beer volumes keep declining or brewers accept alternatives, hop demand growth slows and pricing weakens in commodity segments.
Gross Margin: n/a (substitution risk)

Why Brewers Keep Hop Suppliers

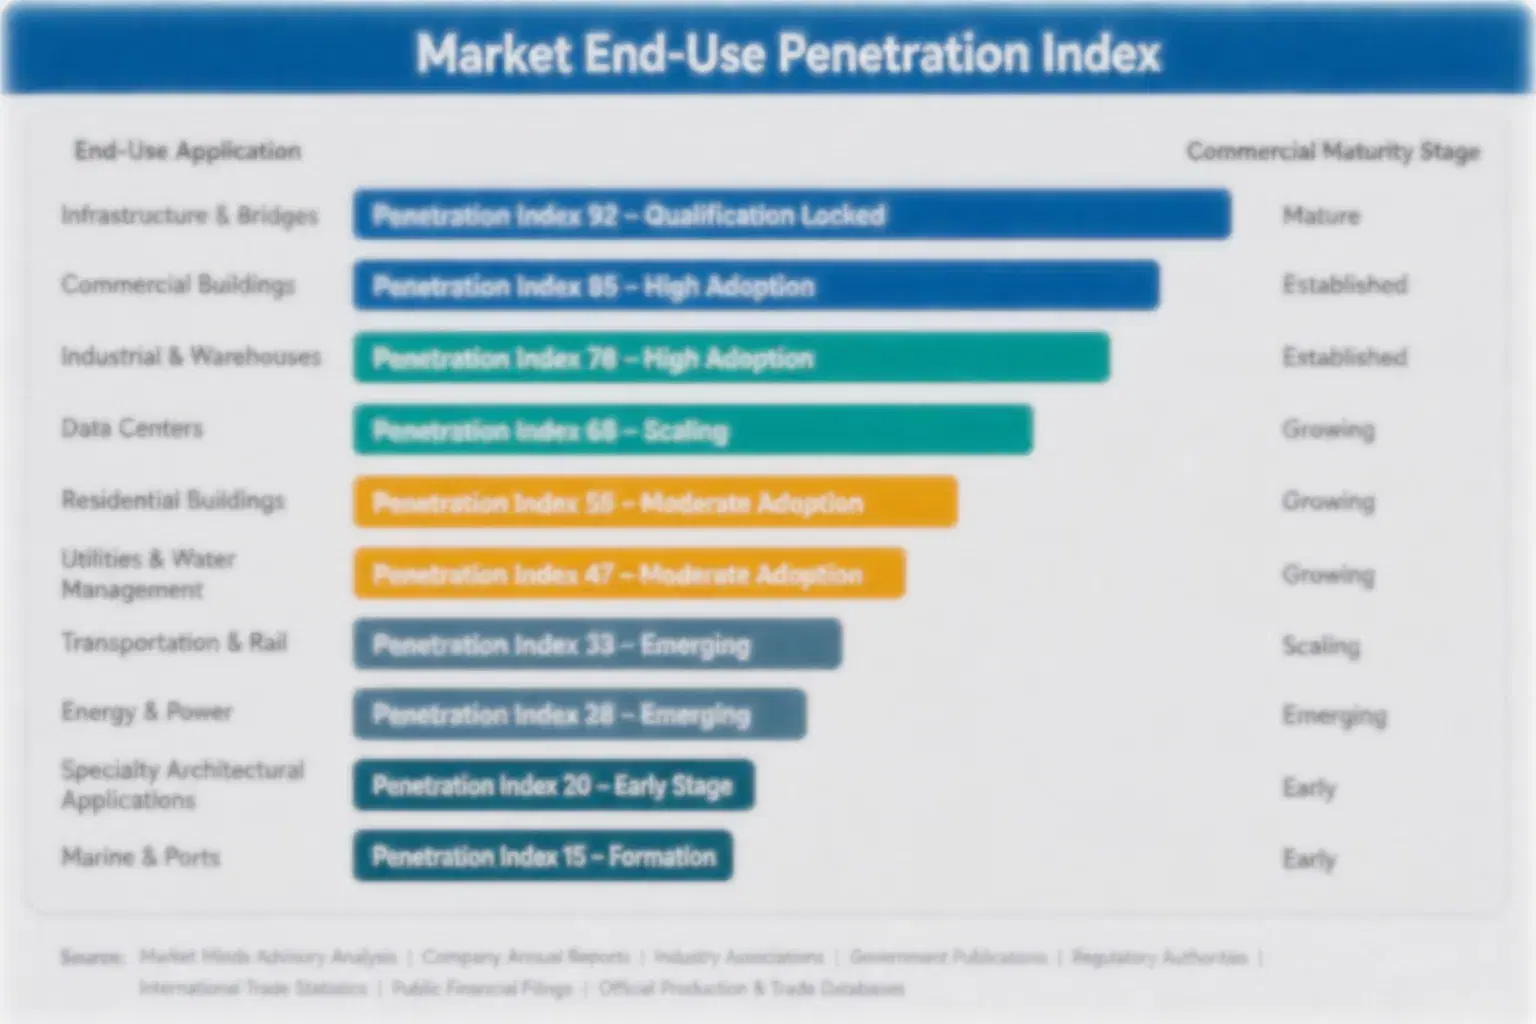
Hop demand behaves like an annuity once a brewery designs a recipe around a variety and supplier. Alpha content, oil profile, and aroma are tied to a specific origin and processing method, so switching means new sensory trials, possible recipe changes, and risk of flavor drift in a flagship beer. Annual and multi-year agreements reinforce repeat orders, and brewers often accept modest price increases to protect supply.
Stickiness varies by end-use vertical. Large brewers with flagship lagers show the deepest loyalty because bitterness and aroma are tied to a fixed recipe and specific varieties. Craft brewers switch more often, since new varieties and trends dominate, though lupulin products build switching costs. Non-brewing buyers purchase on price and specification, making that group the most price sensitive and least attractive for long-term planning.

Buyer profiles are changing. Younger brewers and beverage developers emphasize novel varieties, low-alcohol styles, and sustainability metrics, and they favor suppliers that document water use, pesticide practices, and traceability. Older buyers anchor on classic varieties and long relationships. Suppliers must serve both groups, but growth concentrates among non-alcoholic and premium segments that meet health and sustainability commitments.
hops-market-share-analysis-end-use-penetration-index-1789757418430

MMA Verdict on Hop Market Strategy

These are among the four positions where our research anticipates prominent divergence between winners and laggards over the coming forecast period. Each is grounded in the demand model, the regulatory perimeter, and the announced capacity pipeline.
01 / LUPULIN CAPACITY INVESTMENT

Invest in Cryogenic Lupulin Processing Before Rivals Do

Lupulin-enriched products grow about 2.14 times faster than the market and earn 40% to 80% more per kilogram than standard pellets, while brewers use 40% to 60% less material. Cryo lines cost several million dollars and pay back within four to five years with contracted volume. MMA recommends committing capital within the next two years, before rivals build competing capacity and the premium becomes more contested, and rights to key equipment and process settings are protected, so late entrants must design around existing patents.
02 / CONTRACT FLEXIBILITY STRATEGY

Offer Multi-Year Contracts With Price Bands and Variety Swaps

Contracts of three to five years cover about 80% of hop volume, and flexibility after the craft correction keeps renewal rates above 90%. Merchants that pair firm pricing with variety swap options keep large brewers loyal and support grower financing. MMA advises building contract flexibility into new agreements now, because brewers that feel locked into unwanted varieties are shifting volume to competitors with more adaptable terms, and several merchants that offered rigid terms during the boom now hold stranded contracts and unsold stock they cannot easily place.
03 / NON-ALCOHOLIC BEER OPPORTUNITY

Develop Oils and Isolates for Non-Alcoholic Beer Customers

Non-alcoholic beer grows near 10% a year, and hop oils and isolates earn 25% to 45% more margin than pellets. Suppliers with distillation, CO2 extraction, and sensory laboratories help brewers reach consistency. MMA recommends building small application teams and partnering with two anchor brewers, then extending the range as sensory data and reference recipes attract further inquiries from large brewers, and suppliers who publish sensory data and offer free trial volumes in the first year typically win the reference accounts that others then follow.
04 / CLIMATE RESILIENCE INVESTMENT

Adopt Drought-Tolerant Varieties and Irrigation to Protect Yield

Yield losses of up to 20% in dry years cost growers and merchants heavily, and drip irrigation and new varieties protect 3 to 5 margin points. Grower investment costs $4,000 to $8,000 per hectare but stabilizes contract compliance. MMA regards climate resilience as the foundation of every credible supply commitment, since even the best processor cannot make margin from hops that failed to grow, and merchants that co-fund irrigation with their best growers secure priority access to scarce volumes in dry years when others are rationing.

Engagement Snapshot From the Field

A live engagement with an industry participant carrying material or product regulatory and market exposure ahead of a defining policy shift, showing how our research translates into a defensible multi-year portfolio strategy.
MARKET MINDS ADVISORY · CLIENT ENGAGEMENT SUMMARY
Hops Share Analysis Producer Strategic Portfolio Review and Transition Roadmap 2026·Investment Scenario on Hops Share Analysis Exposure Evaluation 2025-26
CLIENT PROFILE
The client is a mid-sized European hop merchant with contracts covering about 900 hectares and roughly $64 million in annual revenue (client-reported, unverified by MMA), selling pellets and extracts to regional brewers and distributors. About 85% of volume was standard pellets, gross margin sat near 13% (client-reported, unverified by MMA), and the company had no lupulin or oil capability.
STRATEGIC CHALLENGE
Craft brewer contract cancellations and dry summers had squeezed margins, and stock overhang pressured prices, while large brewers asked for lupulin concentrates and oils the client could not supply. Leadership needed a plan that added processing capability, moved volume toward premium products, and protected grower supply without overextending capital. The board wanted a decision within a year.
MMA APPROACH
MMA benchmarked 10 merchants on product mix and processing capability, interviewed brewery procurement leads, craft brewers, and non-alcoholic beer developers about specifications and price points, and modeled the economics of a cryogenic partnership, an oil line, and irrigation support under bull, base, and bear demand and harvest scenarios. The work covered five brewing markets.
KEY FINDINGS
  1. A cryogenic processing partnership would give access to lupulin products priced roughly 60% higher without full capital ownership, according to modeling of partner quotations.
  2. Two large brewers indicated they would sign three-year contracts for oils and isolates if sensory support was provided with each lot, according to interviews.
  3. Irrigation support for contract growers would protect roughly 4 margin points during a dry year like 2022, according to modeling, based on grower data.
  4. Standard pellet volume would remain necessary to fill plants, so the client should keep large brewer contracts at about 55% of volume.
CLIENT PROFILE
The client is a mid-sized European hop merchant with contracts covering about 900 hectares and roughly $64 million in annual revenue (client-reported, unverified by MMA), selling pellets and extracts to regional brewers and distributors. About 85% of volume was standard pellets, gross margin sat near 13% (client-reported, unverified by MMA), and the company had no lupulin or oil capability.
STRATEGIC CHALLENGE
Craft brewer contract cancellations and dry summers had squeezed margins, and stock overhang pressured prices, while large brewers asked for lupulin concentrates and oils the client could not supply. Leadership needed a plan that added processing capability, moved volume toward premium products, and protected grower supply without overextending capital. The board wanted a decision within a year.
MMA APPROACH
MMA benchmarked 10 merchants on product mix and processing capability, interviewed brewery procurement leads, craft brewers, and non-alcoholic beer developers about specifications and price points, and modeled the economics of a cryogenic partnership, an oil line, and irrigation support under bull, base, and bear demand and harvest scenarios. The work covered five brewing markets.
KEY FINDINGS
  1. A cryogenic processing partnership would give access to lupulin products priced roughly 60% higher without full capital ownership, according to modeling of partner quotations.
  2. Two large brewers indicated they would sign three-year contracts for oils and isolates if sensory support was provided with each lot, according to interviews.
  3. Irrigation support for contract growers would protect roughly 4 margin points during a dry year like 2022, according to modeling, based on grower data.
  4. Standard pellet volume would remain necessary to fill plants, so the client should keep large brewer contracts at about 55% of volume.
RECOMMENDED STRATEGY
Phase 1: Phase 1 (Months 1-6): Sign a cryogenic processing partnership and fund irrigation support for the best contract growers, with progress reviewed monthly. Phase 2: Phase 2 (Months 7-18): Commission an oil and isolate line with a sensory laboratory and qualify products with two large brewers. Phase 3: Phase 3 (Months 19-36): Launch lupulin and oil programs for non-alcoholic beer and expand contracts with Asian importers while tracking margin quarterly.
OUTCOME
Within 36 months, the client moved about 28% of volume into lupulin and oil products and raised gross margin from 13% to an estimated 22% (client-reported, unverified by MMA). Two brewer contracts were signed, irrigation support held yields steady through a dry year, and revenue reached roughly $78 million (client-reported, unverified by MMA).

Frequently Asked Questions

Foundational context covering the market sizes, CAGR, scope, country, region and competition that inform every finding below. This section is provided to cover basics and most often pre-purchase conversations, answered from the MMA Primary Research Dataset.

What is the current size of the Hops Market?

The global hops market was valued at $3.4 billion in 2025. This covers pellets, whole cones, extracts, lupulin-enriched products, and oils sold to brewers and other users.

How large will the Hops Market be by 2036?

MMA projects the market will reach approximately $5.3 billion by 2036. This represents cumulative growth of roughly $1.8 billion over the full ten-year forecast window.

What is the CAGR for the Hops Market 2026 to 2036?

The market is forecast to grow at a 4.2% compound annual rate between 2026 and 2036. The bull case reaches 5.5% while the bear case falls to 2.9%.

Which segment is growing fastest?

Lupulin-Enriched Hop Products is the fastest-growing segment at 9.0% CAGR, roughly 2.14 times the overall market rate. Hop Oils and Terpene Isolates follows as the second-fastest segment at 7.6%.

Who are the major companies in the Hops Market?

Leading companies include Barth-Haas Group, Hopsteiner, Yakima Chief Hops, HVG, and Crosby Hop Farm. These five suppliers together hold an estimated 46% of total global market revenue today.

Which country is growing fastest?

China is the fastest-growing major market, expanding at approximately 6.2% CAGR each year. Beer premiumization, craft styles, and rising import demand for aroma varieties are driving this above-market growth.

Report Segmentation Architecture

The full report scope spans multiple orthogonal segmentation dimensions, with cross-tabulated demand data provided for each dimension pair. Coverage extends further to regional breakdowns, trend trajectories, and the competitive detail needed to support segment-level decision-making.

By Primary Market Dimension

  • Lupulin-Enriched Hop Products
  • Hop Oils and Terpene Isolates
  • Standard Hop Pellets
  • Whole Cone Hops
  • CO2 and Isomerized Extracts
  • Non-Brewing Hop Acid Products

By End-Use Industry

  • Large-Scale Lager Brewing
  • Craft and Independent Brewing
  • Non-Alcoholic and Low-Alcohol Beverages
  • Nutraceutical and Natural Preservative Uses
  • Animal Health and Feed Applications

By Commercial Dimension

  • Direct Brewer Contracts
  • Merchant and Distributor Channels
  • Grower-Owned Cooperative Programs
  • Export Trade Channels

By Region

  • North America
  • Western Europe
  • East Asia
  • South Asia and Pacific
  • Latin America
  • Middle East and Africa
  • Eastern Europe

Scope, Methodology, and Coverage

Every figure in this report is reproducible from documented input assumptions. The scope below maps the historical period, the forecast horizon, the segmentation dimensions, and the countries covered, alongside the underlying primary and qualitative methodology.
Historical Period
2020 to 2025
Forecast Period
2026 to 2036
Base Year
2025 (USD billions; MMA Primary Research Dataset, September 2026)
Market Definition
Hops comprise the dried cones of the hop plant, Humulus lupulus, and products derived from them, including pellets, whole cones, CO2 and isomerized extracts, lupulin-enriched pellets, and hop oils, sold to breweries, non-alcoholic beverage makers, and non-brewing users. The scope excludes malted barley, brewer's yeast, finished beer and beverages, hop shoots sold as vegetables, and hop-based medicinal or cosmetic finished products.
Quantitative Units
USD billions (current prices); metric tons for volume references
Segmentation Dimensions
By Product Form; By End-Use Industry; By Commercial Dimension; By Region
Regions Covered
North America, Western Europe, East Asia, South Asia and Pacific, Latin America, Middle East and Africa, Eastern Europe
Countries Covered
USA, Canada, Mexico, Brazil, Argentina, Chile, Germany, Czech Republic, UK, France, Belgium, Netherlands, Slovenia, Poland, Ukraine, Austria, Spain, South Africa, Nigeria, Kenya, UAE, China, Japan, South Korea, India, Australia, New Zealand, Vietnam, Thailand, Indonesia, and additional markets relevant to this sector
Key Companies Profiled
Barth-Haas Group, Hopsteiner, Yakima Chief Hops, HVG, Crosby Hop Farm, Charles Faram, Hop Products Australia, Hopunion, Loftus Ranches, Roy Farms, Freestyle Hops, Kalsec, New Zealand Hops, Brewers Supply Group, Kerry Group, Doehler Group, Cargill, Lallemand, Novonesis, Agrana Group
Quantitative Methodology
Primary survey, n=3,800 respondents, Q4 2025, six countries; demand-side model with trade association cross-validation
Qualitative Methodology
47 expert interviews, Q4 2025; applied to validate demand model assumptions, identify emerging dynamics, and assess competitive positioning
Report Format
PDF and XLSX data workbook (Word format preview document)
Publisher
Market Minds Advisory
Report Code
MMA-2026-AGR-259
Published
September 2026
Contact
sales@marketmindsadvisory.com | www.marketmindsadvisory.com

Purchase the full Hops Market Share Analysis Report (2026 to 2036).

The full report delivers a detailed assessment of global hop production, product mix, and competitive share positions through 2036. It includes segment forecasts by product form, country-level data for all seven world regions, and profiles of the twenty companies most relevant to hop trade and processing. Analysts also receive input cost modeling and portfolio margin benchmarking built from MMA's primary research dataset. A scenario planning module lets subscribers stress-test bull and bear assumptions against harvest and beer volume outcomes. Quarterly updates keep the whole dataset current throughout.
Ten-year segment and regional demand forecasts
Hop acreage and processing capacity tracking
Competitive share benchmarking of top twenty suppliers
Harvest and energy cost sensitivity modeling tools
Regional demand mechanism comparative analysis included
Quarterly primary survey data update access

Built For The People Who Decide

From boardroom strategy to bench-side execution, this report is read cover-to-cover by leaders shaping the next decade of their industry, turning demand scenarios, market dynamics and valuation benchmarks into decisions.
CXOs/ Presidents/ VPs/ Managers
M&A and Corporate Development
Strategy Teams and R&D Heads
Procurement and Product Directors
Regulatory and Compliance Leaders
Investor Relations and Equity Analysts