Market Minds Advisory
Homeland Security And Emergency Management Market

Homeland Security And Emergency Management Market: Homeland Security and Emergency Management: Fragmented Buying, Boundary-Crossing Threats and Inquiries Nobody Acts On

The most fragmented government market anywhere, where every incident that matters happens at the level of government holding the smallest budget and the least capable equipment anybody bought for it.

Lead Analyst

Published

September 2026

Make Smarter Decisions with Customized Research Insights

Request a free sample report and evaluate market opportunities, growth trends, and competitive dynamics relevant to your business needs.

2025 MARKET VALUE$162.0BMarket Size 2025
2036 FORECAST VALUE$327.2BBase Case , 2026 to 2036
CAGR 2026 TO 20366.6 %Bull 7.8% / Bear 5.4%
INCREMENTAL OPPORTUNITY$154.5BNet 10- year value creation
EXPANSION MULTIPLE1.89x2036 value over 2026 base
Strategic Levers
M&A Pipeline
Regional Outlook
Country Rankings
Competitive Intelligence
Segmental Deep-dive
Call-Us : 91 93563 13602

Executive Snapshot and Market Trajectory.

Concentration here is 24%, the lowest of any major government market, and the fragmentation is the defining commercial fact rather than a statistical curiosity. Roughly 39,000 separate agencies purchase independently inside one national system on their own. That particular number has never once fallen.
That structure produces a predictable failure. The incident happens where a municipality holds the budget, the capability sits where a federal agency holds the money, and 31% of major incident reviews cite communications problems between the two. Every inquiry since 2001 has recommended consolidation, every recommendation has been accepted, and the purchasing authority count has not fallen. Suppliers organised around federal selling reach only a fraction of the actual buyers. The gap is enormous.
Growth concentrates where threats ignore those boundaries entirely. Counter-drone and airspace security grows fastest at 9.9%, because a drone over an airport or a prison belongs to nobody's jurisdiction and everybody's problem. Disaster resilience follows, with 27 billion dollar weather events recorded in a single recent year overwhelming jurisdictions one at a time. Neither threat respects a boundary anybody drew, and both of those budgets sit somewhere else entirely.
Market Definition
Government and regulated operator spending on homeland security and emergency management systems, equipment and contracted services, covering border and maritime security, critical infrastructure protection, screening and detection, emergency communications and command, disaster response and resilience, and counter-drone capability. Excludes uniformed personnel salaries and pensions, military defence procurement, routine policing operations unrelated to security systems, and commercial security services for non-critical premises.
Base Year Value
$162.0B in 2025 (MMA Primary Research Dataset, August 2026)
Forecast Period
2026 to 2036, eleven discrete annual values
CAGR
6.6% base case. Bull 7.8%. Bear 5.4%.
Fastest Growth Segment
Counter-Drone and Airspace Security: 9.9% CAGR
Fastest Growth Country
India: 8.6% CAGR
Fastest Growth Region
South Asia and Pacific: 8.6% CAGR
Largest Region
North America: 30% of 2025 global value
Market Leaders
Leidos, Thales, RTX, L3Harris Technologies and Motorola Solutions lead on homeland security contract award value. Source: company annual reports and MMA Primary Research Dataset, July 2026.
Primary Survey
n=3,800 procurement and R&D decision-makers, Q4 2025, six countries
Methodology
Demand-side build-up, cross-validated against public data, 47 expert interviews

Homeland Security And Emergency Management Market Forecast Scenarios

homeland-security-and-emergency-management-market-size-forecast-scenario-1788023739834
The 2020 to 2025 period was shaped by threats nobody had budgeted for. A pandemic response revealed emergency management gaps across every level of government, climate disasters arrived at a frequency that exhausted contingency funds annually rather than occasionally, and drone incursions over sensitive sites moved from novelty to routine. Spending compounded near 5.6%, driven considerably more by incident response than by planning.
Three mechanisms carry the base case forward. Counter-drone authority and capability expand as incursions over airports, prisons and infrastructure continue at a rate no jurisdiction can ignore. Climate resilience spending rises because disaster frequency has outrun the funding models designed around occasional events. And critical infrastructure obligations extend to privately owned utilities and networks that governments regulate but do not operate, which creates a buyer that did not previously exist.
The bull catalyst is genuine procurement consolidation across jurisdictional layers, which every inquiry recommends and which would convert fragmented buying into programmes at scale. The bear risk is grant funding contraction: local capability across much of this market is paid for by central government programmes, and withdrawing them removes the budget without removing any of the underlying requirement.

Thirty-Nine Thousand Buyers, One Threat

Nothing about this market's structure is accidental. Emergency response is deliberately local, because the people who arrive first should answer to the community they serve, and that principle produces roughly 39,000 independent purchasing authorities inside a single national system. Concentration at 24% follows directly. A supplier cannot reach that many buyers through any sales organisation, which is why distribution, framework schedules and grant programmes matter more than product quality does.
MARKET CONCENTRATION CR524%Share of contract award value held by leading suppliers
PURCHASING AUTHORITY COUNT39,000Separate agencies procuring independently across one federal system
INTEROPERABILITY FAILURE RATE31%Major incidents citing communications problems in after action review
FEDERAL FUNDING SHARE44%Local capability paid for through central government grant programmes
BILLION DOLLAR DISASTER COUNT27Costly weather events recorded across a single recent year
PROCUREMENT CYCLE LENGTH19 monthsElapsed period from requirement publication to contract award
The failure mode has been documented repeatedly and never fixed. Around 31% of major incident after action reviews cite communications or coordination problems between agencies that each bought sensible equipment separately. Every inquiry since 2001 recommended interoperability, every government accepted the recommendation, and the number of independent buyers has not reduced. Suppliers adapted by selling to the funding source rather than the user, which works and solves nothing.
Money moves through grants rather than through budgets. Roughly 44% of local capability is paid for by central government programmes with conditions attached, which means a municipal buyer is frequently spending somebody else's money against somebody else's priorities. That makes grant cycles more commercially important than local budgets, and a supplier's grasp of programme eligibility rules matters more than its catalogue.
"Every inquiry into every disaster since 2001 has recommended that these agencies buy things together. They have all agreed, and there are still thirty-nine thousand of them buying separately."
Director, Public Safety and Civil Security Practice · MMA Government Security and Public Safety Practice · August 2026

Market Trends

Drone Incursions Create A Jurisdiction Nobody Owns

Unmanned aircraft appearing over airports, prisons, stadiums and infrastructure sit in a gap between aviation regulators, police forces, site operators and national security agencies, none of whom holds clear authority to detect, identify or intervene. Legislative extensions have granted limited authority to specific federal bodies while leaving most sites without any lawful response. That gap is the market: sites buy detection because they may lawfully detect, and defer mitigation because they may not lawfully mitigate anything at all. Detection sells today and mitigation simply waits on legislation nobody can date.
Market Impact: Extends duties to 16 sectors

Disaster Frequency Outran The Funding Model Entirely

Emergency funding was designed around occasional catastrophic events drawing on contingency reserves, and 27 billion dollar weather events in a single recent year is not an occasional pattern. Reserves are exhausted before the year ends, supplemental appropriations become routine, and jurisdictions that would once have rebuilt now plan for recurrence instead. That shifts spending from response equipment toward resilience infrastructure, mapping, prediction and mitigation, which is a different market with different suppliers in it. Suppliers built around emergency equipment simply watch budget migrate toward capabilities they simply do not offer.
Market Impact: Funds 44% of local capability

Market Opportunities and Growth Drivers

Critical Infrastructure Obligations Reach Private Operators

Governments regulating utilities, telecommunications networks, transport operators and health systems have extended security obligations to owners those governments do not control, which creates a buyer that did not previously exist in this market. European network security rules and comparable American requirements both oblige private operators to assess, report and mitigate, funding the work from their own balance sheets rather than from public budgets. Suppliers accustomed to government procurement are meeting commercial buyers with entirely different purchasing behaviour. A commercial buyer behaves nothing at all like a government agency ever does.
Market Impact: Splits buying across 39,000 agencies

Grant Programmes Fund Capability Local Budgets Cannot

Around 44% of local emergency and security capability is paid for through central government grant programmes rather than from municipal budgets, which means eligibility rules effectively determine what gets bought. A supplier whose product maps cleanly onto a funded programme category sells; one whose product does not is invisible regardless of merit. That makes programme literacy a genuine commercial capability rather than an administrative overhead, and remarkably few suppliers actually treat it as one anywhere. Programme literacy is a genuine commercial capability here rather than any administrative overhead at all.
Market Impact: Limits 9.9% growth to detection

Market Restraints and Challenges

Fragmentation Prevents Any Programme Reaching Scale

Roughly 39,000 independent purchasing authorities means no supplier can reach the buyers directly and no programme achieves the volume that would reduce unit cost. The root cause is a deliberate constitutional preference for local control over emergency response, which is defensible on every ground except efficiency. Suppliers mitigate through framework schedules that pre-negotiate terms, distributor and integrator networks reaching municipal buyers, and grant programme alignment that puts the product in front of the money rather than the user. Local control is defensible on every single ground except purchasing efficiency alone.
Market Impact: Grows counter-drone 9.9% annually

Counter-Drone Authority Lags The Counter-Drone Requirement Badly

Most sites facing drone incursions have no lawful authority to interfere with an aircraft in flight, so they may detect and identify but cannot mitigate. The root cause is aviation law written when the only aircraft overhead were crewed and regulated. Commercially it caps a market whose demand is obvious and whose legal basis is not. Suppliers mitigate by selling detection where mitigation is unlawful, partnering with agencies that do hold authority, and preparing mitigation capability against legislation most expect eventually. Demand is obvious and the legal basis for meeting it is not.
Market Impact: Recorded 27 costly events yearly
3 additional market trends, 4 additional growth drivers, and 2 additional restraints and challenges are covered in the full report. Contact sales@marketmindsadvisory.com to access the complete intelligence.

Segment CAGR and Growth Architecture

Segmentation follows mission area, since each one is bought by different agencies under different authorities and funded through entirely separate appropriations. Six mission areas describe the market completely, from the border security funded nationally through to the counter-drone capability that no single authority yet clearly owns anywhere at all. Each is funded quite separately.
homeland-security-and-emergency-management-market-market-share-analysis-1788023740382

Counter-Drone and Airspace Security

The fastest mission area grows at 9.9%, half again the market rate of 6.6%, and it grows inside a legal gap rather than a defined requirement. Drones over airports, prisons, stadiums and energy infrastructure fall between aviation regulators, police, site operators and national agencies, and most sites hold no lawful authority to interfere with an aircraft in flight whatever it is doing. So they buy detection, which is lawful, and defer mitigation, which mostly is not. Legislative extensions have granted narrow authority to specific federal bodies while leaving thousands of sites able only to watch. Suppliers positioned for detection are selling now, and those holding mitigation capability are waiting for law that most expect and nobody can date.
CAGR 9.9%

Disaster Response and Resilience

Disaster spending grows at 8.4% and has changed character rather than merely scale. Emergency funding was built around occasional catastrophes drawing on contingency reserves, and 27 billion dollar weather events in one year exhausts those reserves before the year ends. Jurisdictions that once rebuilt now plan for recurrence, which moves money from response equipment toward mapping, prediction, mitigation infrastructure and continuity planning. Those are different products bought by different people, frequently planners rather than responders. Suppliers built around emergency equipment are watching budget migrate toward capabilities they do not offer, and the migration accelerates after every season that breaks another record. Every record-breaking season simply accelerates that particular migration further.
CAGR 8.4%
Full segment breakdown across 6 segments available in the complete report.

Regional Architecture and Country Demand Map

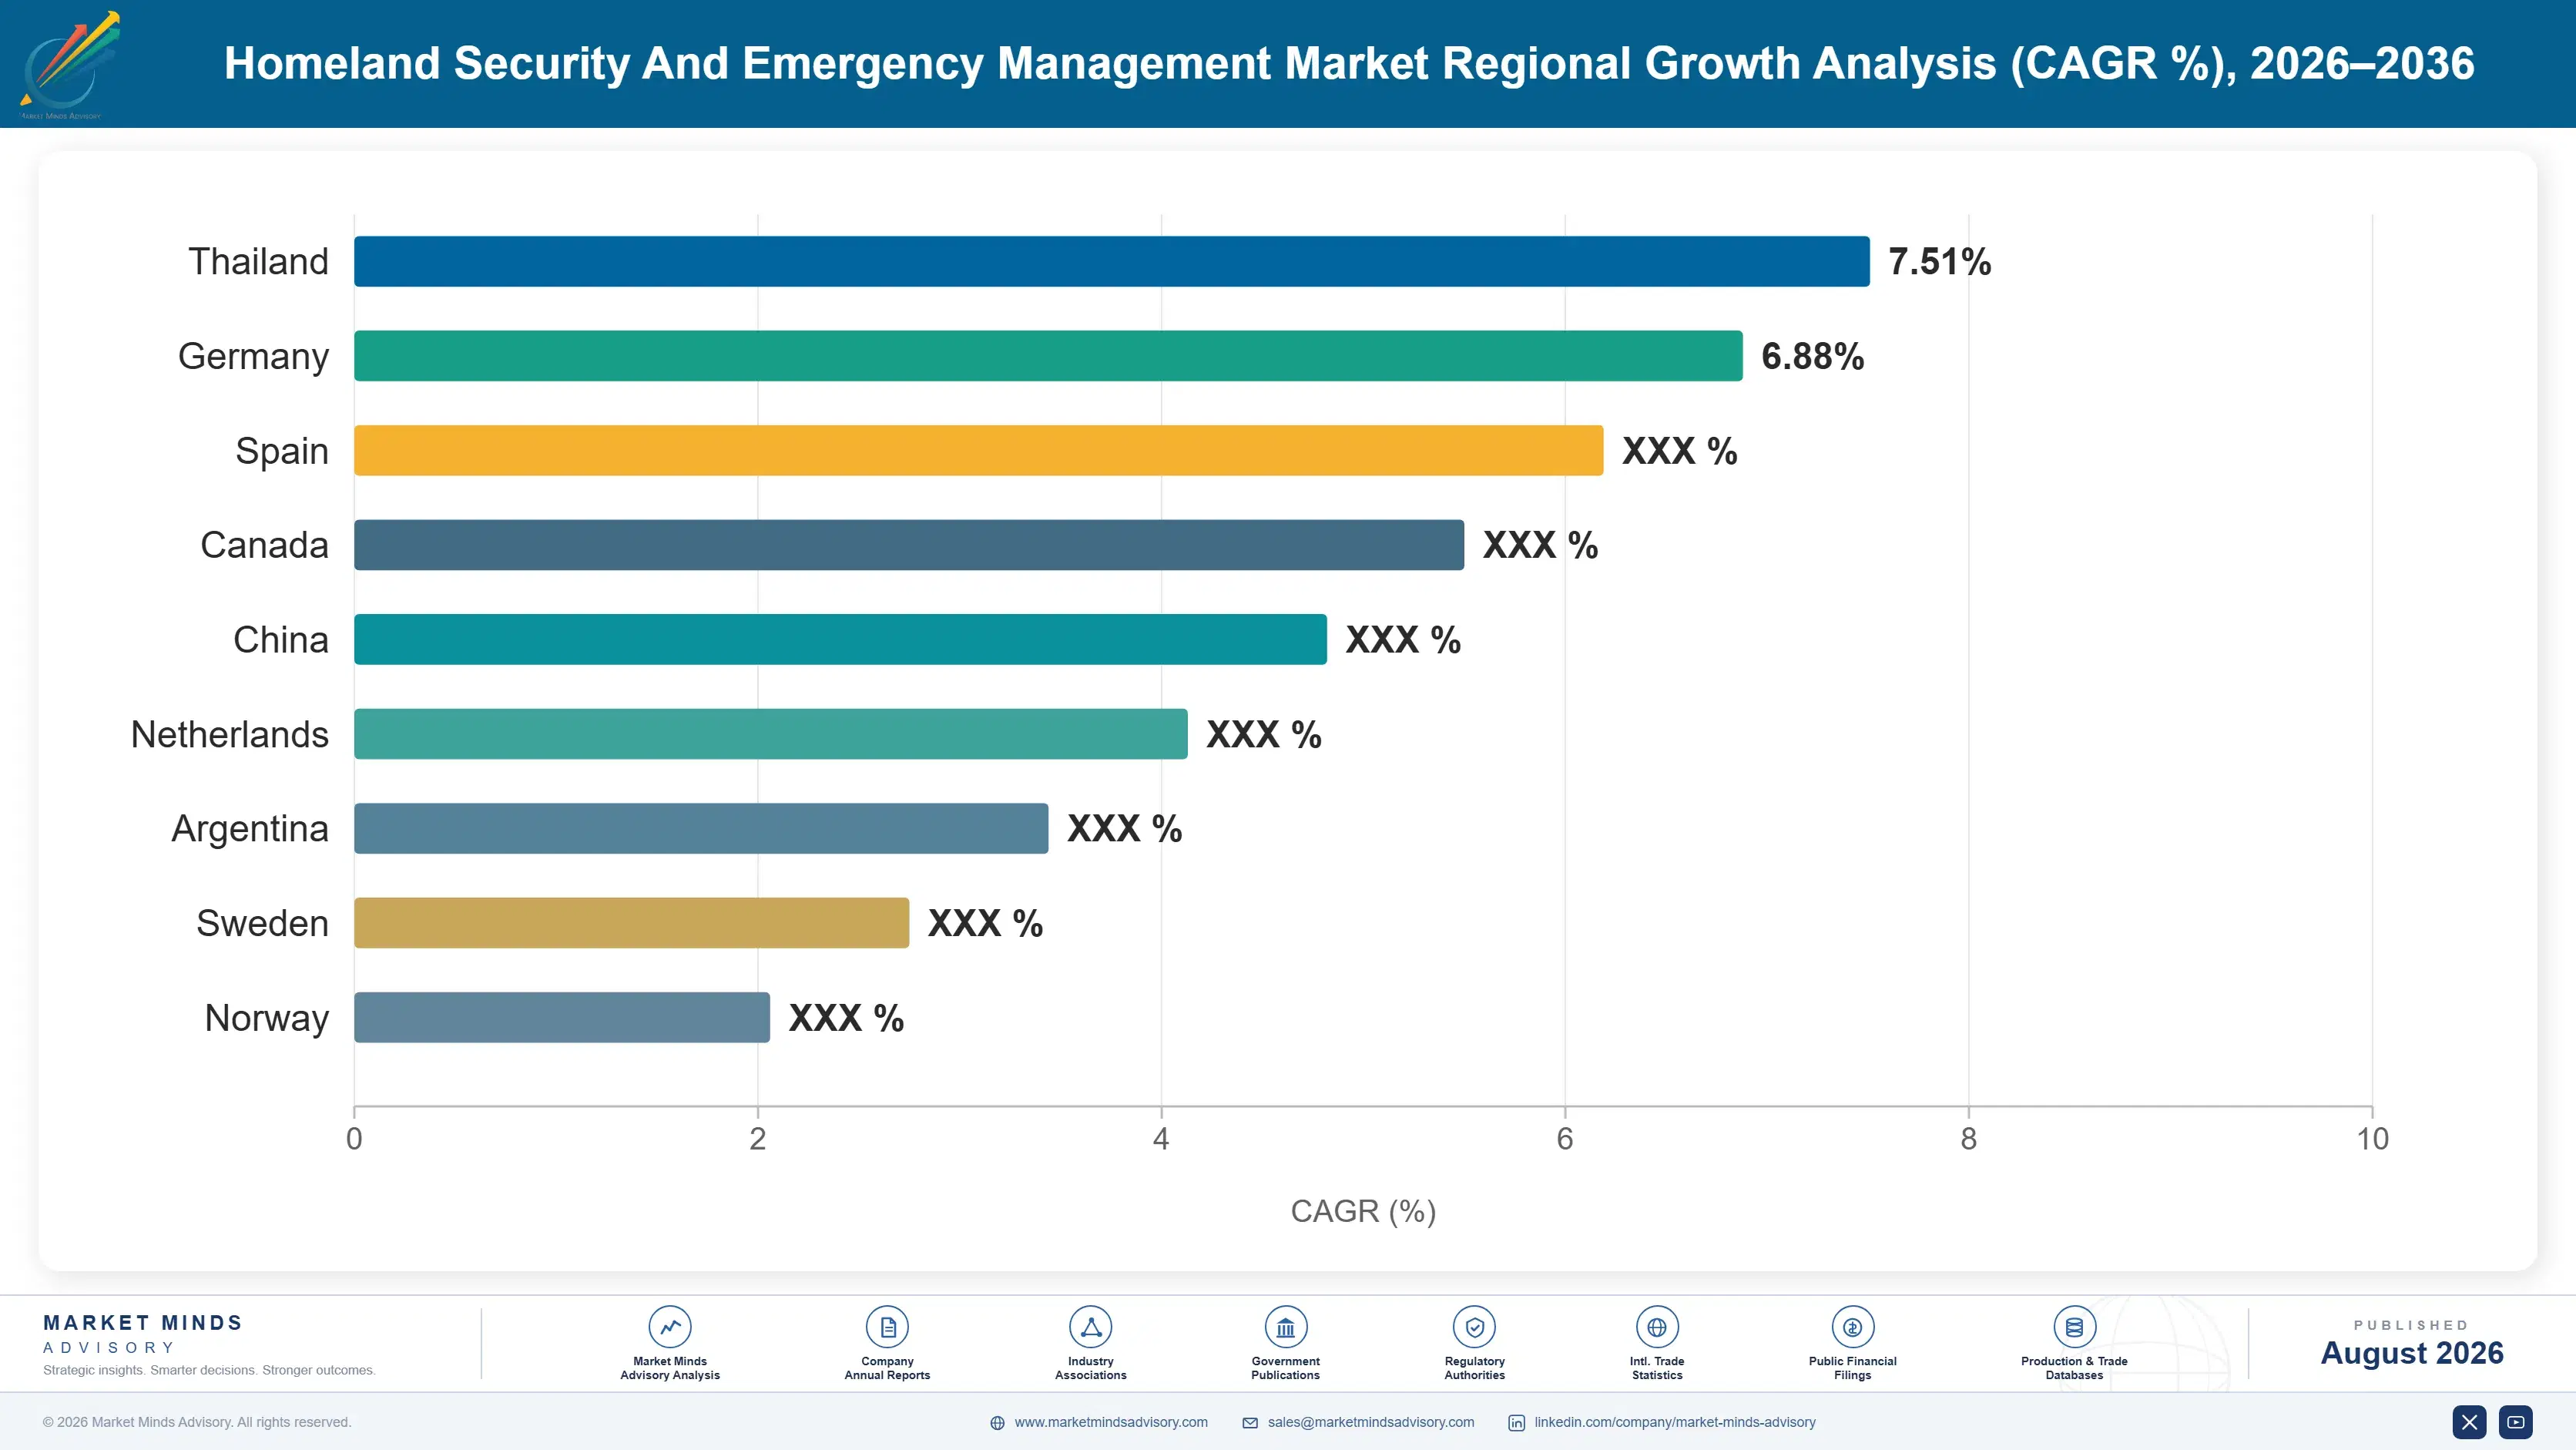
Spending follows government structure and threat exposure, so it distributes across every region maintaining civil security capability. North America leads on the scale of federal and grant funded procurement, with East Asia and Western Europe both holding substantial positions driven by internal security investment and regulatory obligation.

North America

The largest share sits here at 30%, carried by federal agency procurement and by grant programmes funding roughly 44% of local capability across some 39,000 independent purchasing authorities. That structure is the most fragmented anywhere and it is deliberate rather than accidental, resting on a constitutional preference for local control that no efficiency argument has ever displaced. Counter-drone authority has been extended narrowly to specific federal bodies while thousands of sites remain unable to act lawfully, which caps a market whose demand nobody disputes. A structure that produces the most fragmented buying anywhere while also holding the largest budget is a combination no supplier finds at all easy to serve profitably.
Share: 30% | CAGR: 6.2% (2026 to 2036)

Western Europe

Regulatory obligation drives more of this region's spending than direct procurement does. Network and information security rules oblige private operators of utilities, transport and health infrastructure to assess, report and mitigate at their own cost, creating commercial buyers where public budgets previously sat. Cross-border coordination mechanisms fund shared response capability that individual states could not justify alone. Counter-drone authority remains fragmented across national aviation and policing law, which produces exactly the detection-without-mitigation pattern seen elsewhere. Obliging private operators to fund their own security work rather than appropriating public money for it is the most consequential procurement change this region has made in decades, and it created a commercial buyer that most established suppliers are not organised to serve at all.
Share: 22% | CAGR: 5.2% (2026 to 2036)
Regional intelligence for 5 additional markets available in the complete report: East Asia, South Asia and Pacific, Latin America, Middle East and Africa, Eastern Europe. Contact sales@marketmindsadvisory.com.
homeland-security-and-emergency-management-market-country-cagr-analysis-1788023740919

Where Security Programme Margin Sits

Four levers work on route to market, funding alignment and authority positioning rather than on product capability, which fragmented buyers here rarely evaluate comparatively. Grant programme literacy, framework schedule position, private operator entry and detection-first packaging each address something a supplier controls without waiting for a consolidation nobody has ever delivered. Product rarely decides.

Build Grant Programme Literacy As A Capability

Around 44% of local capability is funded through central government grant programmes whose eligibility rules effectively determine what gets bought, so a product mapping cleanly onto a funded category sells and one that does not is invisible whatever its merit. Suppliers employing dedicated grant programme specialists win municipal business at roughly 3.1 times the rate of those selling on product alone. The capability costs a small team rather than any capital. Most suppliers treat programme rules as paperwork rather than as the actual purchasing mechanism. Rules are the purchasing mechanism here.
Market Impact: Wins municipal business at 3.1 times the rate

Secure Framework Schedule Positions Before Tendering

No supplier reaches 39,000 independent purchasing authorities through any sales organisation, so pre-negotiated framework schedules are the only mechanism that puts a product in front of buyers at that scale. A listed supplier is purchasable without a tender, and a competitor without a listing frequently cannot be bought at all regardless of price. Schedule listing takes twelve to eighteen months of administrative work. Suppliers treating it as procurement overhead rather than as market access are excluded from the majority of transactions entirely. Access rather than merit is what a listing actually buys.
Market Impact: Reaches into all 39,000 separate buying authorities directly

Enter The Private Critical Infrastructure Buyer

Regulation extending security obligations to privately owned utilities, networks and transport operators created a commercial buyer funding compliance from its own balance sheet rather than from public appropriation. That buyer decides in months rather than the 19 month government cycle, negotiates commercially and pays commercially. Suppliers accustomed to public procurement report deal cycles 55% to 65% shorter in this channel. The obligation applies across 16 defined sectors and the buyers are not organised to be sold to, which is precisely the opportunity. Nobody in this channel is waiting to be approached.
Market Impact: Cuts the average deal cycle by 60% typically

Package Detection Where Mitigation Remains Unlawful

Most sites facing drone incursions may lawfully detect and identify but may not interfere with an aircraft in flight, so a supplier offering an integrated system including mitigation is selling something the customer cannot legally operate. Detection-only packages priced and positioned honestly convert at roughly 2 times the rate of full systems into non-authorised sites. The mitigation capability should be held ready rather than pitched. Suppliers leading with countermeasures into sites lacking authority are answering a question the buyer is not permitted to ask. Honesty about authority sells considerably better than capability does here.
Market Impact: Converts at 2 times the full system rate

Who Controls the Margin Pool

Concentration is the lowest of any major government market at around 24%, and it reflects the buyer structure rather than any competitive dynamic. Leidos and Booz Allen dominate federal services, Motorola Solutions holds public safety communications, Thales and RTX span border and infrastructure systems, and thousands of specialists serve municipal buyers no large supplier reaches. National preference fragments the picture further across every region.
Competition runs on three dimensions and rarely on product comparison. Route to market is first and decisive, since a supplier absent from frameworks and grant categories cannot be bought. Incumbency is second, since switching a communications or command system disrupts operations nobody will risk. Authority alignment is the third and newly important, deciding what a counter-drone supplier may lawfully sell to whom.

Pressure is arriving from adjacent markets rather than from within. Commercial technology suppliers are entering through the private critical infrastructure channel that regulation created, selling to buyers who purchase commercially and quickly. Meanwhile counter-drone specialists with no security heritage hold capability the established suppliers lack. Rankings shift against participants holding neither framework access nor counter-drone capability, since both determine reach.
homeland-security-and-emergency-management-market-company-positioning-matrix-1788023741442

Competitive Moat and Risk Dimensions

MOTOROLA SOLUTIONS

Moat: Public safety communications installed base

Motorola Solutions holds the deepest installed base in emergency communications across municipal, state and federal agencies, and switching a dispatch or radio system disrupts live operations that no agency will risk without extraordinary cause. That installed position also carries framework schedule listings reaching buyers no direct sales organisation could serve. Displacing it means accepting operational risk nobody wants to own.
MOTOROLA SOLUTIONS

Risk: Interoperability criticism recurring after incidents

Every major incident review citing communications failure implicitly questions the fragmented systems that dominant suppliers helped create, and 31% of reviews raise exactly that point. Pressure for open standards and cross-agency interoperability works against proprietary installed positions. Defending the base while appearing to support interoperability is a genuinely awkward position to hold publicly.
LEIDOS

Moat: Federal services scale and clearances

Leidos holds contract vehicles, security clearances and delivery scale across federal homeland security agencies that a competitor must accumulate over many years before it can bid meaningfully. Those vehicles are themselves the route to a substantial share of federal spending. Building comparable clearance depth and past performance history is measured in a decade rather than in any acquisition.
LEIDOS

Risk: Limited reach below federal level

Federal scale reaches a minority of the purchasing authorities in this market, and the growth is disproportionately at state, municipal and private operator level where a services organisation built for federal contracting competes poorly. Grant funded municipal buying rewards different capabilities entirely. Reaching downward means building distribution rather than winning another contract vehicle.

Players Tracked

Prominent Players

Leidos
Thales
RTX
L3Harris Technologies
Motorola Solutions

Other Key Players

Booz Allen Hamilton
General Dynamics Information Technology
Smiths Detection
Rapiscan Systems
Analogic
Teledyne FLIR
Elbit Systems
Indra Sistemas
Hexagon
Axon Enterprise
NEC Corporation
Idemia
Everbridge
Dedrone
DroneShield

Recent Developments

MAY 2024

Counter-drone authorities extended under aviation legislation

Aviation reauthorisation legislation extended limited counter-drone detection and mitigation authorities to specific federal agencies while leaving most site operators without any lawful basis for interference. This was legislative action by a national government rather than any commercial arrangement between counter-drone suppliers or any of their customers.
Signal: Extending authority to a few agencies left thousands of sites able only to watch and record.
OCTOBER 2024

European network security obligations applied to private operators

European network and information security rules became applicable to operators of essential and important services, obliging privately owned utilities, transport and health organisations to assess and manage security risk at their own expense. This was regulatory implementation rather than any commercial arrangement between suppliers and operators.
Signal: Regulation quietly created a commercial buyer in exactly the place a public budget had previously sat.
JANUARY 2025

Record billion dollar disaster count confirmed for a second year

National climate agencies confirmed a second consecutive year with an exceptionally high count of billion dollar weather and climate disasters, exhausting contingency reserves and requiring supplemental appropriation. This reflected recorded climate and economic data rather than any policy decision or commercial arrangement between market participants.
Signal: Funding models built around occasional catastrophes stopped working entirely once those events had become annual ones.

What Delivering Civil Security Costs

Programme cost divides into four components across a typical delivery. Systems integration and professional services absorb roughly 37% of contract value, reflecting a market where connecting existing equipment matters more than supplying new. Hardware and equipment run near 29%, software and platform licensing near 19%, and sustainment with training accounts for the remaining 15% on a multi-year agreement.
Fragmentation is what makes integration so large a component. Agencies buying independently accumulate equipment that does not connect, and each new programme spends heavily on making it work together before delivering anything new. Leidos and Motorola Solutions both discussed integration complexity and programme delivery pressure across recent reporting periods. That cost is a direct consequence of 39,000 authorities purchasing separately, and it recurs with every generation of equipment.

Exposure varies by customer level and funding source. Federal programmes carry compliance, clearance and reporting cost that municipal work does not, recovered through higher contract values. Grant funded municipal buying carries eligibility administration instead. Private critical infrastructure buyers carry neither, which is why deal cycles there run so much shorter and why suppliers entering that channel find margins they had not expected to encounter.
homeland-security-and-emergency-management-market-cost-volatility-analysis-1788023741637

Framework schedule listings replacing individual tendering

Pre-negotiated schedules allow a buyer to purchase without running a tender, which removes cost from both sides and reaches authorities no sales organisation could cover. Listing takes twelve to eighteen months of administrative work before any revenue arrives. Suppliers treating that as overhead rather than as market access are excluded from most transactions in this market entirely.

Open interface commitments reducing integration burden

Equipment supplied with documented open interfaces costs less to connect in the next programme, which buyers increasingly specify after paying for integration twice. Proprietary interfaces protect installed positions and raise the cost of every subsequent programme. Suppliers defending closed systems are winning today's contract at the expense of the integration budget for the next one.

Private operator channel avoiding public procurement overhead

Regulated private operators buy commercially, decide in months rather than the 19 month public cycle, and carry none of the clearance or grant administration overhead. Serving them requires a commercial sales motion most public sector suppliers do not have. The margin difference is substantial enough that several have built separate teams for it entirely.

Portfolio Architecture for Margin Defence

The portfolio separates by who holds the budget and under what authority. Screening, detection and protective equipment form the volume layer: high unit counts, competitive tendering, frameworks that make products purchasable and margins compressed by exactly that transparency. Suppliers hold this work because it carries volume and because equipment presence establishes the relationships that larger programmes eventually run through afterwards. Nobody wins the big programme first.
Margin concentrates in integration and command systems, where connecting equipment agencies bought separately is worth more than any of the equipment. Emergency communications and command platforms are also effectively unremovable once operational, since switching disrupts live response nobody will risk. The tension is that these positions attract exactly the interoperability criticism that follows every major incident review, which is uncomfortable to defend publicly afterwards. Both things are true.

The best returns sit where authority and regulation created new buyers. Counter-drone detection and private critical infrastructure compliance both serve customers who did not exist five years ago, decide faster than government does, and compare fewer alternatives because fewer exist. Neither is large yet and both are growing considerably faster than anything else in this market.

Volume / Commodity-Adjacent

Screening, detection and protective equipment sold through frameworks and distribution. Range spans six points because framework listing and grant category alignment decide access far more than any product difference does.
Gross Margin: 8-14%

Premium / Certified

Emergency communications, command systems, border and maritime security programmes. Range spans six points because systems integration content varies enormously with how much incompatible equipment a programme must be made to connect.
Gross Margin: 12-18%

Sustainability / Regulatory / Next-Generation

Counter-drone capability, critical infrastructure cyber protection and resilience analytics. Range spans ten points because private operator buyers pay commercially while public agencies apply procurement pricing discipline to absolutely everything they buy.
Gross Margin: 16-26%
homeland-security-and-emergency-management-market-portfolio-architecture-1788023742133

High-value Sub-segments and Strategic Watch-out

Counter-Drone and Airspace Security

High value and high growth at 9.9%, expanding inside a legal gap rather than a defined requirement anywhere. The eight point range separates detection sold to sites lacking authority from full systems delivered to agencies holding it. The law decides this one, not the product.
Gross Margin: 18-26%

Disaster Response and Resilience

High value with moderate growth at 8.4%, shifting from response equipment toward mapping, prediction and mitigation infrastructure. The six point range reflects whether a supplier sells equipment or the planning capability budgets are migrating toward. Budgets are quietly migrating toward planners rather than responders now.
Gross Margin: 14-20%

Emergency Communications and Command

The volume core and the most defensible installed position in this market. Switching disrupts live response nobody will risk, which protects incumbents and attracts the interoperability criticism following every major incident review. Defending that particular position in public is genuinely awkward for everybody involved here.
Gross Margin: 12-18%

Fragmented Local Procurement

The strategic watch-out rather than a growth pool. Some 39,000 independent authorities means no programme reaches scale, unit costs stay high, and every inquiry recommending consolidation is accepted and then quietly ignored. Nothing about that has changed across twenty-five years of published public inquiries either.
Gross Margin: Variable

Why Incidents Drive Every Budget

Demand in this market is generated by events rather than by planning, which makes it simultaneously unpredictable and entirely reliable. A major incident produces an inquiry, the inquiry produces recommendations, and the recommendations produce appropriations that arrive twelve to twenty-four months afterward. Suppliers who understand that sequence position ahead of the funding rather than responding to a tender, because by tender stage the specification usually reflects somebody else's briefing.
Stickiness varies by how operationally embedded the system is. Emergency communications and command platforms are effectively permanent, since switching disrupts live response that agencies cannot pause. Screening and detection equipment moves at replacement cycles and competes on framework pricing. Counter-drone systems are the least attached of all, being newly bought, rapidly evolving and frequently procured under authority arrangements that may change with the next legislative session.

The buyer population is broadening in a way suppliers have not matched. Regulation created private critical infrastructure buyers who purchase commercially and quickly, while grant programmes made central government the effective decision maker for municipal purchases. Neither buyer resembles the federal agency customer most suppliers organised around. Very few have built the separate commercial motions those channels genuinely require.
homeland-security-and-emergency-management-market-end-use-penetration-index-1788023742624

Where Security Suppliers Should Commit

These are among the four positions where our research anticipates prominent divergence between winners and laggards over the coming forecast period. Each is grounded in the demand model, the regulatory perimeter, and the announced capacity pipeline.
01 / GRANT PROGRAMME LITERACY

Eligibility rules decide purchases, not product merit

Around 44% of local capability is funded through central government grant programmes whose eligibility rules effectively determine what gets bought at municipal level everywhere. A product mapping cleanly onto a funded category sells, and one that does not remains entirely invisible whatever its technical merit happens to be. Suppliers employing dedicated grant programme specialists win municipal business at roughly 3.1 times the rate of those selling on product alone, and the capability costs a small team rather than any capital.
02 / FRAMEWORK ACCESS POSITION

Thirty-nine thousand buyers cannot be sold to directly

No supplier reaches all 39,000 independent purchasing authorities through any sales organisation that could be economically justified, so pre-negotiated framework schedules are the only mechanism putting a product in front of any buyers at that scale. A listed supplier is purchasable without any tender at all, while a competitor without a listing frequently cannot be bought at all regardless of its price or capability. Listing takes twelve to eighteen months of administrative work that most suppliers treat as mere administrative overhead.
03 / PRIVATE OPERATOR CHANNEL

Regulation created a buyer that pays commercially

Rules extending security obligations to privately owned utilities, networks and transport operators everywhere created a genuinely commercial buyer funding compliance from its own balance sheet rather than from any public appropriation whatsoever. That buyer decides in months rather than the 19 month government procurement cycle, negotiates commercially and then pays commercially throughout. Suppliers accustomed to public procurement report deal cycles some 55% to 65% shorter in this channel, and those buyers are not organised to be sold to at all.
04 / AUTHORITY ALIGNED PACKAGING

Do not sell what the customer cannot lawfully operate

Most sites facing drone incursions may lawfully detect and identify but may not interfere with an aircraft in flight under almost any circumstances, so an integrated system including mitigation offers something the customer cannot legally use. Detection-only packages priced and positioned honestly convert at roughly twice the rate of full systems into sites without any authority. Mitigation capability should be held ready rather than pitched, since leading with it answers a question the buyer is not actually permitted to ask.

Engagement Snapshot From the Field

A live engagement with an industry participant carrying material or product regulatory and market exposure ahead of a defining policy shift, showing how our research translates into a defensible multi-year portfolio strategy.
MARKET MINDS ADVISORY · CLIENT ENGAGEMENT SUMMARY
Homeland Security And Emergency Management Producer Strategic Portfolio Review and Transition Roadmap 2026·Investment Scenario on Homeland Security And Emergency Management Exposure Evaluation 2025-26
CLIENT PROFILE
A security systems manufacturer supplying detection and screening equipment to federal agencies through direct sales and a small integrator network, with no municipal presence and no private sector channel. Revenue had been flat for five years while the wider market grew, and management attributed the gap to federal budget pressure rather than to the parts of the market it had never attempted to reach.
STRATEGIC CHALLENGE
The board needed to understand why a growing market was not producing growth, and whether reaching municipal and private buyers was realistic for an organisation built entirely around federal contracting. It also held counter-drone detection capability it had been unable to sell, having packaged it with a mitigation system that most prospective sites had no lawful authority to operate.
MMA APPROACH
MMA analysed five years of the client's pipeline by customer level and funding source, separating federal from grant funded and private opportunities and identifying where each was lost or never entered. Expert interviews with municipal buyers, grant administrators, framework schedule authorities and regulated private operators established what each channel actually requires from a supplier.
KEY FINDINGS
  1. Federal spending in the client's categories had grown 19% across the period, so budget pressure did not explain flat revenue in any of the segments examined.
  2. The client held no framework schedule listing, which meant municipal buyers could not purchase from it without running a full tender that none of them would undertake.
  3. Counter-drone opportunities had been lost in eleven of twelve cases because the packaged mitigation function required authority the prospective sites did not hold.
  4. No private critical infrastructure opportunities had ever been pursued, despite regulation obliging operators across sixteen sectors to fund that security work entirely themselves.
CLIENT PROFILE
A security systems manufacturer supplying detection and screening equipment to federal agencies through direct sales and a small integrator network, with no municipal presence and no private sector channel. Revenue had been flat for five years while the wider market grew, and management attributed the gap to federal budget pressure rather than to the parts of the market it had never attempted to reach.
STRATEGIC CHALLENGE
The board needed to understand why a growing market was not producing growth, and whether reaching municipal and private buyers was realistic for an organisation built entirely around federal contracting. It also held counter-drone detection capability it had been unable to sell, having packaged it with a mitigation system that most prospective sites had no lawful authority to operate.
MMA APPROACH
MMA analysed five years of the client's pipeline by customer level and funding source, separating federal from grant funded and private opportunities and identifying where each was lost or never entered. Expert interviews with municipal buyers, grant administrators, framework schedule authorities and regulated private operators established what each channel actually requires from a supplier.
KEY FINDINGS
  1. Federal spending in the client's categories had grown 19% across the period, so budget pressure did not explain flat revenue in any of the segments examined.
  2. The client held no framework schedule listing, which meant municipal buyers could not purchase from it without running a full tender that none of them would undertake.
  3. Counter-drone opportunities had been lost in eleven of twelve cases because the packaged mitigation function required authority the prospective sites did not hold.
  4. No private critical infrastructure opportunities had ever been pursued, despite regulation obliging operators across sixteen sectors to fund that security work entirely themselves.
RECOMMENDED STRATEGY
Phase 1: Phase one: apply for framework schedule listing immediately and recruit grant programme specialists to map products onto the relevant funded categories. Phase 2: Phase two: repackage counter-drone detection separately from mitigation, pricing and positioning it for sites that may lawfully detect but not mitigate. Phase 3: Phase three: build a commercial sales motion for regulated private operators, staffed separately separately from the existing federal contracting organisation.
OUTCOME
The client reported municipal orders beginning within two quarters of framework listing (client-reported, unverified by MMA), against none previously. Detection-only counter-drone packages won five of nine subsequent opportunities. The private operator channel produced its first contracts in the fifth quarter, at deal cycles roughly a third of federal equivalents.

Frequently Asked Questions

Foundational context covering the market sizes, CAGR, scope, country, region and competition that inform every finding below. This section is provided to cover basics and most often pre-purchase conversations, answered from the MMA Primary Research Dataset.

What is the current size of the Homeland Security And Emergency Management Market?

The market is valued at USD 162.0 billion in 2025, measured as government and regulated operator spending on security and emergency management systems, equipment and contracted services.

How large will the Homeland Security And Emergency Management Market be by 2036?

MMA forecasts USD 327.20 billion by 2036, up from USD 172.69 billion in 2026. That represents incremental spending of USD 154.51 billion and an expansion multiple of 1.89 times.

What is the CAGR for the Homeland Security And Emergency Management Market 2026 to 2036?

The base case CAGR is 6.6%, with a bull case of 7.8% and a bear case of 5.4%. Counter-drone capability and climate resilience supply most of that growth.

Which segment is growing fastest?

Counter-drone and airspace security grows at 9.9%, half again the market rate of 6.6%. It expands inside a legal gap that no single authority yet clearly owns.

Who are the major companies in the Homeland Security And Emergency Management Market?

Leidos, Thales, RTX, L3Harris Technologies and Motorola Solutions lead on contract award value, holding around 24% between them right across an exceptionally fragmented global market.

Which country is growing fastest?

India grows fastest at 8.6%, driven by border management, urban surveillance and disaster response investment together at a pace no other market anywhere currently matches.

Report Segmentation Architecture

The full report scope spans multiple orthogonal segmentation dimensions, with cross-tabulated demand data provided for each dimension pair. Coverage extends further to regional breakdowns, trend trajectories, and the competitive detail needed to support segment-level decision-making.

By Mission Area

  • Border and Maritime Security
  • Critical Infrastructure Protection
  • Screening and Detection Systems
  • Emergency Communications and Command
  • Disaster Response and Resilience
  • Counter-Drone and Airspace Security

By End-Use Industry

  • Federal and National Agencies
  • State and Regional Government
  • Municipal and Local Responders
  • Transport and Aviation Operators
  • Utilities and Energy Networks
  • Private Critical Infrastructure

By Commercial Dimension

  • Direct Agency Contracting
  • Grant Funded Local Procurement
  • Framework and Schedule Purchasing
  • Managed Service Provision
  • Systems Integration Programmes
  • Equipment Supply and Distribution

By Region

  • North America
  • Western Europe
  • East Asia
  • South Asia and Pacific
  • Latin America
  • Middle East and Africa
  • Eastern Europe

Scope, Methodology, and Coverage

Every figure in this report is reproducible from documented input assumptions. The scope below maps the historical period, the forecast horizon, the segmentation dimensions, and the countries covered, alongside the underlying primary and qualitative methodology.
Historical Period
2020 to 2025
Forecast Period
2026 to 2036
Base Year
2025 (USD billions; MMA Primary Research Dataset, August 2026)
Market Definition
Government and regulated operator spending on homeland security and emergency management systems, equipment and contracted services, spanning border and maritime security, critical infrastructure protection, screening and detection systems, emergency communications and command, disaster response and resilience, and counter-drone and airspace security. Direct agency contracting, grant funded local procurement, framework purchasing, managed services, systems integration and equipment distribution are included. Uniformed personnel salaries and pensions, military defence procurement, routine policing unrelated to security systems, and commercial security services for non-critical premises are excluded.
Quantitative Units
USD billions, contract award value
Segmentation Dimensions
Mission area, end-use buyer level, commercial procurement dimension, region
Regions Covered
North America, Western Europe, East Asia, South Asia and Pacific, Latin America, Middle East and Africa, Eastern Europe
Countries Covered
United States, Canada, United Kingdom, France, Germany, Poland, China, Japan, South Korea, India, Australia, Brazil, Mexico, Saudi Arabia, United Arab Emirates
Key Companies Profiled
Leidos, Thales, RTX, L3Harris Technologies, Motorola Solutions, Booz Allen Hamilton, Smiths Detection, Teledyne FLIR, Axon Enterprise, DroneShield
Quantitative Methodology
Primary survey, n=3,800 respondents, Q4 2025, six countries; demand-side model with trade association cross-validation
Qualitative Methodology
47 expert interviews, Q4 2025; applied to validate demand model assumptions, identify emerging dynamics, and assess competitive positioning
Report Format
PDF and XLSX data workbook (Word format preview document)
Publisher
Market Minds Advisory
Report Code
MMA-2026-TEC-441
Published
August 2026
Contact
sales@marketmindsadvisory.com | www.marketmindsadvisory.com

Purchase the full Homeland Security And Emergency Management Market Report (2026 to 2036).

The full report treats homeland security as a route to market problem rather than a capability one, and shows why the most capable product frequently cannot be bought. It quantifies how grant eligibility and framework listing determine access across tens of thousands of independent purchasing authorities, models the integration cost that fragmentation generates in every programme, and maps counter-drone demand against the authority sites actually hold. Segment analysis covers all six mission areas, with particular attention to the private critical infrastructure buyer regulation created. Competitive assessment ranks twenty participants on contract award value across every spending region.
Six mission area segmentation with growth rates
Grant eligibility mapped against product categories
Twenty participant assessment on contract award value
Integration cost attributable to buyer fragmentation
Counter-drone demand against lawful site authority
Private operator deal cycles versus public procurement

Built For The People Who Decide

From boardroom strategy to bench-side execution, this report is read cover-to-cover by leaders shaping the next decade of their industry, turning demand scenarios, market dynamics and valuation benchmarks into decisions.
CXOs/ Presidents/ VPs/ Managers
M&A and Corporate Development
Strategy Teams and R&D Heads
Procurement and Product Directors
Regulatory and Compliance Leaders
Investor Relations and Equity Analysts