Market Minds Advisory
Home Sleep Screening Devices Market

Home Sleep Screening Devices Market: Peripheral Arterial Tonometry and Telehealth Diagnostic Adoption

Payers and sleep clinics are shifting diagnosis away from costly overnight polysomnography toward home-based screening as validated peripheral arterial tonometry devices finally give physicians confidence to diagnose obstructive sleep apnea outside a lab.

Lead Analyst

Alice Ballenger

Published

September 2026

Make Smarter Decisions with Customized Research Insights

Request a free sample report and evaluate market opportunities, growth trends, and competitive dynamics relevant to your business needs.

2025 MARKET VALUE$2.6BMarket Size 2025
2036 FORECAST VALUE$7.3BBase Case , 2026 to 2036
CAGR 2026 TO 20369.8 %Bull 11.0% / Bear 8.5%
INCREMENTAL OPPORTUNITY$4.4BNet 10- year value creation
EXPANSION MULTIPLE2.55x2036 value over 2026 base
Strategic Levers
M&A Pipeline
Regional Outlook
Country Rankings
Competitive Intelligence
Segmental Deep-dive
Call-Us : 91 93563 13602

Executive Snapshot and Market Trajectory

Home sleep screening is converting obstructive sleep apnea diagnosis from a costly, capacity-constrained overnight lab procedure into a same-week, physician-ordered home test, as validated peripheral arterial tonometry devices finally close the accuracy gap that kept payers cautious for years. That shift accelerated faster than expected.
Peripheral arterial tonometry devices lead every other category on growth as clinics convert diagnostic backlog into home testing capacity. India has become the fastest-growing single country, anchored by a massive undiagnosed apnea population and expanding telehealth infrastructure, while North America commands the largest share of spending given its dense sleep clinic network. Type III cardiorespiratory monitors remain the largest product category by volume across nearly every market.
Competitive character splits between a handful of established sleep diagnostics manufacturers and a smaller field of software-first entrants competing on cloud analytics and remote physician review capability. Regulatory pressure cuts in the industry's favor here: expanding payer coverage for home sleep testing and tightening in-lab capacity are pushing clinics toward validated portable devices ahead of typical equipment replacement cycles. Vendors slow to align risk losing referral momentum entirely across every account they currently hold.
Market Definition
The home sleep screening devices market covers portable diagnostic devices, sensors, and companion software used to screen and diagnose obstructive sleep apnea and related sleep-disordered breathing outside a monitored sleep laboratory setting. It excludes in-lab polysomnography systems requiring overnight technician supervision and excludes continuous positive airway pressure therapy devices used for ongoing treatment rather than diagnosis.
Base Year Value
$2.6B in 2025 (MMA Primary Research Dataset, August 2026)
Forecast Period
2026 to 2036, eleven discrete annual values
CAGR
9.8% base case. Bull 11.0%. Bear 8.5%.
Fastest Growth Segment
Peripheral Arterial Tonometry Devices: 14.2% CAGR
Fastest Growth Country
India: 13.5% CAGR
Fastest Growth Region
South Asia and Pacific: 12.0% CAGR
Largest Region
North America: 32% of 2025 global value
Market Leaders
ResMed Inc., Koninklijke Philips N.V., Natus Medical Incorporated, Itamar Medical Ltd., Nox Medical ehf. Source: MMA Analysis based on company annual reports.
Primary Survey
n=3,800 procurement and R&D decision-makers, Q4 2025, six countries
Methodology
Demand-side build-up, cross-validated against public data, 47 expert interviews

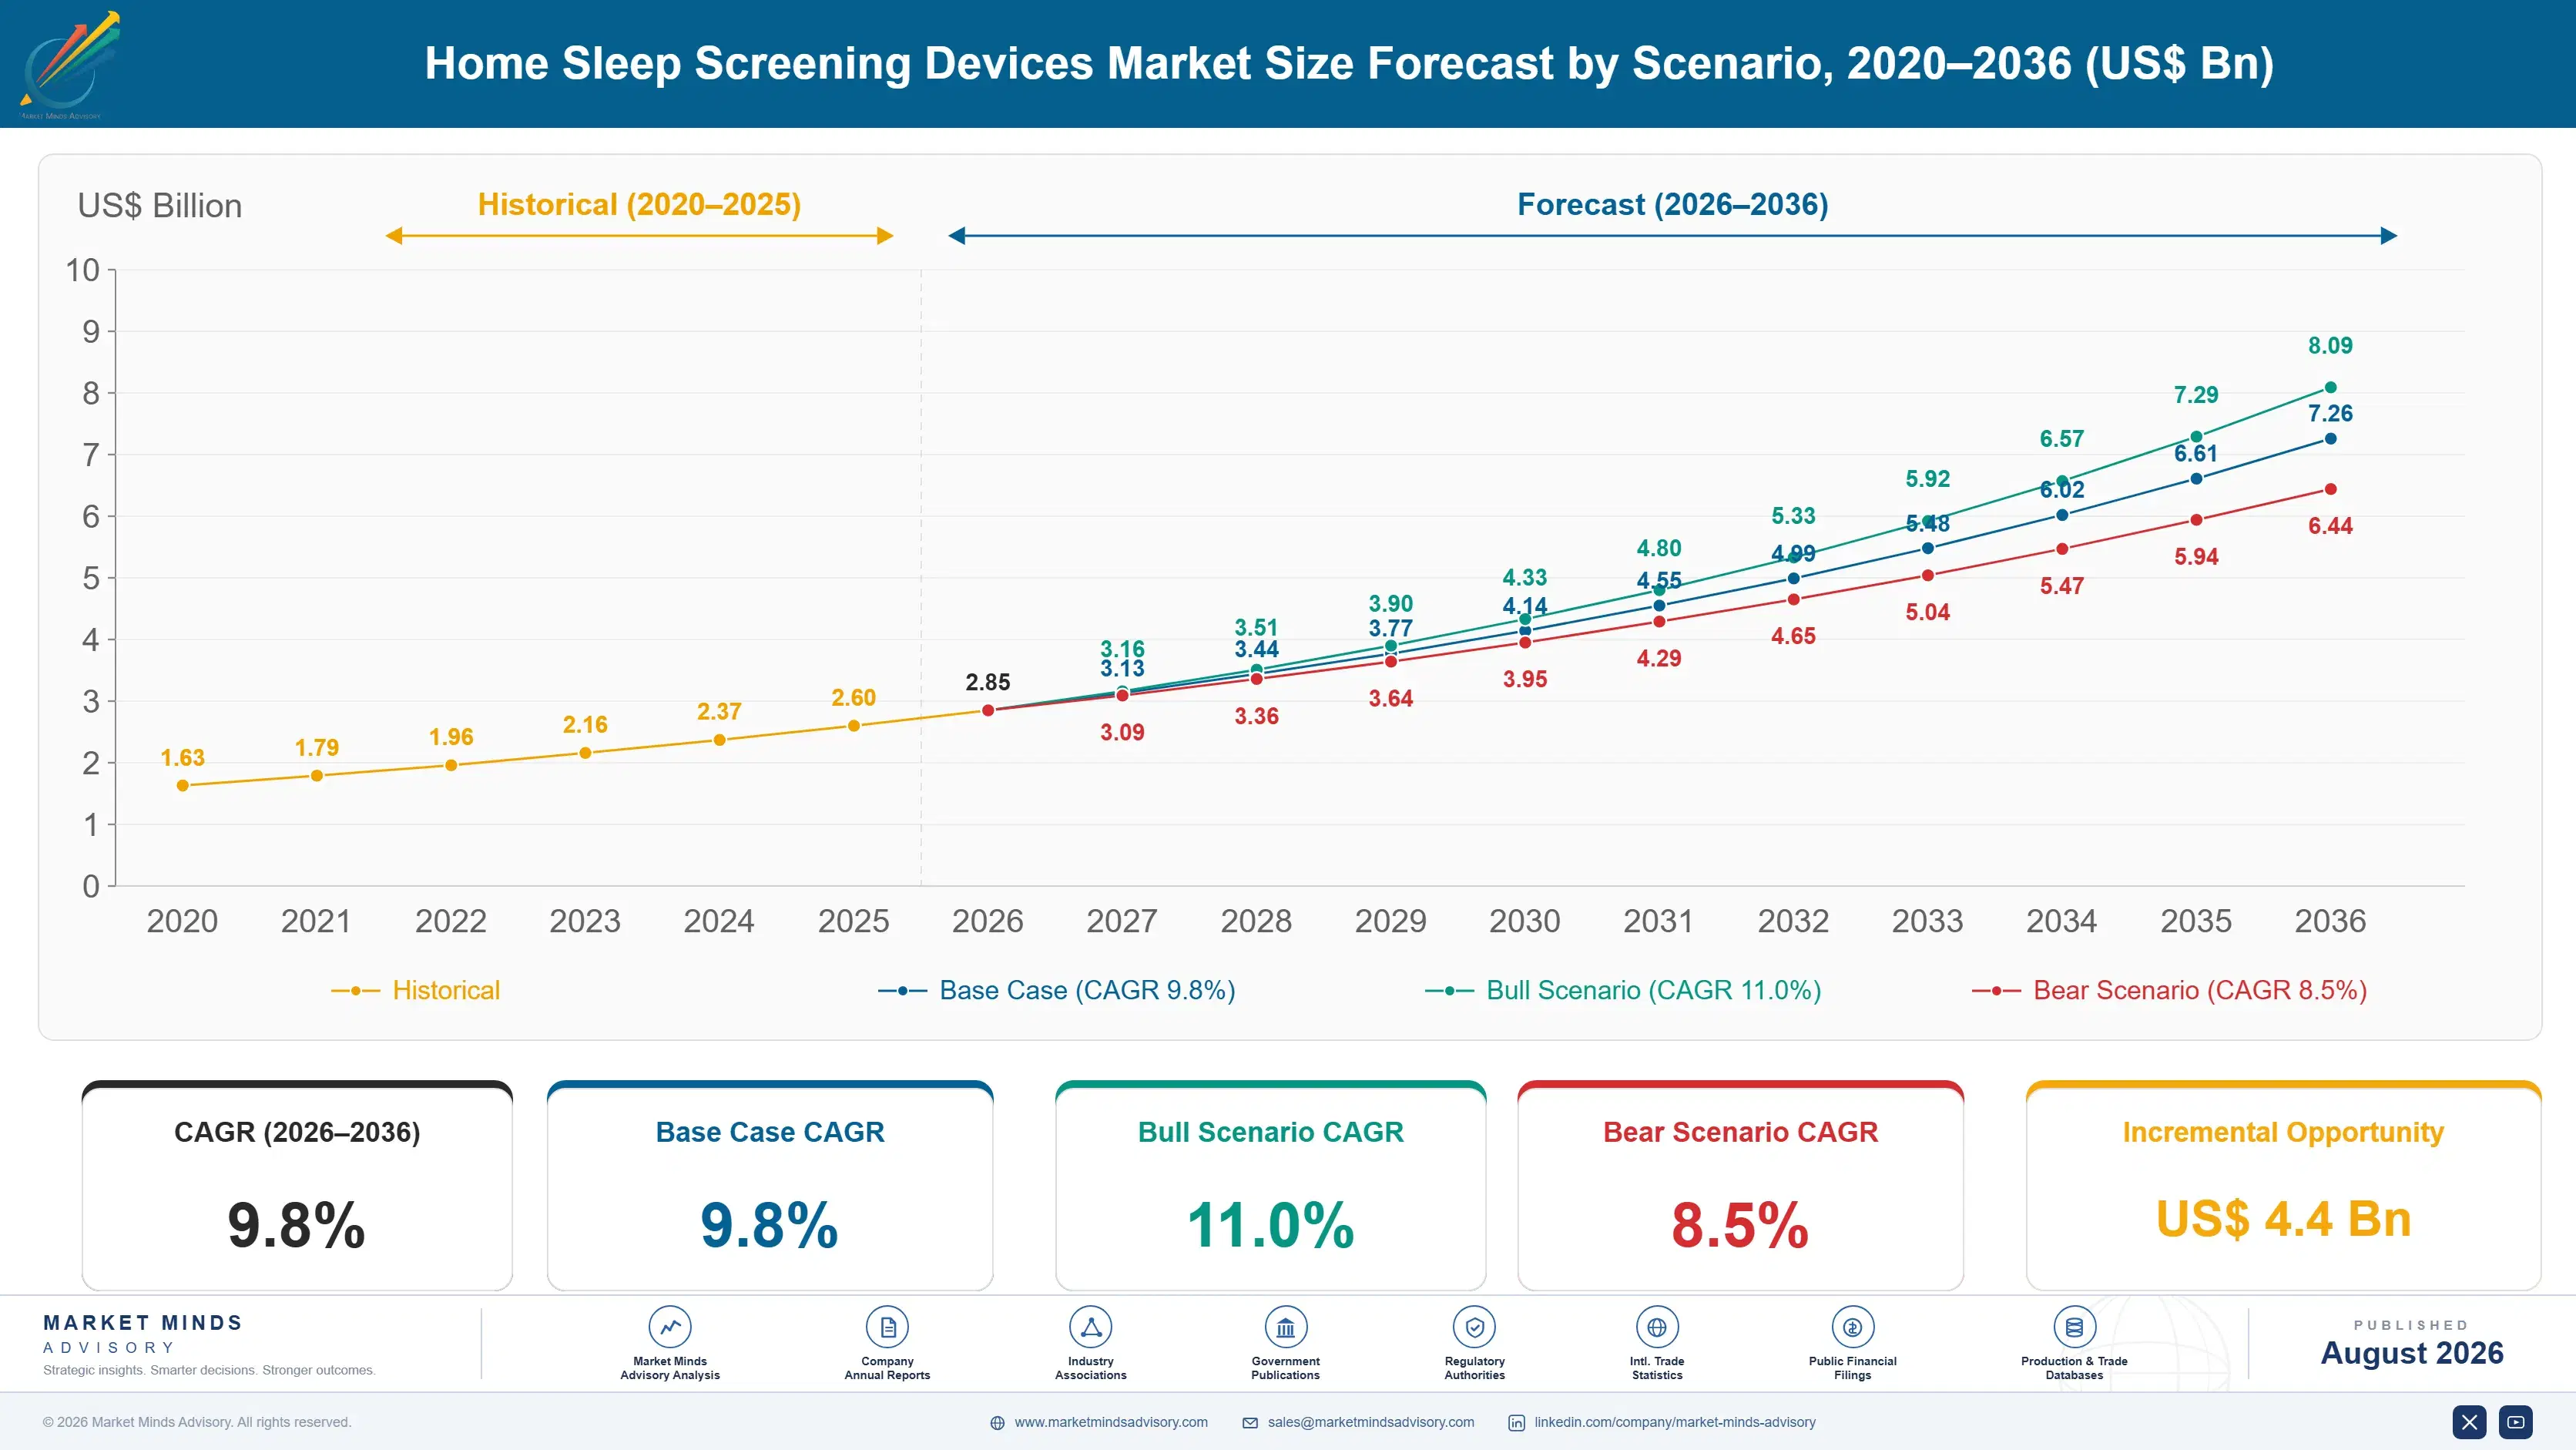
Home Sleep Screening Devices Market Forecast Scenarios

home-sleep-screening-devices-market-size-forecast-scenario-1787303179810
Home sleep screening device demand grew steadily but unevenly between 2020 and 2025. Pandemic-era telehealth expansion briefly accelerated home testing adoption, then a return to in-lab options moderated growth through 2022 before validated peripheral arterial tonometry devices and payer coverage expansion restored momentum, lifting historical growth to an estimated 8.6% compound rate. That coverage expansion took longer to reach smaller regional payers than expected.
The base case assumes 9.8% annual growth through 2036, anchored on three mechanisms. First, expanding payer coverage for home sleep testing keeps converting diagnostic volume away from costlier in-lab polysomnography. Second, peripheral arterial tonometry accuracy data keeps clearing the confidence bar physicians require before shifting workflow decisively toward home-based testing. Third, cloud-connected analytics keep expanding clinic capacity without proportional staffing growth, letting practices process rising testing volume efficiently over time.
A bull case builds if payer coverage expansion accelerates faster than currently expected, pushing growth toward 11.0%. The bear risk is diagnostic accuracy scrutiny: if regulators or payers raise validation requirements for complex apnea cases beyond current device capability, referral volume could shift back toward in-lab testing, capping growth near 8.5% across the forecast period. Either outcome depends heavily on how quickly payer coverage policy stabilizes.

From Overnight Lab Procedure to Same-Week Home Test

Home sleep screening devices remain a well-established diagnostic category, but the market is undergoing a genuine, lasting shift as validated peripheral arterial tonometry devices and cloud analytics convert home testing from a payer-resisted alternative into the default first-line diagnostic pathway. Device accuracy still matters enormously, but software integration and remote review capability increasingly decide which vendor a clinic specifies for fleet-wide deployment.
MARKET CONCENTRATION44% CR5Five manufacturers hold just under half of category revenue
AVERAGE SELLING PRICE$620 per home testing deviceBlended price across Type II through Type IV devices overall
LEADING PRODUCT CATEGORY SHAREType III monitors, 41%One product category still dominates total testing volume
DEVICE REUSE CYCLE58 tests per device annuallyClinics circulate devices across patients before replacement occurs
DIAGNOSTIC TURNAROUND IMPROVEMENT68% faster than in-lab testingHome testing meaningfully shortens time to confirmed diagnosis today
INPUT COST SHARE29% of device COGSSpecialized sensors and wireless connectivity components dominate cost
Manufacturers compete less on raw sensor accuracy alone than on demonstrated clinical validation and workflow integration data: clinics specify devices with documented diagnostic concordance against in-lab polysomnography rather than switching for marginal cost advantages on unproven hardware. Manufacturing remains concentrated in the United States, Iceland, and Germany, while India's domestic device assembly base is expanding rapidly to serve its own growing telehealth-driven testing volume.
The next decade will be shaped by two forces pulling in the same direction: expanding payer coverage recognizing home testing as clinically equivalent for most patient populations, and cloud-connected software finally letting clinics scale review capacity without proportional staffing growth. Both push investment toward validated, software-integrated devices even as smaller clinics weigh fleet replacement cost against still-developing reimbursement clarity for complex apnea cases specifically.
"Patients didn't want to sleep in a lab with wires taped to their scalp. They wanted the test to come to them. That's the whole story here."
Director, Diagnostic Devices and Digital Health Practice · MMA Medical Devices P

Market Trends

Peripheral Arterial Tonometry Validation Expands Payer Confidence

Peripheral arterial tonometry devices, measuring blood vessel constriction patterns linked to apnea events rather than relying solely on respiratory airflow sensors, have accumulated a growing body of validation data demonstrating diagnostic concordance with in-lab polysomnography across a widening range of patient populations. This is converting payer skepticism into active coverage expansion, as insurers increasingly recognize peripheral arterial tonometry testing as clinically equivalent to costlier in-lab alternatives for most routine diagnostic cases encountered in practice. Manufacturers with the deepest validation data are capturing disproportionate share of new clinic fleet purchasing decisions as this payer confidence continues broadening across additional reimbursement markets.
Market Impact: Adds 5.2 million newly screened pat

Cloud-Connected Analytics Expand Clinic Review Capacity

Software platforms applying automated scoring algorithms to raw device sensor data, paired with remote physician review workflows, are letting sleep clinics process meaningfully higher testing volume without proportional growth in credentialed reviewing staff, addressing a capacity constraint that has limited home testing scale-up for years. This is converting cloud analytics from an optional convenience feature into a core purchasing requirement, since clinics increasingly cannot justify fleet expansion without the review efficiency software delivers. Manufacturers with validated automated scoring platforms are capturing disproportionate share of large clinic network purchasing decisions as this capacity constraint continues easing industry-wide.
Market Impact: Adds 22 percent rural testing acces

Market Opportunities and Growth Drivers

Massive Undiagnosed Population Sustains Base Testing Demand

A substantial share of the population living with clinically significant obstructive sleep apnea remains undiagnosed across nearly every major market tracked here, sustaining home sleep testing as the category's largest demand driver regardless of any single manufacturer's technology approach. Primary care referral pathways into sleep medicine continue strengthening as general practitioners grow more comfortable ordering home tests directly rather than routing every suspected case through a specialist consultation first. Manufacturers investing in primary care physician education and faster ordering workflows are capturing disproportionate share of this expanding referral base as awareness improves across healthcare systems.
Market Impact: Routes 24% of cases back

Telehealth Infrastructure Growth Expands Testing Access

Continued expansion of telehealth consultation infrastructure, allowing patients to complete an initial sleep medicine evaluation remotely before a home testing device ships directly to their address, is converting home sleep testing from a clinic-visit-dependent process into one patients can complete almost entirely outside a physical office setting. This telehealth-enabled pathway disproportionately benefits patients in rural and underserved areas who previously faced meaningful travel barriers to specialist sleep clinics offering in-lab or even home testing referrals. Manufacturers partnering directly with telehealth platforms are capturing disproportionate share of this expanding remote-access patient population as telehealth infrastructure investment continues broadening across healthcare systems.
Market Impact: Limits fleet throughput by 19 perce

Market Restraints and Challenges

Complex Apnea Cases Still Require In-Lab Confirmation

Home sleep testing devices remain less reliable for patients with complex comorbid conditions, including significant cardiopulmonary disease or suspected central sleep apnea, requiring these cases to route back toward costlier in-lab polysomnography regardless of how much home testing technology improves. The root cause is that peripheral signal-based monitoring genuinely cannot capture the full physiological picture complex cases require, a limitation current device generations have not fully solved despite substantial validation investment. Some manufacturers are mitigating this by building clearer clinical triage algorithms that route complex cases toward in-lab testing earlier, preserving home testing credibility for cases it handles reliably.
Market Impact: Adds 31% to payer-covered testing v

Device Reprocessing Requirements Limit Fleet Efficiency

Reusable home testing devices require documented cleaning and reprocessing between patients under infection control protocols, creating genuine logistical friction that limits how quickly clinics can circulate a given device fleet across a growing patient queue. The underlying cause is that reprocessing turnaround time does not scale down proportionally with rising testing demand, since certain minimum cleaning and quality verification steps cannot be meaningfully compressed regardless of clinic staffing levels. Clinics are mitigating this by expanding device fleet size and adopting disposable sensor components rather than waiting for reprocessing turnaround times to improve on their own.
Market Impact: Lifts clinic review capacity 26 per
3 additional market trends, 4 additional growth drivers, and 2 additional restraints and challenges are covered in the full report. Contact sales@marketmindsadvisory.com to access the complete intelligence.

Segment CAGR and Growth Architecture

MMA segments the market by product and technology type, the classification clinics and payers use when specifying devices and comparing vendor capability across competing fleet purchasing decisions. This avoids blending upstream sensor technology with the downstream diagnostic application categories that define how a given device is actually purchased and reimbursed across every major clinic procurement decision made today.
home-sleep-screening-devices-market-market-share-analysis-1787303180347

Peripheral Arterial Tonometry Devices

Peripheral arterial tonometry devices, measuring blood vessel constriction patterns as a proxy for apnea events rather than relying solely on airflow sensors, remain the fastest-growing category as payer validation data continues expanding coverage recognition across additional patient populations. Growth concentrates wherever payer coverage clarity intersects with clinic willingness to standardize fleet purchasing around a single validated technology, particularly across North America and increasingly India's expanding telehealth-driven testing infrastructure. Itamar Medical and ResMed have each expanded validation study breadth, recognizing that demonstrated diagnostic concordance decides which vendor captures a clinic's fleet relationship. At a 14.2% forecast CAGR, roughly 1.4 times the market average, this segment is pulling capital investment toward validation studies faster than any other category.
CAGR 14.2%

Companion Software and Cloud Analytics Platforms

Companion software and cloud analytics platforms, applying automated scoring algorithms to raw sensor data and supporting remote physician review workflows, track clinic capacity expansion more directly than any other segment, making review efficiency a disproportionate growth driver for this category specifically. Philips and Natus Medical lead on platform integration depth, while newer software-first entrants increasingly compete on cross-device compatibility rather than proprietary hardware lock-in alone. Demand here is tied more closely to clinic testing volume growth than to device replacement cycles alone, since software subscriptions renew independently of underlying hardware purchase timing. This segment's growth trajectory now depends heavily on how quickly clinics complete their broader digital workflow transition toward automated scoring.
CAGR 12.8%
Full segment breakdown across 6 segments available in the complete report.

Regional Architecture and Country Demand Map

North America commands the largest share of total spending given its dense sleep clinic network and established reimbursement pathways, while India's massive undiagnosed population and East Asia's expanding telehealth infrastructure anchor the fastest-growing regional pipelines. Western Europe and Latin America contribute steady, more gradually expanding demand of their own.

North America

The United States anchors regional demand through its dense concentration of sleep clinics and comparatively strong insurance coverage for home sleep testing across both commercial and government payer programs. Canada contributes a smaller, steadily growing demand base benefiting from proximity to the same device manufacturers and a healthcare system increasingly favoring home-based diagnostic pathways over costlier alternatives. Higher per-capita diagnosed apnea prevalence and deeper payer coverage give the region durable spending power even as unit growth moderates relative to faster-growing emerging markets. Growth stays healthy but trails East Asia and South Asia and Pacific because the region's largest clinic networks have already completed much of their initial fleet conversion toward home testing.
Share: 32% | CAGR: 9.0% (2026 to 2036)

Western Europe

Germany anchors both regional device manufacturing depth and testing demand, home to established sleep medicine practices increasingly specifying peripheral arterial tonometry devices ahead of national reimbursement decisions on broader home testing coverage. France and the United Kingdom follow with steady demand tied to national health systems evaluating structured rollout plans for home-based diagnostic pathways. Regulatory pressure compounds adoption directly: national health authority coverage decisions are pushing sleep clinics toward validated home testing devices regardless of any cost premium involved relative to legacy alternatives. Growth trails East Asia and South Asia and Pacific because the region's national health system budget processes move more slowly than faster-moving Asian markets. Spain and the Netherlands contribute smaller, steadily growing demand.
Share: 21% | CAGR: 8.3% (2026 to 2036)
Regional intelligence for 5 additional markets available in the complete report: East Asia, South Asia and Pacific, Latin America, Middle East and Africa, Eastern Europe. Contact sales@marketmindsadvisory.com.
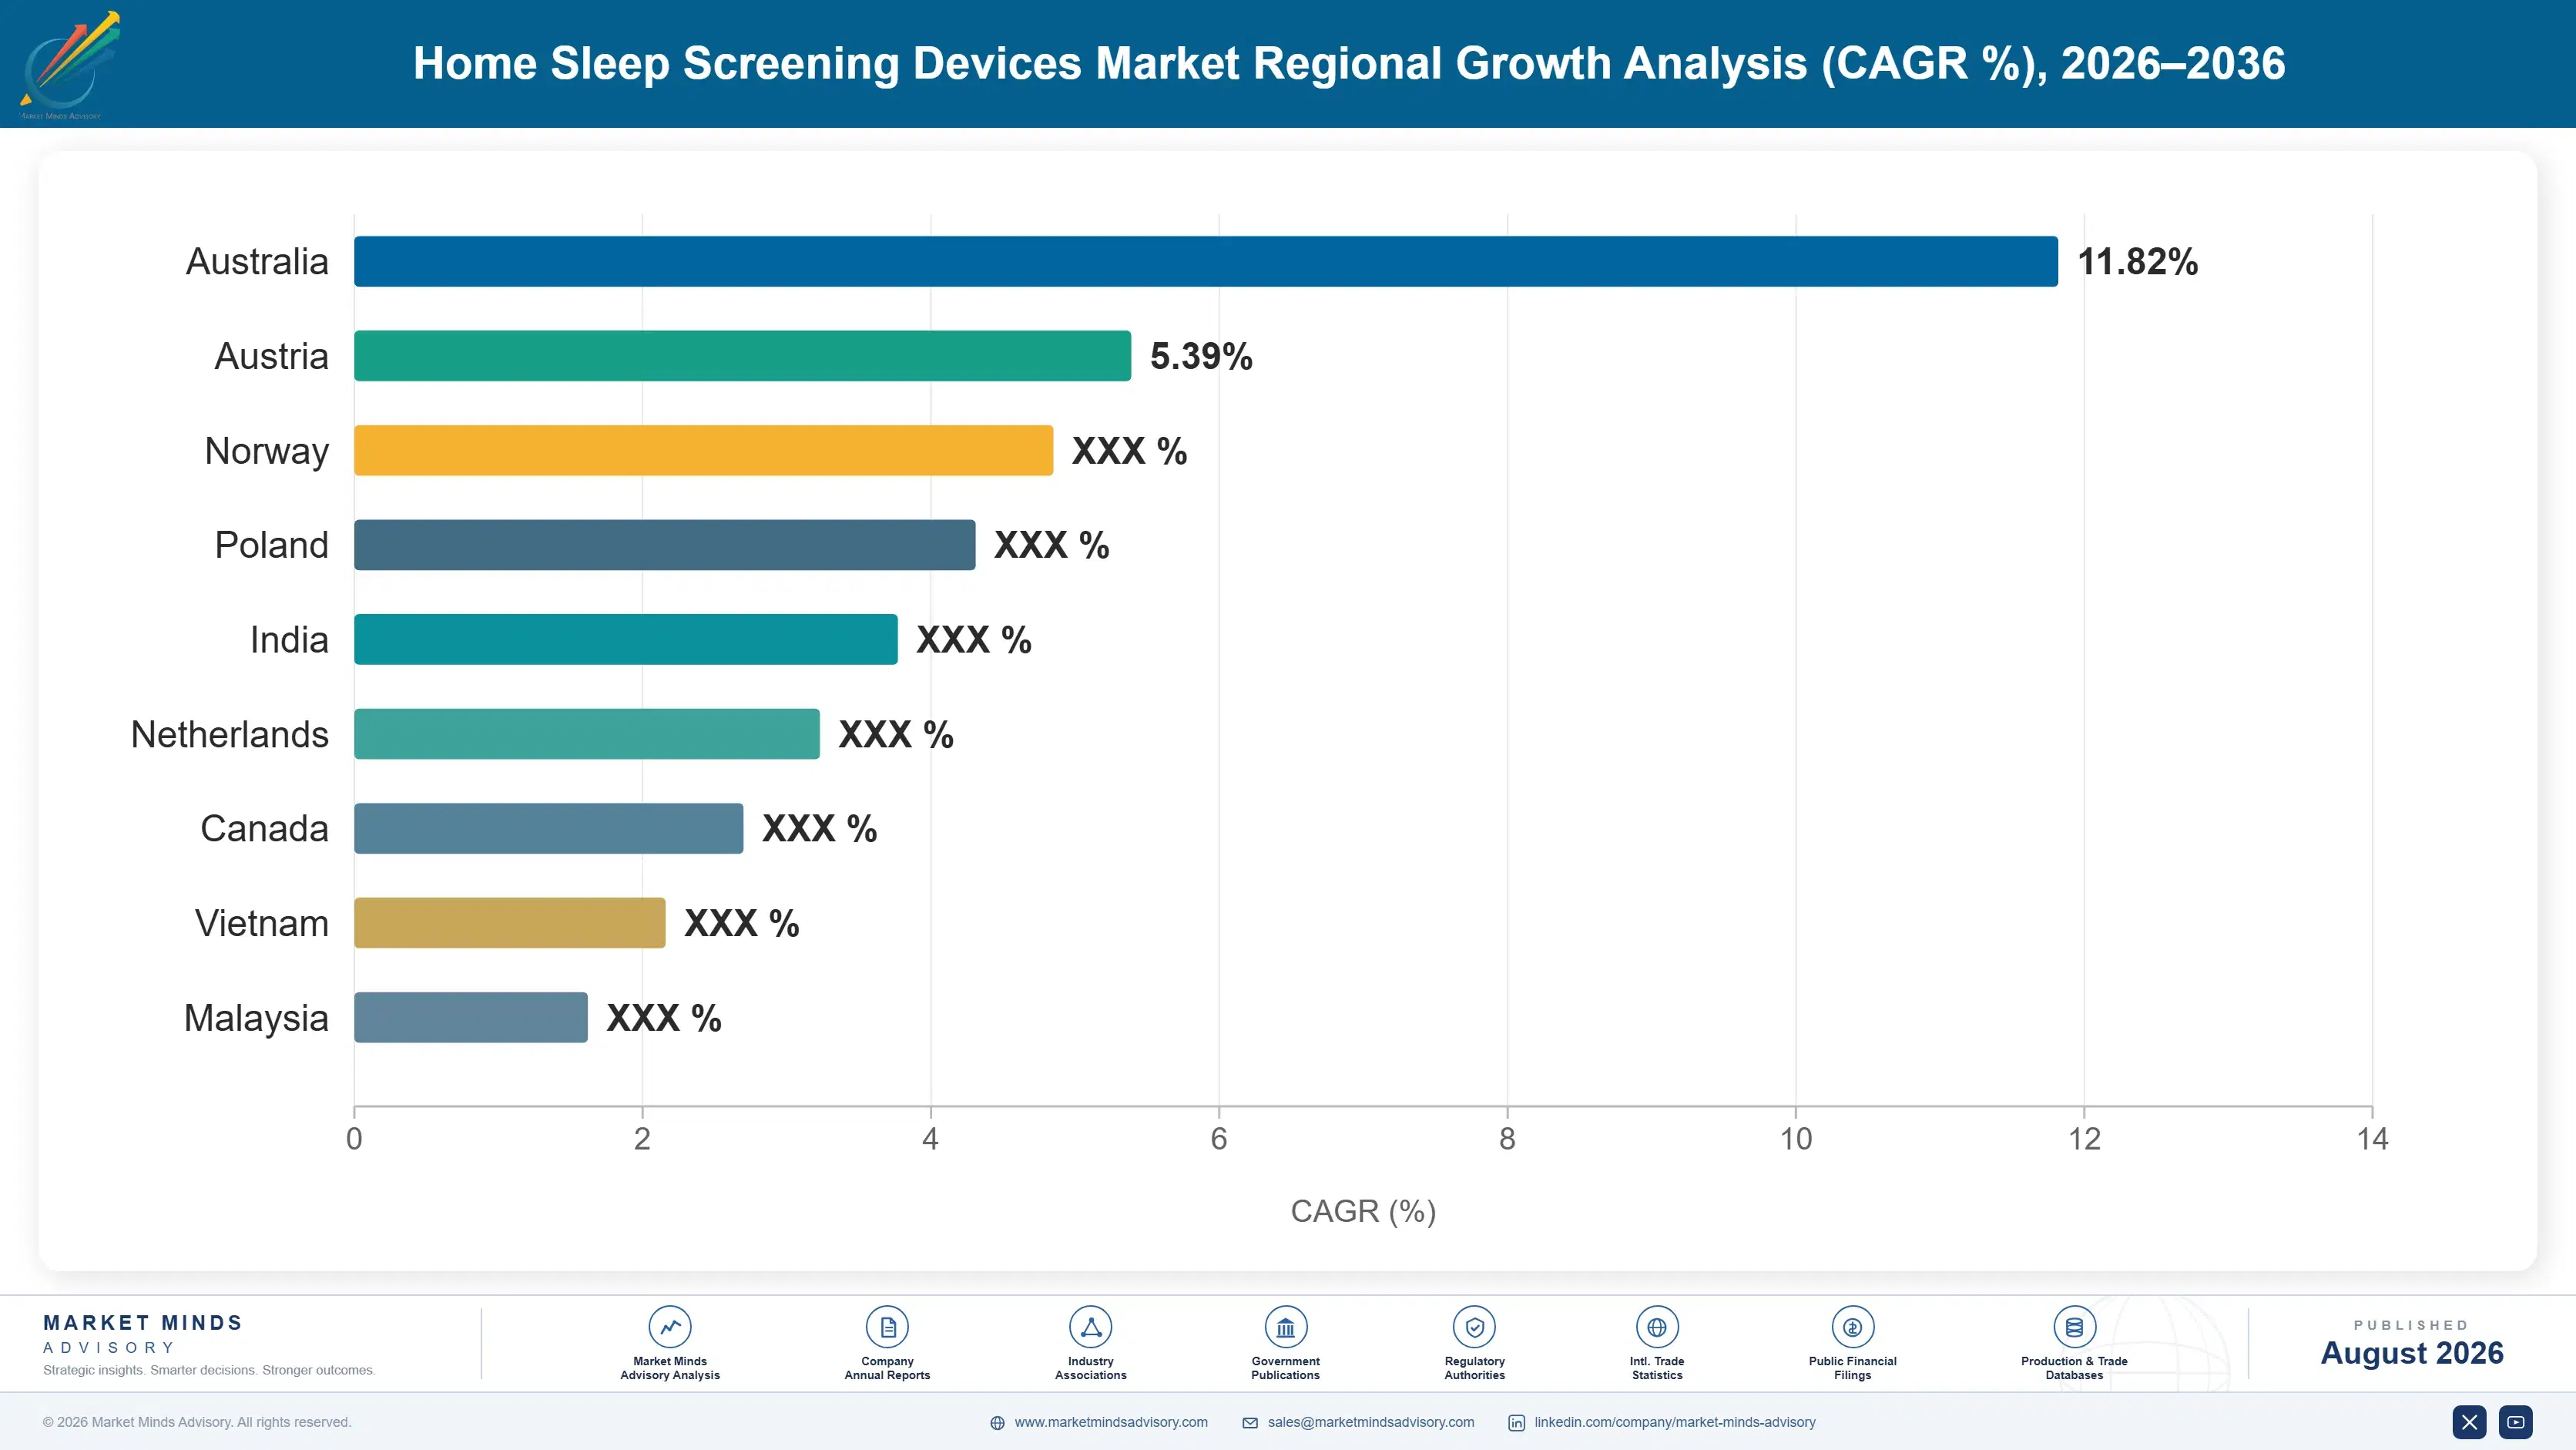
home-sleep-screening-devices-market-country-cagr-analysis-1787303180868

Where Home Sleep Device Manufacturers Capture Margin

Standard device hardware sales increasingly compete on price alone as more vendors enter the category, so the manufacturers protecting margin monetize the software and service layer: validation data, cloud analytics licensing, and long-term fleet service agreements. The four levers below reflect where clinic procurement teams show sustained willingness to pay a premium across every major fleet decision made today.

Validated Diagnostic Concordance Data Generation Programs

Clinics and payers increasingly require documented diagnostic concordance data against in-lab polysomnography before approving device fleet procurement, and manufacturers that invest in extensive validation studies are converting what used to be a purely hardware-based purchasing decision into an evidence-driven relationship commanding meaningful premium pricing over less-validated alternatives. This is becoming the primary differentiator in clinic procurement decisions, where buyers increasingly select devices based on documented diagnostic accuracy rather than raw price alone, and MMA interviews suggest manufacturers with the strongest validated evidence capture roughly 33% higher fleet contract win rates across the category overall today.
Market Impact: Adds 33 percent higher fleet win ra

Cloud Analytics and Remote Review Software Licensing

Manufacturers increasingly bundle cloud-based automated scoring and remote physician review software directly into device sales rather than selling hardware as a standalone capital purchase, since review efficiency meaningfully affects how much testing volume a clinic can process without expanding credentialed staff. Manufacturers offering integrated software licensing capture meaningfully higher recurring revenue per installed device than hardware-only suppliers, worth roughly 28% more per clinic relationship over a device fleet's operational life, since software licensing commands premium pricing clinics readily accept given the reviewing capacity delivered. Adoption of these bundled software licenses continues accelerating as more clinics scale testing volume.
Market Impact: Adds 28 percent higher recurring so

Long-Term Fleet Service and Reprocessing Agreements

Clinics increasingly sign multi-year device fleet service and reprocessing support agreements guaranteeing manufacturer technical availability and predictable consumable sensor pricing throughout a fleet's operational life, converting what used to be a series of individual purchase orders into predictable recurring revenue worth roughly 23% of a manufacturer's forward account revenue across an extended fleet relationship. Manufacturers offering these agreements gain visibility into future consumable and service revenue that supports continued technical investment, while clinics gain protection against costly fleet downtime and price volatility on consumable sensors purchased at meaningful volume across their network.
Market Impact: Locks in fleet service revenue for

Clinic Staff Training and Workflow Integration Support

Manufacturers offering embedded staff training and workflow integration support, helping clinic staff build confidence ordering, deploying, and interpreting home testing devices efficiently, capture recurring service value while simultaneously deepening customer relationships that make competitive displacement more difficult for rivals without comparable training infrastructure available today. For smaller clinics lacking prior home testing experience, the value proposition is faster confidence building toward full fleet-scale adoption, avoiding costly workflow errors during the early learning curve encountered by newer staff. Early adopters report training program attach rates approaching 27% among first-time fleet buyers, growing steadily each year across the category.
Market Impact: Reaches nearly 27 percent training

Who Controls the Margin Pool

CR5 sits at 44%, reflecting a category moderately consolidated among established sleep diagnostics manufacturers, evaluated here on a revenue basis across hardware, software, and consumable sensor sales combined. ResMed and Philips lead on fleet revenue scale, with a meaningful gap separating them from smaller challengers, including Natus Medical and Itamar Medical, each strong in specific product categories rather than across the board universally. Smaller vendors increasingly struggle to match
Current activity centers on three dimensions: validated diagnostic concordance data generation, cloud analytics and remote review software integration depth, and long-term fleet service agreement capability for large clinic network customers. Manufacturers lacking software integration depth are increasingly partnering with independent analytics vendors rather than losing fleet procurement decisions on missing-capability grounds alone.

Emerging pressure comes from software-first entrants building analytics platforms compatible across multiple hardware brands, expanding aggressively into clinic procurement processes historically dominated by integrated hardware-and-software incumbents. If software-first entrants continue converting cross-device compatibility into clinic network relationships, expect rankings among the next several challengers to shift by 2030, as platform-agnostic entrants displace slower-moving incumbents across specific clinic segments worldwide. Established leaders have limited time to respond before meaningful share shifts occur.
home-sleep-screening-devices-market-company-positioning-matrix-1787303181400

Competitive Moat and Risk Dimensions

RESMED INC.

Moat: Broadest Diagnostic-to-Therapy Platform

ResMed's integrated platform spanning diagnostic testing, therapy devices, and cloud-connected patient management software gives it switching-cost advantages that narrower diagnostic-only vendors cannot easily replicate across a clinic's full sleep medicine workflow. That combined platform breadth makes ResMed the default vendor for clinics seeking a single integrated technology relationship spanning both diagnosis and ongoing therapy management.
RESMED INC.

Risk: Diagnostic Segment Competitive Exposure

ResMed's diagnostic device segment faces intensifying competition from specialized peripheral arterial tonometry vendors with narrower but deeper validation data specifically in home testing accuracy. Maintaining competitive diagnostic depth requires sustained research investment competing directly with continued therapy platform expansion across the company's broader commercial portfolio.
KONINKLIJKE PHILIPS N.V.

Moat: Established Clinical Relationship Depth

Philips's decades of established sleep medicine clinical relationships give it prescriber trust and distribution depth that newer diagnostic entrants cannot quickly replicate regardless of technical sophistication invested in device development. That accumulated clinical trust increasingly functions as a competitive moat in its own right for large clinic network procurement decisions specifically.
KONINKLIJKE PHILIPS N.V.

Risk: Legacy Hardware Modernization Risk

Philips's substantial legacy hardware portfolio, built before cloud analytics became a core buyer expectation, creates modernization complexity that newer, software-native competitors do not carry as technical debt. Managing this transition requires balancing continued legacy hardware support against sustained software capability investment across the full diagnostic product portfolio.

Players Tracked

Prominent Players

ResMed Inc.
Koninklijke Philips N.V.
Natus Medical Incorporated
Itamar Medical Ltd.
Nox Medical ehf.

Other Key Players

SOMNOmedics GmbH
Cadwell Industries, Inc.
Compumedics Limited
Cleveland Medical Devices Inc.
MyCardio LLC
Fisher & Paykel Healthcare Corporation Limited
BMC Medical Co., Ltd.
Löwenstein Medical Technology GmbH
Braebon Medical Corporation
NovaSom, Inc.
SleepScore Labs
Onera Health B.V.
Ectosense NV
SunTech Medical, Inc.
Curative Medical, Inc.

Recent Developments

FEBRUARY 2025

Itamar Medical Expands Peripheral Arterial Tonometry Validation Studies

Itamar Medical announced expanded clinical validation studies for its peripheral arterial tonometry device across additional patient populations, addressing payer demand for broader diagnostic concordance evidence ahead of anticipated coverage expansion decisions. The expansion targets consistent supply for both established and emerging clinic network customers across multiple regions.
Signal: Signals Itamar Medical prioritizing valida
JUNE 2025

ResMed Launches Expanded Cloud Analytics Platform Integration

ResMed announced the commercial launch of an expanded cloud analytics platform supporting automated scoring across a broader range of compatible third-party diagnostic hardware, targeting clinics seeking cross-device workflow consolidation across their broader facility network. The launch addresses clinic demand following favorable review efficiency data published recently across several markets.
Signal: Signals ResMed prioritizing platform openn
OCTOBER 2025

Nox Medical Signs Distribution Agreement With Indian Telehealth Network

Nox Medical signed a distribution agreement with a major Indian telehealth network operator, securing access to established patient referral relationships ahead of continued domestic testing infrastructure expansion. The agreement covers device supply and cloud analytics access across the network's growing patient base nationwide this year.
Signal: Signals established manufacturers actively

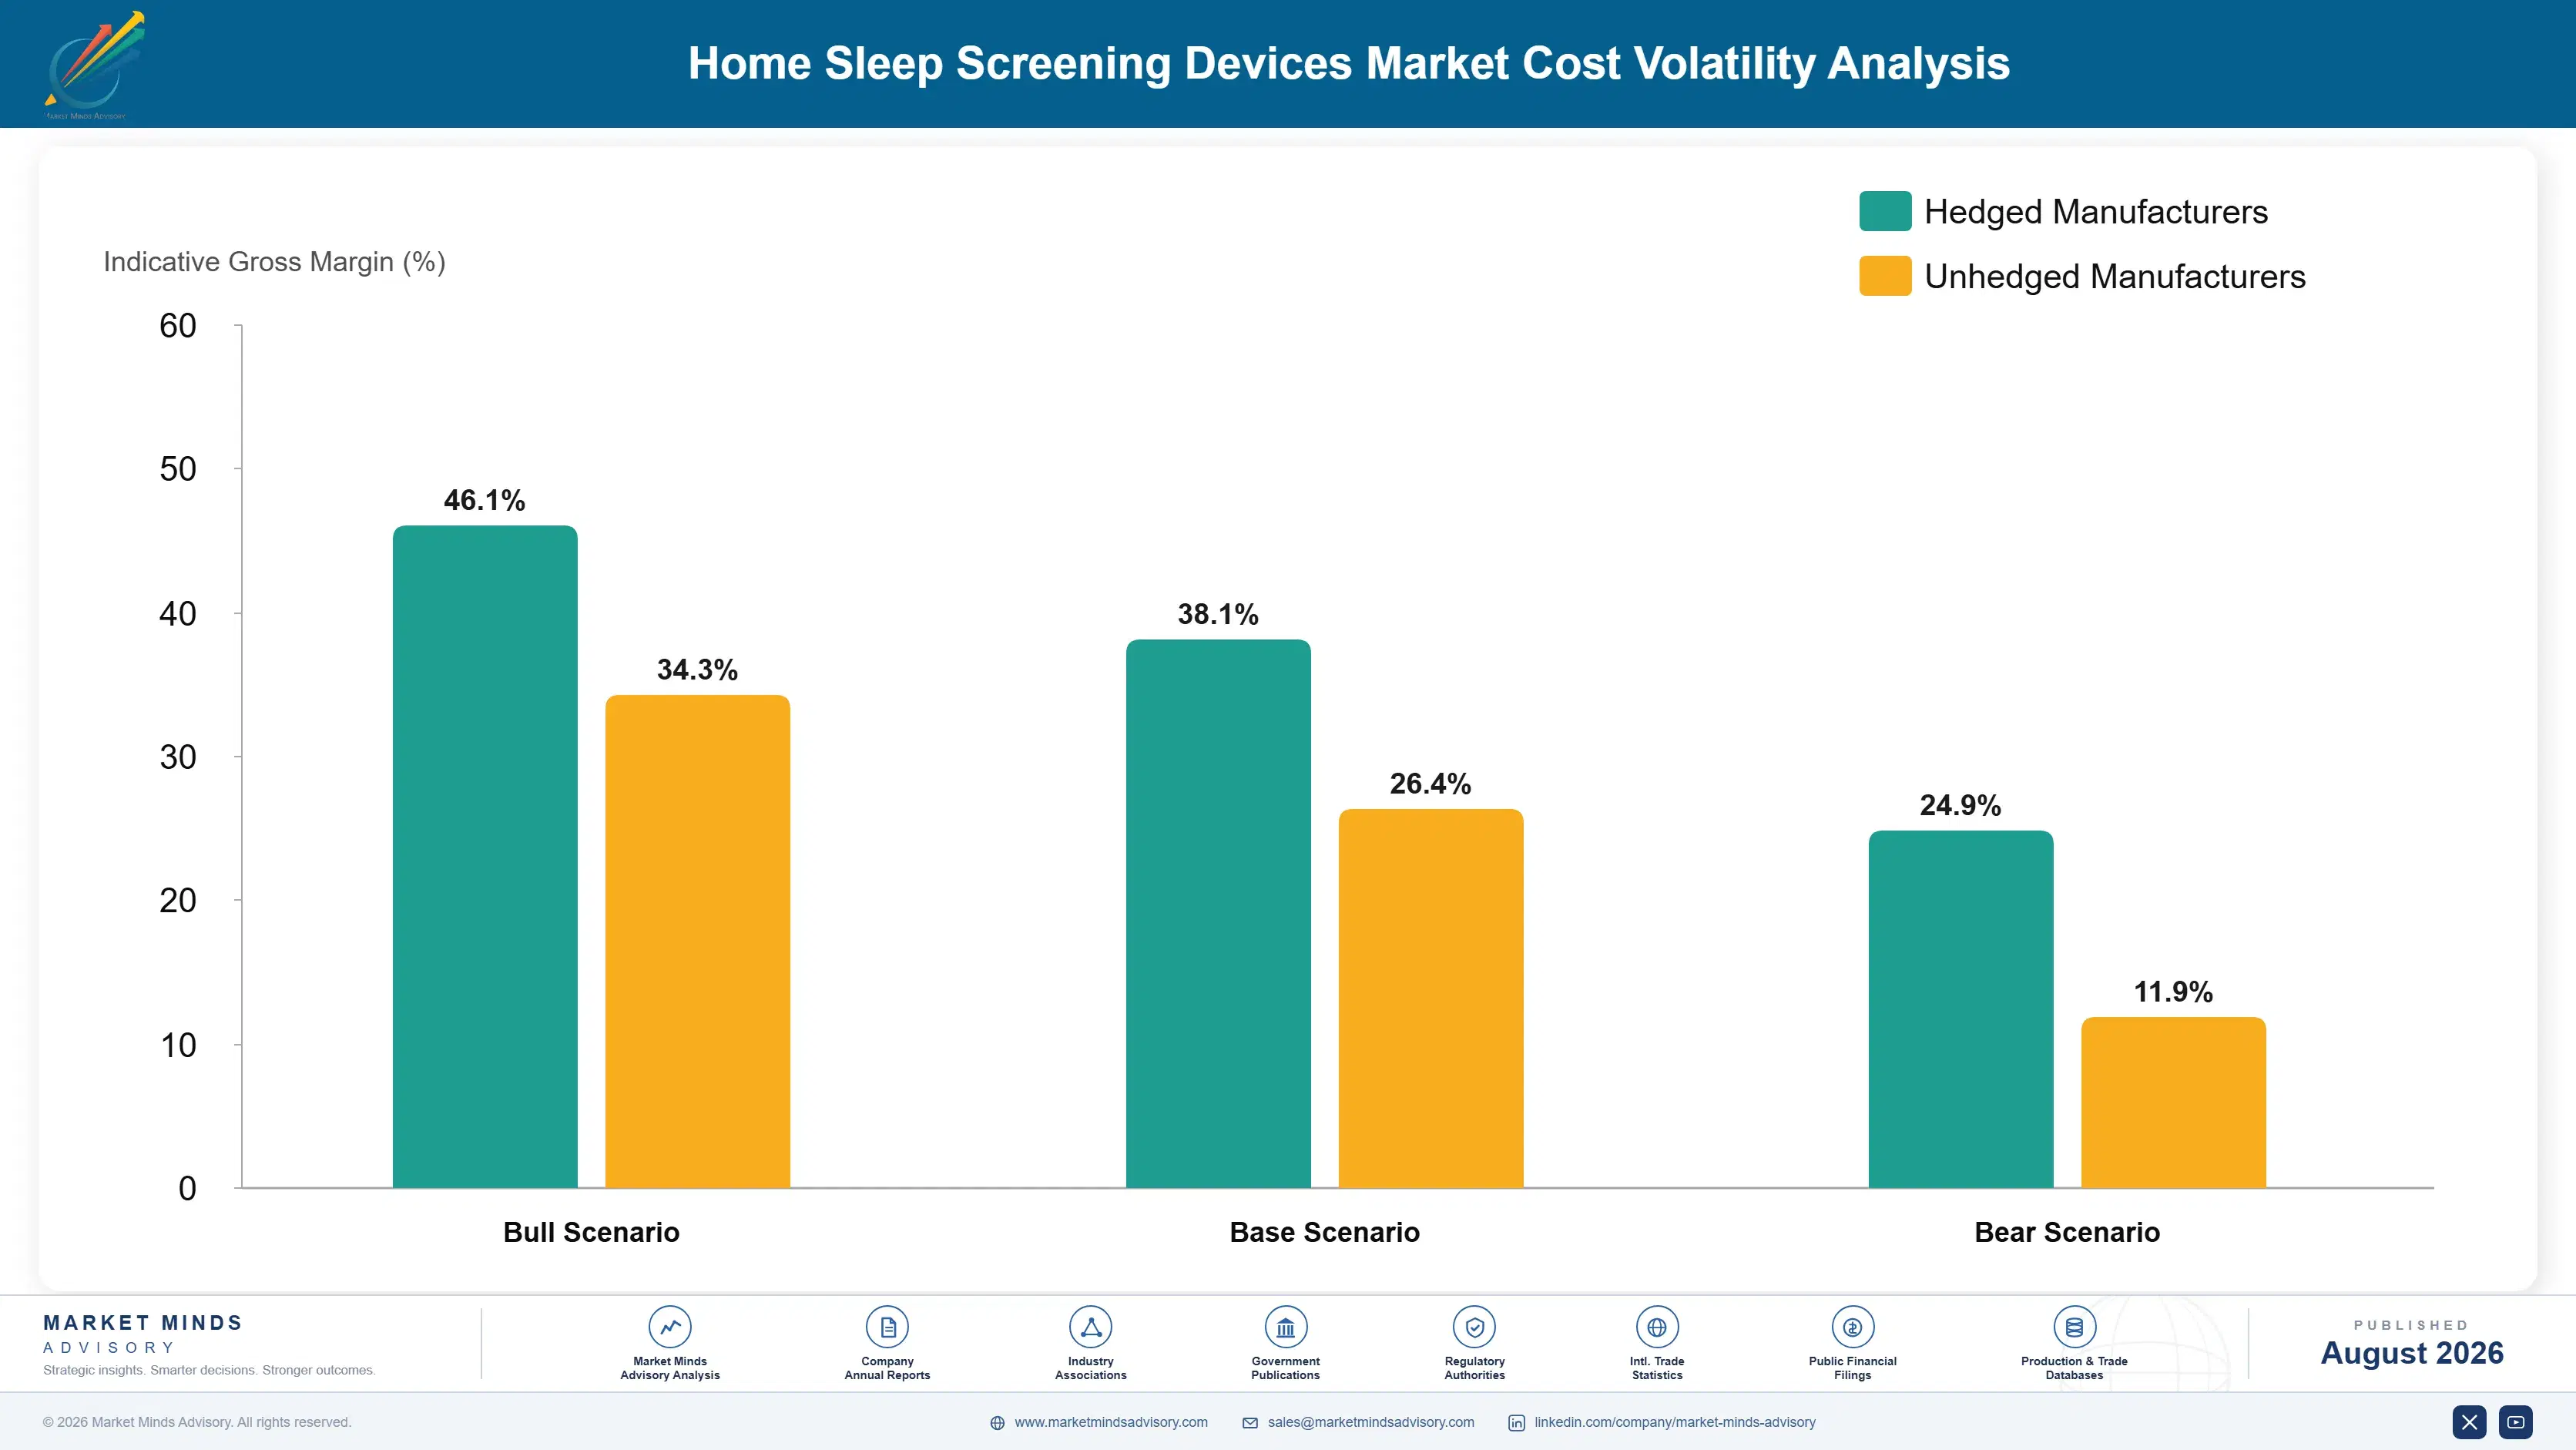
Specialized Sensor and Connectivity Component Costs

Specialized biosensors and wireless connectivity components together account for roughly 29% of home sleep testing device cost of goods sold, making these inputs the dominant cost driver in the category ahead of general assembly and enclosure manufacturing labor. Sensor components require specialized calibration and biocompatibility certification, with cost structure varying by required sensitivity specification and the underlying semiconductor component sourcing availability.
Specialized sensor and semiconductor component costs spiked through 2022 as broader medical device industry demand absorbed available specialized fabrication capacity faster than new capacity could be added, according to company disclosures citing constrained component supplier availability. Manufacturers without long-term component supply agreements or in-house calibration capability saw costs rise faster than they could pass through to fixed-price clinic contract pricing signed before the spike occurred across the industry.

Smaller manufacturers without established component supplier relationships or long-term supply agreements absorb input cost volatility directly into thin margins, while larger players like ResMed and Philips use existing semiconductor supply chain relationships to insulate margins from component price swings. Manufacturers newly entering the category without comparable established supply relationships carry meaningfully greater cost exposure than incumbents who capture more of the sensor value chain themselves across the category.
home-sleep-screening-devices-market-cost-volatility-analysis-1787303181600

Long-Term Sensor Component Supply Agreements

The largest manufacturers are locking multi-year specialized sensor and semiconductor component supply agreements directly with fabrication partners rather than competing for spot capacity, securing priority access and more predictable pricing across major production programs and forecast cycles ahead, reinforcing scale advantages already present across the category. This requires sustained capital commitment smaller manufacturers cannot easily match over time.

Vertical Integration Into Sensor Calibration

Larger manufacturers are investing directly in in-house sensor calibration and testing capability rather than relying entirely on third-party component suppliers, capturing more of the value chain and reducing exposure to specialty component price swings across the category's highest-volume device production lines currently underway across the industry. This trend continues strengthening as demand grows steadily each year.

Component Sourcing Diversification Strategies

Manufacturers are diversifying sensor and connectivity component sourcing across multiple fabrication partners rather than depending on a single supplier, reducing exposure to specific fabrication capacity disruptions that have affected particular component categories during recent volatility episodes across multiple production regions simultaneously. This diversification strategy has become increasingly common among the largest manufacturers operating across multiple regions.

Portfolio Architecture for Margin Defence

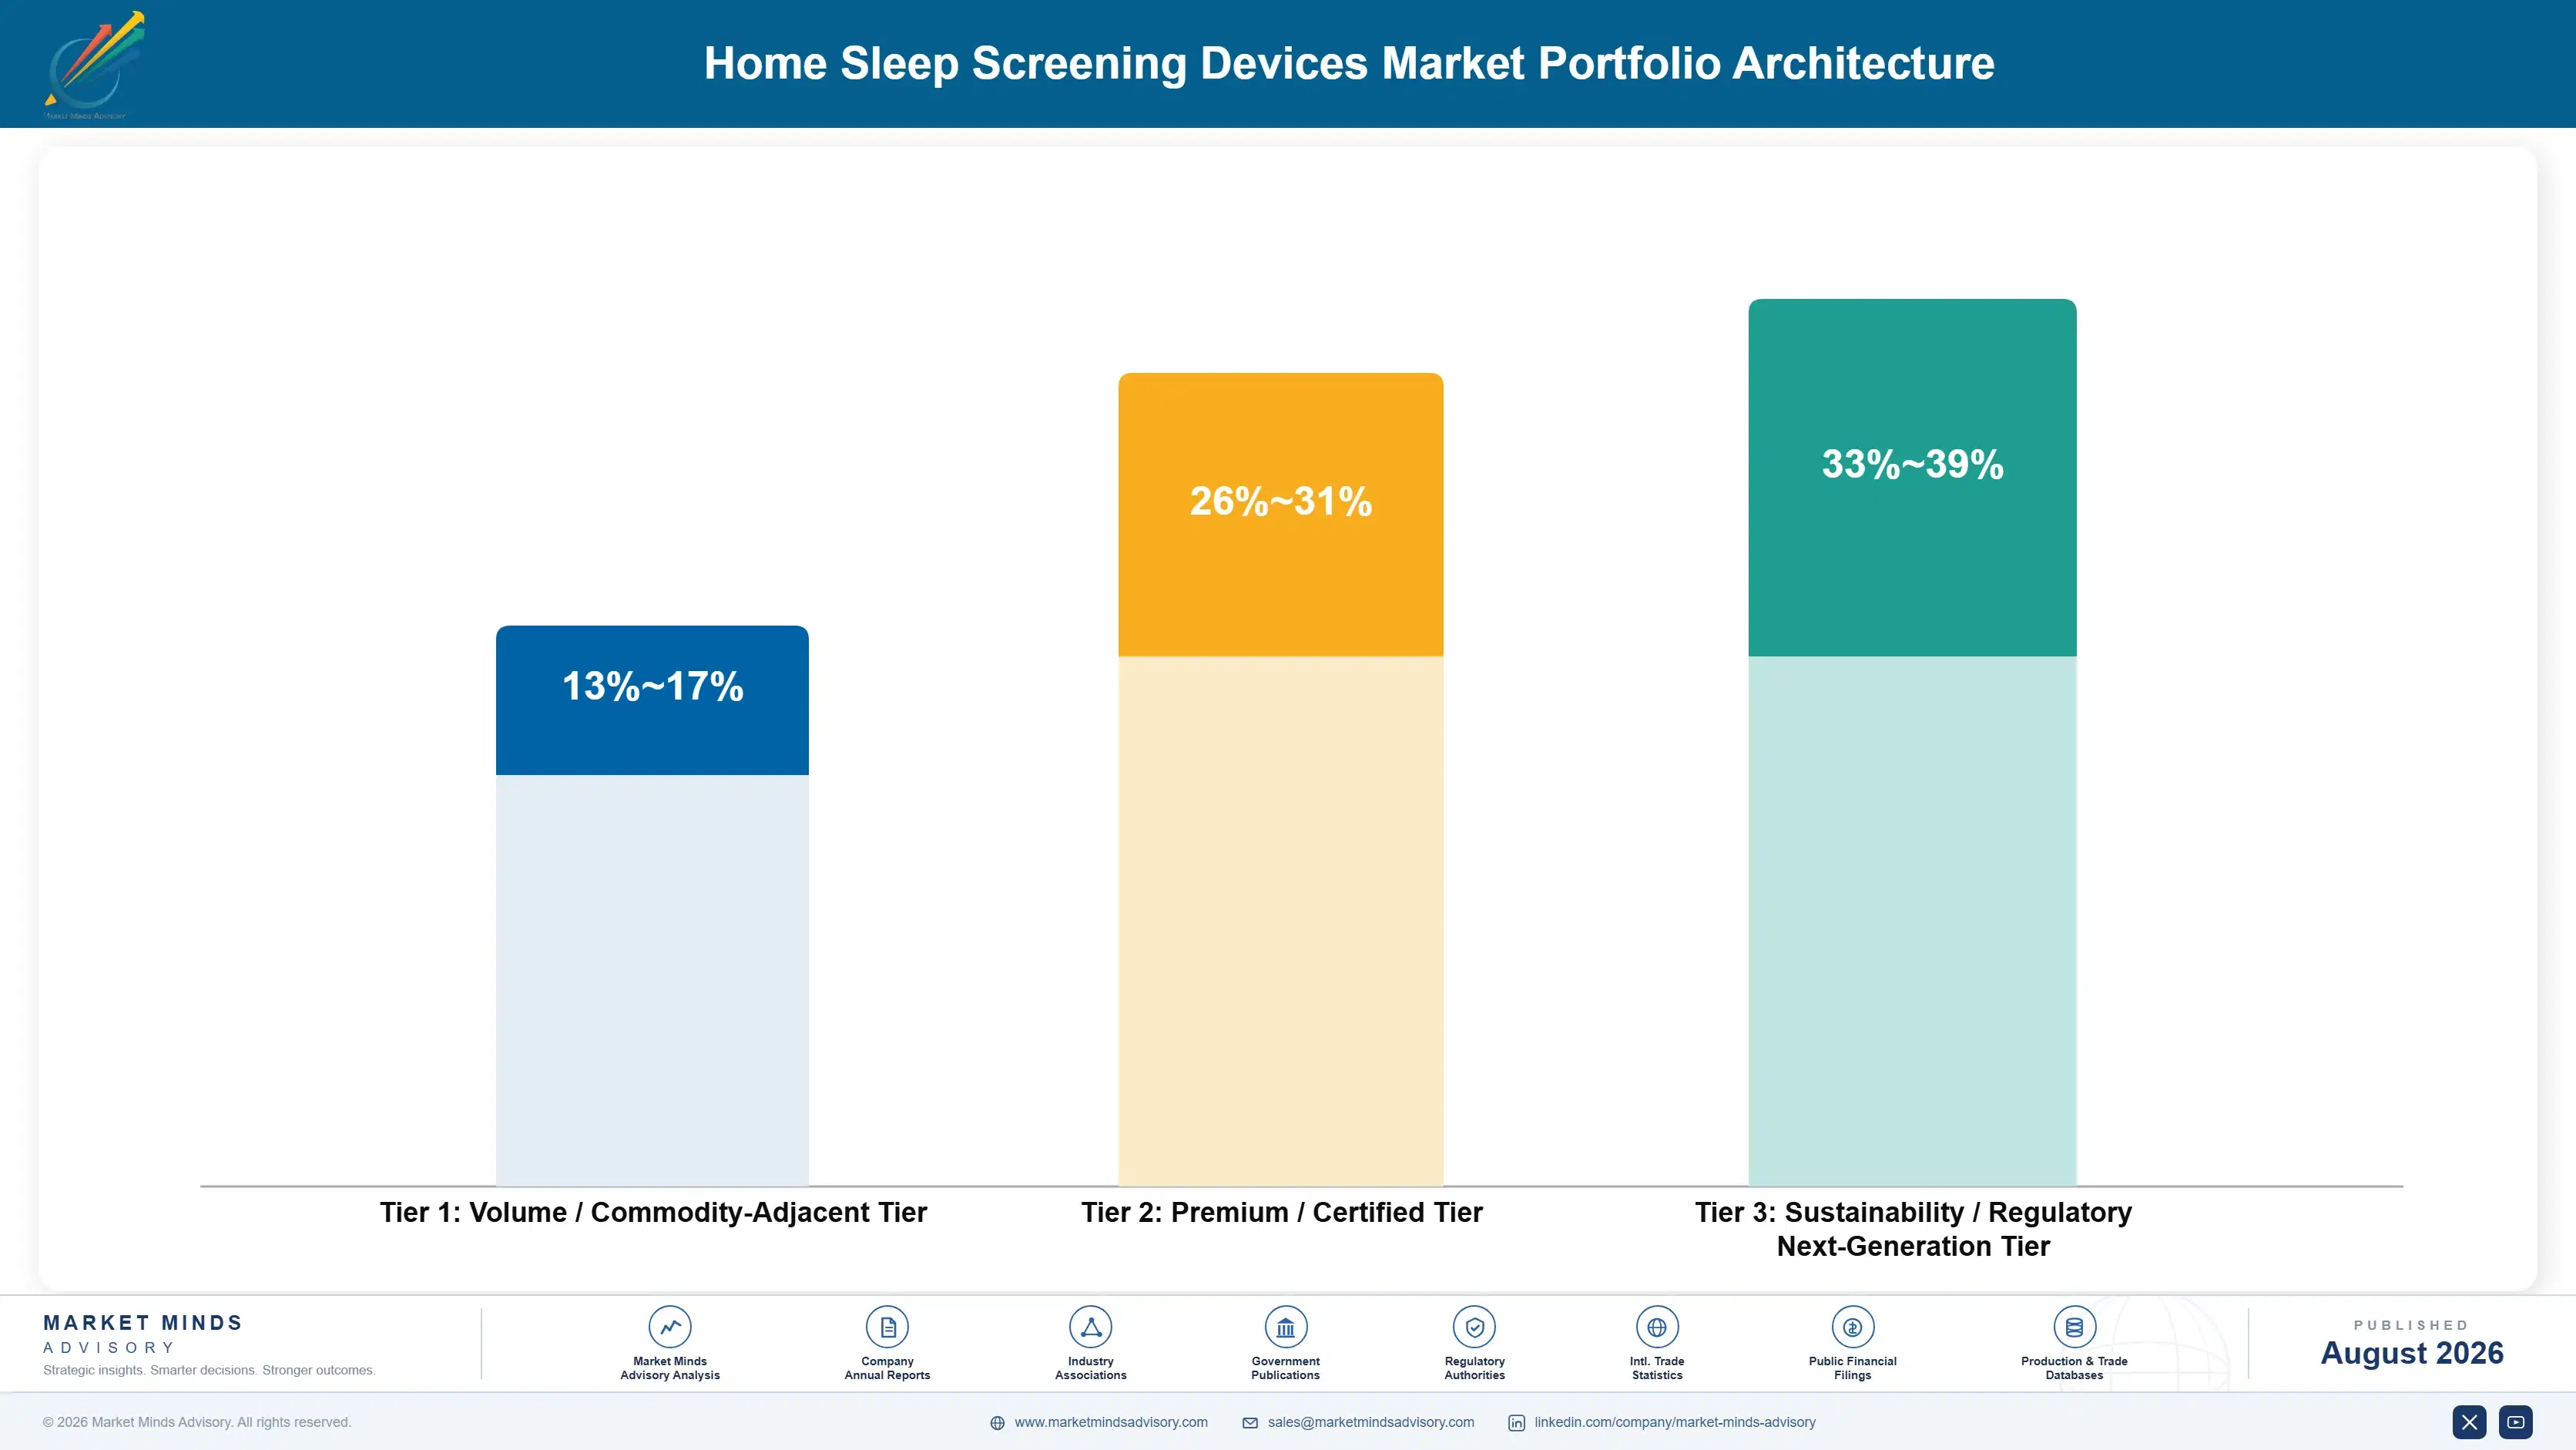
MMA's tier architecture separates the category into three margin bands. Volume and commodity-adjacent standard Type III and Type IV testing devices compete on price against widely available hardware and carry thin margin, premium and certified peripheral arterial tonometry and software-integrated devices carry higher margin on documented diagnostic concordance and workflow capability, and sustainability-linked next-generation platforms, including automated scoring and remote review suites, comma
The tension between volume and premium plays out most visibly among mid-sized clinics, who want peripheral arterial tonometry capability at closer to standard device pricing. That up-tier migration remains slow given how many mid-sized clinics still evaluate fleet return on investment cautiously. Manufacturers that fail to bundle these services risk losing share to more capable rivals.

High-value margin pools concentrate in large clinic network device fleets bundled with software licensing, training programs, and long-term service agreements, where recurring software and compliance-attach revenue increasingly outweighs the margin earned on any individual device sale alone. That concentration is pulling investment steadily toward software capability and service coordination rather than incremental hardware manufacturing capacity expansion alone across the category.

Volume / Commodity-Adjacent Tier

Standard Type III and Type IV testing devices sold primarily on price against widely available hardware, serving cost-sensitive clinics and smaller practices where gross margin stays thin and competition is driven almost entirely by landed cost.
Gross Margin: 13%-17%

Premium / Certified Tier

Peripheral arterial tonometry and software-integrated devices specified by clinics requiring documented diagnostic concordance, workflow capability, and long-term service agreements, commanding meaningfully higher margin on demonstrated performance achieved across the category's fastest-growing certified segment overall.
Gross Margin: 26%-31%

Sustainability / Regulatory / Next-Generation Tier

Fully automated scoring and remote physician review suites positioned for clinics chasing throughput efficiency and premium positioning, where integration depth and clinical evidence support the category's highest margin overall across most major markets today.
Gross Margin: 33%-39%
home-sleep-screening-devices-market-portfolio-architecture-1787303182101

Fleet Service and Adoption Depth

A device sale is rarely a single transaction for the largest clinic network accounts. Software licensing, training programs, and long-term fleet service contracts convert what used to be a one-time hardware purchase into a relationship spanning a device fleet's operational life. Manufacturers that capture the software and service attachment at first sale retain more lifetime value per clinic than those competing on hardware price alone.
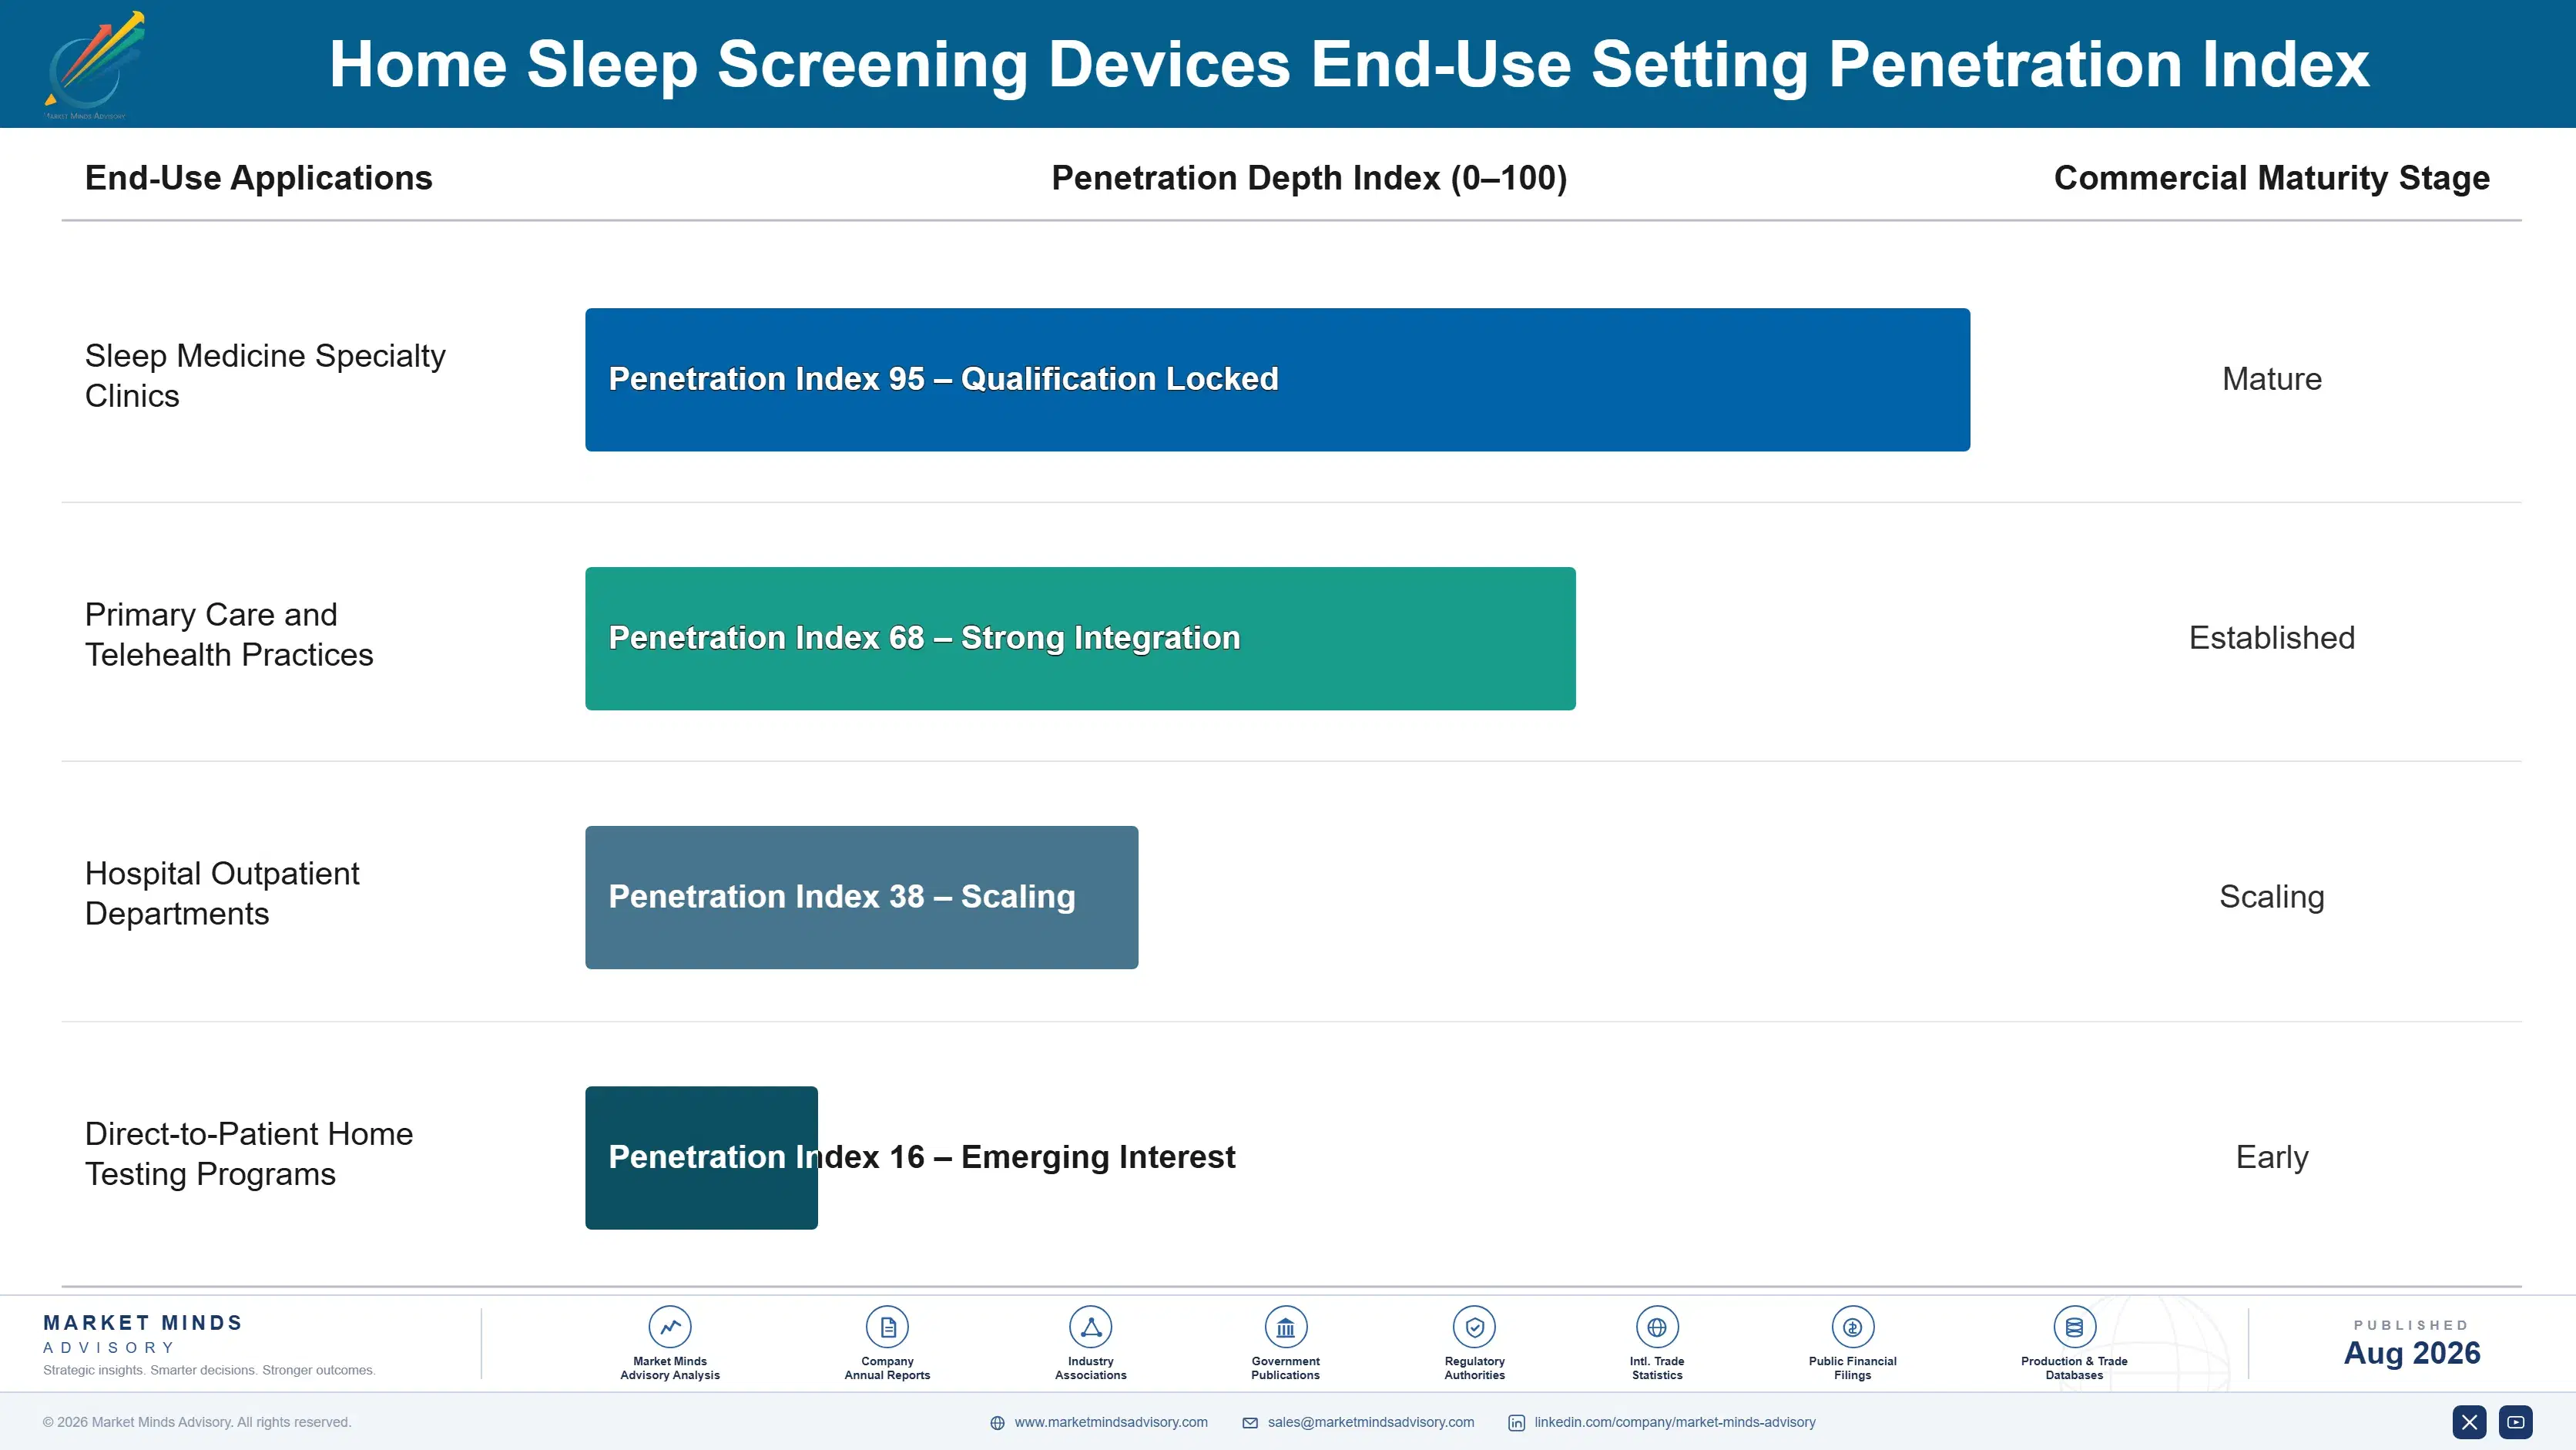
Adoption depth varies sharply by clinic type. Large multi-site clinic networks convert fastest and most completely, standardizing an entire device fleet onto certified, proven vendors once a pilot deployment proves out, making them the highest-value account type despite competitive pricing. Smaller independent clinics convert more slowly, often relying on outsourced in-lab referral partnerships for years before adopting in-house testing fleet capability.

A generational shift in sleep medicine physicians is compounding the certification-driven shift. Younger physicians entering practice increasingly expect software-integrated, cloud-connected devices as standard equipment, a purchasing expectation an older generation of physicians, who trained primarily on conventional in-lab polysomnography workflows, rarely required as rigorously. That shift is accelerating premium-tier adoption even among clinics that have not yet faced direct competitive pressure from software-enabled rivals nearby.
home-sleep-screening-devices-market-end-use-penetration-index-1787303182589

What Matters Most Through 2036

These are among the four positions where our research anticipates prominent divergence between winners and laggards over the coming forecast period. Each is grounded in the demand model, the regulatory perimeter, and the announced capacity pipeline.
01 / DIAGNOSTIC VALIDATION INVESTMENT

Build extensive concordance evidence before coverage decisions tighten

Documented diagnostic concordance evidence is converting clinic procurement decisions from a purely price-based comparison into an evidence-driven relationship, and manufacturers with established validated evidence are already capturing disproportionate share of new fleet purchases ahead of broader payer coverage maturation. Manufacturers that invest in validation studies now will secure preferred-vendor status with major clinic networks before competitors catch up on the clinical trial investment required. Continuing to treat validation evidence as a future concern risks ceding the fastest-growing, most differentiated segment to competitors already building extensive evidence.
02 / CLOUD ANALYTICS PLATFORM DEPTH

Deepen software integration ahead of the next fleet replacement cycle

Cloud analytics and remote review capability increasingly decides purchasing decisions as much as raw device specification, and manufacturers that deepen validated software pathways will capture disproportionate share of clinic fleet upgrades as networks seek review efficiency gains without full hardware replacement. Manufacturers that invest in open, validated software now will build switching costs that protect installed fleet base better than competitors relying on hardware specification alone. This software investment requires sustained development spending years before any single purchasing cycle fully rewards that patient positioning across every clinic segment.
03 / RECURRING FLEET REVENUE CAPTURE

Bundle service and software into every large clinic network quote

Software licensing and long-term fleet service agreements already generate meaningfully higher recurring revenue than standard hardware sales, yet many manufacturers still sell these as separate negotiations rather than a default part of every quote presented to large clinic network buyers. Manufacturers that make software and service attachment the default, requiring buyers to actively opt out rather than opt in, will capture materially more lifetime value per clinic than competitors treating these services as an afterthought. This remains underexploited by every manufacturer outside the two largest players active in the category.
04 / COMPLEX CASE TRIAGE POSITIONING

Build clear referral pathways for cases beyond home testing capability

Complex apnea cases requiring in-lab confirmation continue representing a meaningful share of total diagnosed volume, and manufacturers that build clear clinical triage algorithms routing these cases appropriately will protect credibility better than competitors overselling home testing capability beyond its genuine reliability. Manufacturers that invest in triage algorithm development now will build trust with sleep medicine physicians that protects broader home testing adoption from credibility-damaging misdiagnosis cases. This triage investment requires sustained clinical collaboration well before broader referral pathway confidence fully materializes.

Engagement Snapshot From the Field

A live engagement with an industry participant carrying material or product regulatory and market exposure ahead of a defining policy shift, showing how our research translates into a defensible multi-year portfolio strategy.
MARKET MINDS ADVISORY · CLIENT ENGAGEMENT SUMMARY
Home Sleep Screening Devices Producer Strategic Portfolio Review and Transition Roadmap 2026·Investment Scenario on Home Sleep Screening Devices Exposure Evaluation 2025-26
CLIENT PROFILE
The client is a regional sleep medicine clinic network operating 14 locations across three states, with a stated goal of converting a substantial share of its diagnostic volume from in-lab polysomnography toward home-based testing. Annual device and software procurement spend exceeds $9 million (client-reported, unverified by MMA), concentrated primarily across Type III purchasing and emerging tonometry evaluation.
STRATEGIC CHALLENGE
The client faced a fleet standardization decision balancing peripheral arterial tonometry investment against continued Type III device reliance, with limited internal expertise to evaluate competing manufacturer validation claims. Leadership needed a structured evaluation framework weighing diagnostic accuracy improvements against uncertain payer reimbursement recognition for newer device categories across its diverse patient population.
MMA APPROACH
MMA conducted a structured evaluation of three candidate device vendors against the client's specific patient population and payer mix, benchmarked vendor-reported concordance claims against MMA's proprietary diagnostic device performance database, and facilitated reference site visits with comparable clinic network deployments. The engagement combined primary interviews with practicing sleep physicians alongside independent outcome data verification across multiple facility types.
KEY FINDINGS
  1. Two of three evaluated vendors could not independently verify their published diagnostic concordance claims when benchmarked against comparable multi-site clinic deployments evaluated.
  2. The client's specific payer mix meaningfully affected which vendor's software licensing structure was most cost-effective across its broader patient population base and geography.
  3. Selecting a validated-evidence vendor reduced projected diagnostic reversal and repeat-testing rates by an estimated 26% relative to the client's current device base.
  4. Staff training requirements for peripheral arterial tonometry interpretation emerged as a meaningfully underestimated implementation timeline risk factor requiring further planning and budget.
CLIENT PROFILE
The client is a regional sleep medicine clinic network operating 14 locations across three states, with a stated goal of converting a substantial share of its diagnostic volume from in-lab polysomnography toward home-based testing. Annual device and software procurement spend exceeds $9 million (client-reported, unverified by MMA), concentrated primarily across Type III purchasing and emerging tonometry evaluation.
STRATEGIC CHALLENGE
The client faced a fleet standardization decision balancing peripheral arterial tonometry investment against continued Type III device reliance, with limited internal expertise to evaluate competing manufacturer validation claims. Leadership needed a structured evaluation framework weighing diagnostic accuracy improvements against uncertain payer reimbursement recognition for newer device categories across its diverse patient population.
MMA APPROACH
MMA conducted a structured evaluation of three candidate device vendors against the client's specific patient population and payer mix, benchmarked vendor-reported concordance claims against MMA's proprietary diagnostic device performance database, and facilitated reference site visits with comparable clinic network deployments. The engagement combined primary interviews with practicing sleep physicians alongside independent outcome data verification across multiple facility types.
KEY FINDINGS
  1. Two of three evaluated vendors could not independently verify their published diagnostic concordance claims when benchmarked against comparable multi-site clinic deployments evaluated.
  2. The client's specific payer mix meaningfully affected which vendor's software licensing structure was most cost-effective across its broader patient population base and geography.
  3. Selecting a validated-evidence vendor reduced projected diagnostic reversal and repeat-testing rates by an estimated 26% relative to the client's current device base.
  4. Staff training requirements for peripheral arterial tonometry interpretation emerged as a meaningfully underestimated implementation timeline risk factor requiring further planning and budget.
RECOMMENDED STRATEGY
Phase 1: Phase 1 (Months 1 to 3): Complete structured vendor evaluation and select a validated device platform for the three highest-volume locations first. Phase 2: Phase 2 (Months 4 to 9): Deploy the selected platform while closely tracking diagnostic concordance and staff training completion against baseline metrics. Phase 3: Phase 3 (Months 10 to 16): Expand deployment across remaining locations pending validated results from the initial rollout phase completion.
OUTCOME
The client's initial three locations achieved measurable diagnostic turnaround improvement and reduced repeat-testing rates within seven months of deployment completion (client-reported, unverified by MMA), supporting the network-wide expansion plan that had originally motivated the vendor evaluation engagement across its broader footprint. The remaining eleven locations are scheduled for phased deployment over the following year.

Frequently Asked Questions

Foundational context covering the market sizes, CAGR, scope, country, region and competition that inform every finding below. This section is provided to cover basics and most often pre-purchase conversations, answered from the MMA Primary Research Dataset.

What is the current size of the Home Sleep Screening Devices Market?

MMA estimates the global home sleep screening devices market at $2.6 billion in 2025. Growth concentrates in peripheral arterial tonometry devices and cloud analytics, driven by payer coverage expansion and telehealth adoption.

How large will the Home Sleep Screening Devices Market be by 2036?

MMA forecasts the market reaching $7.26 billion by 2036, up from $2.85 billion in 2026. That represents roughly a 2.55 times expansion over the full ten-year forecast period covered.

What is the CAGR for the Home Sleep Screening Devices Market 2026 to 2036?

MMA's base case forecasts a 9.8% compound annual growth rate, with a bull case of 11.0% and a bear case of 8.5% depending on payer coverage expansion timing.

Which segment is growing fastest?

Peripheral arterial tonometry devices lead at a 14.2% CAGR, roughly 1.4 times the overall market rate, as validation data continues expanding payer coverage recognition across additional patient populations.

Who are the major companies in the Home Sleep Screening Devices Market?

ResMed, Philips, Natus Medical, Itamar Medical, and Nox Medical lead the category, together holding an estimated 44% combined share on a revenue basis across hardware and software worldwide.

Which country is growing fastest?

India leads at an estimated 13.5% CAGR, outpacing the global average as expanding telehealth infrastructure continues reaching its massive undiagnosed apnea population faster than any comparable economy.

Report Segmentation Architecture

The full report scope spans multiple orthogonal segmentation dimensions, with cross-tabulated demand data provided for each dimension pair. Coverage extends further to regional breakdowns, trend trajectories, and the competitive detail needed to support segment-level decision-making.

By Product and Technology Type

  • Type II Home Polysomnography Devices
  • Type III Cardiorespiratory Monitors
  • Type IV Screening Devices
  • Peripheral Arterial Tonometry Devices
  • Companion Software and Cloud Analytics Platforms
  • Disposable Sensors and Accessories

By End-Use Setting

  • Sleep Medicine Specialty Clinics
  • Primary Care and Telehealth Practices
  • Hospital Outpatient Departments
  • Direct-to-Patient Home Testing Programs

By Commercial Dimension

  • Direct Clinic Fleet Purchase
  • Payer-Negotiated Coverage Agreements
  • Long-Term Vendor Service Agreements
  • Software Licensing and Subscription Contracts

By Region

  • North America
  • Western Europe
  • East Asia
  • South Asia and Pacific
  • Latin America
  • Middle East and Africa
  • Eastern Europe

Scope, Methodology, and Coverage

Every figure in this report is reproducible from documented input assumptions. The scope below maps the historical period, the forecast horizon, the segmentation dimensions, and the countries covered, alongside the underlying primary and qualitative methodology.
Historical Period
2020 to 2025
Forecast Period
2026 to 2036
Base Year
2025 (USD billions; MMA Primary Research Dataset, August 2026)
Market Definition
The home sleep screening devices market covers portable diagnostic devices, sensors, and companion software used to screen and diagnose obstructive sleep apnea and related sleep-disordered breathing outside a monitored sleep laboratory setting. It excludes in-lab polysomnography systems requiring overnight technician supervision and excludes continuous positive airway pressure therapy devices used for ongoing treatment rather than diagnosis.
Quantitative Units
USD billions (current prices); installed device fleet volume and annual test count where applicable
Segmentation Dimensions
By Product and Technology Type; By End-Use Setting; By Commercial Dimension; By Region
Regions Covered
North America, Western Europe, East Asia, South Asia and Pacific, Latin America, Middle East and Africa, Eastern Europe
Countries Covered
USA, China, Germany, France, UK, Japan, South Korea, India, Australia, Canada, Brazil, Mexico, Indonesia, Vietnam, Thailand, Malaysia, UAE, Saudi Arabia, South Africa, Nigeria, Turkey, Poland, Netherlands, Italy, Spain, Sweden, Switzerland, Argentina, Colombia, Singapore, and additional markets relevant to this sector
Key Companies Profiled
ResMed Inc., Koninklijke Philips N.V., Natus Medical Incorporated, Itamar Medical Ltd., Nox Medical ehf., SOMNOmedics GmbH, Cadwell Industries, Inc., Compumedics Limited, Cleveland Medical Devices Inc., MyCardio LLC, Fisher & Paykel Healthcare Corporation Limited, BMC Medical Co., Ltd., Löwenstein Medical Technology GmbH, Braebon Medical Corporation, NovaSom, Inc., SleepScore Labs, Onera Health B.V., Ectosense NV, SunTech Medical, Inc., Curative Medical, Inc.
Quantitative Methodology
Primary survey, n=3,800 respondents, Q4 2025, six countries; demand-side model with trade association cross-validation
Qualitative Methodology
47 expert interviews, Q4 2025; applied to validate demand model assumptions, identify emerging dynamics, and assess competitive positioning
Report Format
PDF and XLSX data workbook (Word format preview document)
Publisher
Market Minds Advisory
Report Code
MMA-2026-MED-103
Published
August 2026
Contact
sales@marketmindsadvisory.com | www.marketmindsadvisory.com

Purchase the full Home Sleep Screening Devices Market Report (2026 to 2036).

The full Home Sleep Screening Devices Market report delivers granular five-year and ten-year forecasts across all six product segments, payer coverage tracking by region, and vendor benchmarking drawn from MMA's proprietary diagnostic device performance database. It includes detailed profiles of all twenty companies covered here, extended regional analysis across every major clinic market, and a reimbursement tracker spanning major payer coverage decisions and validation study milestones. Subscribers receive quarterly data refreshes through the full forecast period. Buyers also gain direct analyst access for engagement-specific questions throughout the subscription term.
Payer coverage tracker by region and program
Ten-year segment-level forecasts across all products
Vendor benchmarking data across hardware and software
Validation study tracking module for major markets
Twenty-company competitive profiles with moat analysis
Quarterly data refresh access throughout subscription

Built For The People Who Decide

From boardroom strategy to bench-side execution, this report is read cover-to-cover by leaders shaping the next decade of their industry, turning demand scenarios, market dynamics and valuation benchmarks into decisions.
CXOs/ Presidents/ VPs/ Managers
M&A and Corporate Development
Strategy Teams and R&D Heads
Procurement and Product Directors
Regulatory and Compliance Leaders
Investor Relations and Equity Analysts