Market Minds Advisory
Home Scales Market

Home Scales Market: Body Composition Demand, Commodity Hardware, and the Accuracy Problem

Millions of people are now losing weight on incretin drugs and need to know whether it is fat or muscle disappearing, which is a question the number on a bathroom scale cannot answer.

Lead Analyst

Alice Ballenger

Published

September 2026

Make Smarter Decisions with Customized Research Insights

Request a free sample report and evaluate market opportunities, growth trends, and competitive dynamics relevant to your business needs.

2025 MARKET VALUE$2.4BMarket Size 2025
2036 FORECAST VALUE$4.8BBase Case , 2026 to 2036
CAGR 2026 TO 20366.6 %Bull 7.9% / Bear 5.4%
INCREMENTAL OPPORTUNITY$2.3BNet 10- year value creation
EXPANSION MULTIPLE1.89x2036 value over 2026 base
Strategic Levers
M&A Pipeline
Regional Outlook
Country Rankings
Competitive Intelligence
Segmental Deep-dive
Call-Us : 91 93563 13602

Executive Snapshot and Market Trajectory

A weight-loss drug cohort has changed what people want a scale to tell them. Someone shedding a fifth of their body mass wants to know how much of it was muscle, and a single number cannot say. That question is now driving the category.
Smart connected body composition scales compound at 9.9%, a full 1.50x the market rate, because bioimpedance at least attempts the answer that a plain reading cannot supply. East Asia holds the largest share at 30%, on two reinforcing foundations: Chinese factories build roughly 82% of the world's home scales, and Chinese connected brands sell them domestically at prices Western labels cannot approach. Validation or subscription is the only escape from a thirty dollar shelf price.
Concentration is very low at 29%. Hardware has become genuinely commodity, with load cells, wireless chips and enclosures available to anyone from the same contract manufacturers, and a connected scale that cost well over a hundred dollars a decade ago now retails near thirty. Differentiation has moved entirely to the application, the data and the clinical validation behind the reading. Nobody in this industry created that demand.
Market Definition
This market covers weighing devices sold for domestic and personal use, spanning mechanical bathroom scales, digital bathroom scales, smart connected body composition scales, kitchen and food scales, baby and infant scales, and portable luggage scales. Measurement is at manufacturer revenue across retail, online and direct channels. Professional medical and clinical scales, industrial and commercial weighing equipment, retail point-of-sale scales, laboratory balances, and wearable devices that estimate body composition without weighing are excluded.
Base Year Value
$2.4B in 2025 (MMA Primary Research Dataset, August 2026)
Forecast Period
2026 to 2036, eleven discrete annual values
CAGR
6.6% base case. Bull 7.9%. Bear 5.4%.
Fastest Growth Segment
Smart Connected Body Composition Scales: 9.9% CAGR
Fastest Growth Country
India: 10.8% CAGR
Fastest Growth Region
South Asia and Pacific: 8.8% CAGR
Largest Region
East Asia: 30% of 2025 global value
Market Leaders
Tanita, Omron Healthcare, Withings, Xiaomi, and Beurer. Source: MMA Primary Research Dataset, July 2026.
Primary Survey
n=3,800 procurement and R&D decision-makers, Q4 2025, six countries
Methodology
Demand-side build-up, cross-validated against public data, 47 expert interviews

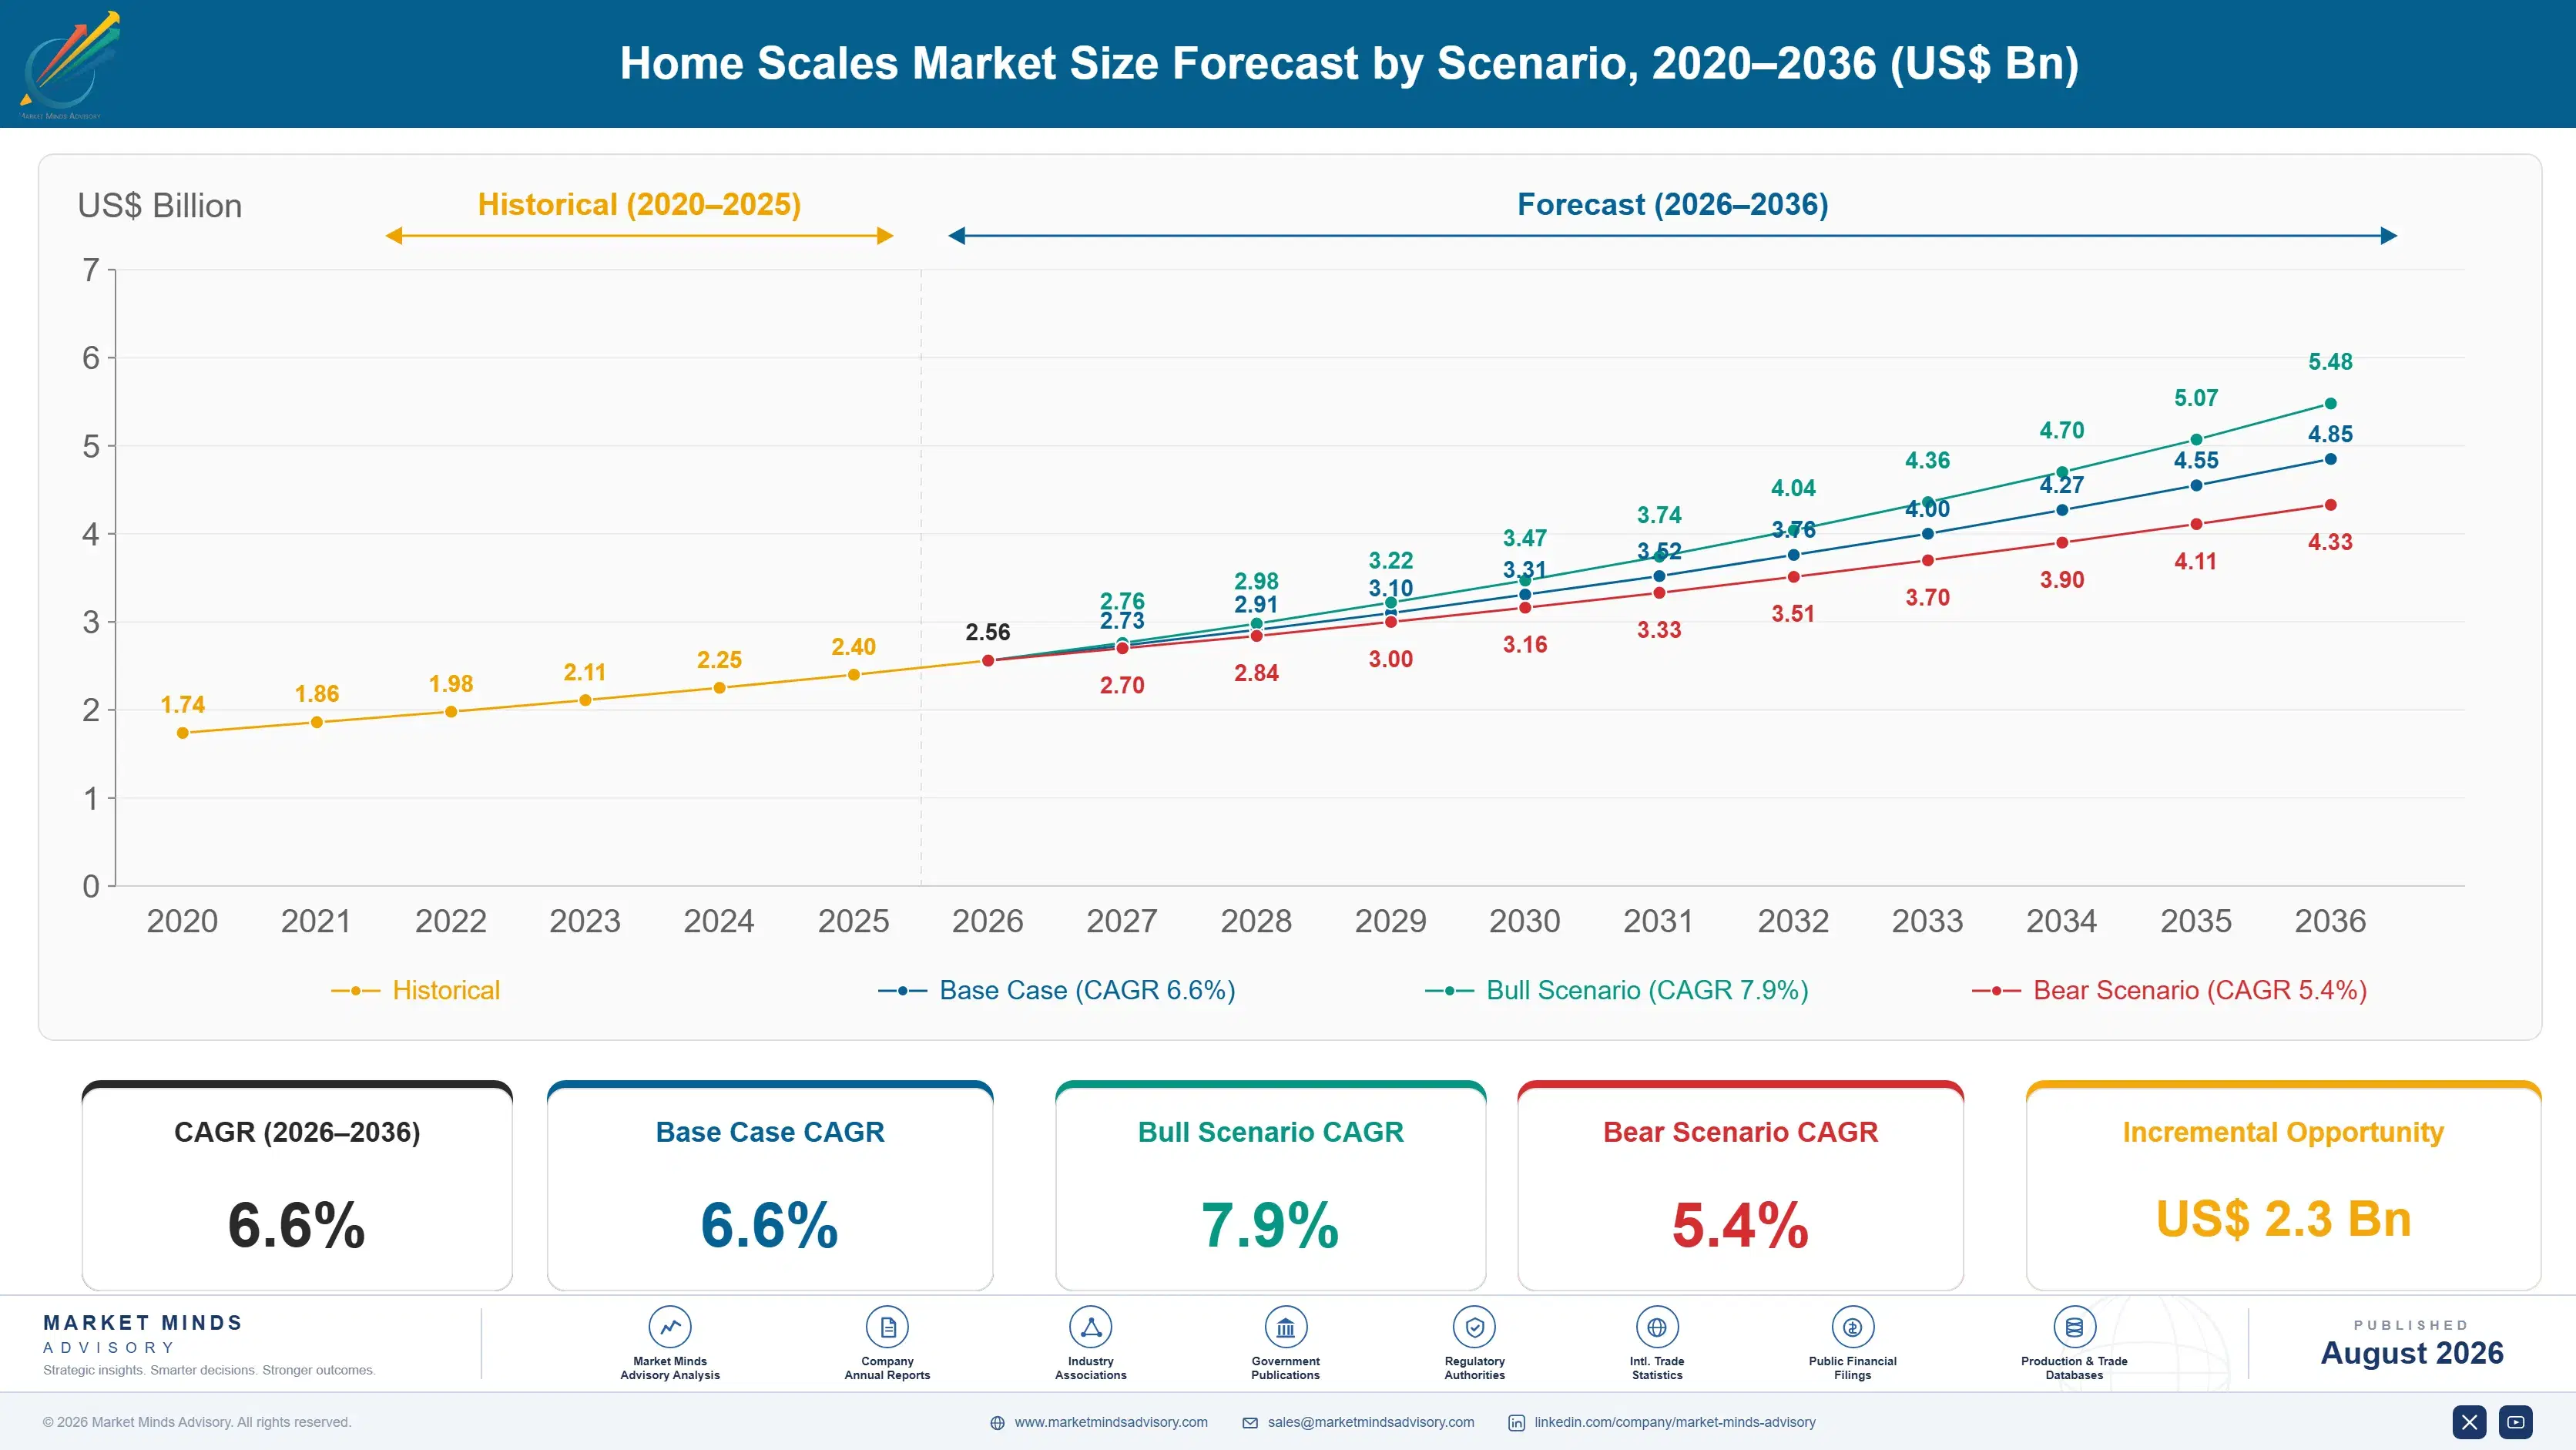
Home Scales Market Forecast Scenarios

home-scales-market-size-forecast-scenario-1787303485052
Growth ran at roughly 5.3% between 2020 and 2025, and lockdown conditions supplied an unusually clean surge. Home fitness, home baking and health tracking all expanded sharply through 2020 and 2021, lifting bathroom and kitchen scale volumes together. That demand then fell back through 2022 and 2023 as households worked through purchases made early, until weight-loss pharmacotherapy gave the category an entirely new reason to exist.
Base case growth of 6.6% rests on three mechanisms. Incretin weight-loss therapy has created a large cohort tracking body composition rather than weight alone, and that cohort upgrades from basic scales deliberately. Connected devices keep taking share as the price premium over unconnected models narrows toward nothing. And emerging market household formation adds first-time buyers across South Asia, Southeast Asia and Latin America at volumes that developed markets no longer supply.
The bull case at 7.9% assumes bioimpedance validation improves enough for clinicians to recommend home body composition tracking formally, which would move the category from consumer preference into care pathway. The bear case at 5.4% is a credibility case: published comparisons against reference methods showing wide variance could damage consumer trust in body composition claims across the whole category at once.

Home Scales: Composition Demand Against Commodity Hardware

The hardware stopped being interesting some years ago. A strain gauge load cell, a wireless chip, a glass platform and a moulded base are available to any brand from the same Guangdong and Zhejiang contract manufacturers, and roughly 82% of world output comes from that cluster. A connected scale retailing above a hundred dollars in 2015 now sells near thirty. Nobody wins on components.
TOP FIVE CONCENTRATION29%Fragmented brand landscape built on shared contract manufacturing platforms
CONNECTED DEVICE SHARE34%Units shipping with wireless connectivity and companion application support
AVERAGE RETAIL PRICEUSD 28Blended global shelf price across all home weighing device categories
BIOIMPEDANCE ACCURACY VARIANCE4.2 pointsTypical body fat deviation against clinical reference measurement methods
REPLACEMENT CYCLE LENGTH6 yearsAverage interval before households replace a working bathroom scale
CHINA MANUFACTURING SHARE82%Global unit output originating from very few manufacturing clusters
Demand has been reshaped by a category nobody in this industry created. Millions of people losing substantial weight on incretin therapy need to know whether they are losing fat or lean mass, because rapid loss strips muscle alongside it. A number on a display answers nothing. Segmental bioimpedance at least estimates the split, and that single question has driven the fastest upgrade cycle the category has seen.
The awkward fact is that bioimpedance is not very accurate. Against clinical reference methods, consumer devices typically deviate by around four percentage points of body fat, and readings shift with hydration, meal timing and skin temperature. Consumers largely do not know this. Brands that publish validation data and design for repeatability rather than absolute accuracy are building a defensible position; the rest are selling precision they do not have.
"This category spent twenty years being a commodity and then a class of weight-loss drugs handed it a genuine clinical question to answer. The uncomfortable part is that the technology in a thirty dollar scale cannot answer it very well, and almost nobody buying one knows that."
Director, Connected Health and Consumer Devices Practice · MMA Technology Practi

Market Trends

Weight-loss pharmacotherapy creates genuine body composition demand

Incretin therapy produces weight reduction faster than diet and exercise ever did, and a meaningful share of that loss is lean tissue rather than fat. Patients and clinicians both care about the split, because muscle loss carries functional consequences that the scale reading conceals entirely. Consumer devices with segmental bioimpedance estimate the division and present it over time, which is the closest thing to an answer available at home. That question has driven the fastest upgrade cycle this category has experienced in two decades. Clinics and telehealth prescribers reach that cohort far more directly than retail.
Market Impact: Adds over 40 million households

Connectivity premium narrows toward nothing at retail

Wireless connectivity once carried a price premium of fifty dollars or more, funded by app development and cloud infrastructure that few brands could build. Component integration has erased most of it, and a Bluetooth system-on-chip now costs less than the glass platform it sits under. Roughly 34% of units ship connected, and that share rises every year as the premium disappears. The consequence is that connectivity has stopped being a differentiator and become an expectation, which moves competition to what the application actually does with the data. Households ignoring the application show no brand loyalty whatsoever at the next purchase.
Market Impact: Retains buyers across 6 year cycles

Market Opportunities and Growth Drivers

Emerging market household formation adds first-time buyers steadily

Developed markets replace scales roughly every six years and add very few new households, so volume there is essentially a replacement business. India, Indonesia, Vietnam, Brazil and Nigeria are different: organised retail and online marketplaces are reaching households that have never owned a bathroom or kitchen scale, and unit prices well below ten dollars make the purchase trivial. Volume growth in those markets is genuinely additive rather than substitutional, and Chinese manufacturers supply almost all of it. Chinese manufacturers supply nearly all of that volume, so value growth in those markets trails unit growth by a wide margin.
Market Impact: Deviation around 4.2 percentage poi

Health application integration turns readings into longitudinal records

A scale that syncs to Apple Health, Google Fit, Samsung Health or a brand platform converts an isolated number into a trend line, and trend lines are what change behaviour. That integration also creates switching cost, because a household with three years of history in one application will not restart it elsewhere without a reason. Brands treating the application as the product rather than as an accessory to the hardware retain customers through replacement cycles that would otherwise be entirely open. That makes the application an investment justified by hardware retention rather than by any revenue it generates directly.
Market Impact: Blended price down near 28 dollars

Market Restraints and Challenges

Bioimpedance accuracy falls well short of what buyers assume

Consumer body composition scales typically deviate by around four percentage points of body fat against clinical reference methods, and readings move with hydration, recent meals, exercise and skin temperature. The root cause is that bioimpedance infers composition from electrical resistance through a population equation rather than measuring anything directly. Commercial impact is a category selling precision it cannot deliver, exposed to a single credible published comparison. Serious brands respond by publishing validation data and positioning on repeatability rather than absolute accuracy. Consumers buying these devices are largely unaware of any of it.
Market Impact: Roughly 25% of loss is lean

Commodity hardware leaves brands with almost nothing to defend

Load cells, wireless chips, glass platforms and enclosures all come from the same contract manufacturers, and roughly 82% of world output originates in a handful of Chinese clusters supplying every brand equally. The root cause is that the underlying engineering was solved decades ago and has no remaining difficulty. Commercial impact is relentless price erosion toward a blended shelf price near twenty eight dollars. Brands escape only through application design, subscription services or clinical validation that a contract manufacturer cannot replicate. No procurement strategy addresses a problem that every competitor faces identically.
Market Impact: Connected share reaching 34% of uni
4 additional market trends, 2 additional growth drivers, and 3 additional restraints and challenges are covered in the full report. Contact sales@marketmindsadvisory.com to access the complete intelligence.

Segment CAGR and Growth Architecture

Segmentation follows product type, because product type determines the purchase occasion, the retail channel, the price point and the buyer's reason for choosing one device over another. Six product types cover home weighing without overlap. Connectivity cuts across several types and is treated as a feature attribute rather than as a segment in this hierarchy.
home-scales-market-market-share-analysis-1787303485601

Smart Connected Body Composition Scales

Growing at 9.9%, a full 1.50x the market rate, these devices pass a small current through the body to estimate fat, muscle and water distribution, then present the result as a trend inside an application. Weight-loss pharmacotherapy transformed demand for exactly that output, because patients losing mass rapidly want to know how much of it was muscle. Segmental models measuring limbs separately command a further premium. The category's difficulty is that accuracy against clinical reference methods is modest, so brands publishing validation data and designing for consistent repeat readings hold a genuinely defensible position. Clinicians and telehealth prescribers now recommend specific devices to patients, which is a channel general retail marketing never reaches.
CAGR 9.9%

Kitchen and Food Scales

Kitchen scales grow at 7.4% on two quite separate demand sources. Macro and calorie tracking applications require gram-level food weighing, and connected kitchen scales that log directly into a nutrition app remove the most tedious step in that routine. Separately, specialty coffee has created a genuine premium niche where scales with millisecond timers and flow-rate display sell at many times the price of an ordinary kitchen model, supported by brands including Acaia, Fellow and Timemore. Both sources are small in unit terms and unusually resistant to the price erosion affecting bathroom scales. Buyers in both sub-categories select on a specific capability rather than by comparing shelf prices across near-identical products.
CAGR 7.4%
Full segment breakdown across 6 segments available in the complete report.

Regional Architecture and Country Demand Map

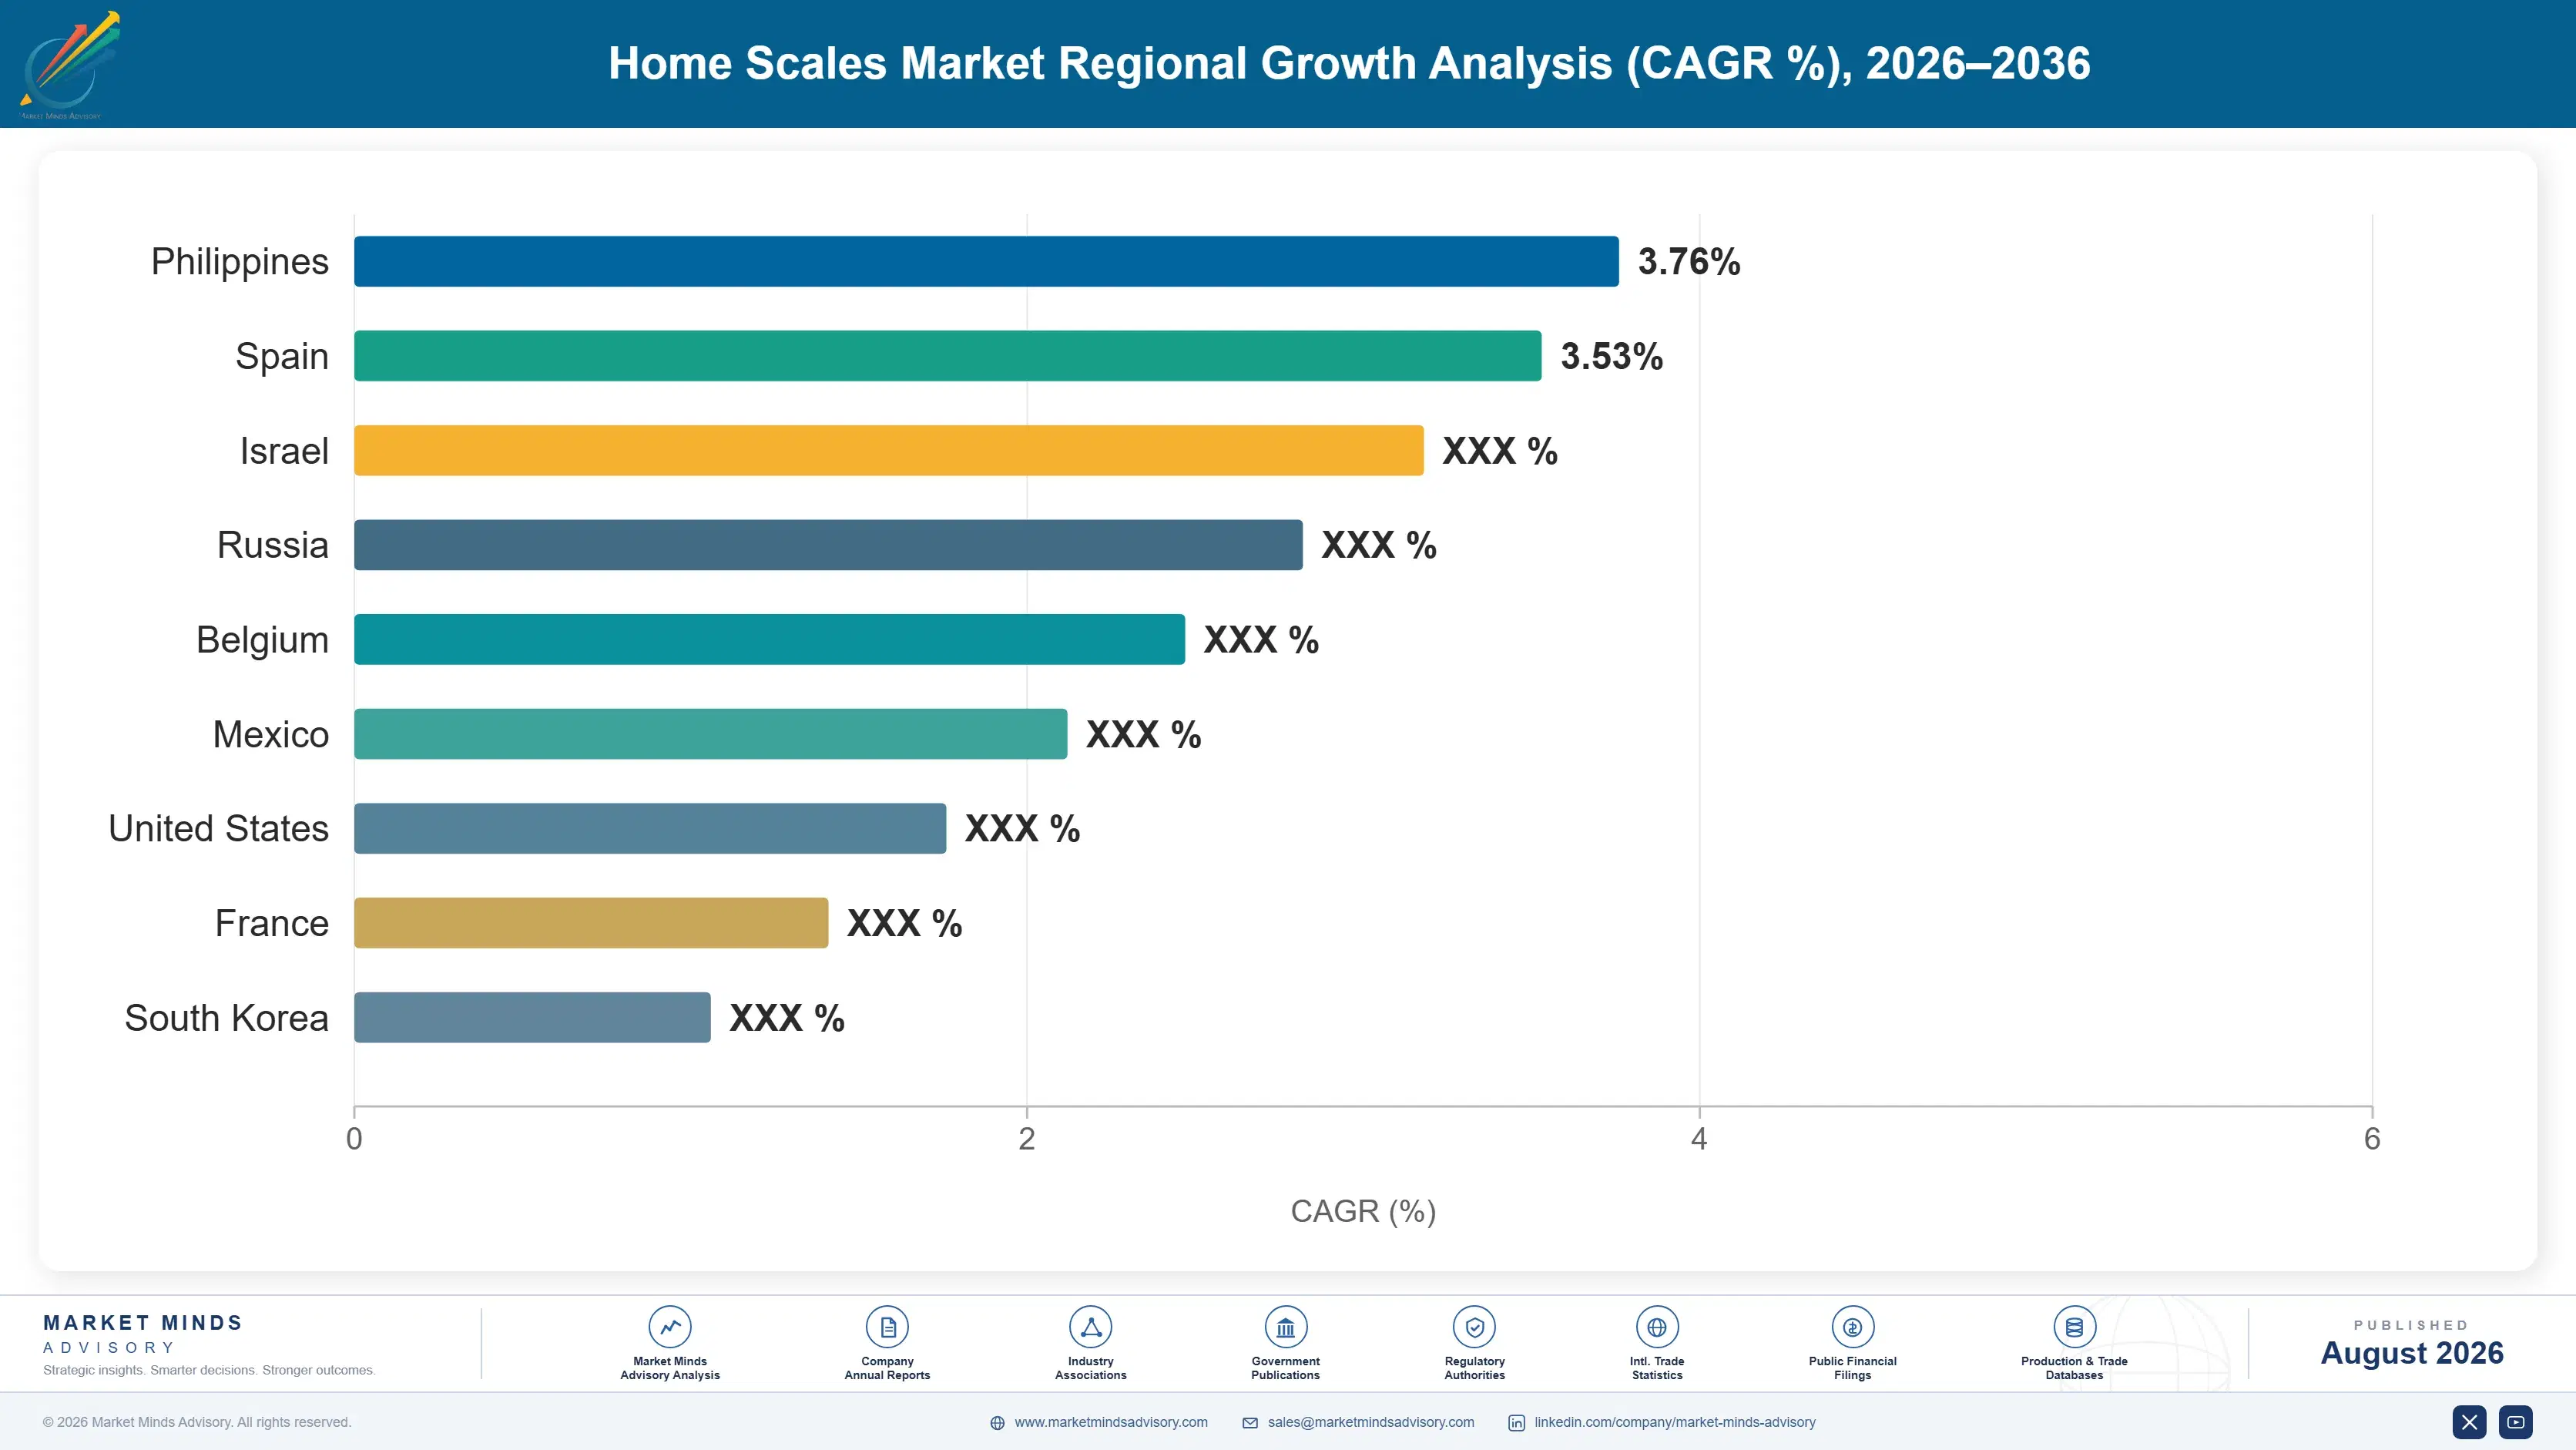
Regional value follows household penetration and average selling price together, and those pull in opposite directions. Mature markets buy fewer units at higher prices, while Asian and Latin American demand is expanding on volume at price points developed markets abandoned years ago. Unit share and value share diverge widely.

East Asia

East Asia takes the largest share at 30% on two foundations that reinforce each other. Chinese manufacturing clusters in Guangdong and Zhejiang produce roughly 82% of the world's home scales and supply almost every international brand from the same lines, so the region captures value regardless of whose label appears on the glass. Domestically, Xiaomi and Huawei sell connected body composition scales at prices Western brands cannot match, and Chinese households adopted them quickly. Japanese demand is different again, anchored by Tanita and Omron whose body composition heritage and clinical validation support pricing several times the regional average. Manufacturing scale and domestic demand reinforce each other here in a way no other region comes close to matching.
Share: 30% | CAGR: 7.6% (2026 to 2036)

North America

Twenty-four per cent of value on comparatively modest unit volumes, because United States retail pricing sits well above the global average and connected device penetration is the highest of any region. Weight-loss pharmacotherapy has been adopted faster here than anywhere, and the body composition upgrade cycle that followed is correspondingly further advanced. Withings, Garmin and a cluster of online-native brands compete hard on application quality rather than hardware. Growth at 6.0% reflects a replacement market with high existing penetration, where new demand depends on upgrade triggers rather than on households buying a first device. Clinical channel access is further developed here than anywhere else tracked in this report, and it is still barely used.
Share: 24% | CAGR: 6.0% (2026 to 2036)
Regional intelligence for 5 additional markets available in the complete report: Western Europe, South Asia and Pacific, Latin America, Middle East and Africa, Eastern Europe. Contact sales@marketmindsadvisory.com.
home-scales-market-country-cagr-analysis-1787303486120

Where Scale Brands Actually Make Money

The hardware is a commodity available to anyone from the same factories, and shelf pricing reflects that precisely. Value accrues to whoever answers a question the reading itself cannot, to whoever owns the longitudinal record, and to whoever can substantiate a claim that competitors merely assert. The reading itself is worth very little indeed.

Publish validation data instead of asserting accuracy

Consumer bioimpedance deviates by roughly four percentage points of body fat against clinical reference methods, and every brand in the category implies precision it cannot demonstrate. Publishing comparison studies and positioning on repeatability rather than absolute accuracy converts a shared weakness into a differentiator. Brands with published validation sustain retail pricing roughly 60% above unvalidated equivalents, and they are considerably better placed if a credible independent comparison ever damages category trust. The studies cost far less than a single season of marketing. Nobody else in the category has done it.
Market Impact: Sustains roughly 60% higher retail

Treat the application as the product it actually is

Hardware differentiation ended when contract manufacturers began supplying every brand from the same lines, and roughly 82% of world output now originates in one manufacturing cluster. What a household cannot easily replace is three years of body composition history inside an application it uses daily. Brands designing the application first and the scale second retain customers through replacement cycles that would otherwise be entirely open. That is a software investment justified by hardware retention, which most consumer device organisations find awkward to fund. Application-linked households repurchase the same brand at roughly 4 times the rate of others.
Market Impact: Protects revenue across full 6 year

Build for the weight-loss pharmacotherapy cohort deliberately

Patients losing mass rapidly on incretin therapy want to know how much was muscle, and roughly a quarter of the loss typically is. That is a specific question with a specific audience, reachable through weight management clinics, telehealth prescribers and pharmacy channels rather than through general retail. Segmental measurement, lean mass trending and clinician-shareable reports address it directly. Brands that positioned for this cohort early captured an upgrade cycle that general fitness messaging reached far too slowly to compete with. Clinically motivated buyers show roughly 40% lower price sensitivity than the fitness cohort ever did.
Market Impact: Around 25% of that loss is lean tis

Defend premium niches that price erosion has not reached

Bathroom scale pricing has collapsed toward twenty eight dollars blended, while specialty coffee scales with flow-rate display and millisecond timing sell at many multiples of an ordinary kitchen model and hold those prices firmly. Baby scales with sensitive tare functions behave similarly. These niches are small in units and disproportionate in margin, because buyers are selecting on a specific capability rather than on price. Brands treating them as marginal product lines rather than as deliberate margin positions are misreading where category profit actually sits. These niches hold pricing at several multiples of the 28 dollar average.
Market Impact: Holds several multiples of the 28 d

Who Controls the Margin Pool

Concentration is very low at 29% across the top five, measured on annual revenue from home and personal weighing devices, the single basis applied throughout. Tanita and Omron Healthcare lead on body composition heritage and clinical validation, Withings on connected health platform depth, Xiaomi on volume at price points nobody else attempts, and Beurer on European retail presence. Very few of these companies actually manufacture their own hardware.
Competition runs on three dimensions, none of them hardware. Application quality and data continuity decide retention, because a household with years of history will not restart elsewhere. Validation and clinical credibility decide whether a body composition claim survives scrutiny, and only a minority of brands publish anything. Price decides everything in the unconnected and entry segments, where contract manufacturing means every product is effectively the same device.

Pressure builds from two directions. Chinese connected brands including Xiaomi sell capable body composition scales at a fraction of Western pricing, and their applications have improved to the point where the quality gap is narrowing. Separately, smart rings, watches and body scanning applications estimate composition without any scale at all. Rankings shift most where a brand converts a hardware sale into a health service relationship.
home-scales-market-company-positioning-matrix-1787303486642

Competitive Moat and Risk Dimensions

TANITA

Moat: Clinical body composition credibility

Tanita built bioimpedance body composition analysis for clinical and research use before consumer devices existed, and its professional analysers remain reference equipment in sports science and nutrition practice. That heritage supports validation claims consumer brands cannot substantiate, and it gives the company access to clinical and institutional channels that ordinary retail competitors never reach at all.
TANITA

Risk: Consumer price erosion exposure

Consumer bathroom scale pricing has collapsed toward commodity levels, and Chinese connected brands deliver comparable measurement at a fraction of the price. Clinical heritage supports premium positioning but does not protect volume in general retail. The company's application platform is less developed than platform-native competitors whose software was the starting point.
WITHINGS

Moat: Connected health platform depth

Withings built a health platform spanning scales, blood pressure monitors, sleep tracking and watches, which means a household adopting one device accumulates records across several. That longitudinal data creates switching cost far exceeding anything the hardware justifies, and the subscription layer converts a one-off purchase into recurring revenue that no contract manufacturer can replicate.
WITHINGS

Risk: Subscription conversion dependence

Platform economics only work if enough households actually subscribe, and consumer health subscriptions face persistent churn once initial motivation fades. Hardware pricing pressure from Chinese competitors continues regardless. Apple, Google and Samsung platforms increasingly aggregate the same health data natively, which weakens the case for a brand-specific application over time.

Players Tracked

Prominent Players

Tanita
Omron Healthcare
Withings
Xiaomi
Beurer

Other Key Players

Salter Housewares
Taylor Precision Products
Escali
Helen of Troy
Vesync
RENPHO
Anker Innovations
Garmin
Seca
A&D Company
Soehnle
Terraillon
Acaia
Fellow Products
Timemore

Recent Developments

FEBRUARY 2025

Withings extends body composition reporting toward clinical sharing

Withings expanded body composition reporting within its health application to support sharing readings with clinicians, an organic software development rather than any acquisition, aimed at patients tracking lean mass changes while receiving incretin weight-loss therapy under medical supervision. No hardware change at all accompanied the software release.
Signal: The weight-loss cohort is being reached th
JULY 2025

Chinese connected scale exports reach record annual volume

Chinese manufacturers reported record annual export volumes of connected body composition scales, supplying both domestic brands and international labels from the same Guangdong and Zhejiang production lines, at unit costs that Western contract alternatives have been unable to approach. International brands and domestic labels shared the same lines.
Signal: Manufacturing concentration means that tar
JANUARY 2026

Tanita publishes comparison study against clinical reference measurement

Tanita published a comparison of its consumer segmental bioimpedance devices against dual-energy absorptiometry reference measurement, an unusual step in a category where accuracy is generally asserted rather than demonstrated, and where competing brands publish nothing comparable at all. Competing brands currently publish nothing at all comparable.
Signal: Published validation is becoming a commerc

Load Cell, Glass and Electronics Exposure

Cost structures are dominated by a small number of inexpensive components, which is precisely the problem. Strain gauge load cells and the associated analogue front end account for roughly 23% of device cost of goods, with tempered glass or moulded platform contributing a further 21%. Wireless chips, display and battery carry the remainder, and every one is a commodity available to any brand.
Component allocation through 2021 and 2022 illustrated the exposure. Wireless microcontroller lead times stretched from weeks to many months during semiconductor allocation, and brands without standing supply commitments simply could not build, whatever they were willing to pay. Anker Innovations and Garmin both referenced component availability and cost pressure in reporting across those years. Shelf pricing could not absorb it, since retail price points here are fixed by competitive expectation.

The disadvantage falls on brands without manufacturing scale or standing relationships. A label ordering fifty thousand units annually from a contract manufacturer queues behind one ordering five million, and pays accordingly. Geography compounds it: roughly 82% of world output comes from Chinese clusters, so any brand attempting to source elsewhere faces both higher unit cost and a supplier base with far less experience building these specific devices.
home-scales-market-cost-volatility-analysis-1787303486837

Consolidate volume onto fewer contract manufacturing partners

Fragmented ordering across several factories leaves a brand at the back of every allocation queue and paying small-volume pricing on identical components. Concentrating annual volume with one or two partners improves both cost and priority materially, at the price of a dependency that has to be managed deliberately through second-source qualification on critical parts.

Hold standing wireless component commitments through quiet periods

Wireless microcontroller allocation decided who could manufacture during the last shortage, and price was largely irrelevant to it. Standing purchase commitments cost more when supply is comfortable and are the difference between shipping and not shipping when it is not. Few consumer brands in this category carry them through the quiet years. Price was largely irrelevant to allocation.

Shift margin defence toward software and subscription revenue

Component cost movement cannot be passed through, because retail price points are fixed by competitive expectation rather than by cost. Application subscriptions and premium data services carry no component exposure at all. Moving revenue mix toward them provides a cushion that no procurement strategy in a commodity hardware category can supply on its own.

Portfolio Architecture for Margin Defence

Margin architecture divides on whether a contract manufacturer can supply the same thing to somebody else. Mechanical and basic digital bathroom scales are identical across brands and earn commodity returns accordingly. Connected body composition devices earn more, though the premium narrows every year as connectivity components cheapen. Specialty niches and validated clinical-grade devices earn most, because the buyer is selecting on a specific capability rather than comparing shelf prices.
The volume versus premium tension is unusually clean here. Basic bathroom and luggage scales supply most units and almost none of the profit, and no brand position survives in them. Specialty coffee scales, baby scales, segmental body composition devices and subscription-linked platforms supply few units and most of the margin. Companies treating the low end as a volume base to defend are funding it from the parts that actually earn.

High-value pools sit where a claim has been substantiated or a service has been attached. Published validation supports pricing that assertion cannot. Subscription health platforms convert a one-off purchase into recurring revenue with no component cost. Clinician-shareable reporting reaches a channel that general retail never touches. Plain digital bathroom scales sold through open online marketplaces sit at the opposite extreme entirely.

Volume / Commodity-Adjacent Tier

Mechanical and basic digital bathroom scales, luggage scales and entry kitchen models, identical across brands because they come from the same contract manufacturers and compete purely on shelf price and marketplace ranking.
Gross Margin: 16-26%

Premium / Certified Tier

Connected body composition scales with capable applications and established brand positions, where measurement features and software quality still support a premium that narrows steadily as connectivity components keep cheapening. Brand recognition still counts here and it is eroding.
Gross Margin: 32-46%

Sustainability / Regulatory / Next-Generation Tier

Published-validation body composition devices, segmental analysers, specialty coffee and precision kitchen scales, and subscription-linked health platforms. Best margins in the category and the positions contract manufacturing cannot replicate. Buyers here select on capability rather than on price.
Gross Margin: 48-64%
home-scales-market-portfolio-architecture-1787303487339

Replacement Cycles Against Upgrade Triggers

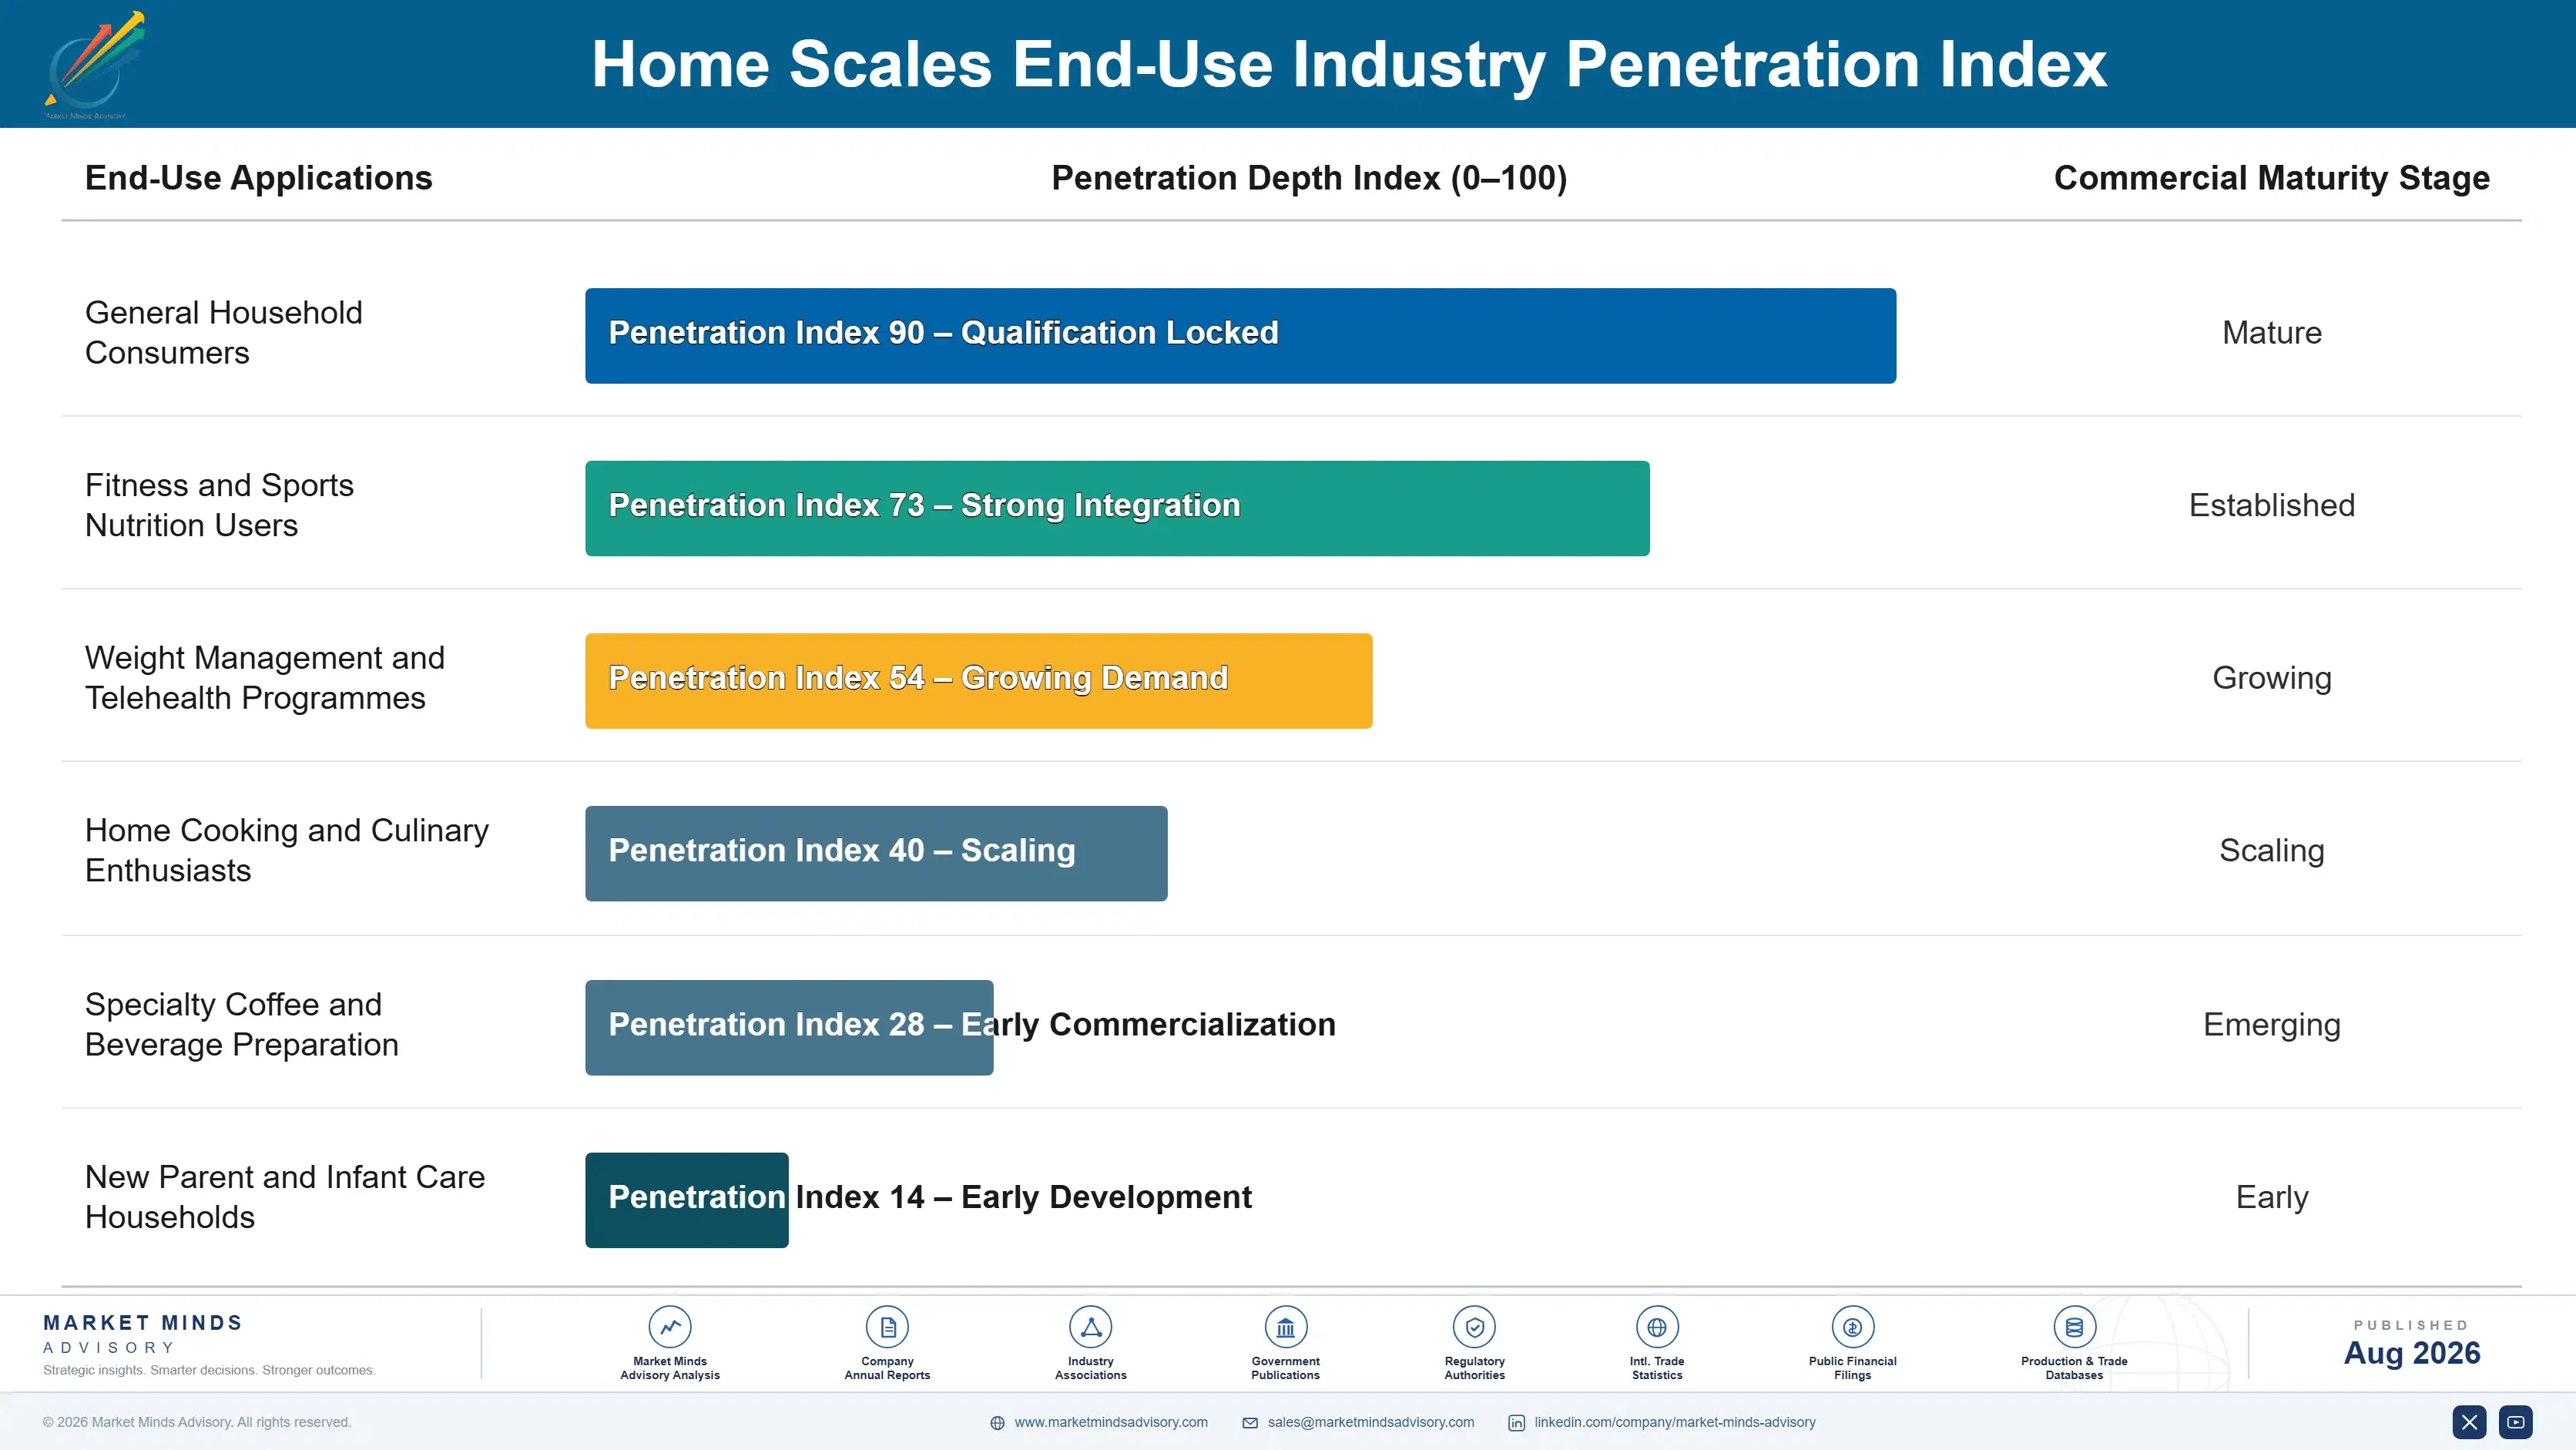
Household demand in mature markets is almost entirely replacement, on a cycle running near six years and driven by breakage or by a household move rather than by any product improvement. A working scale is rarely replaced voluntarily. That makes upgrade triggers unusually important commercially: a weight-loss programme, a new fitness commitment or a pregnancy prompts purchases that the ordinary replacement cycle would never have generated at all.
Stickiness depends entirely on accumulated data. A household with three years of body composition history inside an application will not restart that record elsewhere without a strong reason, and brands with capable platforms retain customers across replacement cycles that would otherwise be completely open. Households using an unconnected scale, or ignoring the application, show no loyalty and buy on price next time.

Buyer profiles have shifted with the weight-loss cohort. Purchases were historically made by fitness-motivated adults and by households buying a basic utility item. Today a substantial and growing group is buying on clinical motivation, often prompted by a prescriber, and reachable through weight management clinics, telehealth services and pharmacy channels rather than through general retail. That buyer selects on measurement capability rather than price.
home-scales-market-end-use-penetration-index-1787303487829

Where Scale Strategy Must Land

These are among the four positions where our research anticipates prominent divergence between winners and laggards over the coming forecast period. Each is grounded in the demand model, the regulatory perimeter, and the announced capacity pipeline.
01 / VALIDATION PUBLICATION PRIORITY

Publishing accuracy data beats asserting it repeatedly

Consumer bioimpedance deviates by roughly four percentage points of body fat against clinical reference methods, and essentially every brand in the category implies a precision it has never demonstrated to anybody. Publishing comparison studies and positioning on repeatability rather than on absolute accuracy converts a shared category weakness into a genuine commercial differentiator. Brands carrying published validation sustain retail pricing around 60% above otherwise unvalidated equivalents, and commissioning those studies costs considerably less than a single season of consumer advertising.
02 / APPLICATION INVESTMENT PRIORITY

The software is the product and the scale is packaging

Roughly 82% of world output now comes from a single manufacturing cluster supplying every brand from the very same production lines, which means hardware differentiation ended some years ago and is plainly not coming back. What a household genuinely cannot replace is three years of accumulated body composition history sitting inside an application it opens regularly. Brands designing the application first retain customers across the six year replacement cycles that would otherwise sit completely open to whoever happens to price lowest.
03 / CLINICAL CHANNEL ACCESS

Reach the weight-loss cohort through prescribers, not retail

Patients losing mass rapidly on incretin therapy want to know how much of it was muscle, and roughly a quarter of that loss typically is lean tissue rather than fat. This is a very specific question with a specific audience, reachable through weight management clinics, telehealth prescribers and pharmacy channels that general fitness marketing never touches at all. Brands positioning deliberately for that particular cohort captured an upgrade cycle that competitors relying on retail reached far too slowly to contest.
04 / NICHE MARGIN RECOGNITION

Category profit sits in segments most brands treat marginally

Bathroom scale pricing has collapsed toward a blended twenty eight dollars globally while specialty coffee scales, segmental analysers and sensitive baby scales hold prices at several multiples of that and show no erosion at all. Buyers across each of those niches select on one specific capability rather than by comparing shelf prices between near-identical commodity products. Companies treating those niches as marginal lines rather than as deliberate margin positions are simply misreading where the profit in this category actually sits.

Engagement Snapshot From the Field

A live engagement with an industry participant carrying material or product regulatory and market exposure ahead of a defining policy shift, showing how our research translates into a defensible multi-year portfolio strategy.
MARKET MINDS ADVISORY · CLIENT ENGAGEMENT SUMMARY
Home Scales Producer Strategic Portfolio Review and Transition Roadmap 2026·Investment Scenario on Home Scales Exposure Evaluation 2025-26
CLIENT PROFILE
A European consumer health device brand selling connected bathroom scales, blood pressure monitors and kitchen scales across European and North American retail and online channels, with annual scale revenue of approximately USD 78 million (client-reported, unverified by MMA). Roughly 68% came from connected bathroom scales sold through general retail. The company published no validation data for its body composition measurement and operated no subscription service.
STRATEGIC CHALLENGE
Average selling prices on connected scales had fallen for four consecutive years as Chinese brands matched features at half the price, and retail buyers were treating the category as a promotional line. The board wanted to know whether to compete on cost through consolidated contract manufacturing, or to reposition around validated body composition measurement and clinical channel access where price comparison applied less directly.
MMA APPROACH
MMA conducted 47 expert interviews across retail category buyers, weight management clinicians, telehealth prescribers, sports nutrition practitioners and contract manufacturing operators in six countries. A quantitative survey of 3,800 consumers established purchase triggers, feature priorities and price sensitivity across fitness-motivated and clinically-motivated buyer groups. We then modelled revenue and margin under both options against observed price erosion and weight-loss therapy adoption rates in each market.
KEY FINDINGS
  1. Clinically-motivated buyers on weight-loss therapy showed markedly lower price sensitivity than fitness-motivated purchasers and selected primarily on lean mass measurement capability rather than on brand.
  2. Retail category buyers in five of six markets planned further promotional pricing on connected scales, and none regarded published accuracy data as relevant to their shelf decisions at all.
  3. Weight management clinicians and telehealth prescribers reported recommending specific devices to patients regularly, and no manufacturer had approached any of them through that channel.
  4. Households with more than two years of history in a companion application repurchased the same brand at roughly four times the rate of households using unconnected devices.
CLIENT PROFILE
A European consumer health device brand selling connected bathroom scales, blood pressure monitors and kitchen scales across European and North American retail and online channels, with annual scale revenue of approximately USD 78 million (client-reported, unverified by MMA). Roughly 68% came from connected bathroom scales sold through general retail. The company published no validation data for its body composition measurement and operated no subscription service.
STRATEGIC CHALLENGE
Average selling prices on connected scales had fallen for four consecutive years as Chinese brands matched features at half the price, and retail buyers were treating the category as a promotional line. The board wanted to know whether to compete on cost through consolidated contract manufacturing, or to reposition around validated body composition measurement and clinical channel access where price comparison applied less directly.
MMA APPROACH
MMA conducted 47 expert interviews across retail category buyers, weight management clinicians, telehealth prescribers, sports nutrition practitioners and contract manufacturing operators in six countries. A quantitative survey of 3,800 consumers established purchase triggers, feature priorities and price sensitivity across fitness-motivated and clinically-motivated buyer groups. We then modelled revenue and margin under both options against observed price erosion and weight-loss therapy adoption rates in each market.
KEY FINDINGS
  1. Clinically-motivated buyers on weight-loss therapy showed markedly lower price sensitivity than fitness-motivated purchasers and selected primarily on lean mass measurement capability rather than on brand.
  2. Retail category buyers in five of six markets planned further promotional pricing on connected scales, and none regarded published accuracy data as relevant to their shelf decisions at all.
  3. Weight management clinicians and telehealth prescribers reported recommending specific devices to patients regularly, and no manufacturer had approached any of them through that channel.
  4. Households with more than two years of history in a companion application repurchased the same brand at roughly four times the rate of households using unconnected devices.
RECOMMENDED STRATEGY
Phase 1: Phase one: commission a comparison study of segmental body composition measurement against clinical reference methods and publish it, since no competitor had done so. Phase 2: Phase two: build a clinical channel function reaching weight management clinics and telehealth prescribers directly, rather than continuing to compete for retail shelf space. Phase 3: Phase three: invest in the companion application and introduce a subscription tier, treating hardware as the acquisition route rather than as the product.
OUTCOME
The client published its validation study within nine months and built a clinical channel team covering four markets (client-reported, unverified by MMA). Average selling price on segmental devices recovered roughly a fifth, clinical channel sales reached a tenth of scale revenue within a year, and application-linked repurchase rates improved measurably across the installed base.

Frequently Asked Questions

Foundational context covering the market sizes, CAGR, scope, country, region and competition that inform every finding below. This section is provided to cover basics and most often pre-purchase conversations, answered from the MMA Primary Research Dataset.

What is the current size of the Home Scales Market?

The global home scales market was valued at USD 2.4 billion in 2025, covering mechanical and digital bathroom scales, connected body composition devices, kitchen scales, baby scales and luggage scales. Professional and clinical weighing equipment falls outside this definition.

How large will the Home Scales Market be by 2036?

MMA forecasts the market at USD 4.85 billion by 2036, expanding 1.89 times from the 2026 base of USD 2.56 billion. That represents roughly USD 2.29 billion of incremental value across the forecast decade.

What is the CAGR for the Home Scales Market 2026 to 2036?

The base case compound annual growth rate is 6.6%, with a bull case of 7.9% and a bear case of 5.4%. The bear case reflects potential damage to consumer trust in body composition accuracy claims.

Which segment is growing fastest?

Smart connected body composition scales grow at 9.9%, a full 1.50x the overall market rate. Weight-loss pharmacotherapy created demand for lean mass tracking that a plain weight reading cannot supply.

Who are the major companies in the Home Scales Market?

Tanita, Omron Healthcare, Withings, Xiaomi and Beurer together hold only 29% of revenue. Concentration is low because contract manufacturing makes the underlying hardware available to any brand on equal terms.

Which country is growing fastest?

India grows fastest at 10.8%, as online marketplaces reach households buying a first bathroom or kitchen scale at very low price points. East Asia is the largest region at 30% of value.

Report Segmentation Architecture

The full report scope spans multiple orthogonal segmentation dimensions, with cross-tabulated demand data provided for each dimension pair. Coverage extends further to regional breakdowns, trend trajectories, and the competitive detail needed to support segment-level decision-making.

By Product Type

  • Mechanical Bathroom Scales
  • Digital Bathroom Scales
  • Smart Connected Body Composition Scales
  • Kitchen and Food Scales
  • Baby and Infant Scales
  • Portable and Luggage Scales

By End-Use Industry

  • General Household Consumers
  • Fitness and Sports Nutrition Users
  • Weight Management and Telehealth Programmes
  • Home Cooking and Culinary Enthusiasts
  • Specialty Coffee and Beverage Preparation
  • New Parent and Infant Care Households

By Commercial Dimension

  • General Retail and Department Stores
  • Online Marketplace Distribution
  • Direct-to-Consumer Brand Channels
  • Pharmacy and Health Retail
  • Clinical and Telehealth Recommendation Channels
  • Subscription and Data Service Revenue

By Region

  • East Asia
  • North America
  • Western Europe
  • South Asia and Pacific
  • Latin America
  • Middle East and Africa
  • Eastern Europe

Scope, Methodology, and Coverage

Every figure in this report is reproducible from documented input assumptions. The scope below maps the historical period, the forecast horizon, the segmentation dimensions, and the countries covered, alongside the underlying primary and qualitative methodology.
Historical Period
2020 to 2025
Forecast Period
2026 to 2036
Base Year
2025 (USD billions; MMA Primary Research Dataset, August 2026)
Market Definition
This market comprises weighing devices manufactured and sold for domestic and personal use, measured at manufacturer revenue across general retail, online marketplace, direct-to-consumer, pharmacy and clinical recommendation channels. Coverage spans mechanical spring bathroom scales, digital bathroom scales, smart connected body composition scales including whole-body and segmental bioimpedance devices, kitchen and food scales including connected nutrition-tracking and specialty coffee models, baby and infant scales, and portable luggage scales, together with the subscription and data service revenue attached to connected devices. Professional medical and clinical weighing equipment including hospital and dialysis chair scales, industrial and commercial weighing systems, retail point-of-sale and trade-approved scales, laboratory analytical balances, veterinary and livestock weighing equipment, and wearable or camera-based devices estimating body composition without a weighing function fall outside scope.
Quantitative Units
USD billions (current prices); unit shipments by product type; average retail selling price; connected device share of shipments; household penetration rates
Segmentation Dimensions
By Product Type; By End-Use Industry; By Commercial Dimension; By Region
Regions Covered
East Asia, North America, Western Europe, South Asia and Pacific, Latin America, Middle East and Africa, Eastern Europe
Countries Covered
China, Japan, South Korea, Taiwan, United States, Canada, Mexico, Germany, United Kingdom, France, Italy, Spain, Netherlands, Sweden, India, Australia, Indonesia, Vietnam, Philippines, Thailand, Brazil, Argentina, Chile, Colombia, Saudi Arabia, United Arab Emirates, Egypt, Nigeria, South Africa, Poland, Czechia, Hungary, Romania, and additional markets relevant to consumer weighing device analysis
Key Companies Profiled
Tanita, Omron Healthcare, Withings, Xiaomi, Beurer, Salter Housewares, Taylor Precision Products, Escali, Helen of Troy, Vesync, RENPHO, Anker Innovations, Garmin, Seca, A&D Company, Soehnle, Terraillon, Acaia, Fellow Products, Timemore
Quantitative Methodology
Primary survey, n=3,800 respondents, Q4 2025, six countries; demand-side model with trade association cross-validation
Qualitative Methodology
47 expert interviews, Q4 2025; applied to validate demand model assumptions, identify emerging dynamics, and assess competitive positioning
Report Format
PDF and XLSX data workbook (Word format preview document)
Publisher
Market Minds Advisory
Report Code
MMA-2026-TEC-164
Published
August 2026
Contact
sales@marketmindsadvisory.com | www.marketmindsadvisory.com

Purchase the full Home Scales Market Report (2026 to 2036).

The full MMA report examines a commodity hardware category that a class of weight-loss drugs handed a genuine clinical question to answer. It sizes six product types and seven regions to 2036, modelling unit shipments, average selling price, connected share and household penetration separately so that volume and value trajectories can be distinguished properly. Competitive assessment covers twenty brands on one consistent revenue basis, with attention to which of them actually manufacture anything. Component cost exposure is traced through load cells, wireless microcontrollers and contract manufacturing concentration. Four commercial levers and a strategic verdict close the report, grounded in 47 expert interviews and a 3,800-respondent survey.
Six product types sized separately to 2036
Weight-loss cohort demand modelled across every region
Bioimpedance accuracy assessed against clinical reference methods
Twenty brands assessed on one consistent basis
Contract manufacturing concentration mapped by production cluster
Anonymised client engagement with tested strategic recommendations

Built For The People Who Decide

From boardroom strategy to bench-side execution, this report is read cover-to-cover by leaders shaping the next decade of their industry, turning demand scenarios, market dynamics and valuation benchmarks into decisions.
CXOs/ Presidents/ VPs/ Managers
M&A and Corporate Development
Strategy Teams and R&D Heads
Procurement and Product Directors
Regulatory and Compliance Leaders
Investor Relations and Equity Analysts