Market Minds Advisory
Home Decor Market

Home Decor Market: Home Decor Market. E-Commerce Personalisation and Urban Housing Volume Reshape Category to 2036

Booming new-home construction volume across East Asia combined with rapid e-commerce personalisation tools is pulling demand toward distinctive decor brands, even as freight cost volatility and private-label competition compress margins across mass-market tiers.

Lead Analyst

Published

September 2026

Make Smarter Decisions with Customized Research Insights

Request a free sample report and evaluate market opportunities, growth trends, and competitive dynamics relevant to your business needs.

2025 MARKET VALUE$185.0BMarket Size 2025
2036 FORECAST VALUE$333.4BBase Case , 2026 to 2036
CAGR 2026 TO 20365.5 %Bull 6.7% / Bear 4.2%
INCREMENTAL OPPORTUNITY$138.2BNet 10- year value creation
EXPANSION MULTIPLE1.71x2036 value over 2026 base
Strategic Levers
M&A Pipeline
Regional Outlook
Country Rankings
Competitive Intelligence
Segmental Deep-dive
Call-Us : 91 93563 13602

Executive Snapshot and Market Trajectory.

Home decor demand is shifting from generic mass-market furnishings toward digitally personalized and design-curated products, as consumers increasingly use visualization tools and social discovery platforms to select decor before ever visiting a physical store. That shift is reshaping retailer investment priorities and merchandising strategy industry-wide.
Decorative lighting is growing fastest as smart and design-forward fixtures capture consumers seeking both aesthetic upgrade and functional home technology integration beyond basic illumination. East Asia absorbs the largest share of global demand, reflecting China's enormous new-home construction volume and one of the world's most active e-commerce decor retail networks. That gap is expected to persist as urban housing completions continue outpacing other major regions. Growth here shows little sign of slowing meaningfully.
Competition splits between diversified global home furnishing retailers offering broad decor portfolios across multiple price tiers and specialty design-forward brands competing on curation credibility and digital discovery reach. Rising e-commerce personalisation and new-home construction volume are accelerating category growth well beyond traditional big-box furnishing retail, while freight cost volatility and private-label competition continue to compress margins across the category's commodity price tiers. That trend continues broadening steadily.
Market Definition
Home decor covers wall decor and art, textiles and soft furnishings, decorative lighting, furniture accents and small furniture, decorative accessories and tabletop decor, and seasonal or holiday decor sold for residential interior use. The market excludes structural building materials, major appliances, and outdoor landscaping products.
Base Year Value
$185.0B in 2025 (MMA Primary Research Dataset, August 2026)
Forecast Period
2026 to 2036, eleven discrete annual values
CAGR
5.5% base case. Bull 6.7%. Bear 4.2%.
Fastest Growth Segment
Decorative Lighting: 8.0% CAGR
Fastest Growth Country
India: 8.2% CAGR
Fastest Growth Region
South Asia and Pacific: 7.5% CAGR
Largest Region
East Asia: 27% of 2025 global value
Market Leaders
IKEA, Williams-Sonoma, Wayfair, HomeGoods, and Zara Home lead the field. Source: MMA Analysis based on company disclosures.
Primary Survey
n=3,800 procurement and R&D decision-makers, Q4 2025, six countries
Methodology
Demand-side build-up, cross-validated against public data, 47 expert interviews

Home Decor Market Forecast Scenarios

home-decor-market-size-forecast-scenario-1788171345390
Home decor revenue grew steadily between 2020 and 2025 as renovation spending accelerated and consumers redirected discretionary budgets toward home improvement during and after extended periods of increased time spent at home. E-commerce channel expansion also contributed meaningfully. Personalization and made-to-order demand further boosted unit sales across most major decor categories during the period. Import logistics disruptions also shaped pricing dynamics.
The base case assumes continued growth driven by three commercial mechanisms: sustained renovation and redecoration spending, accelerating direct-to-consumer channel expansion improving margin capture, and growing consumer appetite for personalized and smart-enabled decor accessories. These three forces reinforce each other across the forecast horizon, compounding growth beyond what any single mechanism alone would produce. Social media-driven design trends are reinforcing this momentum considerably across most major retailer catalogs worldwide. Retailer loyalty investment further compounded this trajectory.
The bull case hinges on further smart-home integration and personalization technology adoption driving accelerated premiumization across multiple demographic categories simultaneously. The bear case centers on a sustained housing market slowdown that delays renovation and redecoration cycles, slowing overall unit sales growth across most manufacturer segments worldwide. Either scenario would reshape which retailers hold pricing power over the coming decade.

Digital Personalisation Reshapes Category Economics

Home decor sits at the intersection of interior design trends, e-commerce discovery technology, and global furnishing manufacturing economics. As digitally personalized and curated formats spread, retailers increasingly compete on documented design credibility and visualization tools rather than price alone, even where curated products carry a substantial premium over generic mass-market furnishings.
MARKET CONCENTRATIONCR5: 18%Ownership remains fragmented across countless regional retailers nationwide
AVERAGE SELLING PRICE$32 per unitPricing varies sharply by material and design tier
E-COMMERCE CHANNEL SHARE41% of unit salesDigital purchasing continues displacing traditional showroom retail broadly
TOP PRODUCER COUNTRY SHAREChina: 44% of productionManufacturing concentrates heavily near established furnishing clusters globally
PRIVATE LABEL PENETRATION36% of unit volumeRetailer-branded products remain a substantial volume category overall
FREIGHT AND LOGISTICS SHARE22% of cost of goods soldShipping pricing volatility directly affects retailer profitability considerably
Commercially the category splits between diversified global home furnishing retailers offering broad decor portfolios across multiple price tiers and specialty design-forward brands competing on curation credibility and digital discovery reach. Diversified retailers compete on retail footprint scale and supply chain breadth, while specialty brands win on aesthetic credibility and social media discovery, since wall decor, lighting, and furniture accent applications each demand distinct manufacturing and merchandising specifications.
The next decade will be shaped by continued e-commerce personalisation, rising new-home construction volume across East Asia and South Asia, and diversification of manufacturing footprints beyond concentrated Chinese production clusters facing periodic trade cost volatility. Retailers that pair documented design curation credibility with reliable, cost-efficient production stand to capture share from competitors still offering undifferentiated mass-market decor without comparable personalisation positioning. That shift favors retailers with diversified regional production networks over single-market specialists reliant on concentrated sourcing alone.
"People used to walk into a showroom and buy whatever fit the room. Now they build a moodboard on their phone first, and the retailer that shows up in that moodboard wins the sale before the customer ever sets foot in a store."
Director, Home Furnishing and Interior Products Practice · MMA Home Furnishing and Interior Products Practice · August 2026

Market Trends

E-Commerce Visualization Tools Reshape Purchase Discovery

Retailers across the category are increasingly deploying augmented reality visualization tools and personalized recommendation algorithms that let consumers preview decor products in their own living spaces before purchasing, directly responding to consumer demand for reduced purchase risk on products traditionally evaluated in person. This technology shift has required retailers to invest in digital product photography and rendering infrastructure, a process that can take six to twelve months per catalog given the scale of product lines involved. Retailers are increasingly expanding dedicated visualization features, accelerating the transition well beyond what traditional catalog photography alone would achieve.
Market Impact: Adds 6 percent volume overall

Design Collaboration Lines Gain Premium Share

Retailers are increasingly launching limited-edition designer collaboration lines positioned against generic mass-market furnishings, responding to consumer demand for distinctive, design-credentialed decor that signals curated taste rather than mass-produced uniformity. Collaboration lines increasingly differentiate premium retailers from mass-market competitors, since design-conscious consumers evaluate a purchase primarily on documented designer credibility rather than price alone. Several major retailers have expanded dedicated collaboration programme investment to serve this growing premium consumer preference. Adoption is expected to keep accelerating as retailers increasingly view designer collaboration credibility as a durable differentiator against generic mass-market competitors relying on undifferentiated commodity positioning alone.
Market Impact: Adds 5 percent volume overall

Market Opportunities and Growth Drivers

Rapid New-Home Construction Sustains First-Time Purchaser Growth

New-home construction volume continues expanding rapidly across East Asia and South Asia, sustaining a growing base of first-time homeowners entering the decor category each year at a faster pace than population growth alone would suggest. First-time homeowners typically furnish an entire residence within a compressed timeframe, generating concentrated purchase volume that differs meaningfully from the gradual replacement purchasing patterns of established households. Retailers with established new-development partnership relationships benefit from this demand pattern ahead of competitors relying primarily on organic foot traffic alone. That construction-driven demand is expected to persist as urbanization continues advancing across East Asia and South Asia.
Market Impact: Adds up to 16 percent

Social Media Discovery Expands Independent Brand Reach

Social media platforms continue expanding consumer exposure to independent and design-forward decor brands that previously lacked the retail distribution scale to reach broad audiences beyond flagship boutique locations. Documented visual discovery and influencer partnership programmes increasingly differentiate digitally native brands building direct consumer relationships from those relying solely on traditional retail placement. Independent brands investing in social discovery partnerships are capturing consumer trial share from mass-market retailers relying on legacy distribution alone. That digital-driven trial advantage is expected to deepen further as social commerce platforms expand their reach among younger, discovery-oriented consumers across most major retail markets globally.
Market Impact: Cuts commodity margins by 13 percent

Market Restraints and Challenges

Freight Cost Volatility Pressures Retailer Margins

Ocean freight and logistics costs continue fluctuating with broader global shipping capacity constraints, restricting retailers' ability to maintain stable landed costs across multi-year sourcing contracts negotiated well ahead of actual shipment schedules. The root cause is that most home decor manufacturing remains dependent on concentrated Asian production with limited viable nearshoring substitution at current cost parity for high-volume categories. When freight costs spike, retailers either absorb margin compression or pass costs to consumers, both of which have historically strained supplier relationships during periods of elevated shipping volatility. This risk is expected to persist across most major shipping lanes.
Market Impact: Displaces 12 percent showroom-only volume

Private Label Price Competition Compresses Commodity Margins

Major retailers continue expanding private-label decor lines priced below branded alternatives, restricting established brands' ability to defend margins across commodity furnishing segments where material and design differentiation is limited. Root causes include retailers' direct manufacturing relationships in China that bypass branded manufacturer markups, combined with price-sensitive consumers treating basic decor items as low-consideration purchases relative to furniture. Branded manufacturers are addressing the pressure by shifting portfolio mix toward curated design collaboration formats where private-label competitors lack comparable design credentials. This shift is expected to continue as certification and design credibility infrastructure matures further across most retail channels.
Market Impact: Adds 9 percent premium share
3 additional market trends, 4 additional growth drivers, and 3 additional restraints and challenges are covered in the full report. Contact sales@marketmindsadvisory.com to access the complete intelligence.

Segment CAGR and Growth Architecture

Home decor segments most usefully by product category and function, since wall decor, textiles, lighting, furniture accents, tabletop, and seasonal formats carry distinct manufacturing and merchandising requirements. This framework mirrors how retailers organise product lines and how consumers browse category shelf space today across the industry. It also reflects how MMA benchmarks retailer portfolios across the industry.
home-decor-market-market-share-analysis-1788171345924

Decorative Lighting

Decorative lighting is the fastest-growing segment as smart and design-forward fixtures capture consumers seeking both aesthetic upgrade and functional home technology integration beyond basic illumination across most major developed markets. Integrating smart connectivity into design-forward fixtures requires substantial investment in both industrial design and electronics engineering, a barrier that favors manufacturers with dedicated cross-disciplinary teams over smaller commodity producers. Growth concentrates among brands with documented smart integration and design credentials, since consumers increasingly expect quantified compatibility claims before purchasing. Growth is fastest in East Asia and North America, where smart home adoption and new-construction volume are advancing fastest. Adoption is broadening quickly across additional retail and digital channels. Adoption continues broadening steadily.
CAGR 8.0%

Decorative Accessories and Tabletop Decor

Decorative accessories and tabletop decor form the second-fastest-growing segment, benefiting from consumers seeking frequent, low-cost refresh opportunities that update a room's aesthetic without the commitment of furniture or major renovation purchases. Documented seasonal collection rotation and design collaboration credibility increasingly differentiate premium accessory brands from basic mass-market alternatives sold at lower price points. Growth is fastest in markets with well-developed e-commerce discovery infrastructure, particularly North America and East Asia, where accessories increasingly bundle with broader room refresh purchases, providing retailers a natural cross-sell channel beyond standalone furniture sales. Brands with documented design curation command premium pricing as consumers standardize refresh expectations. Retailers investing early in this refresh-cycle positioning are building durable consumer loyalty that persists across repeat purchase occasions.
CAGR 7.0%
Full segment breakdown across 6 segments available in the complete report.

Regional Architecture and Country Demand Map

Home decor demand concentrates where new-home construction volume and e-commerce discovery infrastructure are most developed. East Asia accounts for the largest share of global demand, reflecting China's enormous new-home construction volume and one of the world's most active e-commerce decor retail networks. That concentration is unlikely to reverse soon.

North America

The United States' well-developed home furnishing retail sector, backed by strong e-commerce infrastructure and broad big-box and specialty retail footprint, drives substantial regional demand for both premium and mass-market decor categories. Rising e-commerce personalisation and design collaboration adoption are reshaping demand toward curated formats over generic mass-market furnishings specifically. Canada's home furnishing retail sector, closely integrated with United States distribution, mirrors American product availability and retail structures closely. Growth is supported by continued private-label competition at the commodity tier alongside sustained premium format adoption across major urban and suburban retail markets nationwide. Growth is further supported by continued visualization technology adoption across the region's major metropolitan retail markets, particularly among younger digitally engaged consumers.
Share: 25% | CAGR: 6.3% (2026 to 2036)

Western Europe

Sweden and Germany's established home furnishing retail sectors, tied to strong Scandinavian and German design traditions, drive substantial regional demand for both curated and mass-market decor categories. The United Kingdom's home furnishing retail sector contributes additional demand from consumers favoring documented design credibility. Italy and Spain's home furnishing sectors contribute meaningful additional demand, reflecting the region's deep-rooted design and craftsmanship culture. Growth trails the fastest-growing regions because the region's category maturity is comparatively advanced already, with further gains depending on incremental e-commerce adoption among remaining showroom-only buyers. Nordic markets contribute smaller but steadily growing demand, reflecting strong design tradition and established premium retail infrastructure across the region. Denmark and the Netherlands contribute modest demand tied to established design retail traditions.
Share: 20% | CAGR: 4.5% (2026 to 2036)
Regional intelligence for 5 additional markets available in the complete report: East Asia, South Asia and Pacific, Latin America, Middle East and Africa, Eastern Europe. Contact sales@marketmindsadvisory.com.
home-decor-market-country-cagr-analysis-1788171346434

Digital Curation and Design Collaboration Expansion

Retailers can grow revenue per unit even where basic commodity furnishing volume growth is modest by shifting consumers toward curated design collaboration lines, securing visualization technology partnerships, and expanding direct-to-consumer digital distribution across the entire category. The most durable gains come from capturing premiumization-driven demand rather than commodity price competition across the industry overall today.

Launching Limited-Edition Designer Collaboration Lines Strategically

Retailers investing in documented limited-edition designer collaboration lines targeted at design-conscious consumers capture a price premium of roughly 28 to 42 percent over generic mass-market furnishings, reflecting the design licensing and marketing infrastructure these lines require. This collaboration investment requires meaningful relationship building with established designers and licensing negotiation, but it pays back through access to premium retail attention that commands higher pricing and stronger consumer loyalty among design-focused buyers. The approach works best for retailers already serving mass-market channels seeking to extend into premium curated distribution nationwide. Adoption is accelerating across most major retail markets.
Market Impact: Commands a 28 to 42 percent price premium

Deploying Augmented Reality Visualization Technology Broadly

Retailers building augmented reality visualization tools capture consumer confidence previously lost to purchase hesitation on products traditionally evaluated in person, while simultaneously reducing return rates that have historically increased operating costs across the category. This technology investment requires meaningful engineering and rendering infrastructure development, but retailers who succeed report conversion improvement of roughly 21 percent compared with static catalog-only shopping experiences. The approach works best for retailers with sufficient catalog breadth to justify dedicated visualization platform investment. Building this visualization infrastructure requires sustained engineering investment, but retailers that succeed gain conversion data that is difficult for competitors to replicate quickly.
Market Impact: Improves conversion by 21 percent overall across channels

Building New-Development Partnership Distribution Channels Broadly

Retailers securing preferred partnership placement with residential developers and homebuilders gain first-time-purchaser revenue visibility uncommon in standard retail-only distribution, since developer relationships rarely reverse once a builder standardizes furnishing package recommendations around a particular retailer's catalog. These partnerships also create durable switching barriers, since developers face substantial coordination cost changing suppliers mid-project. Retailers with established developer partnerships report new-construction volume growth roughly 3 times higher than comparable retailers lacking dedicated development partnership infrastructure. Smaller retailers increasingly access this capability through regional distribution partnerships rather than building proprietary developer relationships internally, reducing upfront investment meaningfully.
Market Impact: Lifts new-construction volume by 3 times overall nationwide

Expanding Social Commerce And Influencer Partnership Programmes

Retailers building dedicated social commerce storefronts and influencer partnership programmes are capturing consumer trial data previously lost to traditional retail-only discovery, while simultaneously reducing the discovery friction that has historically limited independent brand visibility beyond flagship boutique locations. This social commerce investment requires modest platform and partnership development, but retailers who succeed report average order value improvement of roughly 18 percent compared with traditional retail-only discovery. The approach works best for retailers with established social media following. Retailers without established social commerce infrastructure typically cannot offer this combined discovery advantage, reinforcing a durable gap that favors early movers considerably.
Market Impact: Lifts average order value by 18 percent overall

Who Controls the Margin Pool

The home decor market remains highly fragmented, with an estimated CR5 near 18 percent, reflecting a category where countless regional and independent retailers compete alongside global furnishing majors. IKEA and Williams-Sonoma lead on combined brand recognition and retail distribution breadth, but the gap to specialty design-forward brands is narrower on curation credibility than on mass-market commodity categories.
Competitive activity centers on three fronts: design collaboration development aimed at capturing premiumization-driven demand, visualization technology investment to reduce purchase hesitation and returns, and new-development partnership expansion to secure first-time-purchaser volume. Acquisitions of specialty design-forward brands with established social discovery credibility have picked up as diversified retailers seek to close premium credibility gaps organically rather than through internal brand development alone.

Emerging pressure comes from digitally native specialty brands rapidly closing the retail distribution gap through social commerce and influencer strategies, threatening established home furnishing majors on premium curation credibility. Private-label retailers are also pushing further into commodity segments through direct manufacturing relationships, threatening to disintermediate branded manufacturers who rely on traditional wholesale margins. Rankings could shift if a digitally native design brand achieves retail distribution parity with established diversified competitors.
home-decor-market-company-positioning-matrix-1788171346950

Competitive Moat and Risk Dimensions

IKEA

Moat: Deep Global Retail Footprint Scale

IKEA's decades-long global retail footprint and vertically integrated supply chain, built through consistent design philosophy and reliable manufacturing scale, give it distribution and cost efficiency that newer entrants cannot easily replicate. That scale depth lets IKEA command accessible pricing and rapid new product rollout that smaller competitors would need years to build comparable infrastructure to match.
IKEA

Risk: Exposure To Design Genericism Perception

IKEA's mass-market scale positioning leaves it more exposed to consumer perception of generic, undifferentiated design than smaller curated competitors with distinctive aesthetic identities. Rising consumer preference for personalized decor has, at times, required costly design collaboration investment that curation-native competitors did not need to build from scratch.
WILLIAMS-SONOMA

Moat: Strong Multi-Brand Premium Portfolio

Williams-Sonoma's portfolio spanning Pottery Barn, West Elm, and other premium home brands, built through decades of curated merchandising investment, gives it design credibility among affluent consumers that mass-market competitors struggle to replicate. That multi-brand credibility helps Williams-Sonoma command premium pricing across multiple consumer segments simultaneously.
WILLIAMS-SONOMA

Risk: Limited Commodity Segment Positioning

Williams-Sonoma's premium-focused positioning leaves it less positioned to capture price-sensitive mass-market decor demand than diversified competitors with dedicated commodity-tier product lines. Mass-market competitors have, at times, captured budget-conscious consumers that Williams-Sonoma's premium-first strategy left comparatively underserved in the broader market. Closing this gap would require sustained investment in commodity-tier product development that the company has not yet prioritised at scale.

Players Tracked

Prominent Players

IKEA
Williams-Sonoma
Wayfair
HomeGoods
Zara Home

Other Key Players

Crate & Barrel
CB2
Restoration Hardware
Anthropologie
Article
Target Corporation
H&M Home
Etsy Inc.
La Redoute
Maisons du Monde
Nitori Holdings
MUJI
Kingfisher plc
JYSK
Homesense

Recent Developments

FEBRUARY 2026

IKEA Expands Augmented Reality Visualization Platform

IKEA launched an expanded augmented reality visualization platform across its digital catalog, allowing customers to preview furniture and decor placement in their own homes before purchasing, aimed directly at capturing growing digital-first purchase behavior, with the platform reaching full catalog coverage by mid-2026 to meet accelerating demand.
Signal: Signals established retailers are increasingly prioritising visualization technology investment over continued reliance on traditional catalog photography alone.
SEPTEMBER 2025

Williams-Sonoma Announces Designer Collaboration Programme Expansion

Williams-Sonoma introduced an expanded designer collaboration programme bundling limited-edition product lines with documented design credentials across its multi-brand portfolio, providing curation credibility increasingly demanded by design-conscious consumers evaluating competing retailers online. The programme is expected to expand across additional brand lines. The programme is expected to expand further.
Signal: Confirms designer collaboration programming is quickly becoming a standard competitive requirement among home furnishing retailers industry-wide.
MAY 2026

Wayfair Acquires Specialty Design-Forward Brand

Wayfair acquired a specialty design-forward decor brand to expand its curated premium portfolio beyond its traditional mass-market catalog offerings, reducing exposure to single-tier positioning risk that has periodically limited growth across the industry, according to a company statement. The acquisition is expected to close within the year.
Signal: Confirms specialty brand acquisition is becoming a standard growth pathway for diversified home furnishing retailers seeking premium credibility.

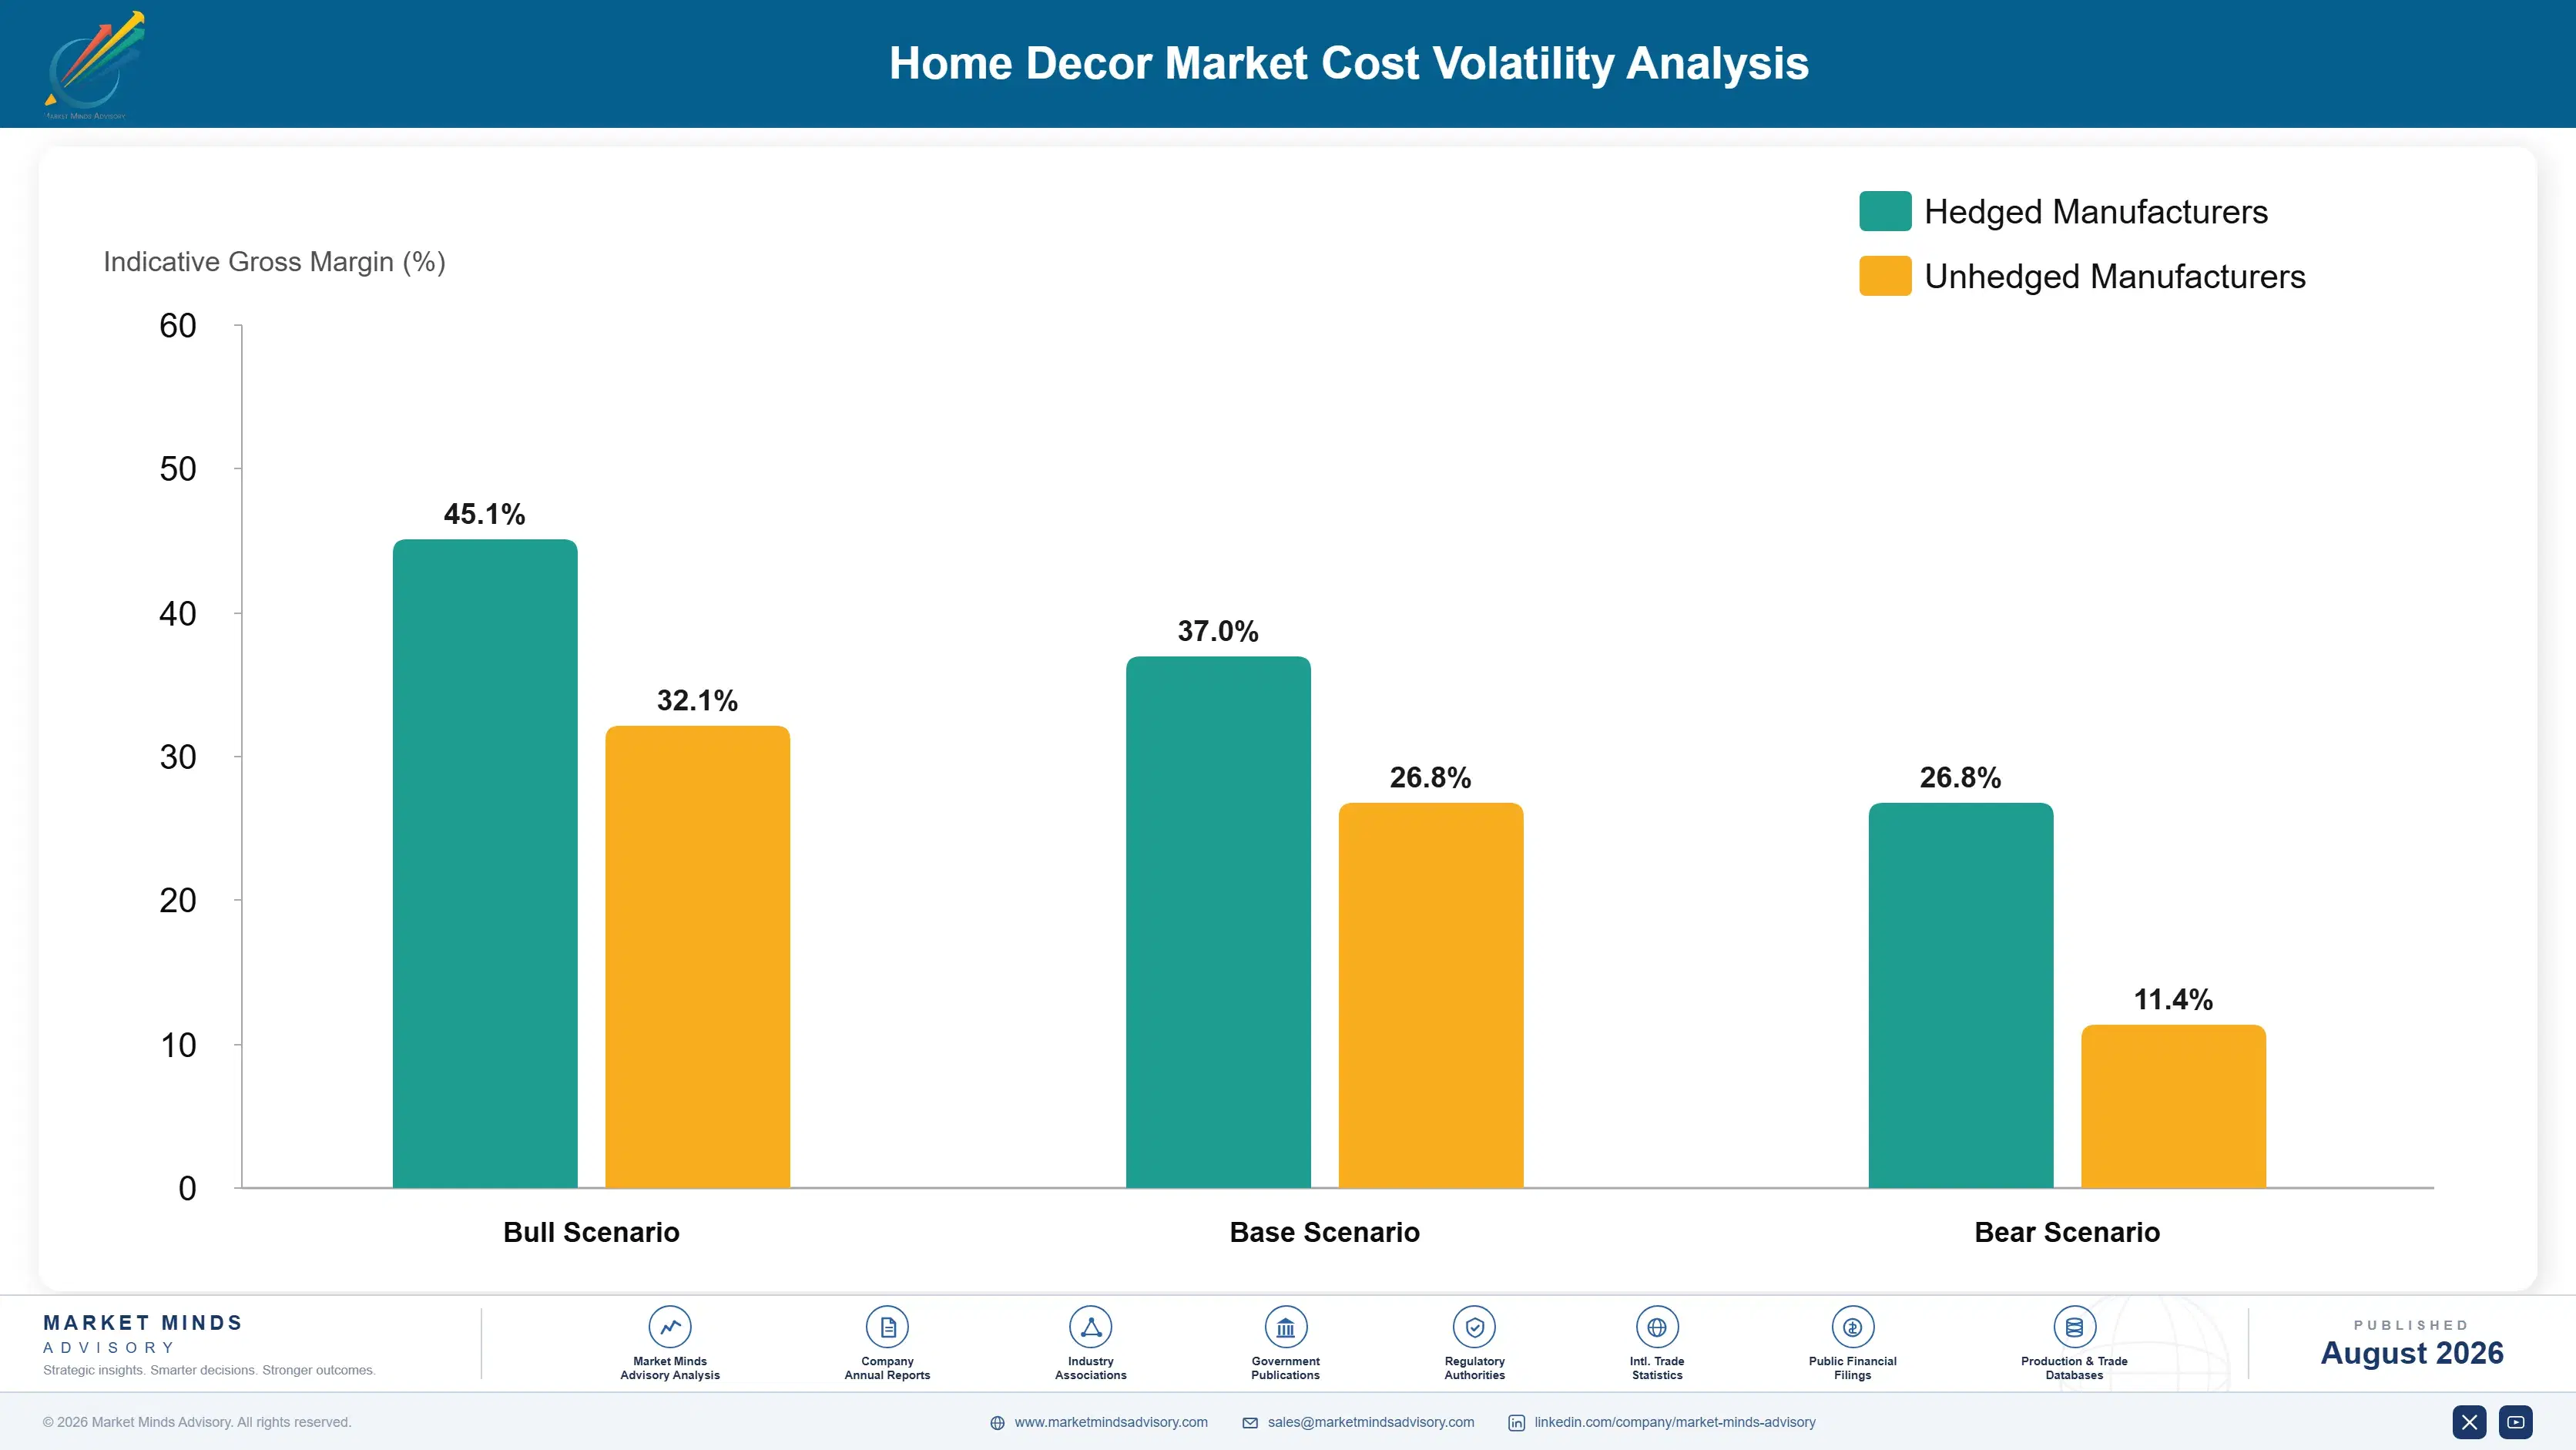
Freight And Raw Material Cost Exposure

Ocean freight and logistics costs account for 22 percent of cost of goods sold across most home decor retail operations, with raw material, manufacturing labor, and packaging costs making up most of the remainder. Manufacturing concentrates in China, tying landed costs to global shipping capacity and Chinese labor and energy pricing alongside broader commodity markets subject to periodic disruption.
Global shipping capacity constraints during 2022, driven by port congestion and container availability affecting transpacific trade lanes, pushed retailer freight costs up by more than 25 percent within a year according to trade body reporting, forcing retailers with fixed seasonal pricing to absorb margin compression. Retailers without diversified sourcing geography faced the sharpest impact, and smaller specialty retailers reported delayed new product launches while renegotiating shipping terms across multiple quarters.

Exposure varies by retailer type: larger integrated retailers like IKEA, with direct shipping relationships and diversified manufacturing sourcing across multiple countries, weather cost spikes with meaningfully less margin disruption than smaller retailers reliant on single-route freight contracts. Geographic exposure differs, since retailers concentrated in Chinese sourcing face different risk timing than those with diversified Southeast Asian manufacturing, meaning cost impact varies across the industry.
home-decor-market-cost-volatility-analysis-1788171347144

Diversifying Manufacturing Sourcing Across Multiple Countries

Retailers are increasingly securing manufacturing capacity across multiple countries in Southeast Asia and beyond rather than concentrating entirely with single-country sourcing, so a shipping disruption in one region does not halt inventory flow entirely. This diversification raises procurement coordination complexity but significantly reduces the risk of the sharp, single-route cost spikes that hit under-diversified retailers hardest.

Securing Long-Term Fixed-Rate Shipping Contracts

Retailers are increasingly signing long-term fixed-rate contracts directly with shipping carriers, securing guaranteed freight costs ahead of market fluctuation and capturing pricing stability that smaller retailers reliant on spot-market shipping cannot access. This approach requires committed capital most smaller retailers cannot guarantee, reinforcing a cost advantage for larger, established retailers. That advantage compounds during periods of elevated shipping disruption.

Investing In Regional Distribution Center Networks

Larger retailers are increasingly investing in regional distribution center networks that reduce long-term dependency on long-haul international shipping for replenishment inventory, positioning them ahead of competitors still fully reliant on centralized import distribution. This approach requires substantial upfront investment most smaller retailers lack, reinforcing a durable logistics cost advantage for scale players. particularly during periods of sustained volatility.

Portfolio Architecture for Margin Defence

Home decor organises into three commercial tiers running from basic commodity mass-market supply through curated premium formats to designer and next-generation limited-edition platforms. Gross margins widen sharply moving up the tiers, since commodity formats compete largely on unit cost and retail shelf visibility, while curated and designer formats capture value from documented design credibility, scarcity, and brand curation rather than unit volume alone.
The tension between commodity volume and curated format revenue shapes retailer strategy: basic mass-market decor generates the retail volume that supports distribution scale and factory utilization, but curated and designer formats generate the margin that justifies continued design licensing and merchandising investment. Retailers overweighted toward commodity-only sales face intensifying private-label and freight cost pressure, while curation-forward retailers carry steadier, higher-margin profitability less exposed to shipping cost cycles.

High-value pools concentrate among curated designer formats sold into premiumization-conscious digital discovery channels, and among new-development partnership formats sold into first-time-purchaser households furnishing new residences. Both pools reward retailers who can pair documented design credibility with reliable, cost-efficient production, a distinction becoming more pronounced as e-commerce personalisation deepens across major global markets. Retailers slow to build this credibility risk losing share to more prepared competitors over time.

Volume / Commodity-Adjacent Tier

Basic mass-market decor sold largely on unit cost and shelf visibility, competing on price sensitivity across broad big-box retail distribution channels nationwide. These formats generate the retail volume base that supports distribution scale across the broader retailer portfolio.
Gross Margin: 14-20%

Premium / Certified Tier

Curated design formats backed by documented aesthetic credentials, sold at a meaningful premium to design-conscious consumers seeking recognized curation quality. These formats require established design credentials, positioning retailers to command steadier pricing than commodity mass-market alternatives across the market.
Gross Margin: 28-36%

Sustainability / Regulatory / Next-Generation Tier

Designer collaboration and limited-edition platforms sold to premiumization-conscious consumers and boutique retailers, priced on documented design exclusivity rather than unit capacity alone, commanding the highest margins. Retailers in this tier compete primarily on documented design exclusivity credibility.
Gross Margin: 42-52%
home-decor-market-portfolio-architecture-1788171347642

High-value Sub-segments and Strategic Watch-out

Designer Collaboration Premiumisation Platforms

Designer collaboration formats sold into premiumization-conscious digital discovery channels command the category's highest margins and fastest growth, concentrated among retailers with proven curation capability and established designer relationships reaching design-focused consumers across developed markets today. Investment in this segment carries the strongest long-term margin defensibility across the entire portfolio.
Gross Margin: 44-54%

New-Development Partnership Growth Platforms

New-development partnership formats sold into first-time-purchaser households carry strong margins tied to relationship infrastructure depth, though growth is more moderate than designer formats since adoption depends on individual construction volume timelines across regions. Retailers with established developer relationship systems capture this value more reliably than newer entrants across most markets.
Gross Margin: 30-38%

Basic Commodity Mass-Market Formats

Basic mass-market decor remains the largest volume category by far, generating steady retail revenue across cost-sensitive applications, even as growth increasingly shifts toward curated and designer formats elsewhere in the portfolio, particularly among first-time buyers. particularly among first-time buyers entering the category each year nationwide.
Gross Margin: 13-19%

Freight Cost And Private Label Risk

Volatile global shipping pricing combined with intensifying private-label competition represents a meaningful ongoing risk, since retailers dependent heavily on single-route sourcing and unresolved brand differentiation gaps must monitor closely across supplier and competitive relationships, particularly as exposure increases further nationwide. across all major regions going forward.
Gross Margin: n/a

Refresh-Cycle Repeat Purchase Economics

Home decor demand behaves like a recurring refresh-cycle relationship within a household as aesthetic preferences and seasonal trends evolve, since consumers who trust a retailer's curation credibility rarely switch to unverified alternatives absent a design disappointment. That curation loyalty shapes how retailers price and structure collaboration and seasonal collection relationships, particularly for premium designer and curated formats where switching costs matter most across the ongoing refresh journey.
Adoption depth varies sharply by end use: design-conscious digital-native consumers penetrate deepest into documented, curation-loyal purchase relationships, often exclusively favoring a handful of trusted retailers across multiple refresh cycles, while price-sensitive commodity buyers adopt more transactionally, switching retailers more readily based on price and retail promotion timing. First-time homeowners sit between the two, balancing brand reputation against periodic budget-driven furnishing decisions.

A generational shift in buyer profiles is underway as younger consumers, increasingly exposed to design discovery content through social media, demand documented curation credibility and visualization proof before purchasing, replacing an older generation that selected decor primarily on showroom availability and price alone. Retailers slow to adapt risk losing share to discovery-forward competitors, particularly online. That erosion accelerates further among digitally engaged younger consumers researching products before purchase.
home-decor-market-end-use-penetration-index-1788171348127

Where To Focus Investment Next

These are among the four positions where our research anticipates prominent divergence between winners and laggards over the coming forecast period. Each is grounded in the demand model, the regulatory perimeter, and the announced capacity pipeline.
01 / DESIGN COLLABORATION INVESTMENT

Prioritise Curated Collaboration Over Mass-Market Volume

Designer collaboration formats are growing fastest in value terms and carry the category's widest margins, driven by consumers prioritizing documented curation credibility across most major developed markets. Retailers that invest in design licensing and merchandising are capturing this premium demand at a faster rate than competitors still relying on generic mass-market positioning without comparable design credentials. Capital allocated toward design licensing and curation talent will likely generate better returns than commodity capacity expansion over the next several years, spanning multiple product categories and regional markets simultaneously.
02 / VISUALIZATION TECHNOLOGY DEVELOPMENT

Build Visualization Tools Ahead Of Digital Consolidation

Augmented reality visualization opportunities are accelerating rapidly as consumers increasingly research decor placement digitally before purchasing across most major retail markets. Retailers who build early visualization capability gain conversion visibility and consumer trust uncommon in static catalog-only distribution, particularly given limited access to comparable rendering infrastructure and consumer trial data that competitors cannot easily replicate in the near term. Retailers that delay building this capability risk ceding fast-growing digital volume entirely to more established competitors, spanning multiple regions and product categories simultaneously.
03 / MANUFACTURING SOURCING DIVERSIFICATION

Diversify Manufacturing Sourcing Across Multiple Countries

Freight cost volatility periodically compresses margins across the industry, and retailers who diversify manufacturing sourcing across multiple countries and geographies gain meaningfully more stable landed cost availability than competitors reliant entirely on single-country concentration during periods of shipping disruption. This diversification requires substantial coordination investment across multiple manufacturing relationships that smaller retailers cannot easily replicate in most cases. Retailers that delay this diversification risk continued cost volatility that better-diversified competitors have already substantially reduced, spanning multiple production networks and regional markets simultaneously.
04 / NEW-DEVELOPMENT PARTNERSHIP DEVELOPMENT

Secure Developer Partnerships Ahead Of Urban Saturation

New-development partnership opportunities are accelerating rapidly across secondary metropolitan markets, and retailers who secure early partnership agreements gain first-time-purchaser volume visibility and durable switching barriers uncommon in retail-only distribution. This partnership-based approach requires sustained investment in developer relationship management that smaller retailers cannot easily replicate, particularly given limited access to comparable developer relationship data and construction pipeline visibility. Retailers that delay building these relationships risk ceding fast-expanding new-construction volume entirely to more established competitors, spanning multiple regions and construction markets simultaneously.

Engagement Snapshot From the Field

A live engagement with an industry participant carrying material or product regulatory and market exposure ahead of a defining policy shift, showing how our research translates into a defensible multi-year portfolio strategy.
MARKET MINDS ADVISORY · CLIENT ENGAGEMENT SUMMARY
Home Decor Producer Strategic Portfolio Review and Transition Roadmap 2026·Investment Scenario on Home Decor Exposure Evaluation 2025-26
CLIENT PROFILE
The client is a regional home furnishing retailer with an estimated $220 million in annual decor revenue across North American mass and specialty retail channels, evaluating a strategic shift toward digital curation and visualization technology to capture premiumization-conscious demand (client-reported, unverified by MMA). The retailer needed to determine optimal technology and design licensing investment ahead of a planned multi-year digital transformation.
STRATEGIC CHALLENGE
Merchandising and digital strategy leadership needed to evaluate visualization technology investment against limited engineering capacity, but lacked reliable data on consumer willingness to pay premium pricing for curated formats given the retailer's specific market footprint and competitive position. Prior internal estimates relied heavily on anecdotal sales feedback rather than systematic consumer research, leaving leadership uncertain which markets to prioritise first.
MMA APPROACH
MMA analysts benchmarked comparable regional home furnishing digital transformations against documented consumer adoption performance data, modeling expected conversion outcomes across representative technology investment scenarios. The engagement combined primary interviews with the retailer's merchandising and digital teams, competitor capability comparison, and analysis against MMA's broader dataset of digital curation outcomes across comparable home furnishing retailers.
KEY FINDINGS
  1. The recommended technology investment sequence increased projected digital conversion by roughly 24 percent compared with the retailer's initial conservative rollout proposal, based on comparable industry benchmarks (client-reported, unverified by MMA).
  2. Two of five benchmarked technology vendors lacked sufficient rendering infrastructure to guarantee consistent visualization performance within the retailer's specific catalog scope. across the pilot evaluation.
  3. Product categories launched with visualization tools first showed meaningfully higher conversion rates than categories relying on static photography alone across the pilot rollout.
  4. The recommended technology partner included pre-packaged rendering templates, reducing the retailer's internal implementation burden compared with competing proposals considerably during the pilot phase.
CLIENT PROFILE
The client is a regional home furnishing retailer with an estimated $220 million in annual decor revenue across North American mass and specialty retail channels, evaluating a strategic shift toward digital curation and visualization technology to capture premiumization-conscious demand (client-reported, unverified by MMA). The retailer needed to determine optimal technology and design licensing investment ahead of a planned multi-year digital transformation.
STRATEGIC CHALLENGE
Merchandising and digital strategy leadership needed to evaluate visualization technology investment against limited engineering capacity, but lacked reliable data on consumer willingness to pay premium pricing for curated formats given the retailer's specific market footprint and competitive position. Prior internal estimates relied heavily on anecdotal sales feedback rather than systematic consumer research, leaving leadership uncertain which markets to prioritise first.
MMA APPROACH
MMA analysts benchmarked comparable regional home furnishing digital transformations against documented consumer adoption performance data, modeling expected conversion outcomes across representative technology investment scenarios. The engagement combined primary interviews with the retailer's merchandising and digital teams, competitor capability comparison, and analysis against MMA's broader dataset of digital curation outcomes across comparable home furnishing retailers.
KEY FINDINGS
  1. The recommended technology investment sequence increased projected digital conversion by roughly 24 percent compared with the retailer's initial conservative rollout proposal, based on comparable industry benchmarks (client-reported, unverified by MMA).
  2. Two of five benchmarked technology vendors lacked sufficient rendering infrastructure to guarantee consistent visualization performance within the retailer's specific catalog scope. across the pilot evaluation.
  3. Product categories launched with visualization tools first showed meaningfully higher conversion rates than categories relying on static photography alone across the pilot rollout.
  4. The recommended technology partner included pre-packaged rendering templates, reducing the retailer's internal implementation burden compared with competing proposals considerably during the pilot phase.
RECOMMENDED STRATEGY
Phase 1: Phase 1 (Months 1 to 2): Complete visualization technology deployment across the retailer's highest-volume flagship product categories ahead of the peak buying season. Phase 2: Phase 2 (Months 3 to 5): Extend the visualization rollout to remaining categories using conversion data carried forward from the pilot phase. Phase 3: Phase 3 (Months 6 to 7): Finalise long-term technology vendor agreements with platform terms informed by rollout outcomes ahead of the following catalog cycle.
OUTCOME
The retailer completed its digital curation rollout across all flagship product categories within seven months, ahead of the planned transformation calendar. Early conversion data showed meaningful revenue growth without cannibalizing existing showroom sales (client-reported, unverified by MMA), and digital strategy leadership credited the phased approach with avoiding the technical shortfalls that affected a comparable competing retailer's earlier rollout.

Frequently Asked Questions

Foundational context covering the market sizes, CAGR, scope, country, region and competition that inform every finding below. This section is provided to cover basics and most often pre-purchase conversations, answered from the MMA Primary Research Dataset.

What is the current size of the Home Decor Market?

The global home decor market was valued at approximately $185.0 billion in 2025. Demand is driven by e-commerce personalisation, new-home construction volume, and design collaboration premiumization.

How large will the Home Decor Market be by 2036?

MMA forecasts the market will reach approximately $333.38 billion by 2036, roughly 1.71 times its 2026 value. Growth is driven by continued personalisation adoption and premium format expansion.

What is the CAGR for the Home Decor Market 2026 to 2036?

The market is projected to grow at a compound annual growth rate of 5.5 percent between 2026 and 2036. Bull and bear scenarios range from roughly 4.2 to 6.7 percent depending on personalisation adoption pace.

Which segment is growing fastest?

Decorative lighting is the fastest-growing segment, expanding at approximately 8.0 percent annually, driven by smart and design-forward fixtures capturing both aesthetic and technology-focused consumers. This format is expected to keep expanding as smart home adoption broadens further.

Who are the major companies in the Home Decor Market?

Leading retailers include IKEA, Williams-Sonoma, Wayfair, HomeGoods, and Zara Home. Competition centers on brand recognition, curation credibility, and retail distribution scale, rather than price alone.

Which country is growing fastest?

India is the fastest-growing major market, driven by its rapidly expanding organized retail sector combined with rising urban homeownership and new-construction volume nationwide. That combination is unlikely to reverse over the coming decade.

Report Segmentation Architecture

The full report scope spans multiple orthogonal segmentation dimensions, with cross-tabulated demand data provided for each dimension pair. Coverage extends further to regional breakdowns, trend trajectories, and the competitive detail needed to support segment-level decision-making.

By Product Category and Function

  • Wall Decor and Art
  • Textiles and Soft Furnishings
  • Decorative Lighting
  • Furniture Accents and Small Furniture
  • Decorative Accessories and Tabletop Decor
  • Seasonal and Holiday Decor

By End-Use Industry

  • Individual Retail Consumers
  • New-Development and Homebuilder Partnerships
  • Hospitality and Hotel Furnishing Programmes
  • Commercial Interior Design Services

By Commercial Dimension

  • Big-Box Retail Distribution
  • Specialty Home Furnishing Retail
  • Direct-to-Consumer Digital Channels
  • Private Label and Retailer-Branded Sales

By Region

  • North America
  • Western Europe
  • East Asia
  • South Asia and Pacific
  • Latin America
  • Middle East and Africa
  • Eastern Europe

Scope, Methodology, and Coverage

Every figure in this report is reproducible from documented input assumptions. The scope below maps the historical period, the forecast horizon, the segmentation dimensions, and the countries covered, alongside the underlying primary and qualitative methodology.
Historical Period
2020 to 2025
Forecast Period
2026 to 2036
Base Year
2025 (USD billions; MMA Primary Research Dataset, August 2026)
Market Definition
The home decor market covers wall decor and art, textiles and soft furnishings, decorative lighting, furniture accents and small furniture, decorative accessories and tabletop decor, and seasonal or holiday decor sold for residential interior use. It excludes structural building materials, major appliances, and outdoor landscaping products.
Quantitative Units
USD billions (current prices); unit volume in million units where cited
Segmentation Dimensions
By Product Category and Function; By End-Use Industry; By Commercial Dimension; By Region
Regions Covered
North America, Western Europe, East Asia, South Asia and Pacific, Latin America, Middle East and Africa, Eastern Europe
Countries Covered
China, Japan, South Korea, USA, Canada, Sweden, Germany, UK, Italy, Spain, Australia, India, Singapore, Brazil, Mexico, Argentina, Saudi Arabia, UAE, South Africa, Poland, Russia, and additional markets relevant to this sector
Key Companies Profiled
IKEA, Williams-Sonoma, Wayfair, HomeGoods, Zara Home, Crate & Barrel, CB2, Restoration Hardware, Anthropologie, Article, Target Corporation, H&M Home, Etsy Inc., La Redoute, Maisons du Monde, Nitori Holdings, MUJI, Kingfisher plc, JYSK, Homesense
Quantitative Methodology
Primary survey, n=3,800 respondents, Q4 2025, six countries; demand-side model with trade association cross-validation
Qualitative Methodology
47 expert interviews, Q4 2025; applied to validate demand model assumptions, identify emerging dynamics, and assess competitive positioning
Report Format
PDF and XLSX data workbook (Word format preview document)
Publisher
Market Minds Advisory
Report Code
MMA-2026-CON-853
Published
August 2026
Contact
sales@marketmindsadvisory.com | www.marketmindsadvisory.com

Purchase the full Home Decor Market Report (2026 to 2036).

The full report provides a quantitative and qualitative assessment of the global home decor market through 2036, including regional sizing across all seven MMA-tracked geographies and category-level segmentation covering wall decor, textiles, lighting, furniture accents, tabletop, and seasonal formats. It profiles twenty leading retailers, benchmarking brand recognition, curation credibility, and retail distribution scale across the competitive landscape. The report includes primary survey findings from 3,800 respondents and 47 expert interviews conducted in the fourth quarter of 2025, alongside freight cost and private-label competitive risk analysis. Buyers receive segment-level revenue models, editable data tables, and a framework for evaluating retailer and market entry decisions.
Seven-region market sizing with category-level revenue breakdowns
Twenty-company competitive profiles with moat and risk analysis
Primary survey data from 3,800 respondents across six countries
Forty-seven expert interviews on personalisation and adoption trends
Editable data tables for custom scenario and sensitivity modeling
Freight cost and private-label competitive risk assessment

Built For The People Who Decide

From boardroom strategy to bench-side execution, this report is read cover-to-cover by leaders shaping the next decade of their industry, turning demand scenarios, market dynamics and valuation benchmarks into decisions.
CXOs/ Presidents/ VPs/ Managers
M&A and Corporate Development
Strategy Teams and R&D Heads
Procurement and Product Directors
Regulatory and Compliance Leaders
Investor Relations and Equity Analysts