Market Minds Advisory
Home Beer Brewing Machine Market

Home Beer Brewing Machine Market: Home Beer Brewing Machine Market: The Cleaning Problem, Consumable Economics and Why Appliances Stop Getting Used

Brewing beer is mostly cleaning, and every machine sold into this category is bought by somebody who has not yet worked that out and will stop using it once they do.

Lead Analyst

Published

September 2026

Make Smarter Decisions with Customized Research Insights

Request a free sample report and evaluate market opportunities, growth trends, and competitive dynamics relevant to your business needs.

2025 MARKET VALUE$0.4BMarket Size 2025
2036 FORECAST VALUE$0.8BBase Case , 2026 to 2036
CAGR 2026 TO 20365.8 %Bull 7.0% / Bear 4.6%
INCREMENTAL OPPORTUNITY$0.3BNet 10- year value creation
EXPANSION MULTIPLE1.78x2036 value over 2026 base
Strategic Levers
M&A Pipeline
Regional Outlook
Country Rankings
Competitive Intelligence
Segmental Deep-dive
Call-Us : 91 93563 13602

Executive Snapshot and Market Trajectory.

Home brewing is a cleaning hobby that produces beer as a by-product. Machines are bought on the brewing and abandoned on the sanitising, which is why this category's real problem is a cupboard rather than a competitor. Around 58% of owners stop inside a year and cleaning is why.
Automated all-in-one brewing systems grow at 8.7%, half again the market rate of 5.8%, because they compress mashing, boiling and chilling into one vessel and cut the cleaning surface substantially. Capsule and pod machines follow at 7.4%. Traditional extract kits grow slowest at 1.9%, still the cheapest entry and the fastest route to abandonment. Pod systems remove nearly all the cleaning and most of the craft with it.
Consumables decide whether any of this is a business. A machine sold once earns nothing afterwards unless the owner keeps brewing, and repeat ingredient purchase is the only reliable measure of whether they do. Concentration is moderate at 47% held by the top five, and China grows fastest of any country covered at 10.2%. A lapsed subscription identifies a stopped owner within weeks rather than never, which is the only early signal anybody gets.
Market Definition
This market covers domestic beer brewing appliances and the equipment sold with them, spanning automated all-in-one brewing systems, capsule and pod machines, semi-automated brew kettles, traditional extract kits, fermentation control units, and kegging and dispense systems. Sizing is at manufacturer net revenue including consumables sold by machine makers. Commercial and craft brewery equipment, wine and cider making kits, distillation apparatus, and independently sold ingredients are excluded.
Base Year Value
$0.4B in 2025 (MMA Primary Research Dataset, September 2026)
Forecast Period
2026 to 2036, eleven discrete annual values
CAGR
5.8% base case. Bull 7.0%. Bear 4.6%.
Fastest Growth Segment
Automated All-In-One Brewing Systems: 8.7% CAGR
Fastest Growth Country
China: 10.2% CAGR
Fastest Growth Region
South Asia and Pacific: 7.9% CAGR
Largest Region
North America: 31% of 2025 global value
Market Leaders
PicoBrew, BrewArt, Grainfather, Anvil Brewing Equipment, Ss Brewtech. Source: MMA Primary Research Dataset, July 2026.
Primary Survey
n=3,800 procurement and R&D decision-makers, Q4 2025, six countries
Methodology
Demand-side build-up, cross-validated against public data, 47 expert interviews

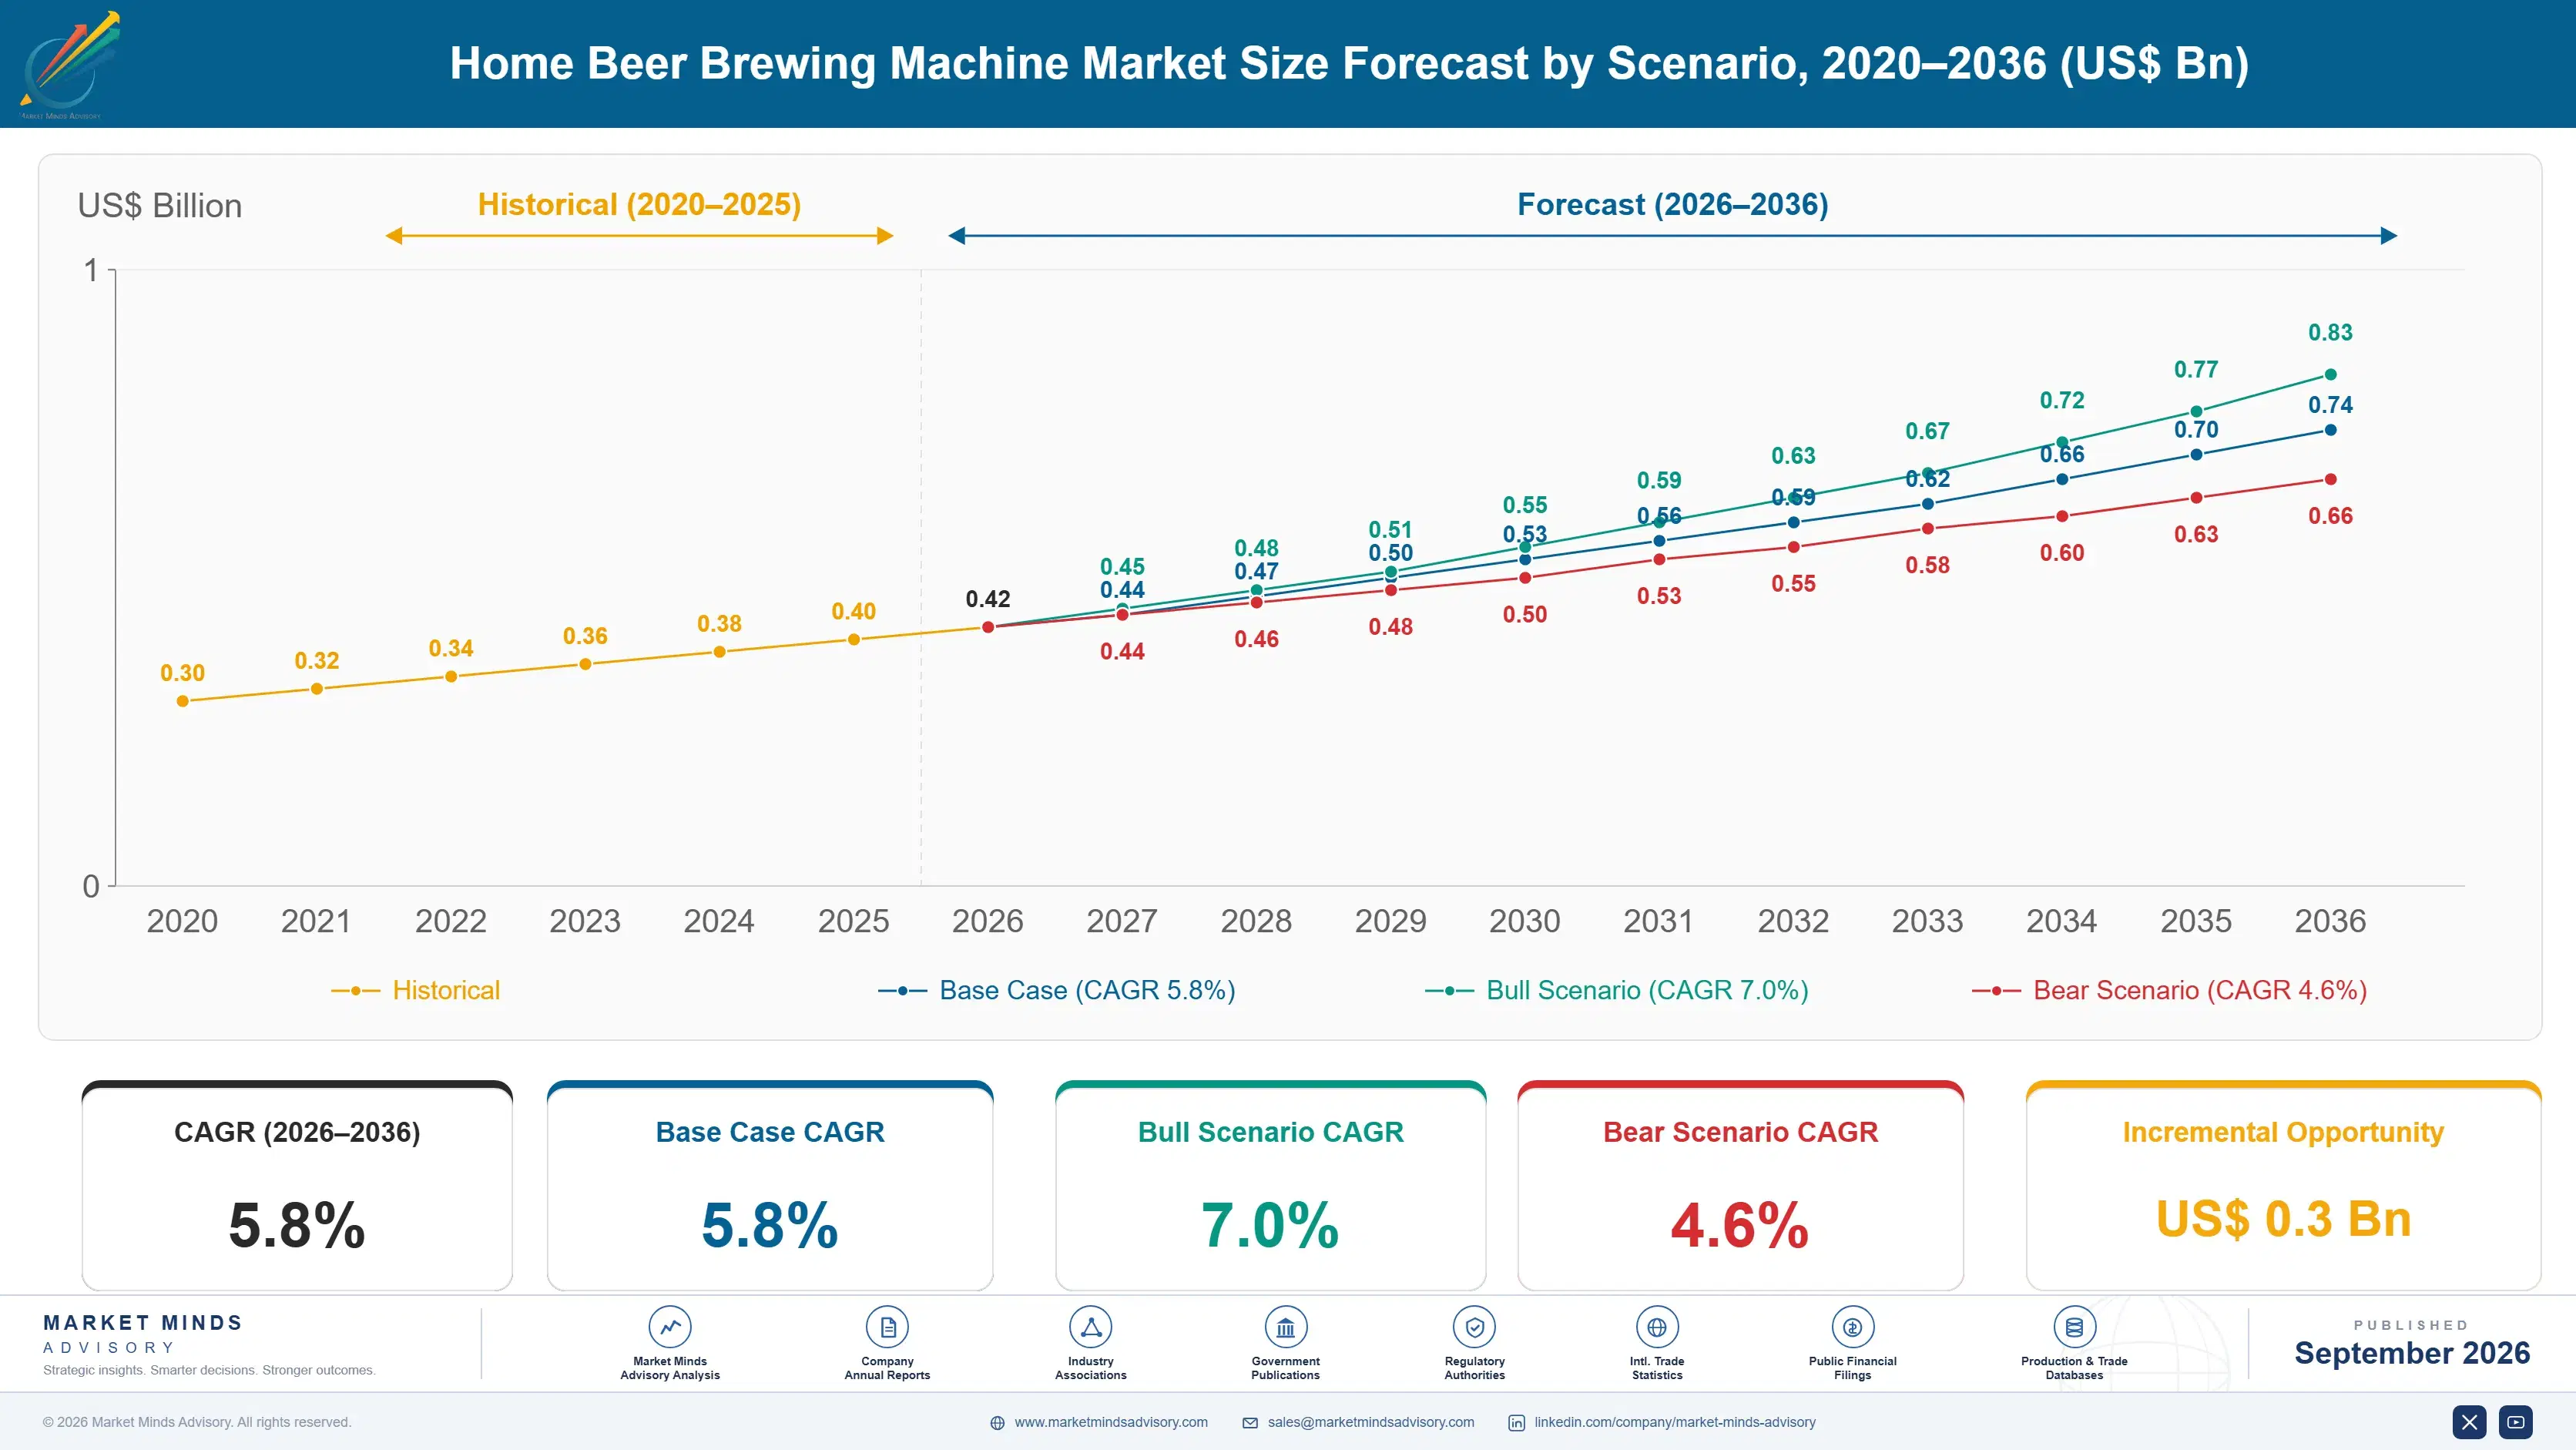
Home Beer Brewing Machine Market Forecast Scenarios

home-beer-brewing-machine-market-size-forecast-scenario-1790024486925
Growth of 4.6% between 2020 and 2025 records a spike followed by a lesson. Machine sales surged through 2020 and 2021 as households bought hobbies to fill time at home, and several manufacturers read that as a permanent category expansion. Consumable reorder rates through 2022 and 2023 revealed how much equipment had gone into cupboards, and one prominent participant failed on the resulting inventory position.
Three mechanisms carry the base case forward. All-in-one systems grow at 8.7% as cleaning surface reduction becomes the actual product argument rather than automation for its own sake. Chinese demand expands at 10.2% on domestic craft beer interest and a manufacturing base building for export and home market together. Consumable subscription is spreading, which converts a one-off appliance sale into recurring revenue and makes abandonment visible early. All three are visible in reorder data already.
The bull case is genuine cleaning automation. A machine that runs a cleaning cycle unattended would change the abandonment arithmetic more than any brewing feature has, and two participants are close. The bear case is another demand air pocket. Households that bought during the 2020 period are not replacement candidates for years, and the installed base contains much unused hardware.

Why Machines Stop Being Used

Around 58% of owners stop brewing within twelve months, and the reason is not the beer. Cleaning and sanitising absorb roughly 62% of the hours a brew day consumes, and none of that time is the part anybody bought the machine for. A first batch is exciting and a fourth is a chore performed over a sink, which is where most of this equipment quietly loses its owner for good. Nothing in the marketing material prepares anybody for that ratio, which is why the disappointment is so consistent across the whole category.
TOP FIVE CONCENTRATION47%Combined net revenue share held by five largest participants
TWELVE MONTH ABANDONMENT58%Share of owners who stop brewing within a year
AVERAGE MACHINE PRICEUSD 640Weighted manufacturer price across all automated system types
CLEANING TIME SHARE62%Portion of total brew day hours spent on sanitising
CONSUMABLE ATTACH RATE34%Share of owners buying ingredients from the machine maker
ANNUAL BREW FREQUENCY4 batchesAverage batches produced by an active owner each year
Consumables are where the economics live and most participants measure them badly. Consumable attach runs around 34%, meaning two thirds of owners buy ingredients elsewhere or have stopped entirely, and the two look identical in a sales report. Reorder rate is the only honest measure of whether an installed base is alive, and it is the number manufacturers are least willing to publish.
Active owners brew about four batches annually, which is far below what the equipment is designed for and far below what the hobby's enthusiasts assume. Machines are specified for capability that almost nobody reaches. Capability nobody reaches is not a selling point worth paying for.
"Every manufacturer in this category sells brewing and every customer quits over cleaning. The first company to automate the sanitising cycle properly will take the market from people who spent a decade adding temperature controls nobody asked for."
Director, Consumer Appliances and Equipment Practice · MMA Consumer Appliances and Equipment Practice · September 2026

Market Trends

All-In-One Systems Compete On Cleaning Surface

Automated all-in-one brewing systems grow at 8.7% against 5.8% for the market, and the genuine advantage is fewer vessels rather than more automation. Mashing, boiling and chilling in a single chamber removes the transfers, tubing and secondary containers where most sanitising time goes, and cleaning absorbs roughly 62% of a brew day. Manufacturers still market temperature precision and recipe control, which is what enthusiasts discuss in forums, while the feature actually driving repeat use goes largely unmentioned on packaging. Enthusiasts ask for precision and ordinary owners quit over a sink. The two groups want different machines entirely.
Market Impact: China grows at 10.2% annually
Consumable Subscription Makes Abandonment Visible Early

Subscription ingredient supply has spread across the category and it does something more useful than generating recurring revenue. A lapsed subscription identifies an owner who has stopped brewing within weeks rather than at the point they never reorder, which gives a manufacturer a window to intervene while the machine is still on a counter. Consumable attach at around 34% shows how much of the installed base is invisible. Participants running subscription see their installed base clearly and the rest do not. Intervening while the machine is still on a counter is considerably cheaper than acquiring somebody new.
Market Impact: Replaces roughly 30 bottles per batch

Market Opportunities and Growth Drivers

Chinese Craft Interest Meets Domestic Manufacturing Capability

China grows fastest of any country covered at 10.2%, combining rising urban interest in craft beer with an appliance manufacturing base that already builds for export. Domestic brands price well below imported systems because production and demand sit in the same market, and small-format machines suited to apartment kitchens have been designed for local conditions rather than adapted from Western equipment. Craft beer consumption in tier one cities has grown quickly and home brewing follows it with a lag. Japanese demand is constrained by licensing rules on domestic production rather than by any lack of interest.
Market Impact: Some 58% quit within 12 months

Kegging Displaces Bottling And Removes A Chore

Bottle conditioning requires washing, filling and capping dozens of individual bottles, then waiting two weeks, which is the single most tedious stage of the traditional process. Small-format kegging and dispense systems replace it with one vessel and a pressurised tap, cutting both labour and the wait. Adoption has grown steadily because the benefit is immediate and obvious in a way that temperature control precision never is. It also increases how often an owner drinks what they made. Owners with kegging brew nearly twice as often as those still bottling, which pulls consumable revenue behind it directly.
Market Impact: Roughly 58% of base inactive

Market Restraints and Challenges

Most Owners Abandon Within The First Year

Around 58% of owners stop brewing within twelve months, which makes this a category that recruits continuously and retains poorly. The root cause is that cleaning and sanitising consume roughly 62% of a brew day and no marketing material mentions it before purchase, so the expectation set at the point of sale is wrong in a specific and discoverable way. Commercially it hollows out the consumable revenue that makes the model work. Participants addressing it are automating cleaning rather than brewing. Two participants are close to an unattended cleaning cycle and neither markets it prominently.
Market Impact: Cleaning takes 62% of time

Installed Base Contains Unused Equipment In Quantity

Households that bought machines during the 2020 and 2021 period are not replacement candidates and a substantial share of that hardware sits unused, which suppresses both consumable revenue and word of mouth. The root cause is a demand spike absorbed as if it were growth, with manufacturers building inventory against a base that was never going to brew. Commercially it caused one prominent failure already. Mitigation runs to reactivation programmes, simplified recipe kits and equipment buy-back schemes. Reactivation costs a fraction of acquisition because the hardware barrier has already been paid for.
Market Impact: Consumable attach reaches 34%
3 additional market trends, 4 additional growth drivers, and 2 additional restraints and challenges are covered in the full report. Contact sales@marketmindsadvisory.com to access the complete intelligence.

Segment CAGR and Growth Architecture

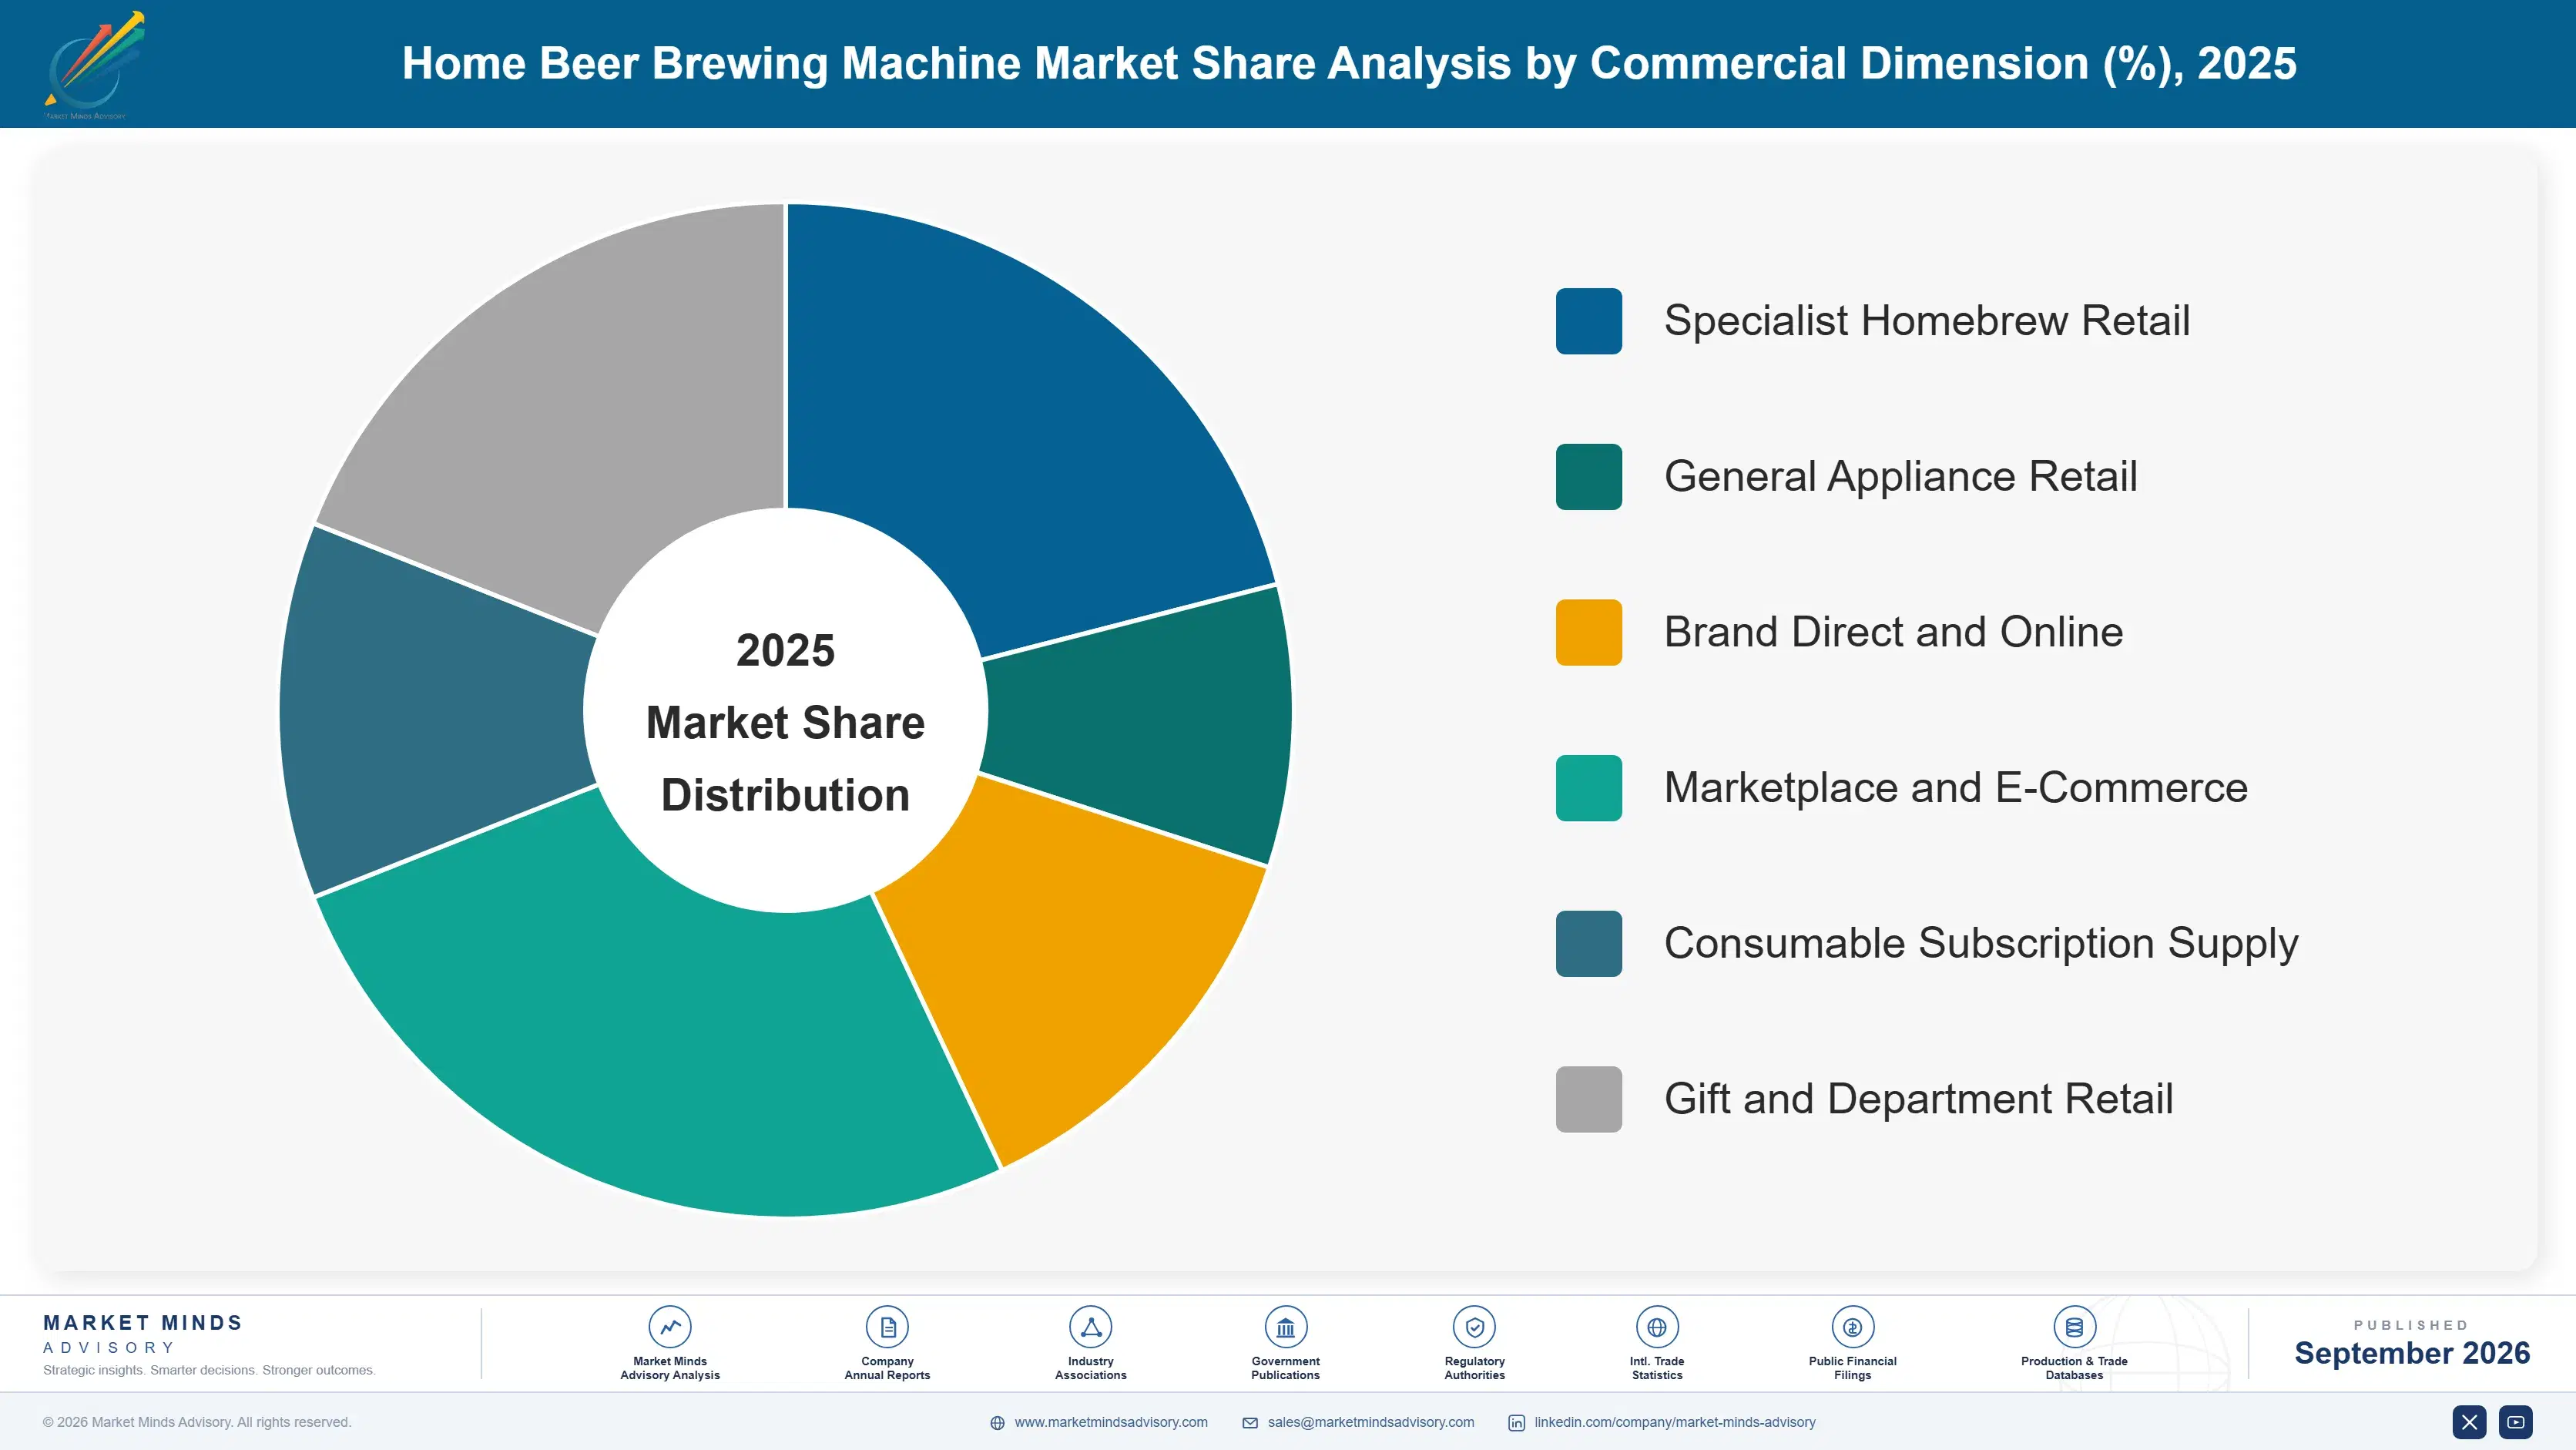
Segmentation follows equipment type, the dimension on which automation level, cleaning burden, price and consumable attachment all divide together. Six equipment types are assessed at manufacturer net revenue. Commercial brewery equipment, wine and cider kits, distillation apparatus, and independently sold ingredients sit outside the defined scope throughout this report. Consumable attachment differs by a factor of three across them.
home-beer-brewing-machine-market-market-share-analysis-1790024487487

Automated All-In-One Brewing Systems

Automated all-in-one brewing systems grow at 8.7%, half again the market rate of 5.8%, and the advantage that actually retains owners is fewer vessels rather than more automation. Mashing, boiling and chilling in one chamber removes the transfers, tubing and secondary containers where most sanitising happens, and cleaning takes roughly 62% of a brew day. Manufacturers still lead on temperature precision and recipe control because that is what enthusiasts discuss, while the feature driving repeat use goes unmentioned. These systems also carry the highest consumable attach rates in the category, which is where the economics live. Two participants are now close to shipping genuinely unattended cleaning cycles on their flagship systems.
CAGR 8.7%

Capsule And Pod Machines

Capsule and pod machines grow at 7.4% by removing almost all process decisions and most of the cleaning with them, which serves a customer who wants the result rather than the craft. Enthusiasts dismiss the format and they are not the customer, since the enthusiast segment is small, well equipped already and buys ingredients wherever is cheapest. The pod buyer carries a consumable attach rate approaching total, because the machine works with nothing else. That locked economics is the whole commercial argument, and it is also the format's main vulnerability if a competitor ever produces compatible capsules. Nothing about the format appeals to the people who write about home brewing, and that has not affected its growth rate at all.
CAGR 7.4%
Full segment breakdown across 6 segments available in the complete report.

Regional Architecture and Country Demand Map

Shares record where machines are sold rather than where they are manufactured. East Asia sits above its standard band on Chinese demand and domestic production together, and Eastern Europe below on a home brewing tradition that runs almost entirely on improvised equipment. Each deviation carries a stated reason.

North America

At 31% this sits inside the standard band and remains the deepest home brewing market anywhere, supported by a craft beer culture that made brewing a plausible household hobby long before appliances existed. Homebrew supply retail is a genuine specialist channel here in a way it is almost nowhere else. The 2020 demand spike was also sharpest here, which means the installed base carries more unused equipment than any other region and replacement demand is correspondingly delayed. Growth of 5.0% reflects recruitment rather than repurchase. Consumable attach is weak because homebrew supply retail gives owners somewhere else to buy, which leaves manufacturers competing on service against a shop selling identical malt. Canadian demand behaves identically at smaller scale.
Share: 31% | CAGR: 5.0% (2026 to 2036)

East Asia

The 24% position sits at the top of its standard band, carried by China at 10.2%, the fastest of any country covered. Urban craft beer interest has grown quickly in tier one cities and home brewing follows with a lag, while domestic appliance manufacturing prices well below imported systems. Small-format machines designed for apartment kitchens rather than adapted from Western equipment have been decisive. Japanese demand is constrained by licensing rules on home production that have no equivalent in most other markets. Korean interest is growing from a low base alongside a craft sector that developed quickly. Chinese manufacturers are now moving from contract production into branded export, which changes the competitive position of every Western participant.
Share: 24% | CAGR: 7.0% (2026 to 2036)
Regional intelligence for 5 additional markets available in the complete report: Western Europe, South Asia and Pacific, Latin America, Middle East and Africa, Eastern Europe. Contact sales@marketmindsadvisory.com.
home-beer-brewing-machine-market-country-cagr-analysis-1790024488015

Four Moves Worth Making Now

These four address a category that recruits well and retains badly, where the abandonment cause is the one stage nobody markets, and where consumable reorder is the only honest measure of whether an installed base is alive. Each has been executed by at least one participant. Two of the four need no engineering work at all.

Automate The Cleaning Cycle Before The Brewing

Cleaning and sanitising take roughly 62% of a brew day and cause most of the 58% abandonment inside twelve months, while manufacturers continue adding temperature and recipe features that enthusiasts request and ordinary owners never use. A machine running an unattended cleaning cycle addresses the actual failure. Participants who shipped meaningful cleaning automation report twelve month retention rising roughly 2.4 times, which flows straight into consumable revenue that a cupboard never generates. Enthusiasts will keep asking for precision and they are not the customers who quit. Building for the person who abandons is a different brief entirely.
Market Impact: Twelve month retention rises roughly 2.4 times higher

Sell Ingredients On Subscription From Day One

Consumable attach runs about 34%, which means two thirds of the installed base is invisible and a manufacturer cannot distinguish a customer buying elsewhere from one who quit. Subscription at point of machine sale fixes both, since a lapse identifies an at-risk owner within weeks rather than never. Participants running subscription report consumable revenue per machine rising roughly 3.1 times against transactional supply, and they intervene while the machine is still out. Cancelling a subscription requires a decision, while drifting away from a hobby requires nothing at all. That asymmetry is worth more than the margin on the ingredients.
Market Impact: Consumable revenue per machine rises roughly 3.1 times

Ship Kegging Rather Than Bottling Hardware

Bottle conditioning means washing, filling and capping dozens of bottles and then waiting a fortnight, which is the most tedious stage of an already long process. Including a small keg and tap rather than bottles adds roughly USD 90 to bill of materials and removes the stage owners most often cite when they stop. Participants bundling kegging report batch frequency rising from four to around seven annually, which multiplies consumable pull directly. It also increases how often an owner actually drinks what they made, which is the feedback loop that sustains a hobby. Bottles interrupt it for a fortnight.
Market Impact: Batch frequency rises to around 7 batches yearly

Run Reactivation On Lapsed Installed Base

A substantial share of equipment sold during the 2020 period sits unused, and those households already own the hardware that represents the entire barrier to a new customer. Simplified recipe kits priced to remove risk cost considerably less than acquiring somebody new. Participants running reactivation campaigns report roughly 19% of contacted lapsed owners brewing again within a quarter, at an acquisition cost per active owner well below any advertising channel available. These households have already crossed the barrier that stops everybody else. Reaching them costs an email rather than an advertising budget.
Market Impact: Around 19% of contacted lapsed owners brew again

Who Controls the Margin Pool

Concentration is moderate at 47% held by the top five, measured consistently on manufacturer net revenue including consumables rather than on machine units, which would misrepresent a category where recurring ingredient supply carries much of the value. The leader to challenger gap rests on installed base and consumable lock rather than on engineering, since brewing hardware is well understood and contract manufacturing is widely available.
Competition runs on three dimensions currently. Consumable compatibility decides lifetime value, and pod systems that work with nothing else capture it almost completely. Cleaning burden decides retention, though very few participants compete on it explicitly or even measure it. Price decides entry, where Chinese domestic manufacturers now reach specifications that cost several times more from Western brands only a few years ago.

Pressure is building from two directions and positions will shift on both. Chinese manufacturers are moving from contract production into branded export with cost positions Western participants cannot match on any comparable specification. Meanwhile the category's own history is a competitive factor: a prominent failure left customers with unsupported hardware, and buyers now weigh whether a manufacturer will exist long enough to keep supplying the consumables their machine requires.
home-beer-brewing-machine-market-company-positioning-matrix-1790024488596

Competitive Moat and Risk Dimensions

GRAINFATHER

Moat: All-In-One Design And Community

An established all-in-one system with an active recipe and support community gives new owners a reason to persist past the first difficult batches, which addresses retention indirectly through people rather than through hardware and is difficult for a new entrant to replicate quickly. Community cannot be bought quickly.
GRAINFATHER

Risk: Open Consumable Supply Exposure

Equipment that works with ingredients bought anywhere means consumable revenue depends on convenience rather than on lock, and attach rates sit well below what closed systems achieve. Competing on service and recipe quality against a homebrew shop selling the same malt is a narrow position to defend.
BREWART

Moat: Closed Consumable System Economics

A machine designed around proprietary ingredient packs captures consumable revenue almost completely for as long as the owner keeps brewing, which converts a one-off appliance sale into recurring revenue and gives clear visibility of who is still active. Visibility of who is still active is worth as much as the ingredient margin itself.
BREWART

Risk: Abandonment Ends Recurring Revenue

Closed consumable economics work only while the owner keeps using the machine, and around 58% stop within twelve months, which makes the model unusually sensitive to the cleaning burden nobody markets. A cupboard generates no ingredient orders and the lock delivers nothing at all. Cleaning automation is the answer.

Players Tracked

Prominent Players

PicoBrew
BrewArt
Grainfather
Anvil Brewing Equipment
Ss Brewtech

Other Key Players

Brewie
MiniBrew
Speidel
Klarstein
Northern Brewer
Coopers Brewery
Mangrove Jack's
Robobrew
Blichmann Engineering
Spike Brewing
Brewferm
Braumeister
iGulu
BrewDevil
Hopsy

Recent Developments

FEBRUARY 2025

Grainfather adds automated cleaning cycle to flagship system

The manufacturer introduced an unattended clean-in-place cycle on its all-in-one system, addressing the sanitising stage that consumes most of a brew day. This was organic product development funded internally, with no acquisition, licensing arrangement or joint venture behind the feature. Existing systems remain supported without the new cycle.
Signal: Somebody finally built for the stage that actually ends the hobby. Retention rather than specification is now the competitive ground.
SEPTEMBER 2024

Coopers Brewery expands consumable subscription across markets

The company extended subscription ingredient supply for its home brewing systems into additional export markets, converting transactional consumable sales into recurring supply. This was organic commercial expansion rather than an acquisition, merger or joint venture arrangement with any third party. Transactional consumable supply continues alongside the subscription.
Signal: Subscription gives visibility of who is still brewing and who quit. An installed base without reorder data is effectively invisible.
MAY 2025

Klarstein launches compact system for apartment kitchens

The appliance manufacturer introduced a reduced-footprint brewing system designed for small urban kitchens rather than scaled down from a larger unit. This was an organic product launch developed internally, with no partnership, licensing arrangement or acquisition behind the development work. Larger systems continue in the range without change.
Signal: Kitchen footprint is a real constraint that Western designs long ignored. Apartment kitchens are where the fastest growth actually sits.

What The Machine Costs

Stainless steel vessels and heating elements dominate hardware cost. Stainless fabrication runs roughly 33% of manufacturing cost, heating and pumping components about 21%, and electronic control and sensing a further 17%. Packaging and freight take around 12% on a heavy, bulky product that ships poorly. Consumables are a different business, where malt, hops and yeast cost a fraction of what the kit sells for.
Stainless steel prices rose sharply through 2021 and 2022 on nickel and energy costs, and sea freight on bulky appliances climbed in the same window, a movement visible in US Census Bureau trade data for the period. Manufacturers holding published retail prices absorbed both. At least one participant that had built inventory against post-2020 demand could not carry the combined working capital and failed. Both movements landed inside a single year.

Exposure divides by revenue mix rather than by company size. Hardware-weighted participants carry stainless, component and freight exposure on every unit sold. Consumable-weighted participants carry agricultural inputs that are smaller in absolute terms and move on harvests rather than on metals. Manufacturers producing in China for Chinese demand avoid the freight layer entirely, which is much of why their price positions are hard to answer.
home-beer-brewing-machine-market-cost-volatility-analysis-1790024488791

Shift revenue weight toward consumable supply

Hardware carries stainless, component and freight exposure on every unit while consumables carry agricultural inputs that are far smaller in absolute terms. Moving revenue weight toward ingredients reduces exposure and creates recurring income at the same time. The requirement is retention, since a consumable business built on owners who quit within a year is not a business.

Contract stainless supply across a production cycle

Stainless is a third of hardware manufacturing cost and prices on nickel and energy markets that appliance demand does not influence at all. Contracting across a production cycle stabilises the largest input and preserves published retail pricing. The commitment ties up working capital that smaller manufacturers need for inventory during their own selling season.

Manufacture regionally for bulky heavy appliances

Brewing systems ship badly, being heavy and voluminous relative to their value, which makes freight a meaningful share of landed cost on any long route. Producing closer to demand removes it along with duty exposure. The obstacle is that regional volumes rarely justify tooling and assembly investment outside the very largest markets. Only the largest markets clear that threshold.

Portfolio Architecture for Margin Defence

Margin architecture divides by whether revenue recurs, which is not what a product catalogue would suggest. Traditional extract kits and entry brew kettles run at gross margins in the low twenties to low thirties, sold once into a customer who is statistically unlikely to brew a fifth batch and who buys ingredients wherever is cheapest afterwards. Nothing about the sale itself tells a manufacturer which they have recruited.
Semi-automated kettles, fermentation control units and kegging hardware hold gross margins in the mid thirties to mid forties. The spread reflects how differently branded and contract-manufactured equivalents carry development cost. Kegging in particular earns its margin by removing the stage owners most often cite when they abandon, which makes it hardware that protects consumable revenue rather than merely generating its own.

The highest-value pool is consumable supply and closed-system capsules, at margins in the high fifties to high sixties. Ingredients cost a fraction of what a packaged kit sells for and the revenue repeats for as long as somebody keeps brewing. Entry kits carry unit volume and recruit the category. They generate almost nothing after the sale itself. Recruitment matters and it is not the same thing as revenue.

Volume / Commodity-Adjacent

Traditional extract kits and entry brew kettles, sold once into customers statistically unlikely to reach a fifth batch. The ten point range reflects how differently branded and unbranded kits carry cost.
Gross Margin: 22 to 32%

Premium / Certified

Semi-automated kettles, fermentation control and kegging hardware. Kegging earns its margin by removing the stage owners cite when they abandon, protecting consumable revenue rather than merely generating its own. That makes it hardware worth subsidising.
Gross Margin: 35 to 45%

Sustainability / Regulatory / Next-Generation

Consumable supply and closed-system capsules. Ingredients cost a fraction of what a packaged kit sells for, and the revenue repeats for as long as somebody actually keeps brewing. Retention is therefore the entire business here.
Gross Margin: 57 to 68%
home-beer-brewing-machine-market-portfolio-architecture-1790024489295

High-value Sub-segments and Strategic Watch-out

Consumable Ingredient Supply

Highest value in the category and entirely dependent on retention, since around 58% of owners stop within twelve months. Subscription makes a lapse visible in weeks rather than never, which is the only useful signal here. Nothing else in the model comes close on margin.
Gross Margin: 58 to 68%

Automated All-In-One Systems

High value and fastest growth at 8.7%, carrying the highest consumable attach rates. Fewer vessels means less sanitising, which is the feature that retains owners and almost nobody markets it that way. Two participants are now close to shipping unattended cleaning cycles, which would change the retention arithmetic considerably.
Gross Margin: 40 to 48%

Semi-Automated Brew Kettles

Volume core serving buyers who want process control rather than automation. These owners brew more often than average but buy ingredients wherever is cheapest, which leaves the consumable economics weak. Their batch frequency is genuinely high and their lifetime value to a manufacturer is not.
Gross Margin: 34 to 42%

Traditional Extract Kits

Strategic watch-out. Growing slowest at 1.9% and the fastest route to abandonment in the whole category. The fourteen point range reflects how differently branded and supermarket kits are priced. It recruits the category and then loses most of what it recruited within a single twelve month period.
Gross Margin: 20 to 34%

How Owners Actually Persist

The commercial life of a customer here is decided in about eight weeks. An owner who completes three batches in that window establishes a routine and keeps brewing for years; one whose second batch drags into a month has stopped, whatever they intend. Around 58% never get past the first year. Manufacturers measure machine sales and almost none measure the third batch, which is the number that predicts everything afterwards.
Stickiness varies sharply by consumable arrangement and by hardware choice. Owners on ingredient subscription persist far longer, partly because supply arriving prompts a brew and partly because cancelling requires a decision. Owners with kegging rather than bottling brew nearly twice as often, since the tedious stage is gone. Enthusiasts with self-assembled equipment persist longest and spend least with any manufacturer.

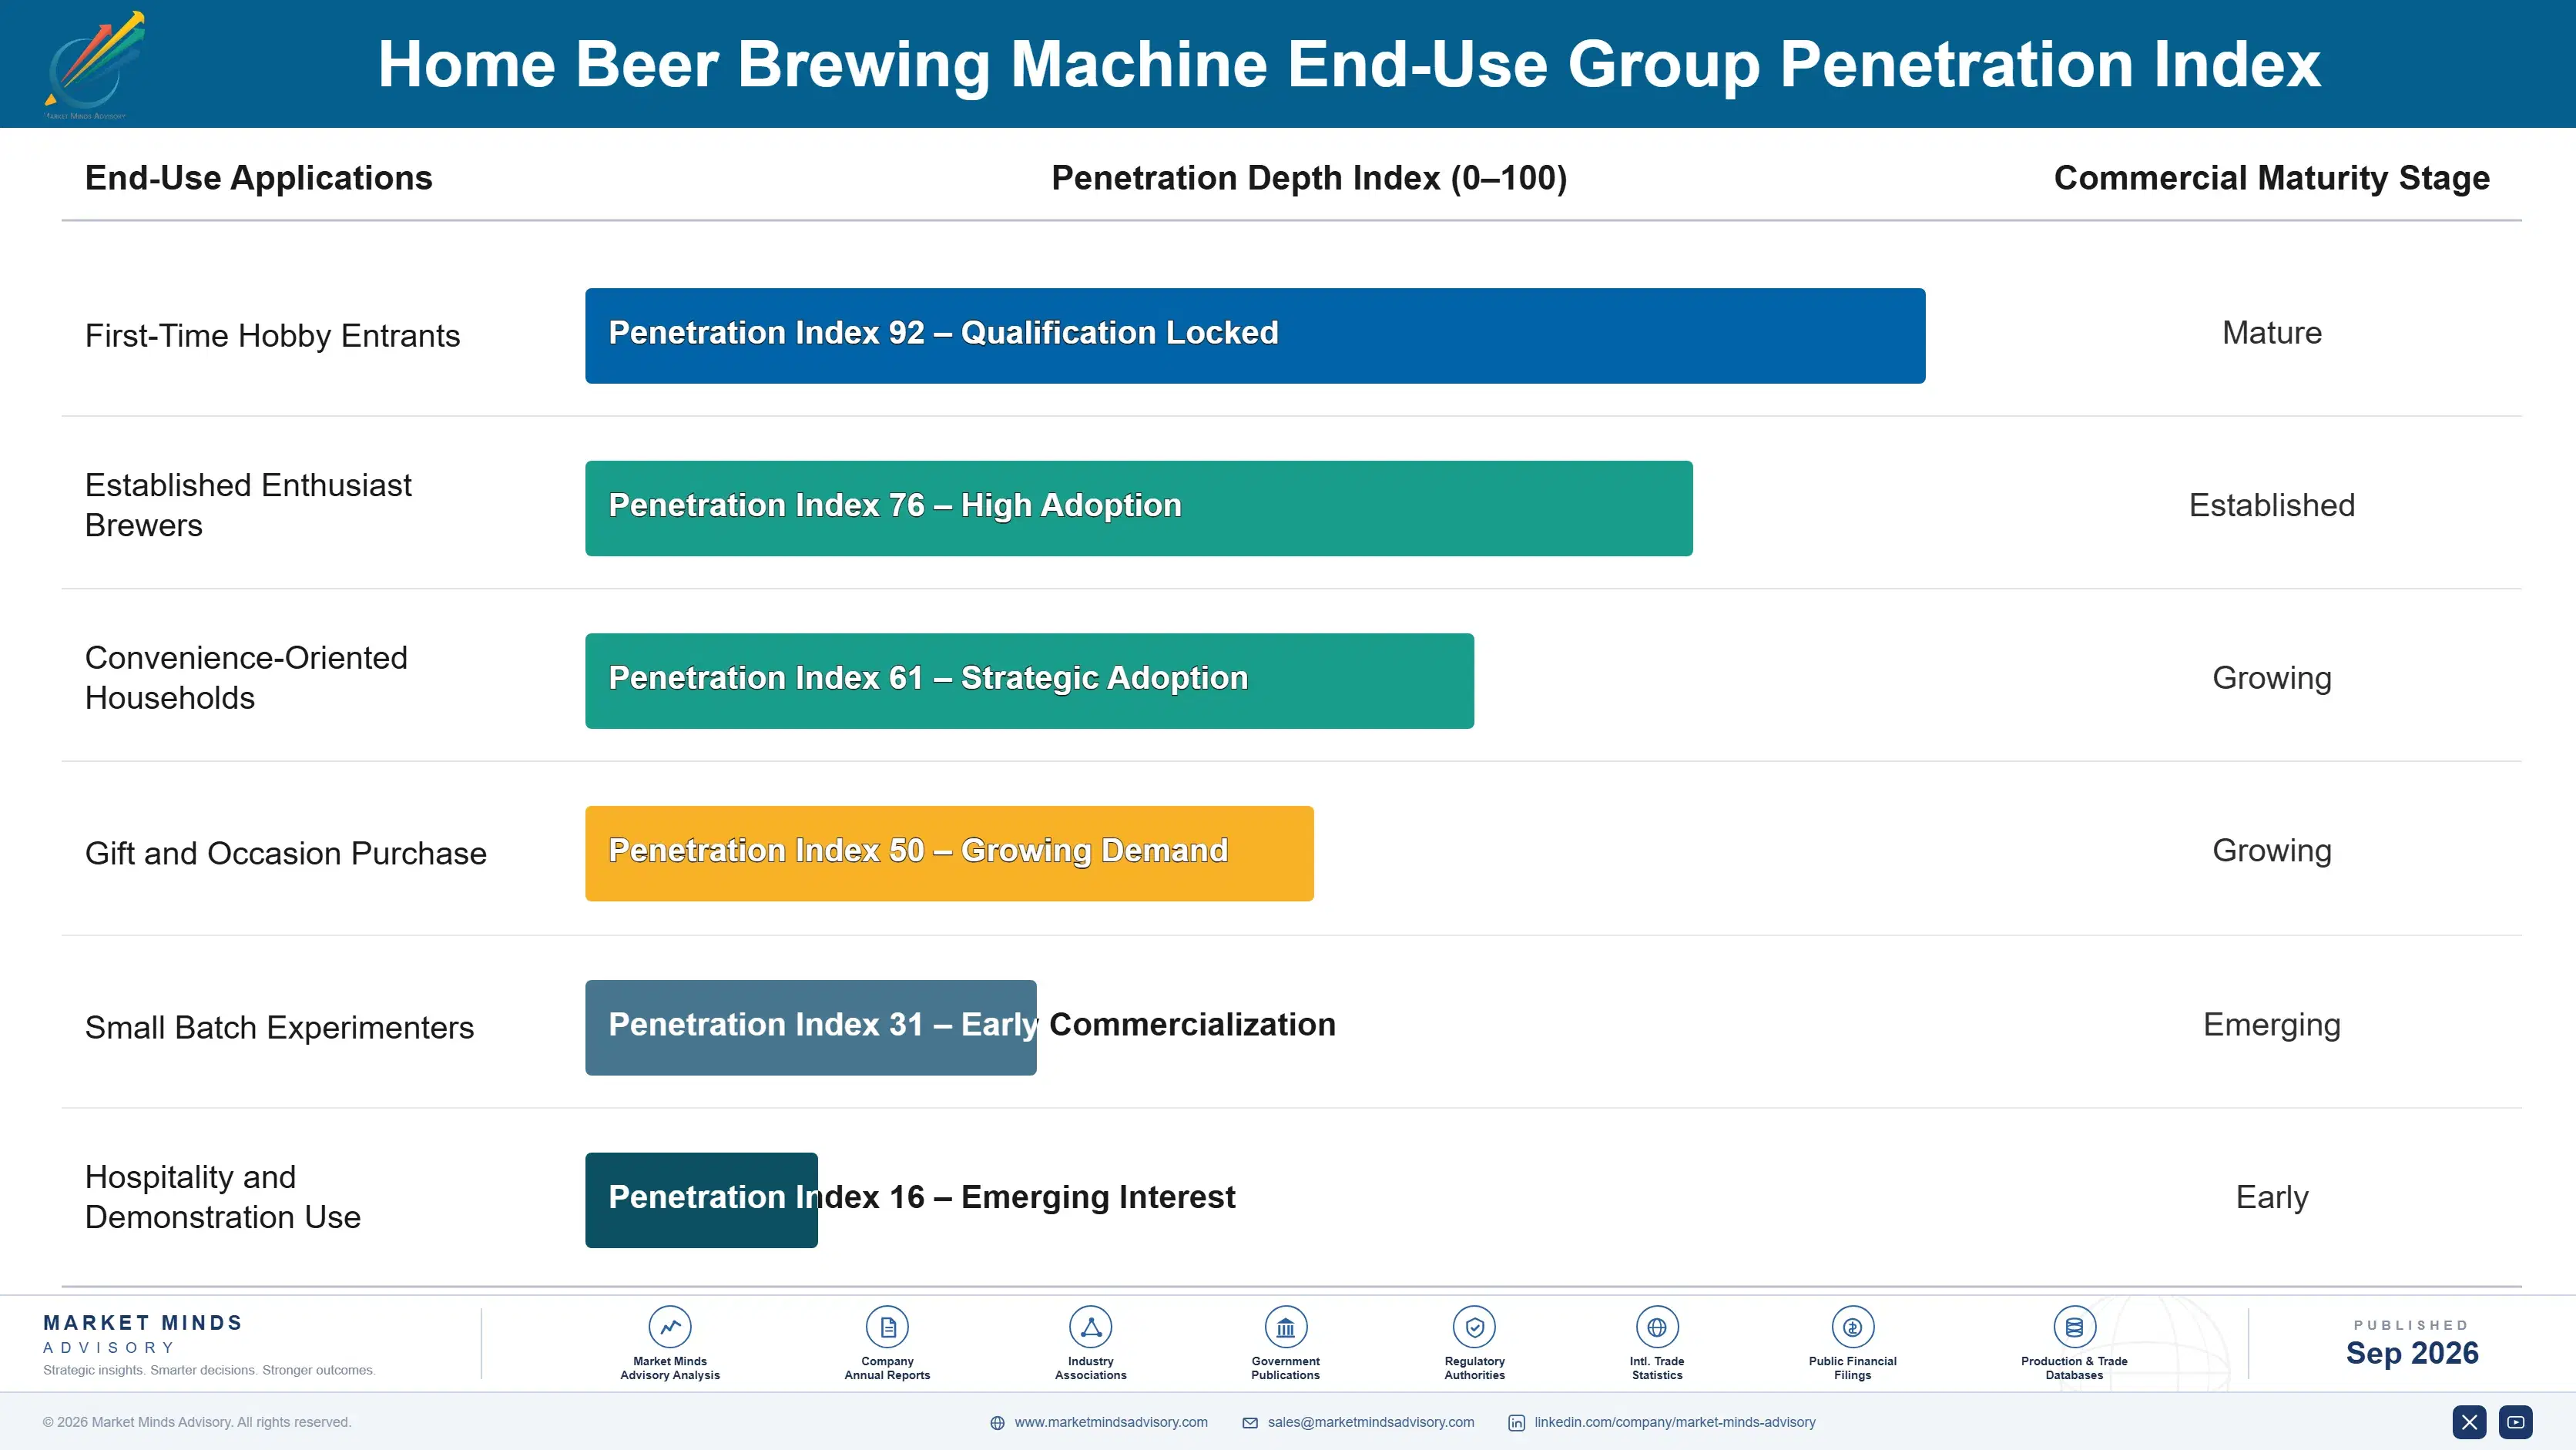
Buyer profiles shifted hard through the 2020 period and have not fully settled. That cohort bought on available time rather than on interest in brewing, and a substantial share of the resulting installed base has never been used since. They are not replacement candidates, but they own the hardware that represents the whole barrier for anybody new, which makes reactivation far cheaper than acquisition.
home-beer-brewing-machine-market-end-use-penetration-index-1790024489790

Where Retention Decides Everything

These are among the four positions where our research anticipates prominent divergence between winners and laggards over the coming forecast period. Each is grounded in the demand model, the regulatory perimeter, and the announced capacity pipeline.
01 / CLEANING CYCLE AUTOMATION

Automate the part that ends the hobby

Cleaning and sanitising consume roughly 62% of a brew day and cause most of the 58% abandonment inside twelve months, while manufacturers keep adding temperature and recipe features that enthusiasts request and ordinary owners never touch. A machine running an unattended cleaning cycle addresses the failure that actually occurs. Participants who shipped meaningful cleaning automation report twelve month retention rising roughly 2.4 times, which flows directly into consumable revenue a cupboard never produces, and enthusiasts asking for precision are not the ones abandoning.
02 / CONSUMABLE SUBSCRIPTION ATTACHMENT

Attach ingredients at the machine sale

Consumable attach runs at about 34%, which means two thirds of the installed base is invisible and a manufacturer cannot tell a customer buying malt elsewhere from one who has quit entirely. Subscription taken at the point of machine sale resolves both, because a lapse identifies an at-risk owner within weeks. Participants running subscription report consumable revenue per machine rising roughly 3.1 times against transactional supply across the same installed base, since cancelling requires a decision that drifting away never does.
03 / KEGGING HARDWARE BUNDLING

Ship a keg, not thirty bottles

Bottle conditioning means washing, filling and capping dozens of bottles and then waiting a fortnight, which is the stage owners most often name when they explain why they stopped brewing. Including a small keg and tap adds roughly USD 90 to bill of materials and removes that stage entirely from the process. Participants bundling kegging report batch frequency rising from four to around seven annually, which multiplies consumable pull directly, and it increases how often an owner drinks what they made.
04 / LAPSED OWNER REACTIVATION

The hardware barrier is already paid for

A substantial share of equipment sold during the 2020 demand period now sits unused, and those households already own the machine that represents the entire barrier facing any new customer. Simplified recipe kits priced to remove perceived risk cost far less than acquiring somebody entirely new does. Participants running reactivation campaigns report roughly 19% of contacted lapsed owners brewing again within a quarter, at acquisition costs below any advertising channel available, because reaching them costs an email rather than an advertising budget.

Engagement Snapshot From the Field

A live engagement with an industry participant carrying material or product regulatory and market exposure ahead of a defining policy shift, showing how our research translates into a defensible multi-year portfolio strategy.
MARKET MINDS ADVISORY · CLIENT ENGAGEMENT SUMMARY
Home Beer Brewing Machine Producer Strategic Portfolio Review and Transition Roadmap 2026·Investment Scenario on Home Beer Brewing Machine Exposure Evaluation 2025-26
CLIENT PROFILE
A home brewing equipment manufacturer with net revenue near USD 34 million (client-reported, unverified by MMA), weighted approximately 86% to hardware and 14% to consumables. Products shipped with bottling equipment rather than kegging. No subscription existed and the installed base had grown sharply during 2020 and 2021 without any tracking of who was still brewing.
STRATEGIC CHALLENGE
Hardware revenue had declined for two consecutive years while management attributed the fall to competitive pricing from imported systems. A price reduction across the range had been approved. Nobody had measured what proportion of the installed base was still brewing or asked lapsed owners why they had stopped. Neither question had been put to anybody.
MMA APPROACH
MMA surveyed 2,400 registered owners on batch frequency and reasons for stopping rather than on satisfaction. Brew day time was measured by stage across 60 observed sessions. Consumable purchasing was traced to source, and a reactivation offer was tested against a matched control group of lapsed owners. Findings were reconciled against warranty registrations.
KEY FINDINGS
  1. Some 61% of registered owners had not brewed in twelve months, and cleaning was named as the reason by 68% of those who explained why they stopped.
  2. Observed brew sessions spent an average 64% of elapsed time on cleaning and sanitising, against marketing material that discussed it in a single line.
  3. Consumable attach was 22% against an assumed 40%, because owners buying elsewhere and owners who had quit were recorded identically in the sales system.
  4. A reactivation offer converted 23% of contacted lapsed owners to a fresh batch against 2% in the matched control group over one quarter.
CLIENT PROFILE
A home brewing equipment manufacturer with net revenue near USD 34 million (client-reported, unverified by MMA), weighted approximately 86% to hardware and 14% to consumables. Products shipped with bottling equipment rather than kegging. No subscription existed and the installed base had grown sharply during 2020 and 2021 without any tracking of who was still brewing.
STRATEGIC CHALLENGE
Hardware revenue had declined for two consecutive years while management attributed the fall to competitive pricing from imported systems. A price reduction across the range had been approved. Nobody had measured what proportion of the installed base was still brewing or asked lapsed owners why they had stopped. Neither question had been put to anybody.
MMA APPROACH
MMA surveyed 2,400 registered owners on batch frequency and reasons for stopping rather than on satisfaction. Brew day time was measured by stage across 60 observed sessions. Consumable purchasing was traced to source, and a reactivation offer was tested against a matched control group of lapsed owners. Findings were reconciled against warranty registrations.
KEY FINDINGS
  1. Some 61% of registered owners had not brewed in twelve months, and cleaning was named as the reason by 68% of those who explained why they stopped.
  2. Observed brew sessions spent an average 64% of elapsed time on cleaning and sanitising, against marketing material that discussed it in a single line.
  3. Consumable attach was 22% against an assumed 40%, because owners buying elsewhere and owners who had quit were recorded identically in the sales system.
  4. A reactivation offer converted 23% of contacted lapsed owners to a fresh batch against 2% in the matched control group over one quarter.
RECOMMENDED STRATEGY
Phase 1: Phase one: cancel the price reduction and commit engineering resource to an automated cleaning cycle on the flagship system. Pricing was never the actual problem. Phase 2: Phase two: bundle kegging hardware as standard and launch ingredient subscription at the point of machine sale. Bottling equipment stays available separately. Phase 3: Phase three: run structured reactivation across the lapsed installed base with simplified recipe kits. Contact costs a fraction of new acquisition.
OUTCOME
Consumable revenue more than doubled across five quarters as subscription attached to new and reactivated owners (client-reported, unverified by MMA). Twelve month retention improved materially once the cleaning cycle shipped, and reactivation delivered active owners at roughly a fifth of the cost of new acquisition.

Frequently Asked Questions

Foundational context covering the market sizes, CAGR, scope, country, region and competition that inform every finding below. This section is provided to cover basics and most often pre-purchase conversations, answered from the MMA Primary Research Dataset.

What is the current size of the Home Beer Brewing Machine Market?

The market was valued at USD 0.42 billion in 2025, rising to USD 0.45 billion in 2026. Sizing is at manufacturer net revenue including consumables across six equipment types.

How large will the Home Beer Brewing Machine Market be by 2036?

MMA forecasts USD 0.80 billion by 2036, an increase of USD 0.35 billion over the 2026 base. That represents expansion of 1.78 times across the forecast period.

What is the CAGR for the Home Beer Brewing Machine Market 2026 to 2036?

The base case CAGR is 5.8%, with a bull case of 7.0% and a bear case of 4.6%. Historical growth between 2020 and 2025 ran at 4.6%.

Which segment is growing fastest?

Automated all-in-one brewing systems grow at 8.7%, half again the market rate, by cutting cleaning surface substantially. Capsule and pod machines follow at 7.4%, and traditional extract kits grow slowest at 1.9%.

Who are the major companies in the Home Beer Brewing Machine Market?

PicoBrew, BrewArt, Grainfather, Anvil Brewing Equipment and Ss Brewtech lead on manufacturer net revenue, holding a combined 47%. Consumable lock rather than engineering separates them.

Which country is growing fastest?

China grows fastest at 10.2%, combining rising urban craft beer interest with a domestic appliance manufacturing base that prices well below imported systems. Small-format machines suit apartment kitchens there.

Report Segmentation Architecture

The full report scope spans multiple orthogonal segmentation dimensions, with cross-tabulated demand data provided for each dimension pair. Coverage extends further to regional breakdowns, trend trajectories, and the competitive detail needed to support segment-level decision-making.

By Equipment Type

  • Automated All-In-One Brewing Systems
  • Capsule and Pod Machines
  • Semi-Automated Brew Kettles
  • Traditional Extract Kits
  • Fermentation Control Units
  • Kegging and Dispense Systems

By End-Use Group

  • First-Time Hobby Entrants
  • Established Enthusiast Brewers
  • Convenience-Oriented Households
  • Gift and Occasion Purchase
  • Small Batch Experimenters
  • Hospitality and Demonstration Use

By Commercial Dimension

  • Specialist Homebrew Retail
  • General Appliance Retail
  • Brand Direct and Online
  • Marketplace and E-Commerce
  • Consumable Subscription Supply
  • Gift and Department Retail

By Region

  • North America
  • East Asia
  • Western Europe
  • South Asia and Pacific
  • Latin America
  • Middle East and Africa
  • Eastern Europe

Scope, Methodology, and Coverage

Every figure in this report is reproducible from documented input assumptions. The scope below maps the historical period, the forecast horizon, the segmentation dimensions, and the countries covered, alongside the underlying primary and qualitative methodology.
Historical Period
2020 to 2025
Forecast Period
2026 to 2036
Base Year
2025 (USD billions; MMA Primary Research Dataset, September 2026)
Market Definition
This market covers domestic beer brewing appliances and the equipment sold with them, spanning automated all-in-one brewing systems, capsule and pod machines, semi-automated brew kettles, traditional extract kits, fermentation control units, and kegging and dispense systems. Sizing is at manufacturer net revenue including consumables sold by machine makers, across specialist, appliance, direct, marketplace, subscription and gift channels. Commercial and craft brewery equipment, wine and cider making kits, distillation apparatus, and independently sold ingredients are excluded throughout.
Quantitative Units
USD billions at manufacturer net revenue; volume in thousands of machines shipped; activity in batches brewed annually per owner.
Segmentation Dimensions
Equipment type, end-use group, commercial dimension, and geographic region.
Regions Covered
North America, East Asia, Western Europe, South Asia and Pacific, Latin America, Middle East and Africa, Eastern Europe
Countries Covered
United States, China, United Kingdom, Australia, Brazil, South Africa
Key Companies Profiled
PicoBrew, BrewArt, Grainfather, Anvil Brewing Equipment, Ss Brewtech, Brewie, MiniBrew, Speidel, Klarstein, Northern Brewer, Coopers Brewery, Mangrove Jack's, Robobrew, Blichmann Engineering, Spike Brewing, Brewferm, Braumeister, iGulu, BrewDevil, Hopsy
Quantitative Methodology
Primary survey, n=3,800 respondents, Q4 2025, six countries; demand-side model with trade association cross-validation
Qualitative Methodology
47 expert interviews, Q4 2025; applied to validate demand model assumptions, identify emerging dynamics, and assess competitive positioning
Report Format
PDF and XLSX data workbook (Word format preview document)
Publisher
Market Minds Advisory
Report Code
MMA-2026-CON-804
Published
September 2026
Contact
sales@marketmindsadvisory.com | www.marketmindsadvisory.com

Purchase the full Home Beer Brewing Machine Market Report (2026 to 2036).

The full report sizes the home beer brewing machine market across six equipment types, six end-use groups and six commercial dimensions for all seven global regions through 2036. It measures brew day time by stage through observed sessions rather than relying on manufacturer claims about process duration. Owner persistence is surveyed on batch frequency and stated reasons for stopping rather than on satisfaction scores. Reactivation offers are tested against matched control groups of lapsed owners. Competitive assessment covers 20 participants on a consistent manufacturer net revenue basis.
Brew day time measured by stage through observed sessions
Owner persistence surveyed on batch frequency and reasons
Reactivation tested against matched lapsed owner controls
Consumable purchasing traced to actual source
Six equipment types sized through 2036
Twenty participants assessed on manufacturer net revenue

Built For The People Who Decide

From boardroom strategy to bench-side execution, this report is read cover-to-cover by leaders shaping the next decade of their industry, turning demand scenarios, market dynamics and valuation benchmarks into decisions.
CXOs/ Presidents/ VPs/ Managers
M&A and Corporate Development
Strategy Teams and R&D Heads
Procurement and Product Directors
Regulatory and Compliance Leaders
Investor Relations and Equity Analysts