Market Minds Advisory
Holographic Display Market

Holographic Display Market: Holographic Display Market: Optical Components, Automotive Volume and the Products That Are Not Holograms

Barely anything sold under this name reconstructs a wavefront, and the part of the category earning real volume revenue is an optical component inside a vehicle windscreen rather than a display at all.

Lead Analyst

Published

September 2026

Make Smarter Decisions with Customized Research Insights

Request a free sample report and evaluate market opportunities, growth trends, and competitive dynamics relevant to your business needs.

2025 MARKET VALUE$1.6BMarket Size 2025
2036 FORECAST VALUE$7.8BBase Case , 2026 to 2036
CAGR 2026 TO 203615.4 %Bull 16.6% / Bear 14.2%
INCREMENTAL OPPORTUNITY$5.9BNet 10- year value creation
EXPANSION MULTIPLE4.19x2036 value over 2026 base
Strategic Levers
M&A Pipeline
Regional Outlook
Country Rankings
Competitive Intelligence
Segmental Deep-dive
Call-Us : 91 93563 13602

Executive Snapshot and Market Trajectory.

About 6% of what is sold under this heading actually reconstructs a wavefront. The rest approximates depth by other means, and the distinction matters commercially because the two are bought by entirely different people for entirely different reasons. That confusion has cost this industry more than any technical limit.
The revenue is in components rather than displays. Holographic optical elements inside vehicle head-up displays and augmented reality waveguides account for 58% of value and grow at 23.1%, half again the market rate of 15.4%. East Asia takes 42% because that is where displays, optical films and vehicle electronics are all manufactured. China is the fastest-growing country market at 20.2%. Nothing about display technology drives it.
Concentration is low at roughly 31% across the top five on measured component and system revenue, and the field divides between optical materials suppliers and display product companies that rarely compete. Retail installations sold as holographic are replaced by ordinary screens 34% of the time within three years, which tells you what buyers concluded after living with them. Novelty produced attention once and never twice. Buyers measured the difference honestly and drew the obvious conclusion.
Market Definition
This market covers displays and optical components using holographic or light-field techniques to present depth or overlaid imagery, spanning holographic optical elements for waveguides and head-up displays, light field and multi-view autostereoscopic displays, semi-transparent projection display systems, volumetric and aerial display systems, holographic print and security optics, and digital holography capture and reconstruction systems. Revenue is measured as component and system shipment value. Conventional stereoscopic three-dimensional displays requiring glasses, virtual reality headsets without holographic optics, projection screens and general display panels are excluded.
Base Year Value
$1.6B in 2025 (MMA Primary Research Dataset, September 2026)
Forecast Period
2026 to 2036, eleven discrete annual values
CAGR
15.4% base case. Bull 16.6%. Bear 14.2%.
Fastest Growth Segment
Holographic Optical Elements for Waveguides and Head-Up Displays: 23.1% CAGR
Fastest Growth Country
China: 20.2% CAGR
Fastest Growth Region
South Asia and Pacific: 17.6% CAGR
Largest Region
East Asia: 42% of 2025 global value
Market Leaders
Covestro, Envisics, DigiLens, Sony and Leia lead on measured holographic component and display system revenue. Source: MMA Primary Research Dataset, July 2026.
Primary Survey
n=3,800 procurement and R&D decision-makers, Q4 2025, six countries
Methodology
Demand-side build-up, cross-validated against public data, 47 expert interviews

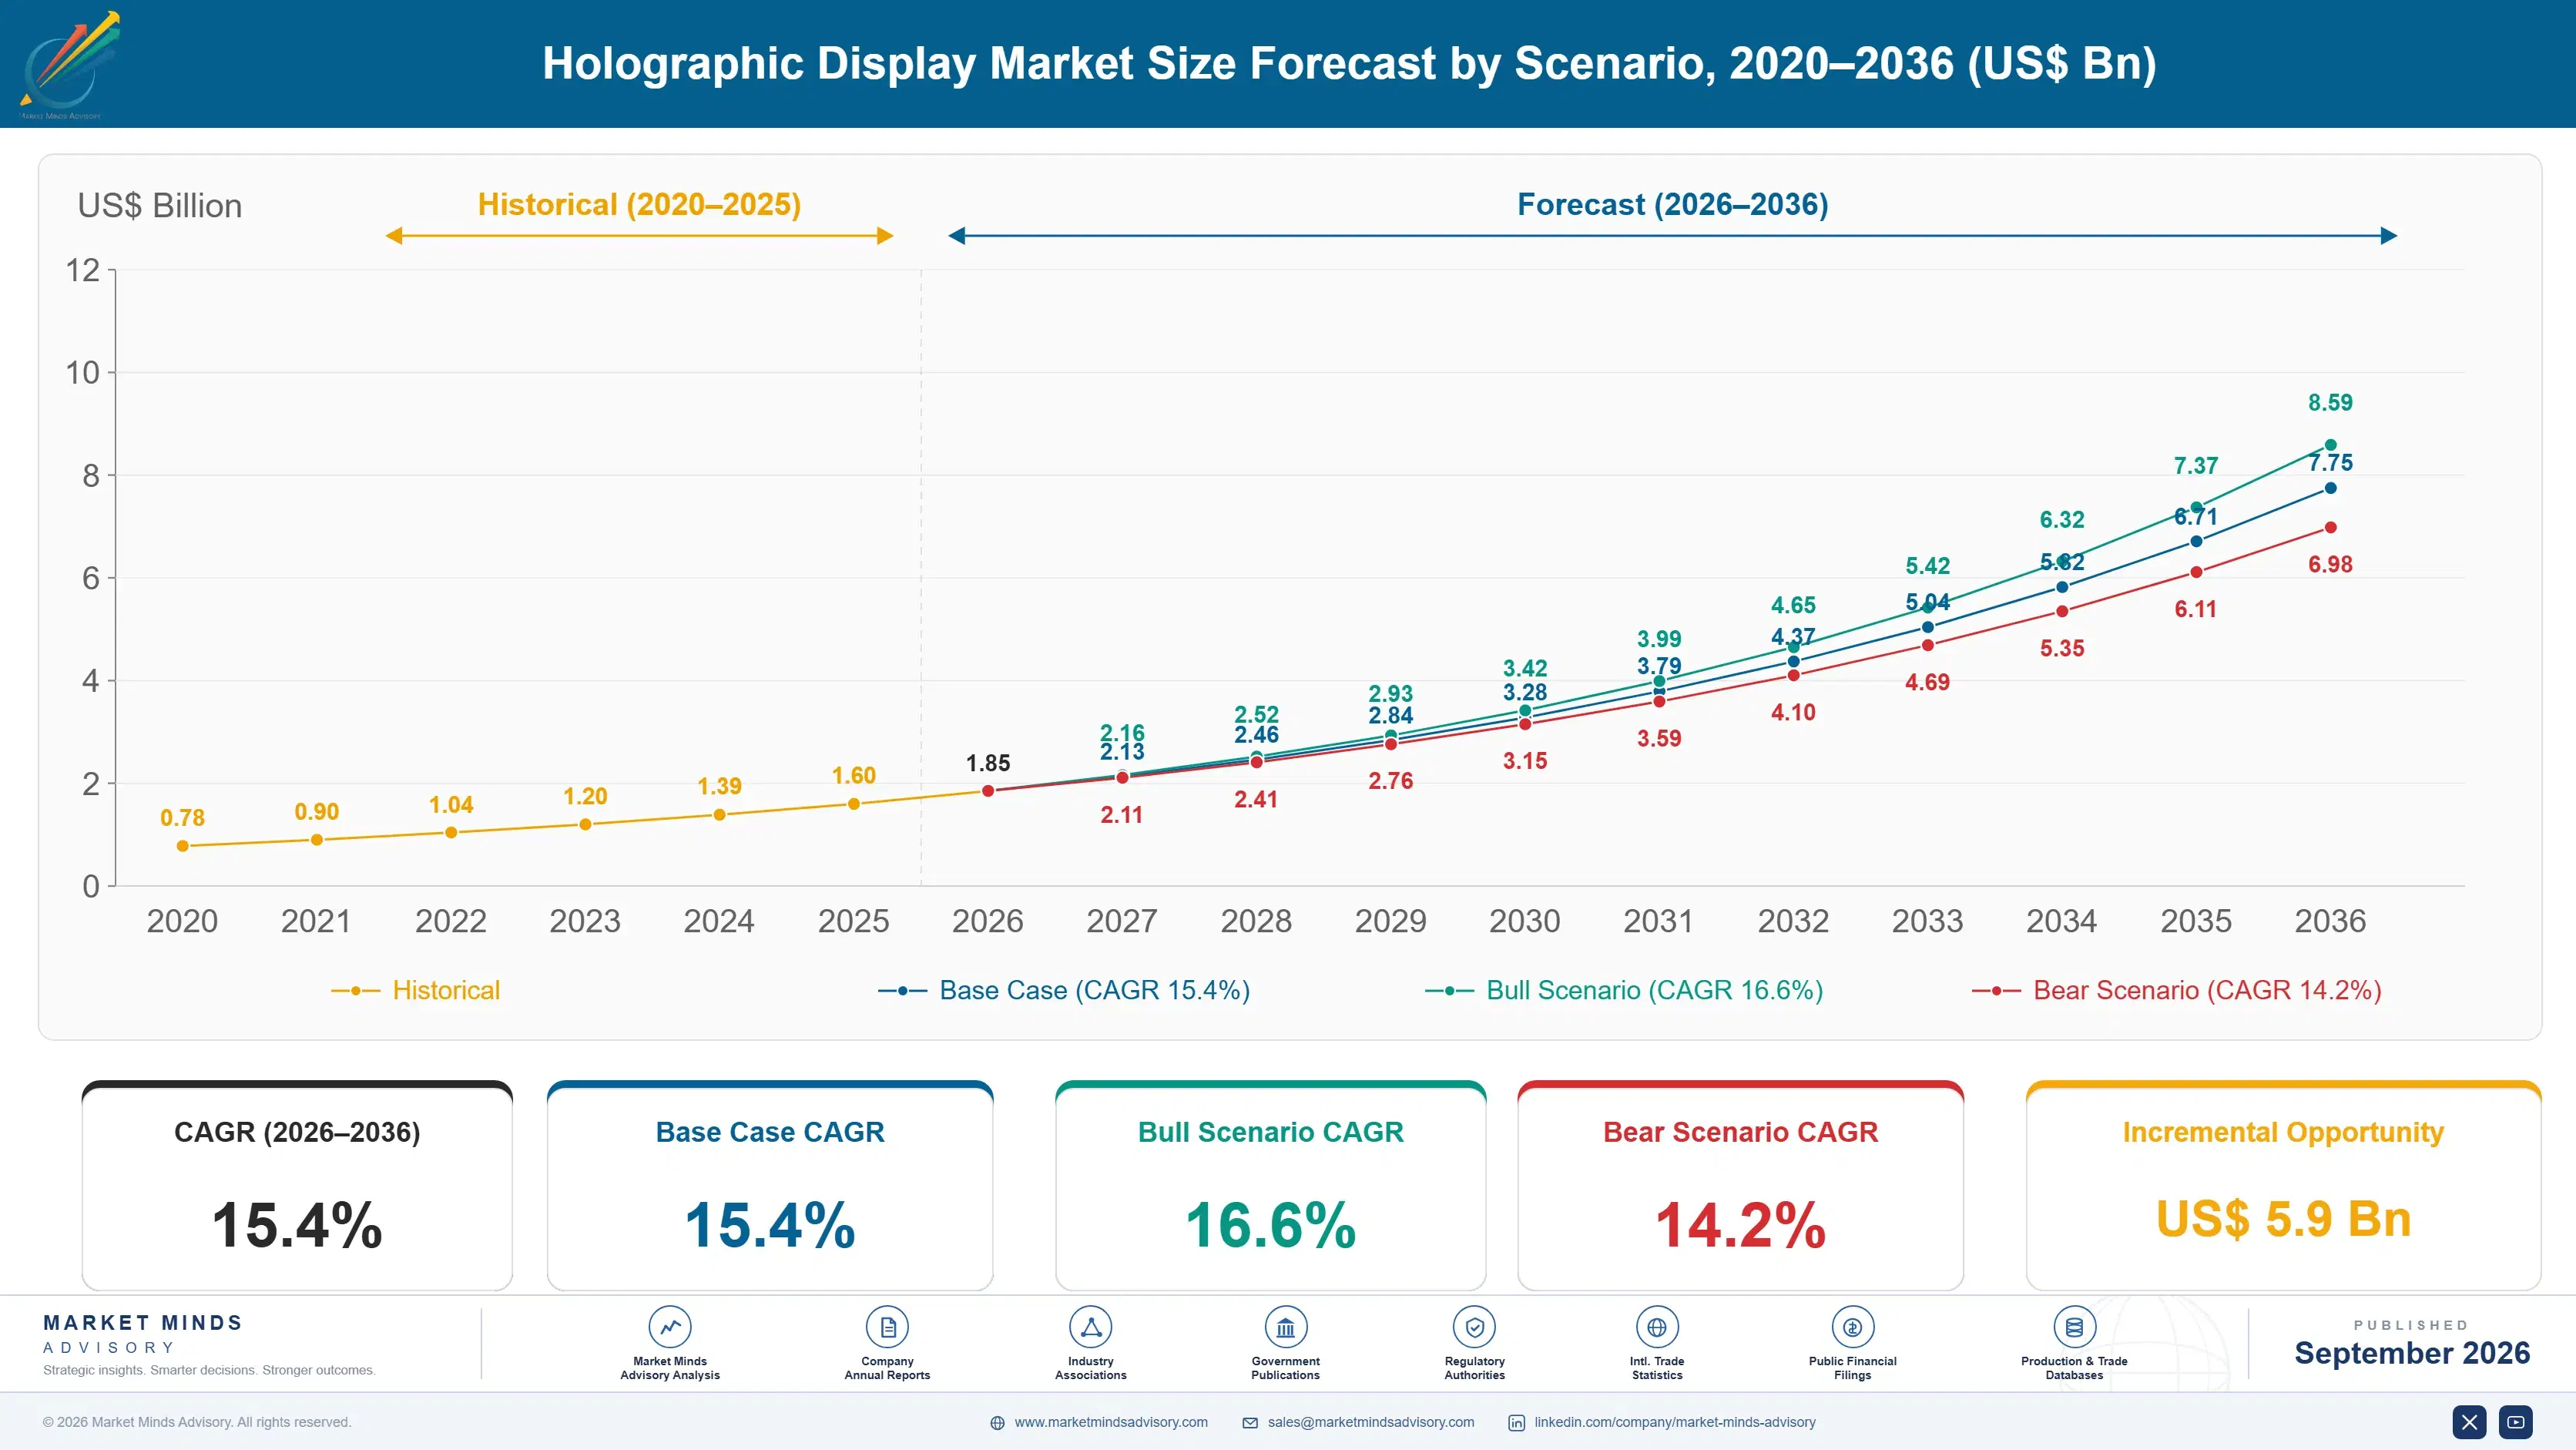
Holographic Display Market Forecast Scenarios

holographic-display-market-size-forecast-scenario-1788421768807
Growth ran at 14.0% from 2020 to 2025 with the composition changing completely underneath a stable number. Retail and event installations, which carried the category through the previous decade, declined as operators compared results against ordinary bright screens and found no measurable difference. What replaced that revenue was optical components sold into vehicle head-up displays and augmented reality waveguides, which is a component business with different customers entirely.
The base case at 15.4% rests on three mechanisms and all of them are in components rather than displays. Head-up display fitment is rising across mid-market models where it was a luxury option, and each unit carries an element costing around USD 46. Augmented reality waveguides need holographic elements to achieve acceptable light throughput, roughly 3.2 times earlier combiner designs. Third, photopolymer recording materials now support volume replication rather than laboratory work.
The bull case at 16.6% assumes augmented reality eyewear reaches consumer volume, which would multiply waveguide element demand well beyond automotive. The bear case at 14.2% is that head-up display fitment plateaus and eyewear stays a professional niche, leaving a modest automotive component market with a small specialist tail. The second is closer to what current fitment data supports.

Almost None of This Is Actually Holography

The word is doing a great deal of work it was never entitled to. Roughly 6% of products in this category reconstruct an optical wavefront, which is what holography means. The remainder approximate depth through semi-transparent projection, multiple viewing angles or moving surfaces, and several would be recognisable to a Victorian theatre. That is not a criticism of the products, but it explains the confusion.
TOP FIVE CONCENTRATION31%Fragmented across optical component makers and display specialists
AUTOMOTIVE COMPONENT SHARE58%Portion of value in optical elements for vehicle displays
TRUE HOLOGRAPHY SHARE6%Products reconstructing a wavefront rather than approximating depth
RETAIL FIXTURE REPLACEMENT34%Installations replaced by conventional screens within three years
WAVEGUIDE EFFICIENCY GAIN3.2 timesLight throughput advantage over earlier optical combiner designs
AVERAGE ELEMENT COSTUSD 46Unit price for an automotive holographic optical element
Commercially the interesting part is not a display at all. Holographic optical elements are recorded diffraction structures steering and combining light far more efficiently than conventional optics, and they sit inside vehicle head-up displays and waveguides. That component business accounts for 58% of market value at around USD 46 per element, and it grows because vehicle fitment is rising rather than because anyone finds holography interesting.
The retail and event business that once defined this category is in decline for an unsentimental reason. Operators installed semi-transparent projection, measured behaviour against ordinary screens, and found the difference did not justify cost or maintenance. Around 34% of installations are replaced with conventional screens inside three years. Novelty produces attention once and does not produce it twice, which is a difficult basis for a repeat business.
"The most successful holographic product in the world is a piece of film inside a windscreen that no driver will ever see or think about. Everything with the word in its marketing is competing against a bright television, and the television usually wins on every measure that matters."
Director, Display Technology and Optical Components Practice · MMA Technology Practice · September 2026

Market Trends

Optical Components Displace Displays as the Revenue Base

The commercial centre of this category has moved from products people look at to components inside products people look through. Holographic optical elements steer and combine light with efficiency conventional optics cannot match, which makes them the enabling part of a vehicle head-up display or an augmented reality waveguide rather than a feature of one. They now represent 58% of market value. The buyer is an automotive tier one supplier or an eyewear manufacturer specifying to an optical tolerance, not a marketing team choosing a fixture, and the sale is completely different.
Market Impact: Elements cost USD 46 each
Retail Installations Lose Against Ordinary Bright Screens

Semi-transparent projection displays produced genuine attention when they were unfamiliar and produce far less now, and operators have measured the difference rather than assumed it. Around 34% of installations are replaced with conventional screens within three years, usually because a brighter and cheaper display delivered comparable dwell time with less maintenance and no ambient light constraint. The suppliers who built this category are contracting alongside it. What survives is high-value experiential work where the effect itself is the product rather than a means of showing something else. Suppliers built around it are contracting alongside it.
Market Impact: Delivers 3.2 times light throughput

Market Opportunities and Growth Drivers

Head-Up Display Fitment Extends Beyond Luxury Vehicles

Head-up displays have moved from a premium option into mid-market model fitment across several manufacturers, particularly on Chinese electric platforms where large windscreen projections have become an expected feature rather than a differentiator. Each unit carries a holographic optical element costing around USD 46, which makes component demand a direct function of vehicle build rates and fitment rates together. China is the fastest-growing country market at 20.2% for exactly this reason. Component suppliers benefit from a volume automotive cycle rather than from any display market development. Nothing about display technology drives it.
Market Impact: Only 6% reconstruct wavefronts

Waveguide Efficiency Determines Whether Eyewear Is Wearable

Augmented reality eyewear fails commercially on brightness, battery life and weight before it fails on anything else, and all three depend on how much projector light actually reaches the eye. Holographic waveguides deliver roughly 3.2 times the throughput of earlier combiner designs, which is the difference between a display readable outdoors and one that is not. That makes the optical element the enabling component rather than an implementation choice. Every eyewear programme therefore has a waveguide decision at its centre, and there are very few credible suppliers. Very few suppliers can meet the requirement.
Market Impact: Depends on 2 qualified suppliers

Market Restraints and Challenges

The Category Name Promises What Products Do Not Deliver

Roughly 6% of products in this category reconstruct a wavefront, and buyers who arrive expecting a floating three-dimensional image consistently leave disappointed by semi-transparent projection or limited-angle light field displays. The root cause is decades of accumulated marketing language that the industry has benefited from and now cannot correct without undermining itself. Commercially it produces evaluations that fail on expectation rather than performance. Suppliers mitigate by demonstrating in person early, describing the actual optical mechanism plainly, and abandoning the terminology entirely in technical sales. Expectation rather than performance is what fails these evaluations.
Market Impact: Components hold 58% of value

Recording Material Supply Is Concentrated in Very Few Hands

Volume holographic optical element production depends on photopolymer recording films produced by a small number of chemical suppliers, and practical alternatives are limited for automotive-qualified applications. The root cause is that the material chemistry is difficult and the qualified volume is not yet large enough to attract additional entrants. Commercially this leaves component makers exposed on a single input they cannot readily substitute. Mitigation runs through long-term supply agreements, qualification of alternative chemistries in parallel and holding strategic inventory against automotive programme commitments. Requalification during a live production programme is not practical for anybody.
Market Impact: Replaces 34% within three years
3 additional market trends, 4 additional growth drivers, and 2 additional restraints and challenges are covered in the full report. Contact sales@marketmindsadvisory.com to access the complete intelligence.

Segment CAGR and Growth Architecture

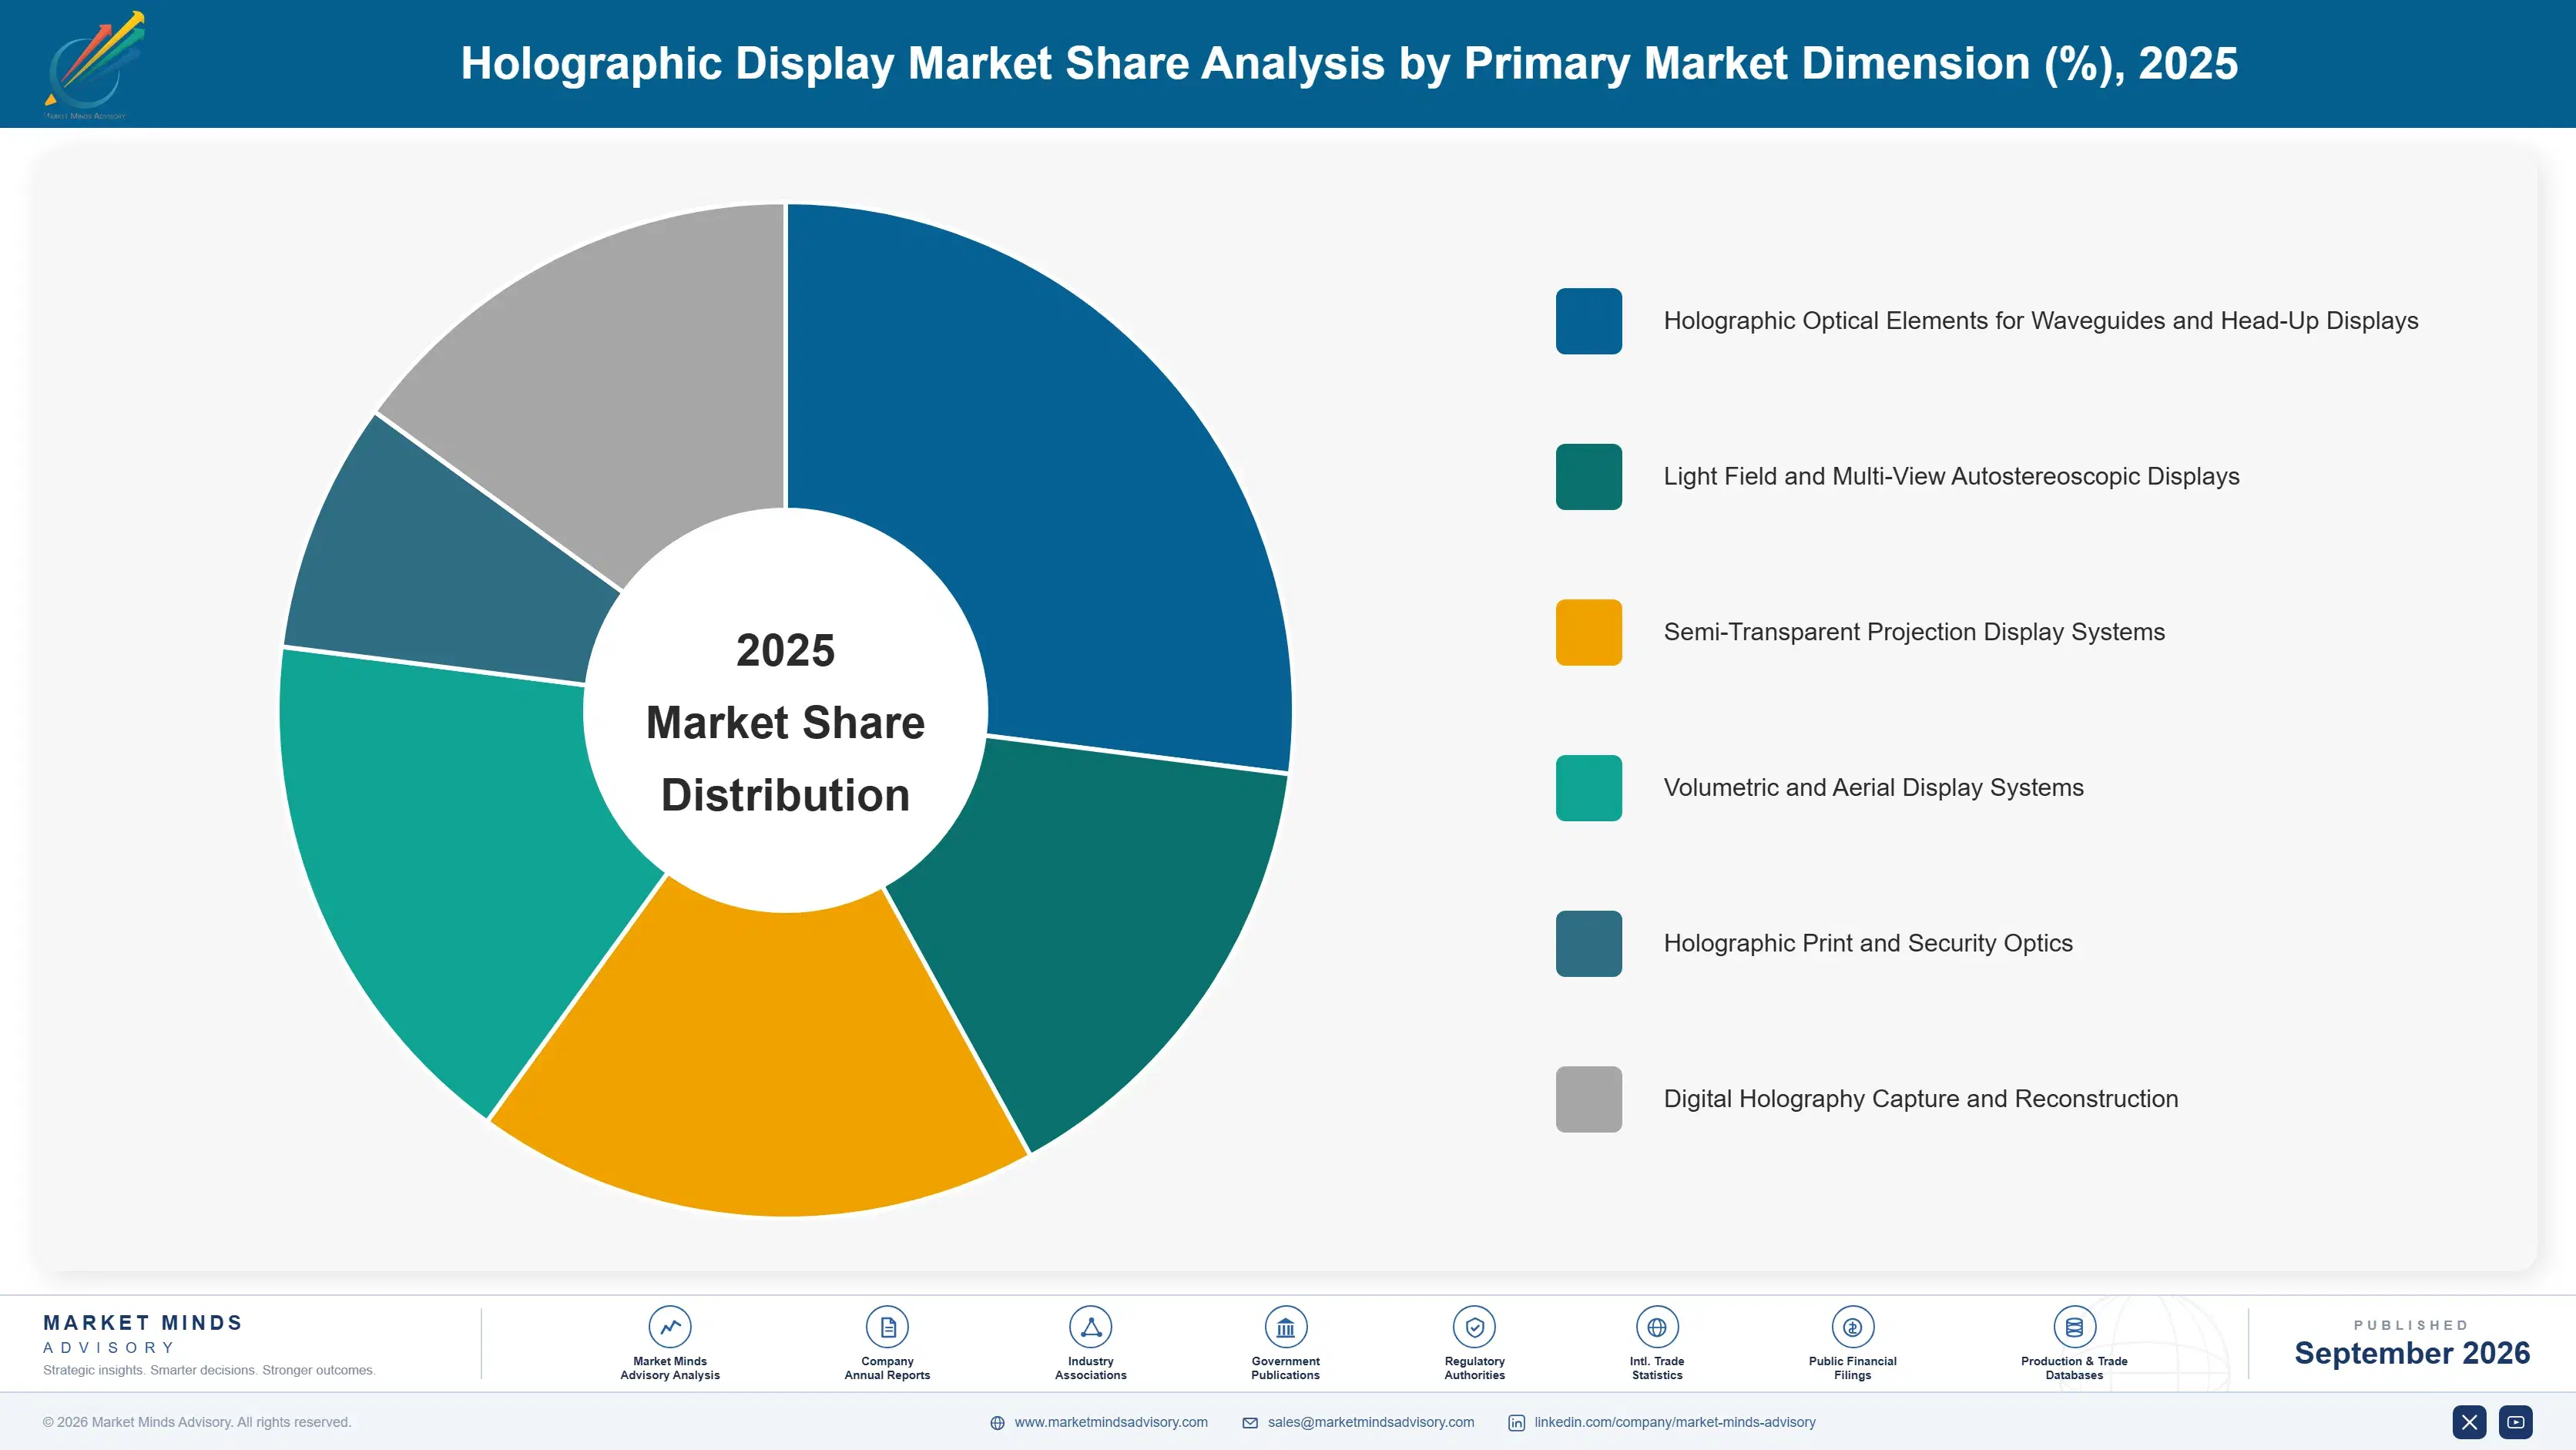
Segmentation follows the optical technique, because each one addresses a different problem and reaches a different buyer. Components sold into other products behave nothing like displays sold as products, and the two have almost no customers, channels or competitive dynamics in common despite sharing a category name. Aggregate rankings are somewhat artificial as a result.
holographic-display-market-market-share-analysis-1788421769350

Holographic Optical Elements for Waveguides and Head-Up Displays

This is the commercial centre of the market at 58% of value, growing at 23.1%, half again the market rate of 15.4%, and it is not a display business at all. Recorded diffraction structures steer and combine light with efficiency conventional optics cannot approach, which is what makes a windscreen projection readable in daylight or an augmented reality waveguide wearable. Elements cost around USD 46 in automotive volumes and are specified by tier one suppliers against optical tolerances rather than chosen for any visual effect. Demand tracks vehicle fitment rates and eyewear programme decisions, both of which are determined entirely outside this industry. Qualification cycles take years and hold a platform position afterwards.
CAGR 23.1%

Light Field and Multi-View Autostereoscopic Displays

Light field displays present multiple viewing angles so several observers perceive depth without eyewear, which is genuinely useful in design review, medical planning and scientific visualisation where depth carries information rather than atmosphere. Growth at 18.4% comes from those professional applications rather than from any consumer adoption, which has repeatedly failed on resolution trade-offs and viewing angle limits. Users in medical and engineering settings accept constraints and prices many times consumer display levels because the alternative is mentally reconstructing three dimensions from flat imagery. Volumes stay small, margins stay high, and the buyer evaluates the decision being improved rather than the display. Applications engineering per customer is expensive and creates genuine attachment.
CAGR 18.4%
Full segment breakdown across 6 segments available in the complete report.

Regional Architecture and Country Demand Map

Demand concentrates where displays, optical films and vehicle electronics are manufactured, since most of this market is a component sold into something else. Consumption geography matters far less than production geography, which is unusual even among component markets. Design authority and production sit apart. Manufacture decides the shares.

East Asia

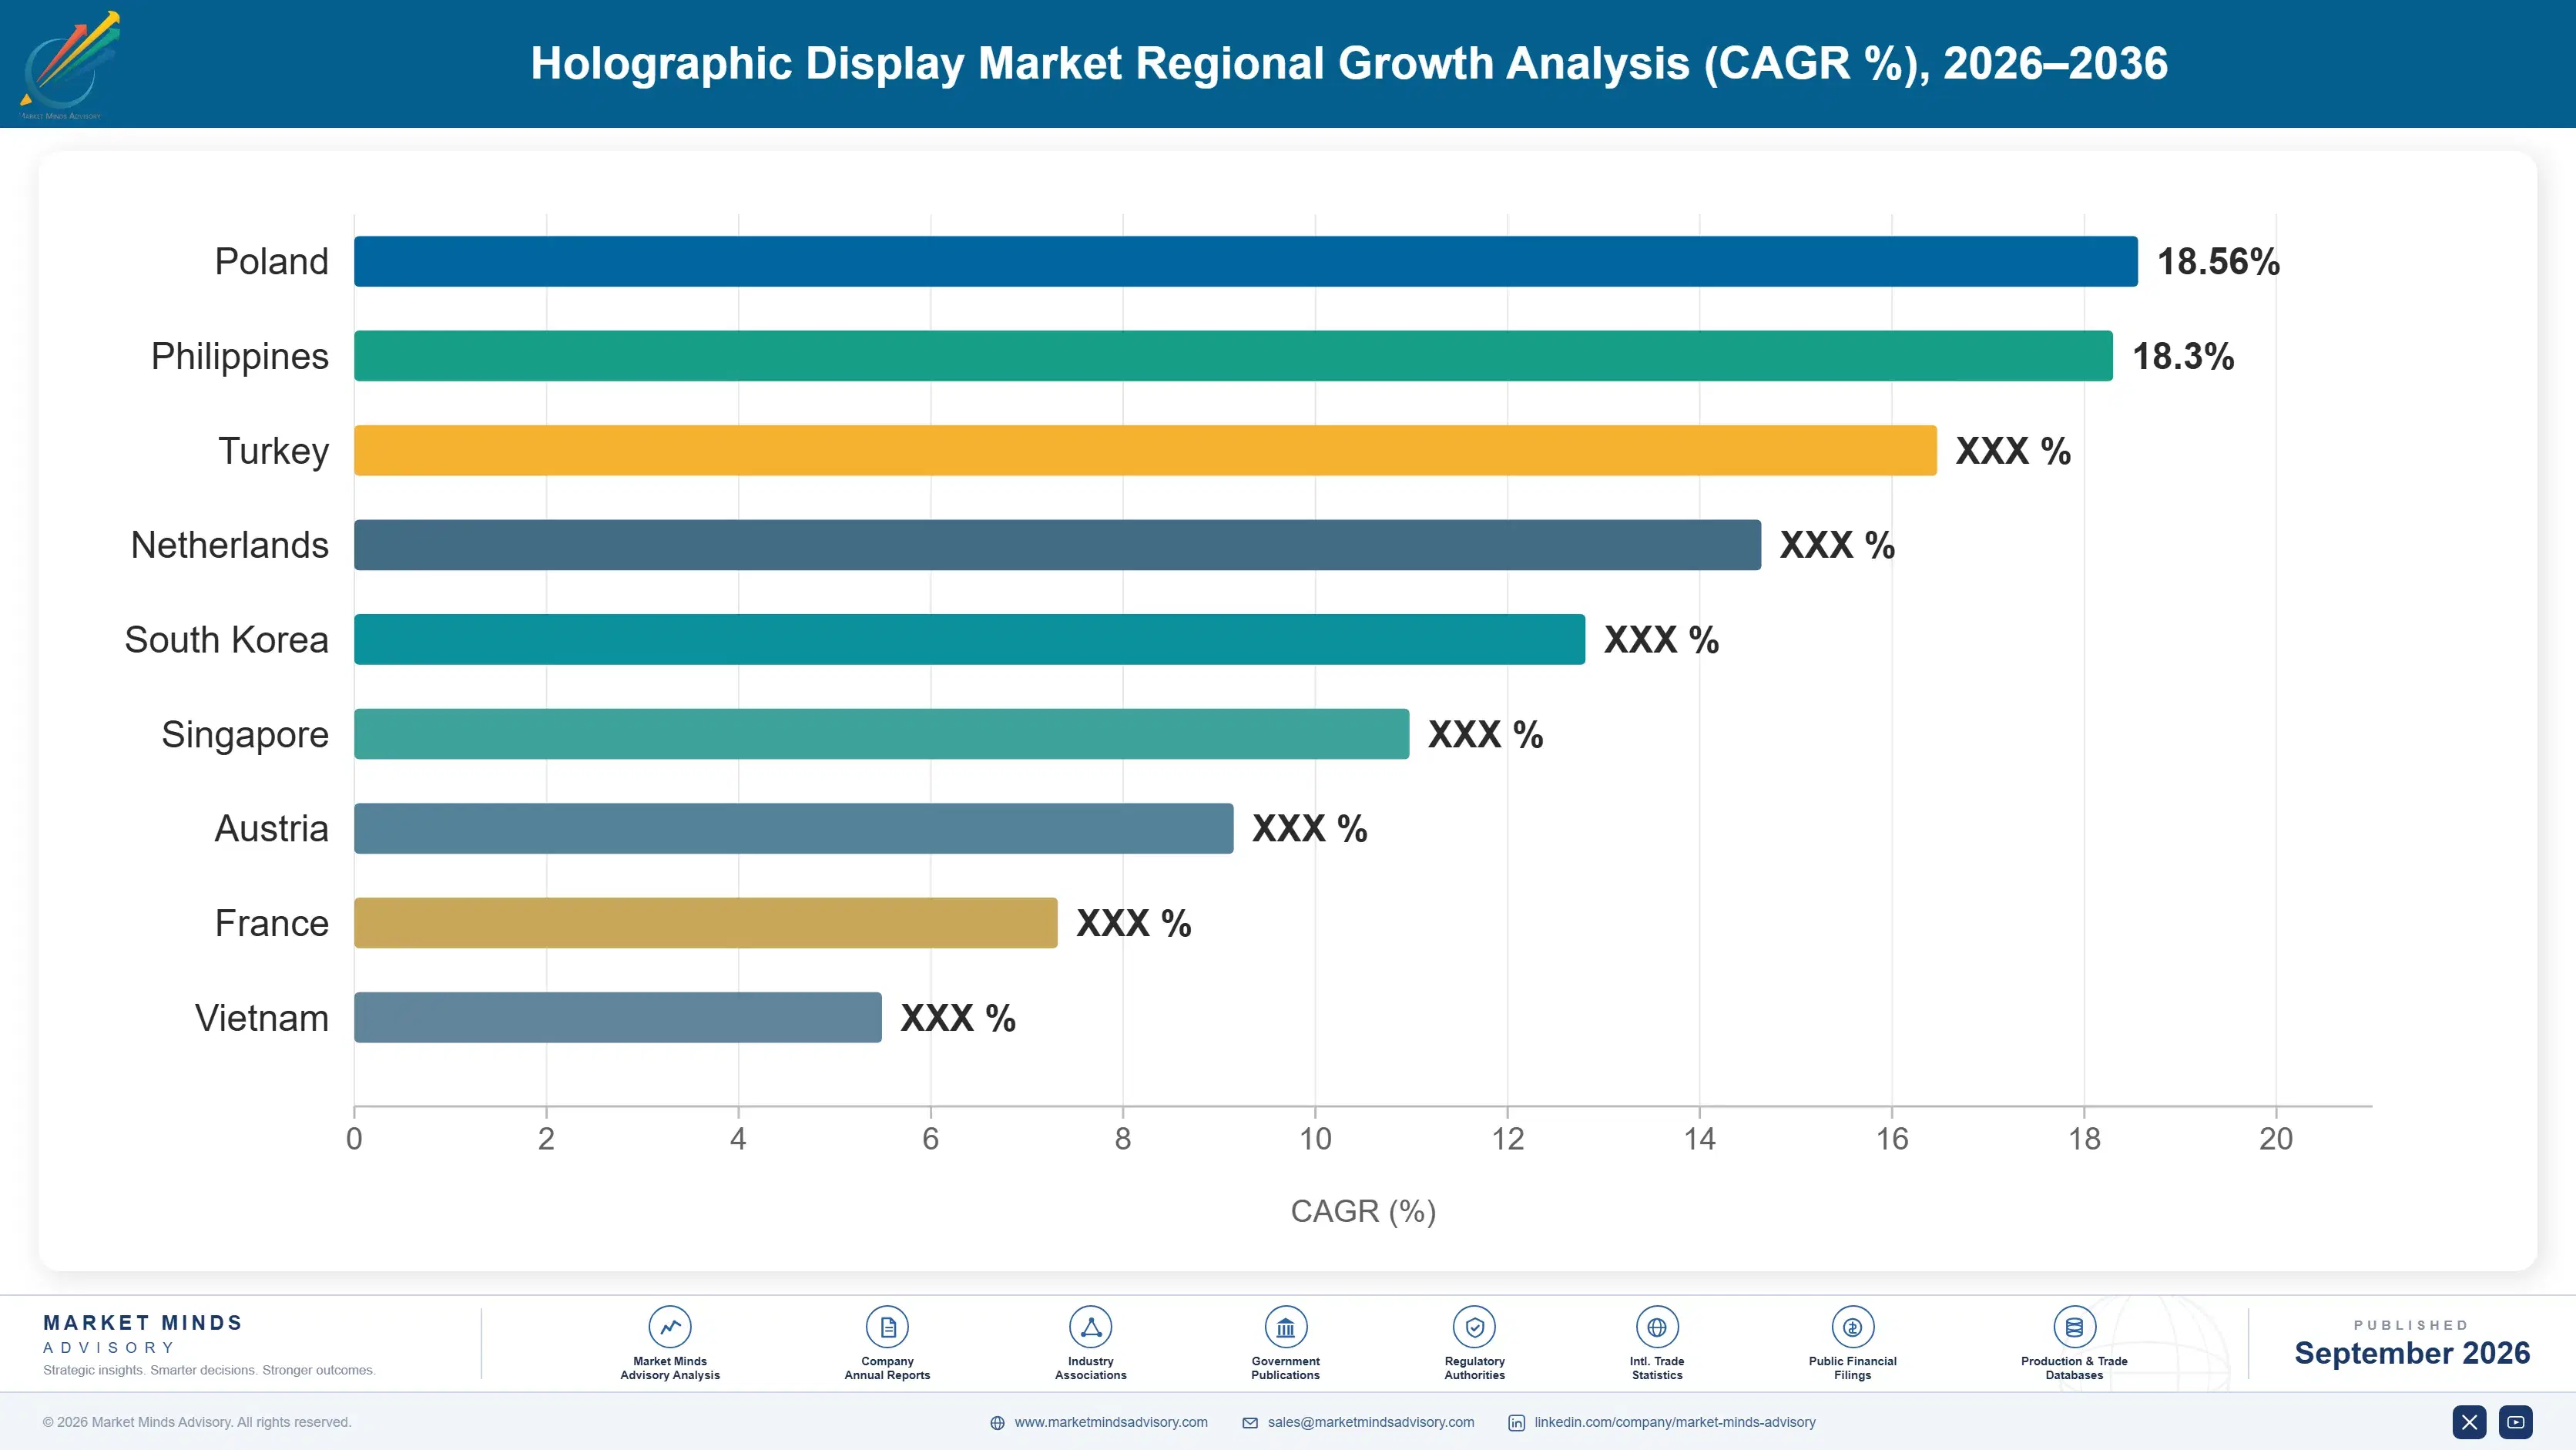
East Asia holds 42%, above the regional band, because displays, optical films and vehicle electronics are all manufactured here and this market is largely a component sold into those products. Chinese electric vehicle platforms have adopted large windscreen head-up displays as an expected feature rather than a luxury option, making China the fastest-growing country market at 20.2%. Korean and Japanese display manufacturers supply light field and autostereoscopic panels globally. Taiwanese optical component production serves waveguide programmes for eyewear manufacturers worldwide. Regional growth at 16.6% is driven almost entirely by automotive fitment rather than by any display application. Regional growth at 16.6% therefore tracks vehicle programme decisions rather than anything happening in display technology.
Share: 42% | CAGR: 16.6% (2026 to 2036)

North America

American demand is concentrated in augmented reality eyewear development, defence visualisation and medical applications, all of which pay well and buy in modest volumes. Eyewear programmes here specify waveguide performance and then manufacture elsewhere, which places design authority in the region and production outside it. Medical imaging and surgical planning are the clearest commercial applications for genuine light field reconstruction. Retail and event installation demand has declined sharply as operators measured results against conventional screens. Defence programmes buy volumetric and head-mounted visualisation at prices no commercial buyer would consider at all. Regional growth at 14.6% reflects design authority and specialist applications rather than any manufacturing volume, which sits elsewhere entirely.
Share: 22% | CAGR: 14.6% (2026 to 2036)
Regional intelligence for 5 additional markets available in the complete report: Western Europe, South Asia and Pacific, Latin America, Middle East and Africa, Eastern Europe. Contact sales@marketmindsadvisory.com.
holographic-display-market-country-cagr-analysis-1788421769869

Where This Category Actually Earns

The display half of this market is competing against ordinary screens and losing, while the component half is growing on automotive volume that has nothing to do with anybody finding holography interesting. Value follows optical performance specified to a tolerance rather than any visual effect described in marketing. Marketing language has never sold an optical element.

Sell Optical Performance Into Automotive Qualification

Holographic optical elements are specified by tier one suppliers against efficiency, uniformity, temperature stability and durability requirements, not chosen for appearance. Suppliers passing automotive qualification hold positions for the life of a vehicle platform, typically 6 years, at around USD 46 per element with volumes set by build rates. Qualification takes years and displaces nobody who already passed it. This is a component business with component discipline, and suppliers approaching it with display industry habits consistently fail the qualification rather than the technology assessment. Component discipline is what wins these awards.
Market Impact: Holds positions across a full 6 year platform

Secure Recording Material Supply Contractually and Early

Volume element production depends on photopolymer films from roughly 2 qualified suppliers, and automotive programmes cannot tolerate an interruption once a platform is in production. Component makers with multi-year supply agreements and qualified alternative chemistries can commit to programme volumes that competitors must decline. Material is a modest share of element cost and an absolute constraint on shipping anything. Treating it as procurement rather than as a strategic dependency has cost several component makers programme awards they were otherwise well placed to win. Supply assurance is now part of the bid itself.
Market Impact: Depends on only 2 qualified photopolymer film suppliers

Concentrate Display Products on Decision-Critical Uses

Retail and event installations are replaced by conventional screens 34% of the time within three years because a bright ordinary display achieves the same commercial result more cheaply. Medical planning, design review and scientific visualisation are different, since perceiving depth changes the decision being made and users accept prices running 12 times consumer levels. Suppliers concentrating there hold margins the experiential market cannot support. Chasing retail volume has consumed more capital in this category than any technical difficulty ever has. Margins in professional applications are several times experiential ones. Capital chasing retail volume has been lost repeatedly.
Market Impact: Sustains 12 times the consumer display price level

Describe the Optics Plainly and Drop the Terminology

Only about 6% of products here reconstruct a wavefront, and buyers arriving with expectations set by the category name evaluate against something no supplier can deliver. Suppliers describing the actual optical mechanism, demonstrating in person early and abandoning the language in technical discussions convert evaluations at roughly twice the rate of those leaning on it. The terminology attracts inbound interest and destroys the resulting conversation. Trading a wider funnel for a qualified one is uncomfortable and it is what the conversion data supports. A wider funnel of unqualified interest is worth very little.
Market Impact: Doubles conversion against the 6% underlying reality here

Who Controls the Margin Pool

Concentration is low at roughly 31% across the top five on measured component and system revenue, and the number describes two fields that barely interact. Optical materials and component makers supply automotive and eyewear manufacturers against technical specifications. Display product companies sell finished systems into professional visualisation and experiential applications. They share a category name, almost no customers, and entirely different dynamics.
Competition runs on three dimensions. Automotive qualification standing is first among component suppliers, since passing it takes years and holds a platform position for the vehicle's life. Second is recording material access, which limits who can commit to volume programmes at all. Third is application depth in medical and design visualisation for display makers, where the buyer evaluates whether a decision improves rather than how the image looks.

Two pressures are reshaping the field. Automotive component demand is pulling the category toward tier one supply relationships and away from display product businesses, and the two require completely different organisations. Meanwhile experiential and retail demand continues declining as operators measure results honestly. Rankings will move toward suppliers holding automotive qualification and material supply, and away from those built around finished display products for commercial venues.
holographic-display-market-company-positioning-matrix-1788421770393

Competitive Moat and Risk Dimensions

COVESTRO

Moat: Photopolymer recording material position

Covestro produces the photopolymer film that volume holographic element production depends on, in a chemistry that very few suppliers have qualified for automotive use. That places it upstream of every component maker serving vehicle and eyewear programmes, with a position that scales as those programmes grow. Long qualification cycles protect the supply relationship beyond any product generation.
COVESTRO

Risk: Narrow application concentration

The material position depends on holographic optical elements remaining the preferred approach for waveguides and head-up displays, and alternative optical architectures continue to be developed by well-funded competitors. Demand also concentrates in automotive fitment decisions the company does not influence. As volumes grow, other chemical suppliers will find qualification worthwhile, eroding a position protected mainly by market size.
ENVISICS

Moat: Automotive holographic display qualification

Envisics developed holographic head-up display technology specifically for automotive programmes and passed the qualification cycles that exclude most optical companies from vehicle supply. Platform awards hold for the life of a model, typically several years, producing revenue visibility that display product companies never achieve. Working directly with vehicle manufacturers gives it influence over specification unusually early.
ENVISICS

Risk: Automotive programme concentration

Revenue depends on a limited number of vehicle platforms whose volumes are set by manufacturers rather than by anything the company controls, and a cancelled or delayed programme removes years of expected shipments. Fitment could also plateau if manufacturers conclude the feature does not influence purchases. Diversifying into eyewear waveguides means competing against suppliers serving that application far longer.

Players Tracked

Prominent Players

Covestro
Envisics
DigiLens
Sony
Leia

Other Key Players

Luminit
Looking Glass Factory
Light Field Lab
Voxon Photonics
Realfiction
HOLOEYE Photonics
Continental
Nippon Seiki
Denso
Panasonic
BOE Technology Group
Samsung Display
LG Display
Vuzix
Kopin

Recent Developments

APRIL 2025

Chinese vehicle platforms extend large windscreen head-up display fitment

Several Chinese electric vehicle manufacturers adopted large-area windscreen projection displays across mid-market models rather than restricting them to premium trims. The change was a specification decision on new platforms rather than any acquisition or supply arrangement involving optical component makers. Element volumes rose sharply with each platform launch.
Signal: Component demand now tracks vehicle fitment decisions made entirely outside this display industry's influence or forecasting.
SEPTEMBER 2025

Retail operators replace projection installations with conventional displays

Large retail and hospitality operators removed semi-transparent projection installations in favour of conventional bright screens, citing measured customer dwell time, maintenance burden and ambient lighting constraints. The replacements were routine estate decisions rather than any change in supplier relationships. Suppliers were not consulted before removal in most cases.
Signal: Novelty produced attention once and never produced it twice, which was always a difficult basis for repeat business.
JANUARY 2025

Photopolymer suppliers expand automotive-qualified recording material capacity

Recording material producers expanded capacity for automotive-qualified photopolymer films in response to head-up display programme commitments extending several years forward. The expansions were organic capacity investments rather than acquisitions, and qualification cycles remained lengthy for any new entrant. Component makers competed for the committed capacity.
Signal: Material supply rather than optical design has become the practical constraint on committing to volume programmes.

What These Optics Cost to Produce

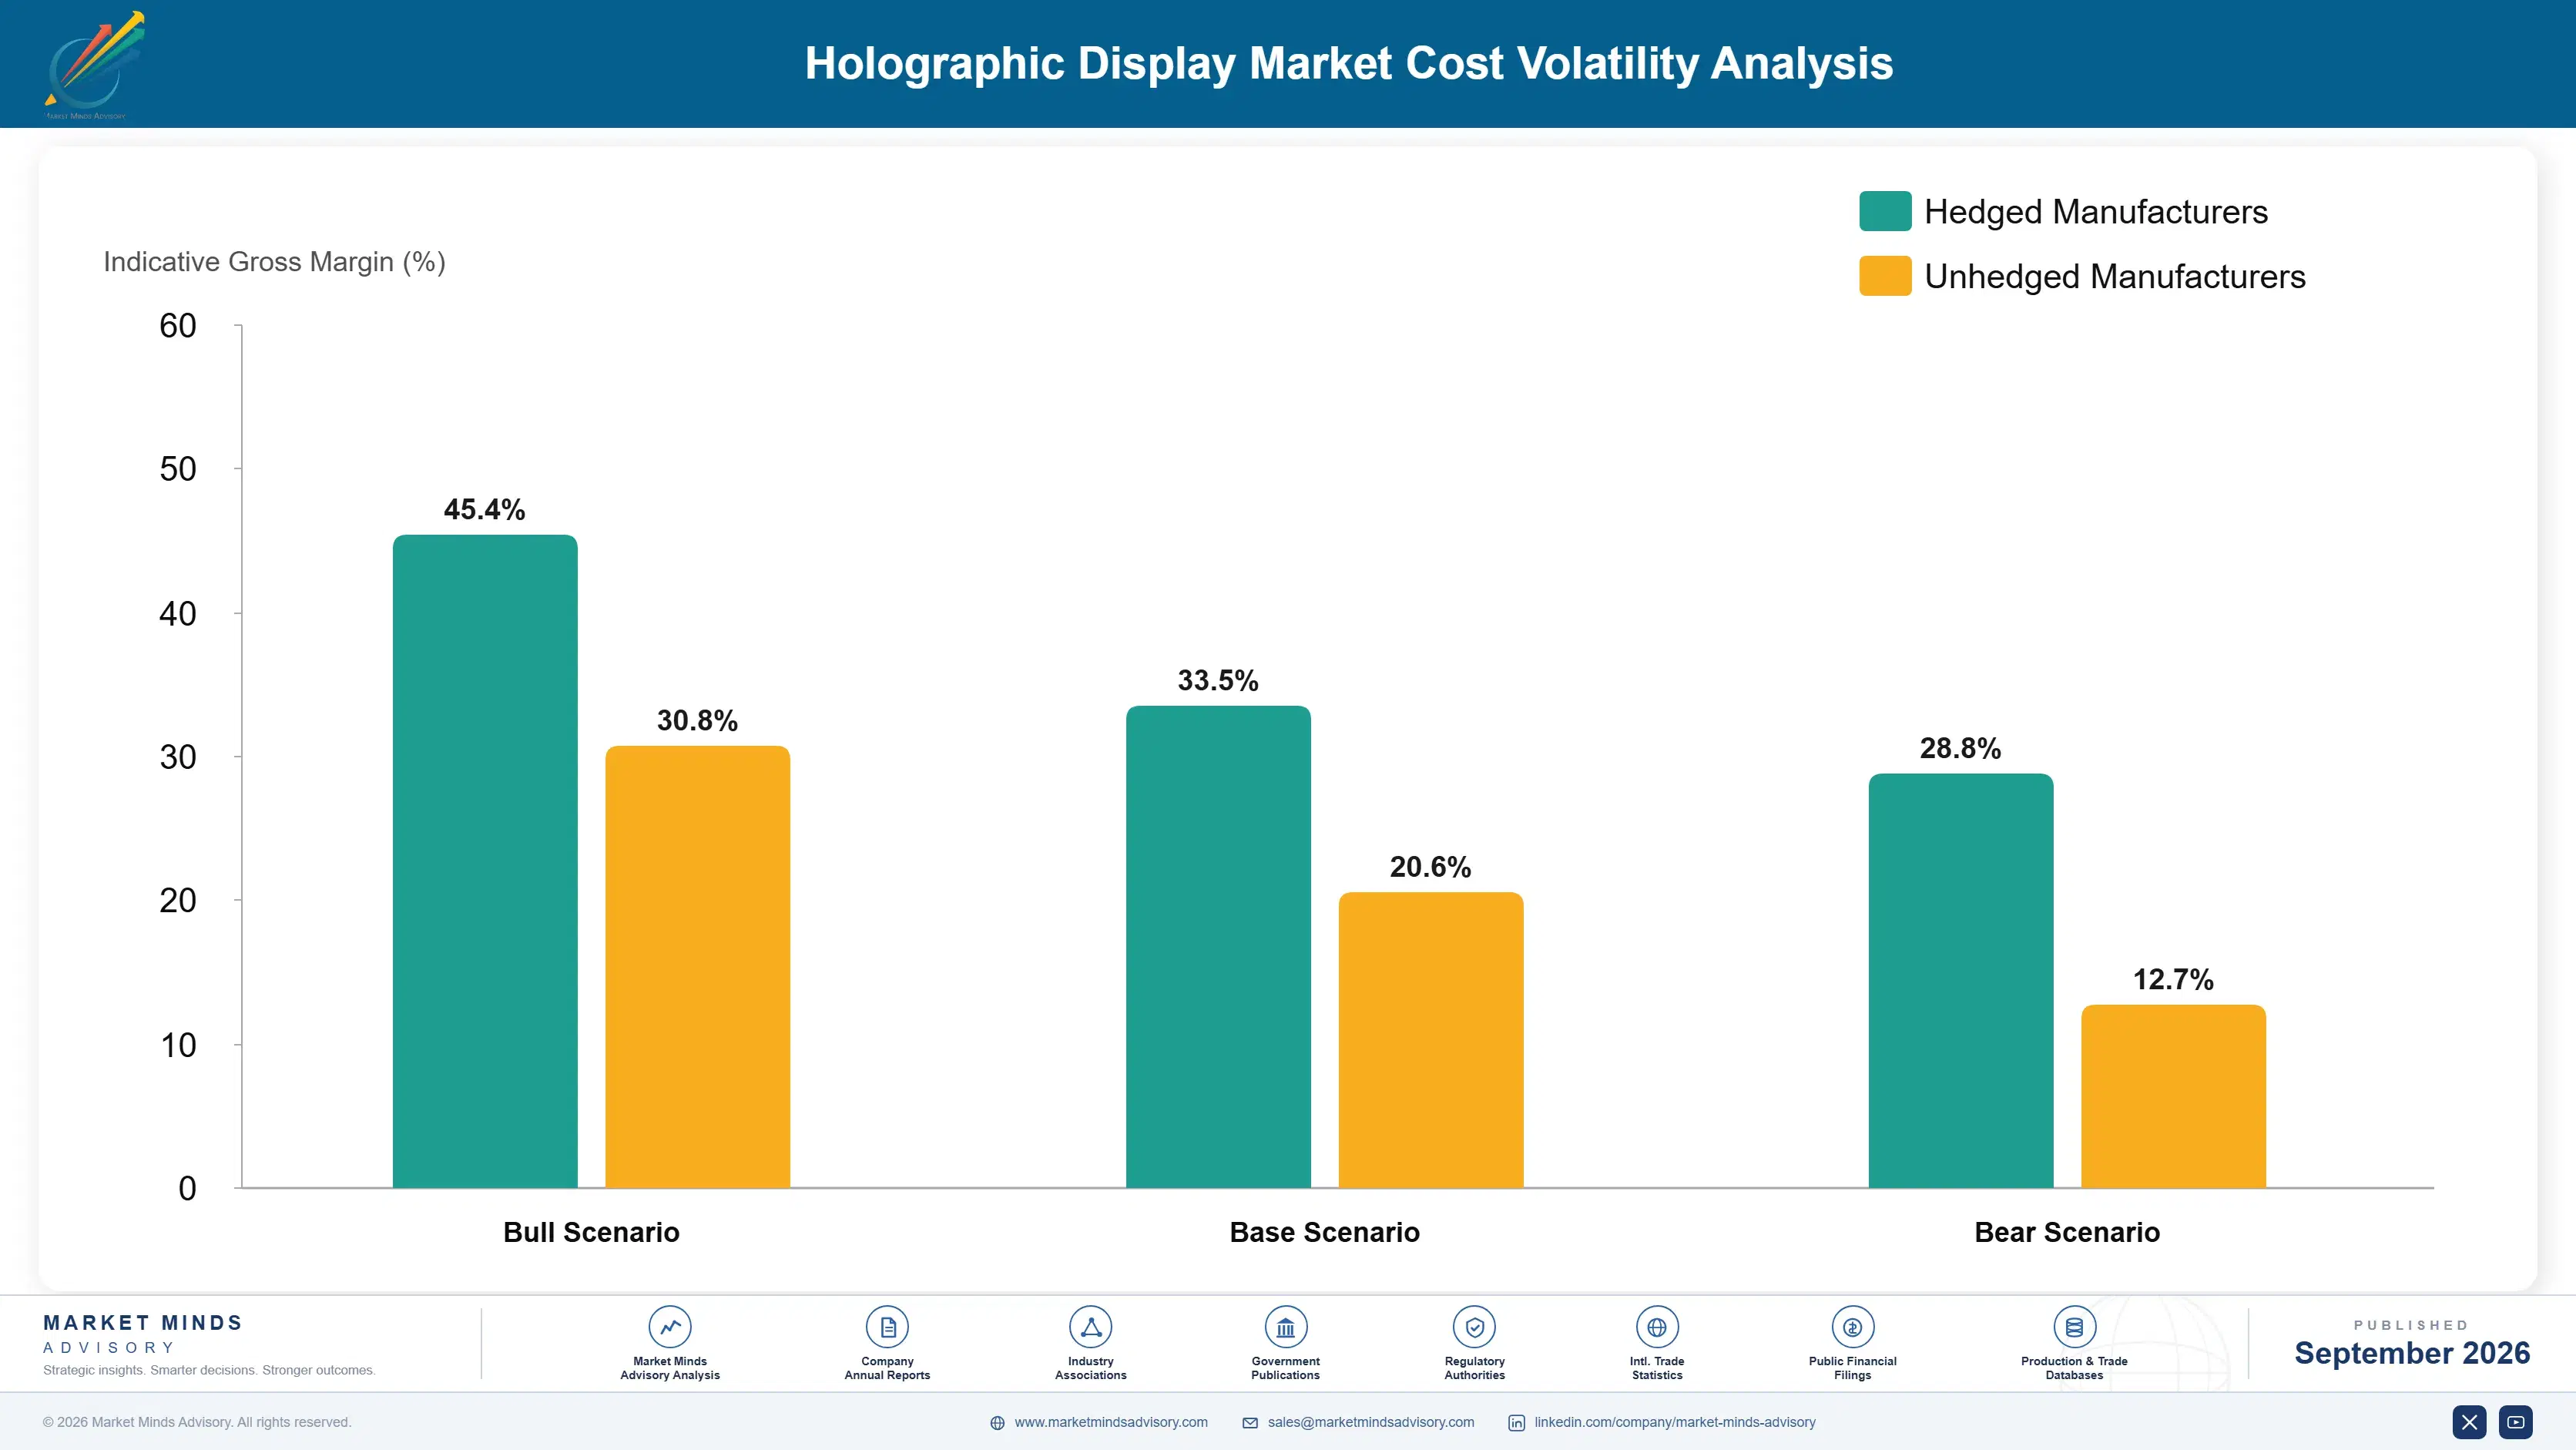
Cost structure for optical elements is dominated by process rather than by material. Recording photopolymer film runs between 17% and 26% of cost of goods depending on element area and layer count. Mastering and recording equipment amortisation adds roughly 21%, cleanroom replication and lamination 24%, optical inspection and qualification testing 19%, and handling the balance. Display systems have a different structure dominated by purchased panels and optics.
Recording material supply has been the sharpest pressure and it is a concentration problem rather than a price one. Automotive-qualified photopolymer comes from roughly two suppliers, and programme commitments extending years forward absorbed capacity faster than expansion added it. Covestro referenced specialty materials demand conditions in recent annual reporting. Component makers without contracted supply have declined programme opportunities they were otherwise well placed to win.

Exposure varies by position rather than by scale. Component makers buying recording material carry concentration risk directly and cannot substitute quickly. Material producers hold the upstream position and depend on element demand they do not control. Display system makers avoid the material question and carry panel costs shared with the wider display industry. Small component makers lack both contracted supply and the volume to justify qualification effort.
holographic-display-market-cost-volatility-analysis-1788421770588

Contract recording material against programme commitments

Automotive programmes run for years and cannot tolerate an interrupted supply once production begins, while recording material comes from very few qualified sources. Contracting volume against committed awards secures the input and demonstrates assurance during the award process. It carries commitment risk if a programme is cancelled, which is smaller than winning an award that cannot be supplied.

Automate optical inspection before scaling volume

Inspection and qualification testing is roughly 19% of element cost and scales poorly with manual methods, since every element must be verified against efficiency and uniformity tolerances. Automated inspection with recorded measurement data cuts that cost around 45% and produces the traceability customers require. The investment pays only at volume, which makes it a commitment ahead of demand.

Qualify alternative recording chemistries in parallel

Depending on a single qualified photopolymer leaves a component maker unable to respond if supply or terms change, and requalification during a production programme is not practical. Running an alternative chemistry through qualification alongside the primary costs engineering effort and creates negotiating position. Few do it, since the effort is visible and the benefit appears only if something goes wrong.

Portfolio Architecture for Margin Defence

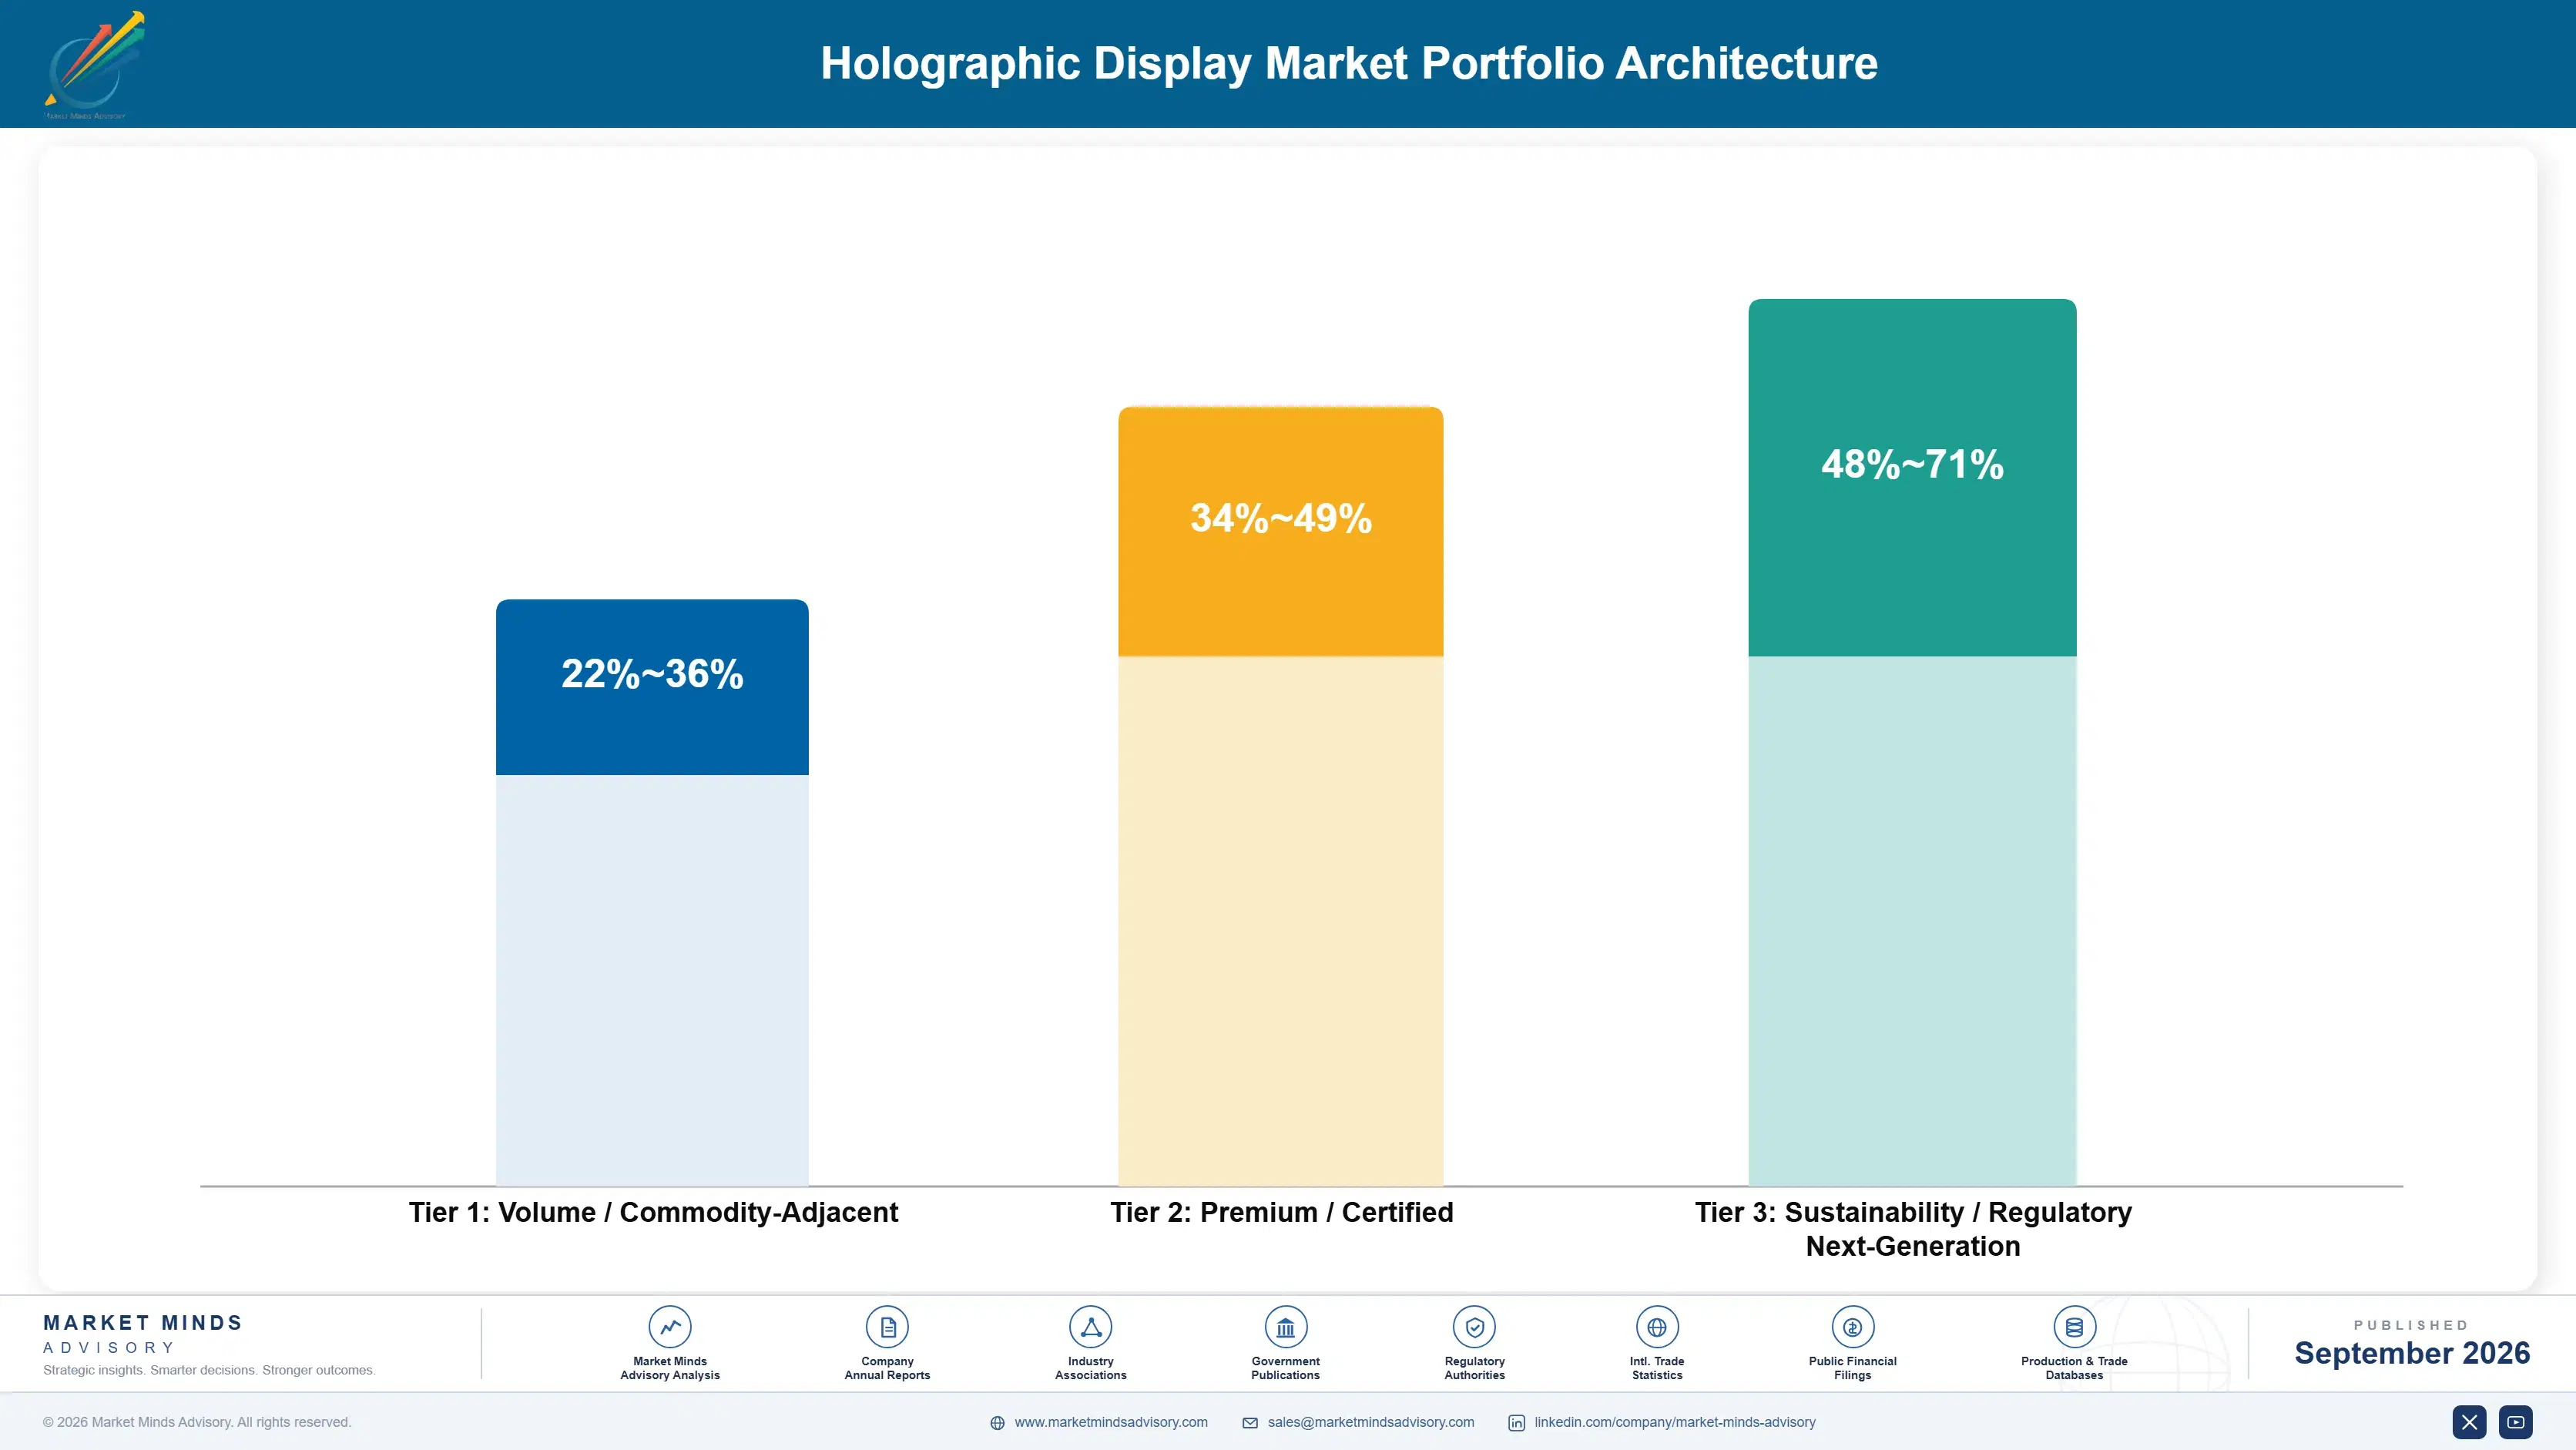
Margin architecture separates sharply between components and finished displays. Optical elements sold into automotive programmes earn respectable component margins protected by qualification barriers, and volumes are set by vehicle build rates rather than by anything the supplier does. Finished display systems earn well in professional visualisation and poorly in experiential applications, where they compete against conventional screens that cost less and need less attention.
The volume tension is between automotive component volume and professional display margin. Automotive elements ship in millions at around USD 46 each and fill production capacity, with revenue visibility across a platform life. Professional light field displays ship in hundreds at prices many times higher and require applications engineering per customer. Few organisations do both well, since component discipline and application selling differ completely.

High-value revenue concentrates in automotive-qualified optical elements and in professional visualisation displays where depth changes a decision. Both share the property that the buyer is solving a specific problem rather than seeking a visual effect. Experiential and retail display systems occupy a declining position, generate most of the industry's public visibility, and are being replaced by ordinary screens at a rate suppliers rarely mention.

Volume / Commodity-Adjacent

Semi-transparent projection systems and experiential display fixtures sold into retail, events and attractions. The wide range separates bespoke experiential work from catalogue products competing against conventional screens. Demand is declining and replacement with ordinary displays is common within three years.
Gross Margin: 22-36%

Premium / Certified

Holographic optical elements qualified into automotive head-up display and waveguide programmes. Margin is protected by qualification barriers that take years to clear rather than by pricing power. Volumes follow vehicle build and fitment rates, which the supplier does not influence at all.
Gross Margin: 34-49%

Sustainability / Regulatory / Next-Generation

Light field and volumetric displays for medical, design and scientific visualisation, plus recording material supply. The widest range in the portfolio, spanning materials with near-zero marginal cost and display systems needing applications engineering. Highest margin and smallest volumes anywhere here.
Gross Margin: 48-71%
holographic-display-market-portfolio-architecture-1788421771082

High-value Sub-segments and Strategic Watch-out

Automotive Qualified Optical Elements

High value and high growth together, at 58% of market value and rising with head-up display fitment across mid-market vehicles. The margin range reflects element complexity and recording area. Qualification takes years and holds a platform position for the vehicle's life, which makes displacement genuinely difficult once won.
Gross Margin: 34-48%

Professional Visualisation Displays

High value with steady growth, sold where perceiving depth changes a clinical or engineering decision rather than improving a presentation. The range reflects applications engineering content per customer. Buyers accept prices many times consumer levels and tolerate viewing constraints that no consumer application would ever accept.
Gross Margin: 52-71%

Experiential Display Systems

The declining part of the market and still the most publicly visible, replaced by conventional screens in roughly a third of installations within three years. It generated the category's name recognition and most of its accumulated misunderstanding. Suppliers built around it are contracting whatever they say about pipeline.
Gross Margin: 21-35%

Photopolymer Material Supply

The strategic watch-out for component makers, carried at zero because it represents an upstream dependency rather than addressable revenue. Automotive-qualified film comes from very few suppliers and cannot be substituted quickly. Component makers treating it as routine procurement have lost programme awards they were otherwise placed to win.
Gross Margin: 0-0%

How This Demand Recurs

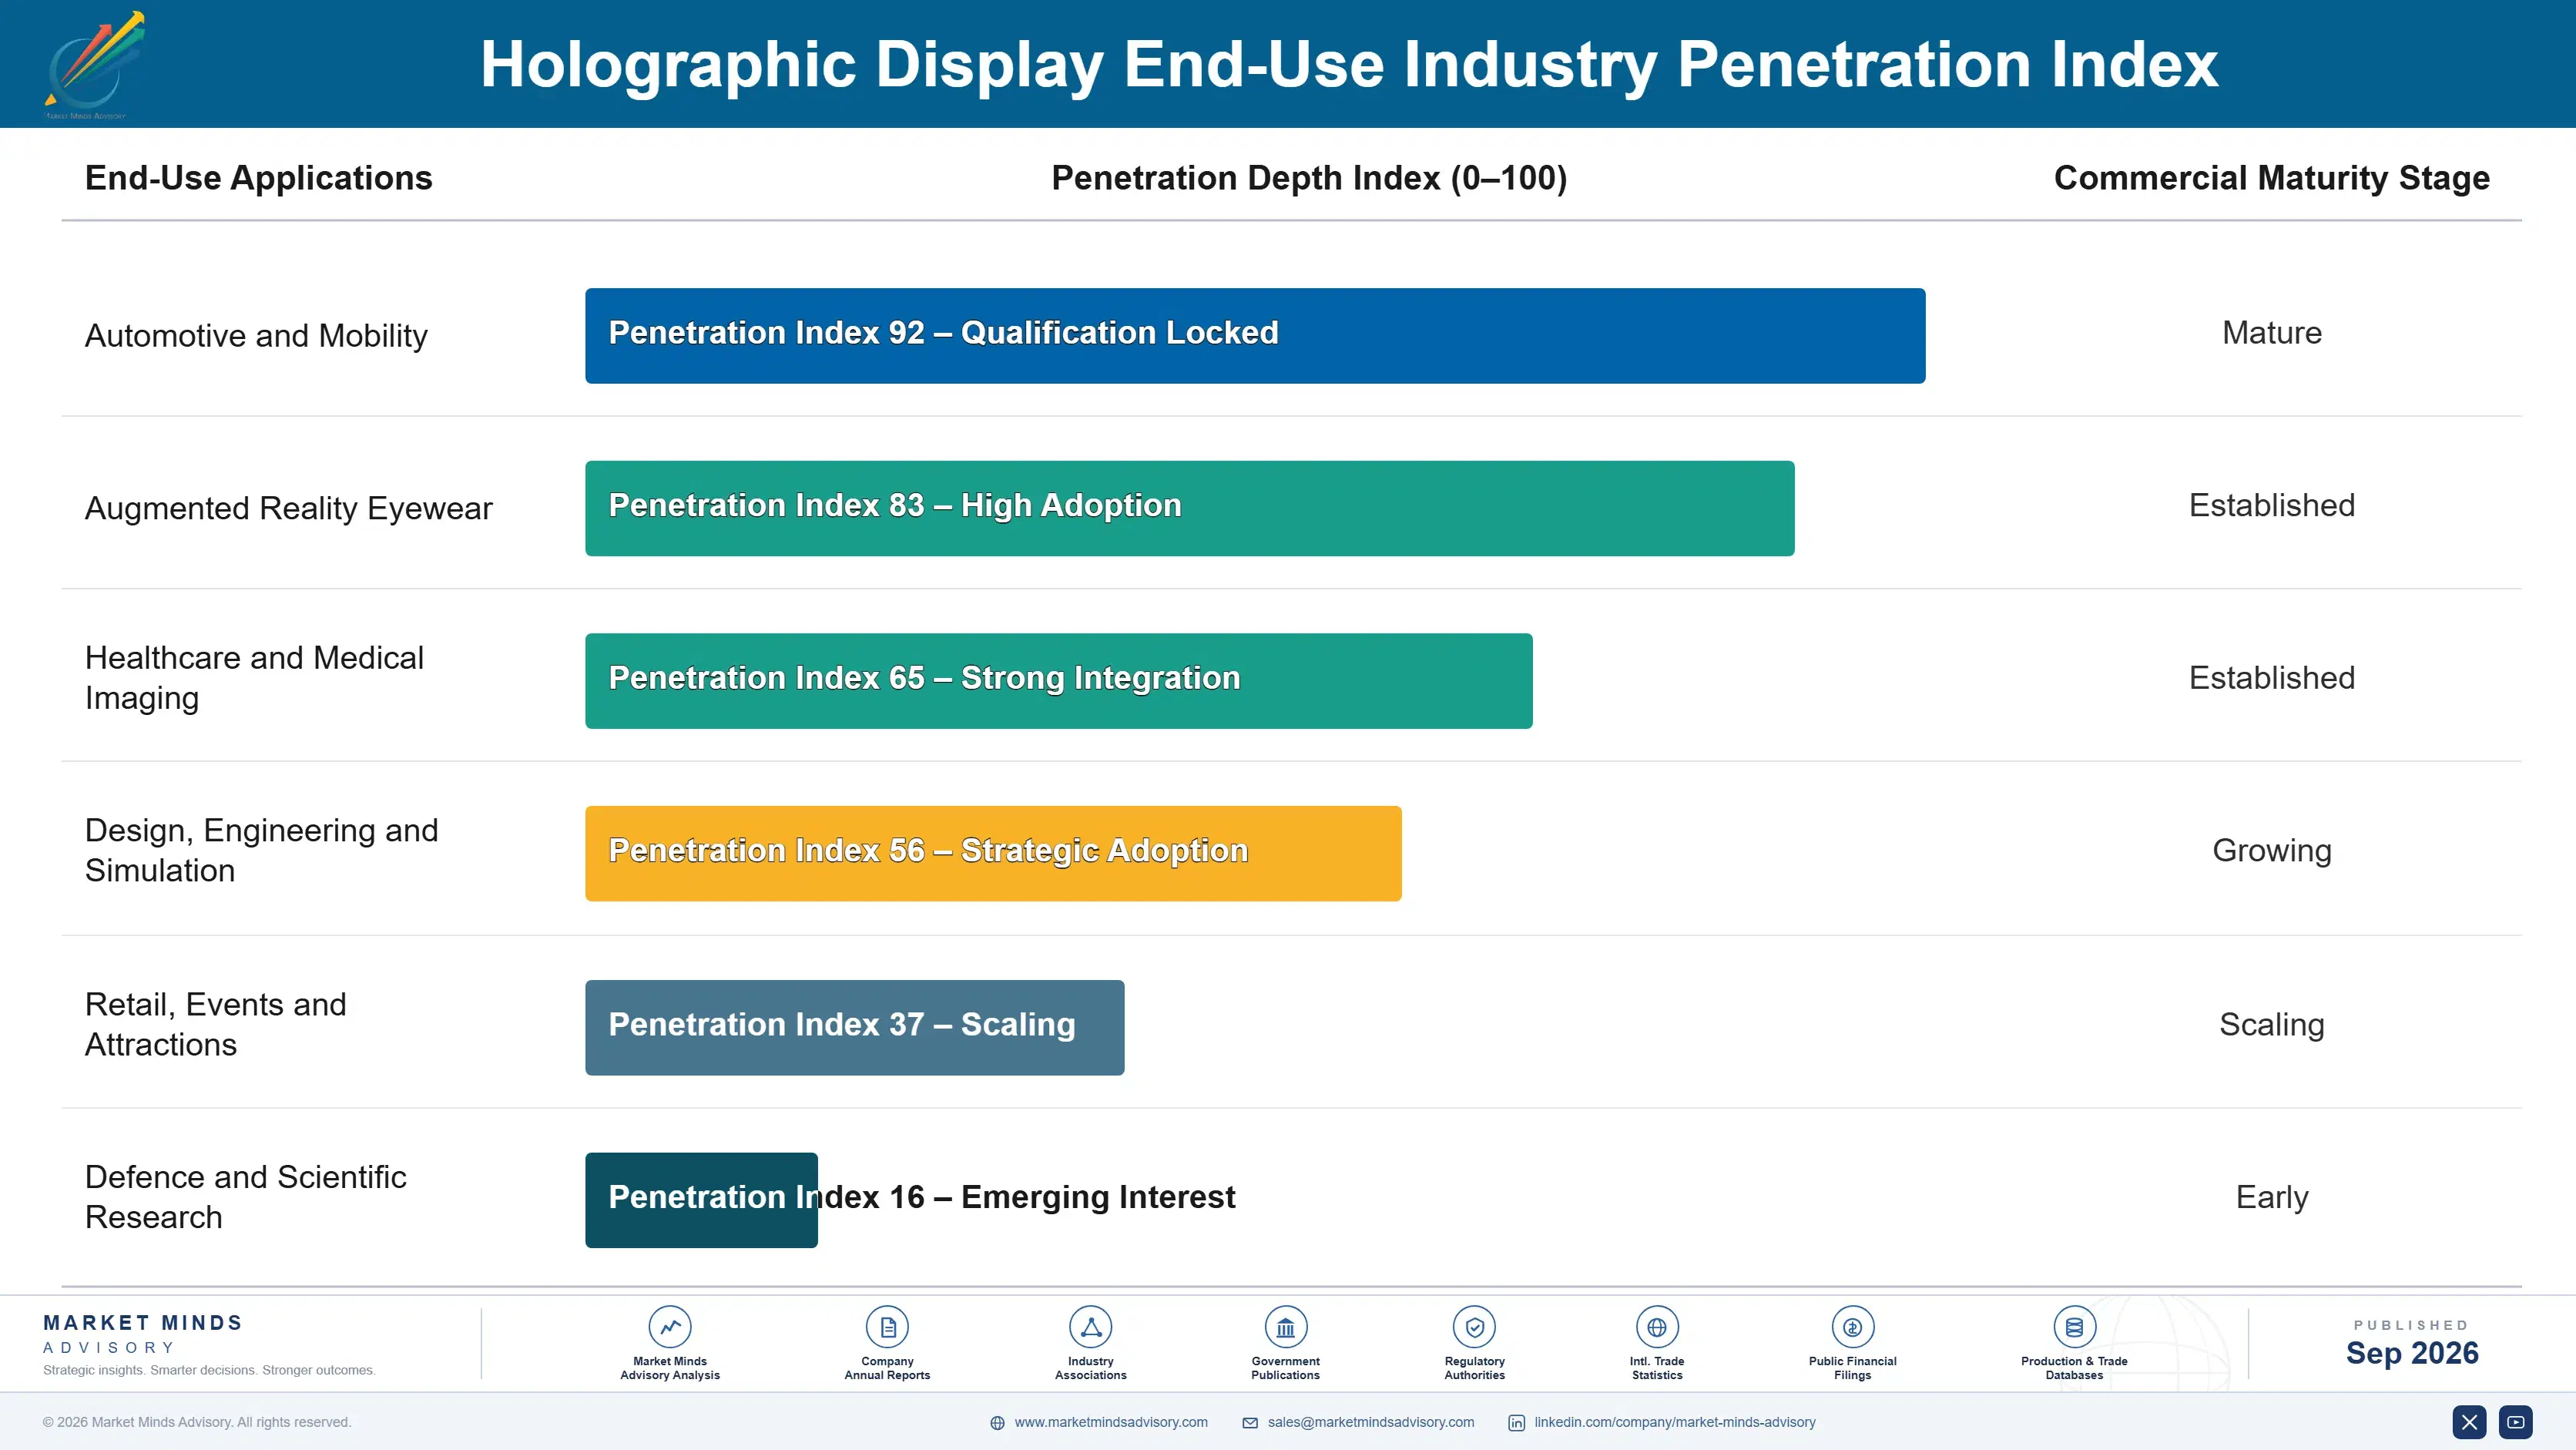
Recurrence differs completely between the two halves of this market. Automotive optical elements ship continuously for the life of a vehicle platform, typically six years, at volumes set by build rates the supplier neither influences nor forecasts. Professional displays sell once to a department and replace on a long refresh cycle. Experiential installations sold as capital projects are being removed rather than replaced, which is the opposite of recurrence.
Adoption depth varies by application in ways that determine everything. Automotive customers embed the element and never think about it again, which suits a component supplier. Medical and engineering users engage deeply and demand applications support, which creates genuine attachment. Eyewear manufacturers evaluate waveguide options intensively and then commit for a product generation. Retail operators used installations lightly and removed them when the novelty passed.

The buyer has moved from marketing toward engineering, and the two evaluate nothing in common. A decade ago a brand marketing team bought a visual effect and judged it on impression. Today an optical engineer specifies efficiency and uniformity tolerances, and a surgeon or design lead evaluates whether a decision improves. Suppliers selling a visual effect address a buyer who has largely stopped purchasing here.
holographic-display-market-end-use-penetration-index-1788421771569

Where Value Sits Here

These are among the four positions where our research anticipates prominent divergence between winners and laggards over the coming forecast period. Each is grounded in the demand model, the regulatory perimeter, and the announced capacity pipeline.
01 / AUTOMOTIVE QUALIFICATION DISCIPLINE

Win the platform, because it holds for six years

Holographic optical elements are specified by tier one suppliers against efficiency, uniformity and durability tolerances rather than chosen for appearance, and passing automotive qualification holds a platform position for roughly 6 years at around USD 46 per element shipped. Displacing an incumbent afterwards is close to impossible for anybody. Suppliers approaching this with display industry habits fail the qualification process rather than the technology assessment, and they generally do not understand why until it has happened to them more than once.
02 / MATERIAL SUPPLY SECURITY

Contract the photopolymer before bidding for volume

Automotive-qualified recording film comes from roughly 2 suppliers and cannot be substituted quickly, since requalification during a live production programme is not practical for anybody involved. Component makers that hold multi-year supply agreements can commit to programme volumes which competitors must simply decline outright, and they can also demonstrate that supply assurance during the award process itself. Treating material as routine procurement rather than as a strategic dependency has cost several component makers awards they were otherwise well placed to win.
03 / DECISION-CRITICAL APPLICATION FOCUS

Sell where depth changes what somebody decides

Experiential installations are replaced by conventional bright screens in roughly a third of cases within three years, since an ordinary bright display achieves the same commercial result more cheaply and with considerably less maintenance. Medical planning, design review and scientific visualisation are entirely different, since perceiving depth genuinely changes the decision and users accept prices running around 12 times consumer levels. Chasing retail and event volume has consumed more capital in this whole category than any technical difficulty ever has.
04 / TERMINOLOGY DISCIPLINE PRACTICE

Describe the optics, abandon the category word

Only about 6% of products in this category reconstruct an optical wavefront, and buyers arriving with expectations set by the name evaluate against something that no supplier anywhere can actually deliver. Suppliers who describe the real optical mechanism, demonstrate in person early and drop the terminology in technical conversations convert those evaluations at roughly twice the rate. The word attracts inbound interest and then destroys the conversation it attracted, which is a genuinely poor trade at any funnel width whatsoever.

Engagement Snapshot From the Field

A live engagement with an industry participant carrying material or product regulatory and market exposure ahead of a defining policy shift, showing how our research translates into a defensible multi-year portfolio strategy.
MARKET MINDS ADVISORY · CLIENT ENGAGEMENT SUMMARY
Holographic Display Producer Strategic Portfolio Review and Transition Roadmap 2026·Investment Scenario on Holographic Display Exposure Evaluation 2025-26
CLIENT PROFILE
An optical component manufacturer with annual revenue near USD 92 million (client-reported, unverified by MMA), supplying holographic elements to two automotive head-up display programmes and selling light field display systems into design visualisation. Roughly 64% of revenue came from automotive components and the remainder came from finished displays sold to a small professional customer base.
STRATEGIC CHALLENGE
The company had been shortlisted for a third automotive programme requiring volumes roughly double its current output, while its photopolymer supply was contracted only twelve months forward (client-reported, unverified by MMA). Management was simultaneously considering an experiential display product line on the argument that it would diversify away from automotive concentration.
MMA APPROACH
MMA modelled supply requirements against the shortlisted programme rather than against current output, which the company had not done, and assessed qualification exposure across both recording chemistries available to it. We interviewed nine customers, two material suppliers and four experiential display integrators. The proposed experiential product line was evaluated against measured replacement rates in that segment rather than against its stated addressable market.
KEY FINDINGS
  1. Winning the third programme would have exhausted contracted photopolymer supply within seven months of production start, with no committed capacity beyond that point.
  2. The alternative recording chemistry had never been taken through automotive qualification, leaving the company with a single source it could not replace inside a programme.
  3. Experiential integrators reported that around a third of installations were being replaced by conventional screens, and none forecast growth in their own businesses.
  4. Optical inspection was performed manually and would have become the production constraint at the proposed volume well before material supply became the limiting factor at all.
CLIENT PROFILE
An optical component manufacturer with annual revenue near USD 92 million (client-reported, unverified by MMA), supplying holographic elements to two automotive head-up display programmes and selling light field display systems into design visualisation. Roughly 64% of revenue came from automotive components and the remainder came from finished displays sold to a small professional customer base.
STRATEGIC CHALLENGE
The company had been shortlisted for a third automotive programme requiring volumes roughly double its current output, while its photopolymer supply was contracted only twelve months forward (client-reported, unverified by MMA). Management was simultaneously considering an experiential display product line on the argument that it would diversify away from automotive concentration.
MMA APPROACH
MMA modelled supply requirements against the shortlisted programme rather than against current output, which the company had not done, and assessed qualification exposure across both recording chemistries available to it. We interviewed nine customers, two material suppliers and four experiential display integrators. The proposed experiential product line was evaluated against measured replacement rates in that segment rather than against its stated addressable market.
KEY FINDINGS
  1. Winning the third programme would have exhausted contracted photopolymer supply within seven months of production start, with no committed capacity beyond that point.
  2. The alternative recording chemistry had never been taken through automotive qualification, leaving the company with a single source it could not replace inside a programme.
  3. Experiential integrators reported that around a third of installations were being replaced by conventional screens, and none forecast growth in their own businesses.
  4. Optical inspection was performed manually and would have become the production constraint at the proposed volume well before material supply became the limiting factor at all.
RECOMMENDED STRATEGY
Phase 1: Secure multi-year photopolymer supply covering the shortlisted programme volume before submitting a final bid, and present that assurance as part of the submission. Phase 2: Take the alternative recording chemistry through automotive qualification in parallel, accepting the engineering cost in order to remove a genuine single-source dependency. Phase 3: Abandon the experiential display proposal and redirect that investment into automated optical inspection, which is the actual production constraint the company will hit first.
OUTCOME
The company won the third programme with supply assurance cited by the customer as a differentiating factor, and inspection automation removed the throughput constraint before production began (client-reported, unverified by MMA). Alternative chemistry qualification completed fourteen months later. The experiential product line was not pursued.

Frequently Asked Questions

Foundational context covering the market sizes, CAGR, scope, country, region and competition that inform every finding below. This section is provided to cover basics and most often pre-purchase conversations, answered from the MMA Primary Research Dataset.

What is the current size of the Holographic Display Market?

The market was worth USD 1.6 billion in 2025 and reaches USD 1.85 billion in 2026. Optical components for vehicle and eyewear displays account for 58% of that value.

How large will the Holographic Display Market be by 2036?

MMA forecasts USD 7.75 billion by 2036, an expansion of 4.19 times over the forecast period. That represents USD 5.90 billion of incremental annual revenue against 2026.

What is the CAGR for the Holographic Display Market 2026 to 2036?

The base case is 15.4% compound annual growth, with a bull case at 16.6% and a bear case at 14.2%. Whether augmented reality eyewear reaches consumer volume separates the scenarios.

Which segment is growing fastest?

Holographic optical elements for waveguides and head-up displays grow at 23.1%, half again the market rate of 15.4%. Vehicle fitment rather than any display application drives that growth.

Who are the major companies in the Holographic Display Market?

Covestro, Envisics, DigiLens, Sony and Leia lead on measured component and display system revenue. Together they hold roughly 31% across two fields that barely compete with each other.

Which country is growing fastest?

China grows fastest at 20.2%, because electric vehicle platforms there have adopted large windscreen head-up displays as an expected feature rather than a premium option.

Report Segmentation Architecture

The full report scope spans multiple orthogonal segmentation dimensions, with cross-tabulated demand data provided for each dimension pair. Coverage extends further to regional breakdowns, trend trajectories, and the competitive detail needed to support segment-level decision-making.

By Primary Market Dimension

  • Holographic Optical Elements for Waveguides and Head-Up Displays
  • Light Field and Multi-View Autostereoscopic Displays
  • Semi-Transparent Projection Display Systems
  • Volumetric and Aerial Display Systems
  • Holographic Print and Security Optics
  • Digital Holography Capture and Reconstruction

By End-Use Industry

  • Automotive and Mobility
  • Augmented Reality Eyewear
  • Healthcare and Medical Imaging
  • Design, Engineering and Simulation
  • Retail, Events and Attractions
  • Defence and Scientific Research

By Commercial Dimension

  • Tier One Component Supply
  • Direct Manufacturer Programmes
  • Professional System Sales
  • Integrator and Installer Channels
  • Recording Material Supply
  • Research and Development Contracts

By Region

  • East Asia
  • North America
  • Western Europe
  • South Asia and Pacific
  • Latin America
  • Middle East and Africa
  • Eastern Europe

Scope, Methodology, and Coverage

Every figure in this report is reproducible from documented input assumptions. The scope below maps the historical period, the forecast horizon, the segmentation dimensions, and the countries covered, alongside the underlying primary and qualitative methodology.
Historical Period
2020 to 2025
Forecast Period
2026 to 2036
Base Year
2025 (USD billions; MMA Primary Research Dataset, September 2026)
Market Definition
This market covers displays and optical components using holographic or light-field techniques to present depth or overlaid imagery, spanning holographic optical elements for waveguides and head-up displays, light field and multi-view autostereoscopic displays, semi-transparent projection display systems, volumetric and aerial display systems, holographic print and security optics, and digital holography capture and reconstruction systems. Revenue is measured as component and finished system shipment value at supplier level, including recording material supplied for element production. Conventional stereoscopic three-dimensional displays requiring eyewear, virtual reality headsets without holographic optics, projection screens, and general display panels and modules are excluded.
Quantitative Units
USD billions, component and system shipment revenue at supplier level
Segmentation Dimensions
Optical technique, end-use industry, commercial channel, region
Regions Covered
East Asia, North America, Western Europe, South Asia and Pacific, Latin America, Middle East and Africa, Eastern Europe
Countries Covered
China, Japan, South Korea, Taiwan, India, Singapore, Malaysia, Australia, United States, Canada, Mexico, Brazil, Germany, United Kingdom, France, Italy, Netherlands, Switzerland, Sweden, Poland, Czechia, Slovakia, Hungary, United Arab Emirates, Saudi Arabia, South Africa
Key Companies Profiled
Covestro, Envisics, DigiLens, Sony, Leia, Luminit, Looking Glass Factory, Light Field Lab, Voxon Photonics, Realfiction, HOLOEYE Photonics, Continental, Nippon Seiki, Denso, Panasonic, BOE Technology Group, Samsung Display, LG Display, Vuzix, Kopin
Quantitative Methodology
Primary survey, n=3,800 respondents, Q4 2025, six countries; demand-side model with trade association cross-validation
Qualitative Methodology
47 expert interviews, Q4 2025; applied to validate demand model assumptions, identify emerging dynamics, and assess competitive positioning
Report Format
PDF and XLSX data workbook (Word format preview document)
Publisher
Market Minds Advisory
Report Code
MMA-2026-TEC-881
Published
September 2026
Contact
sales@marketmindsadvisory.com | www.marketmindsadvisory.com

Purchase the full Holographic Display Market Report (2026 to 2036).

The full MMA report separates the small part of this category that genuinely reconstructs a wavefront from the much larger part that does not, and follows the revenue. It sizes the market to 2036 across six optical techniques, seven regions and 26 countries, with segment growth rates and regional demand mechanisms set out in full. Competitive analysis covers 20 suppliers assessed on measured component and system revenue, including moat and risk assessment for the two leaders. The report quantifies production cost structure, recording material supply exposure and margin architecture across three portfolio tiers. It closes with four strategic verdicts and an anonymised optical component manufacturer engagement.
Six optical techniques sized to 2036
Seven regions with demand mechanism analysis
Twenty suppliers on consistent shipment revenue basis
Element production cost and material supply benchmarks
Margin architecture across three portfolio tiers
Anonymised optical component programme strategy engagement

Built For The People Who Decide

From boardroom strategy to bench-side execution, this report is read cover-to-cover by leaders shaping the next decade of their industry, turning demand scenarios, market dynamics and valuation benchmarks into decisions.
CXOs/ Presidents/ VPs/ Managers
M&A and Corporate Development
Strategy Teams and R&D Heads
Procurement and Product Directors
Regulatory and Compliance Leaders
Investor Relations and Equity Analysts