Market Minds Advisory
High-Speed Engine Market

High-Speed Engine Market: Data centre demand, alternative fuel platforms and aftermarket economics to 2036

Nobody built engine capacity for a computing boom, and a data centre operator who needs 40 megawatts of backup now waits more than two years for engines that used to ship in weeks.

Lead Analyst

David Horsley

Published

September 2026

Make Smarter Decisions with Customized Research Insights

Request a free sample report and evaluate market opportunities, growth trends, and competitive dynamics relevant to your business needs.

2025 MARKET VALUE$21.4BMarket Size 2025
2036 FORECAST VALUE$46.9BBase Case , 2026 to 2036
CAGR 2026 TO 20367.4 %Bull 8.7% / Bear 6.2%
INCREMENTAL OPPORTUNITY$23.9BNet 10- year value creation
EXPANSION MULTIPLE2.04x2036 value over 2026 base
Strategic Levers
M&A Pipeline
Regional Outlook
Country Rankings
Competitive Intelligence
Segmental Deep-dive
Call-Us : 91 93563 13602

Executive Snapshot and Market Trajectory

Artificial intelligence built a queue for diesel engines. Data centre backup power now takes 31% of power generation engine value, order lead times on large standby units run past two years, and nobody in this industry planned capacity for a demand source that did not exist five years ago.
Dual-fuel engines grow at 11.1%, half again the market rate of 7.4%, on marine orders responding to emissions regulation rather than fuel price. North America holds 29% of value on data centre construction that has no parallel anywhere else. East Asia follows at 26% on shipbuilding and genset manufacture, which is a completely different demand mechanism reported under the same heading. Very few analysts separate them.
Five manufacturers hold 51% of supply and the constraint is not competition, it is casting and machining capacity that takes years to add and that nobody wants to add against a demand spike they suspect is temporary. Aftermarket parts and service already provide 44% of manufacturer revenue and that share rises whenever new unit deliveries slip. The installed base is worth more than the order book to several of these businesses.
Market Definition
This report covers reciprocating internal combustion engines rated above 1,000 revolutions per minute supplied for marine propulsion and auxiliary power, stationary and mobile power generation, and rail traction. Value is measured at engine manufacturer level including packaged gensets. Excluded are medium-speed and low-speed marine engines below 1,000 revolutions per minute, on-highway truck and bus engines, gas turbines, small portable generators under 50 kilowatts, and battery energy storage systems.
Base Year Value
$21.4B in 2025 (MMA Primary Research Dataset, August 2026)
Forecast Period
2026 to 2036, eleven discrete annual values
CAGR
7.4% base case. Bull 8.7%. Bear 6.2%.
Fastest Growth Segment
Dual-Fuel Engines: 11.1% CAGR
Fastest Growth Country
India: 10.2% CAGR
Fastest Growth Region
South Asia and Pacific: 9.6% CAGR
Largest Region
North America: 29% of 2025 global value
Market Leaders
Caterpillar, Cummins, Rolls-Royce Power Systems, Yanmar Holdings and Volvo Penta lead the market. Source: MMA Primary Research Dataset, July 2026.
Primary Survey
n=3,800 procurement and R&D decision-makers, Q4 2025, six countries
Methodology
Demand-side build-up, cross-validated against public data, 47 expert interviews

High-Speed Engine Market Forecast Scenarios

high-speed-engine-market-size-forecast-scenario-1787553260322
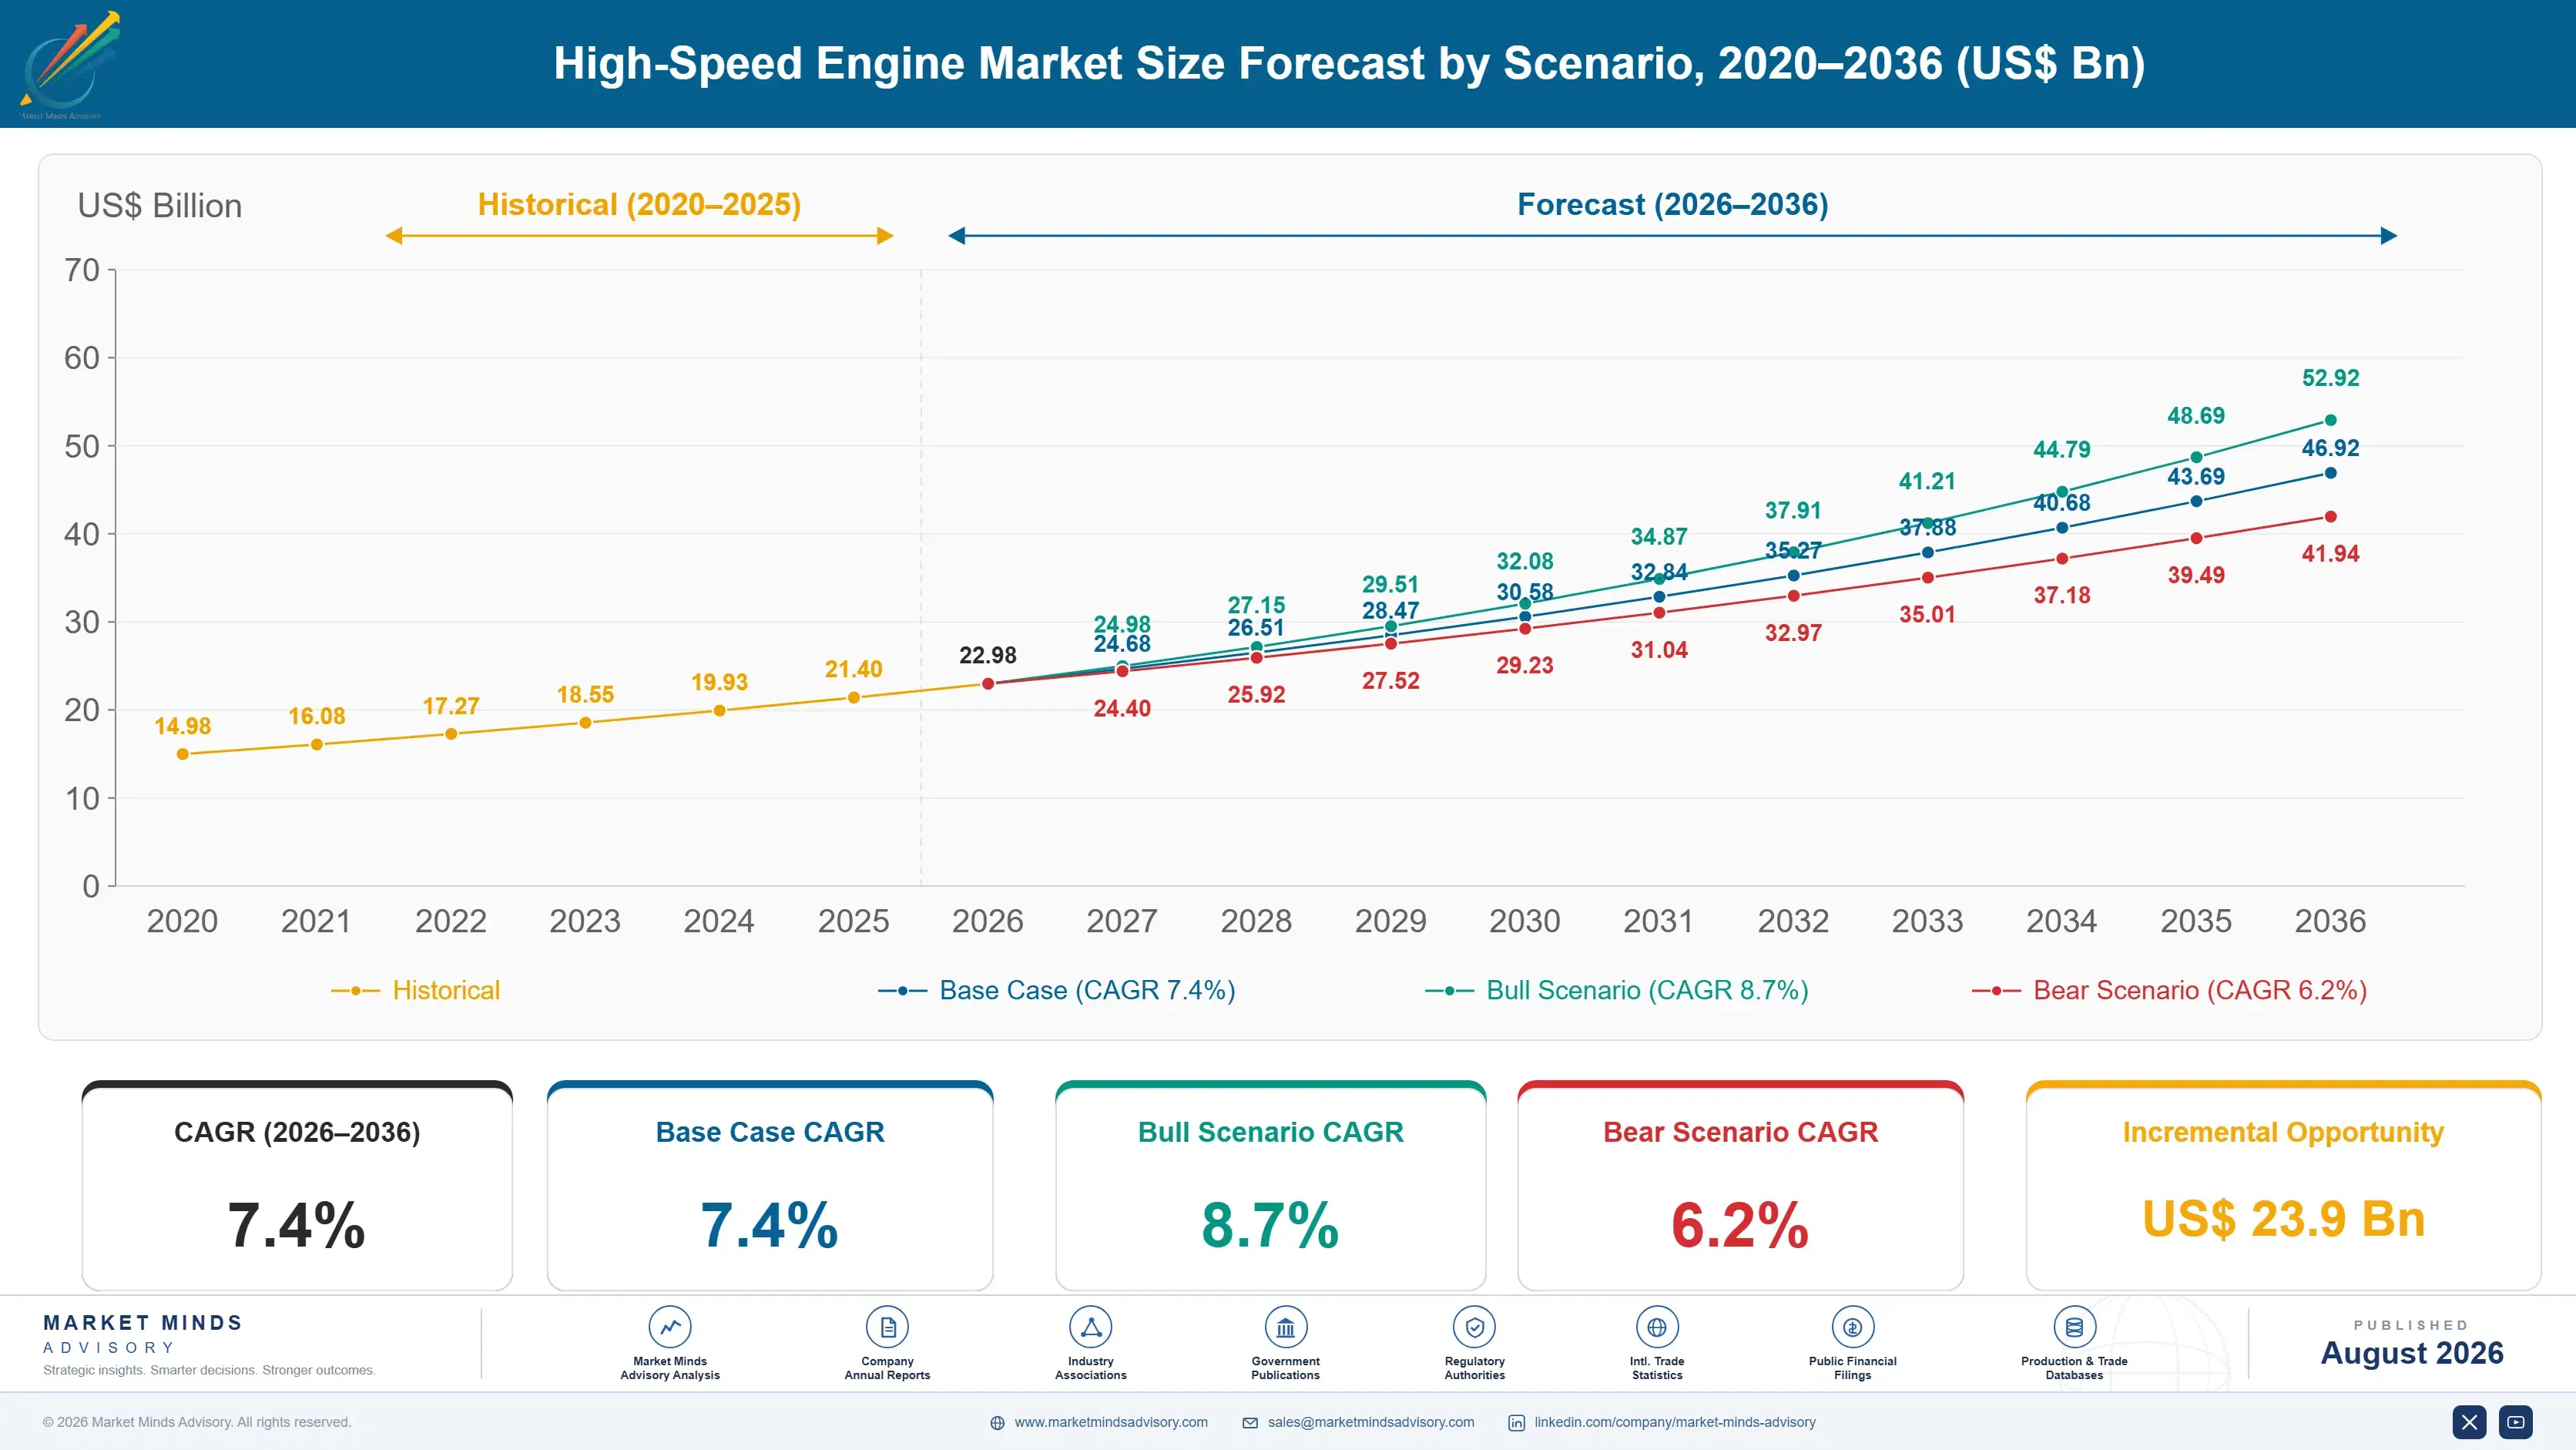
Growth ran at 6.0% between 2020 and 2025 and the shape of it changed completely partway through. The first two years were weak: marine ordering paused, construction slowed, and standby generation demand tracked ordinary commercial building. Then data centre construction accelerated in a way nobody in engine manufacturing had modelled, and order books filled faster than casting capacity could respond.
The 7.4% base case rests on three mechanisms. Data centre backup power keeps consuming large standby units at rates that already take 31% of power generation engine value and are still rising. Reciprocating gas plants keep being built for grid balancing, because they start in minutes where a turbine takes longer and batteries cannot hold output for hours. And IMO Tier III and equivalent marine rules keep pushing dual-fuel specification onto new vessel orders regardless of what fuel actually costs.
The 8.7% bull case assumes data centre construction sustains through the decade rather than pausing, which would keep order books full past current capacity plans. The 6.2% bear case is grid connection: a data centre that secures firm utility supply needs far less backup generation, and several jurisdictions are building transmission specifically to remove that requirement.

What The Order Book Hides

The engine business has always been two businesses wearing one name. Selling a unit is a capital goods transaction with long lead times, cyclical demand and thin margins on the metal. Servicing it afterwards is an annuity that runs for twenty-five years and earns considerably more per pound of iron. Aftermarket already provides 44% of manufacturer revenue, and it rises whenever new deliveries slip because the installed base still needs parts.
TOP-FIVE CONCENTRATION51%Combined position across high-speed engine supply held by leaders
GENSET ORDER LEAD TIME26 monthsTypical wait from order to large standby unit delivery
DATA CENTRE DEMAND SHARE31%Portion of power generation engine value serving computing facilities
AFTERMARKET REVENUE SHARE44%Portion of manufacturer revenue from parts and service
OVERHAUL INTERVAL24,000 hoursTypical running period between major top-end rebuild events
ALTERNATIVE FUEL ATTACH RATE18%New marine orders specified with dual-fuel or methanol capability
Right now deliveries are slipping badly. Order lead times on large standby units run around 26 months, which is what happens when a demand source appears that consumes 31% of power generation engine value and nobody built capacity for it. Casting and crankshaft machining are the bottleneck rather than assembly, and neither expands quickly or cheaply. Manufacturers are allocating rather than selling.
Marine tells a different story entirely. Around 18% of new orders now specify dual-fuel or methanol capability, driven by emissions rules and charterer pressure rather than by any fuel cost calculation that works today. Overhaul intervals near 24,000 hours mean every one of those engines returns as service revenue for decades. That is the actual business.
"Everybody is looking at the order book and the order book is the least interesting number here. What matters is that every engine shipped this year becomes twenty-five years of parts revenue, and the industry is quietly installing the largest service base it has ever had."
Principal, Power Systems and Industrial Equipment Practice · MMA Industrial Equipment Practice · August 2026

Market Trends

Data centre backup power consumes capacity nobody planned for

A large artificial intelligence training facility needs backup generation measured in tens of megawatts, and the reliability standard means diesel rather than anything else. That demand arrived faster than engine manufacturing could respond, and it now takes 31% of power generation engine value against a share that was marginal five years ago. Lead times on large standby units run past two years. The uncomfortable part for manufacturers is that nobody knows whether this is a decade-long build or a spike, and adding casting capacity against the wrong answer is an expensive mistake that lasts thirty years.
Market Impact: Fitted on 18% of orders

Reciprocating gas plants displace turbines in grid balancing

Renewable penetration created a requirement nobody needed thirty years ago: generation that can go from cold to full output in minutes, run for a few hours, and stop again without damage. Reciprocating gas engines do that better than a gas turbine, which prefers steady load, and cheaper than a battery once duration passes about four hours. Utilities across several markets have built engine plants specifically for this. Growth at 8.6% in spark-ignited gas reflects it. The engines are also modular, so a plant can run half its units at full efficiency rather than one large machine at part load.
Market Impact: Provides 44% of manufacturer revenue

Market Opportunities and Growth Drivers

Marine emissions rules push dual-fuel onto new vessel orders

IMO Tier III nitrogen oxide limits apply in emission control areas covering most of the North American and Northern European coastline, and carbon intensity requirements are tightening on a published schedule. A shipowner ordering a vessel today is specifying for rules that will apply well before the hull is scrapped. Around 18% of new orders now carry dual-fuel or methanol capability, and none of that is driven by fuel cost, which currently favours conventional operation. Growth at 11.1% in dual-fuel follows regulation and charterer requirements rather than economics anybody can defend on a spreadsheet.
Market Impact: Extends lead times to 26 months

Installed base expansion builds aftermarket revenue for decades

Every engine shipped this year enters service for roughly twenty-five years and returns to the manufacturer for parts, overhauls and service across all of it. Overhaul intervals near 24,000 hours mean a genset running prime power comes back every three years and a standby unit rather less often. Aftermarket already provides 44% of manufacturer revenue at margins the new unit business cannot approach. The current delivery surge is therefore building a service annuity considerably larger than the revenue it books today, and manufacturers with strong dealer networks capture most of it rather than losing it to independents.
Market Impact: Adds cost across 18% of orders

Market Restraints and Challenges

Casting and crankshaft capacity constrains output more than assembly

An engine block is a large iron casting and a crankshaft is a forged and machined part with very long cycle times, and both come from a foundry base that has contracted steadily across Western economies for thirty years. The root cause is that foundries were never profitable enough to attract investment during the years when engine demand was flat. Commercially this caps how fast anybody can respond to the current surge, and lead times past 26 months are the visible result. Manufacturers have responded by qualifying additional foundries, mostly in Asia, and by redesigning components to reduce machining time.
Market Impact: Takes 31% of generation value

Alternative fuel capability costs money nobody currently saves

A dual-fuel or methanol-capable engine costs meaningfully more than a conventional one and delivers no operating saving at present fuel prices, which makes the purchase an act of regulatory anticipation rather than economics. The root problem is that the fuel infrastructure lags the engines: a methanol-capable vessel can only bunker methanol where somebody has built a terminal, and very few have. Commercially this leaves owners paying for optionality they cannot exercise. Some are ordering conversion-ready engines rather than fully capable ones, which costs less now and preserves the option, and a few charterers have begun funding the premium directly.
Market Impact: Gas segment growing 8.6% annually
3 additional market trends, 4 additional growth drivers, and 2 additional restraints and challenges are covered in the full report. Contact sales@marketmindsadvisory.com to access the complete intelligence.

Segment CAGR and Growth Architecture

Engines are classified here by fuel and combustion configuration, because that determines development cost, certification path and which regulations an engine can meet. Application, power output band and installation type are handled separately in the framework, since a single engine platform serves marine, generation and rail applications with different auxiliaries fitted. The platform is what gets certified.
high-speed-engine-market-market-share-analysis-1787553260859

Dual-Fuel Engines

Growing at 11.1%, half again the market rate, dual-fuel is where marine emissions regulation is actually landing. An engine that runs on liquefied natural gas with a diesel pilot injection meets Tier III nitrogen oxide limits without aftertreatment and cuts carbon intensity enough to matter under the tightening schedule. Around 18% of new marine orders now specify this capability or methanol equivalent. None of it saves money at current fuel prices, which is the important thing to understand about the demand: owners are buying compliance and charterer acceptability rather than operating economics. Development cost per platform is substantial and the manufacturers who funded it early are collecting on that now.
CAGR 11.1%

Alternative-Fuel Capable Engines

Methanol, hydrogen and ammonia-ready platforms sit here, and the segment is smaller than the attention it receives suggests. Growth at 10.4% comes almost entirely from marine ordering ahead of regulation, since no fuel in this group is cheaper or more available than diesel today. Methanol is furthest along because it stays liquid at ambient conditions and a few bunkering terminals now exist. Hydrogen combustion works and the storage volume defeats most applications. The commercial pattern worth watching is conversion-ready ordering: an owner pays a smaller premium for an engine that can be converted later rather than one capable now, which preserves optionality without funding infrastructure that has not been built.
CAGR 10.4%
Full segment breakdown across 6 segments available in the complete report.

Regional Architecture and Country Demand Map

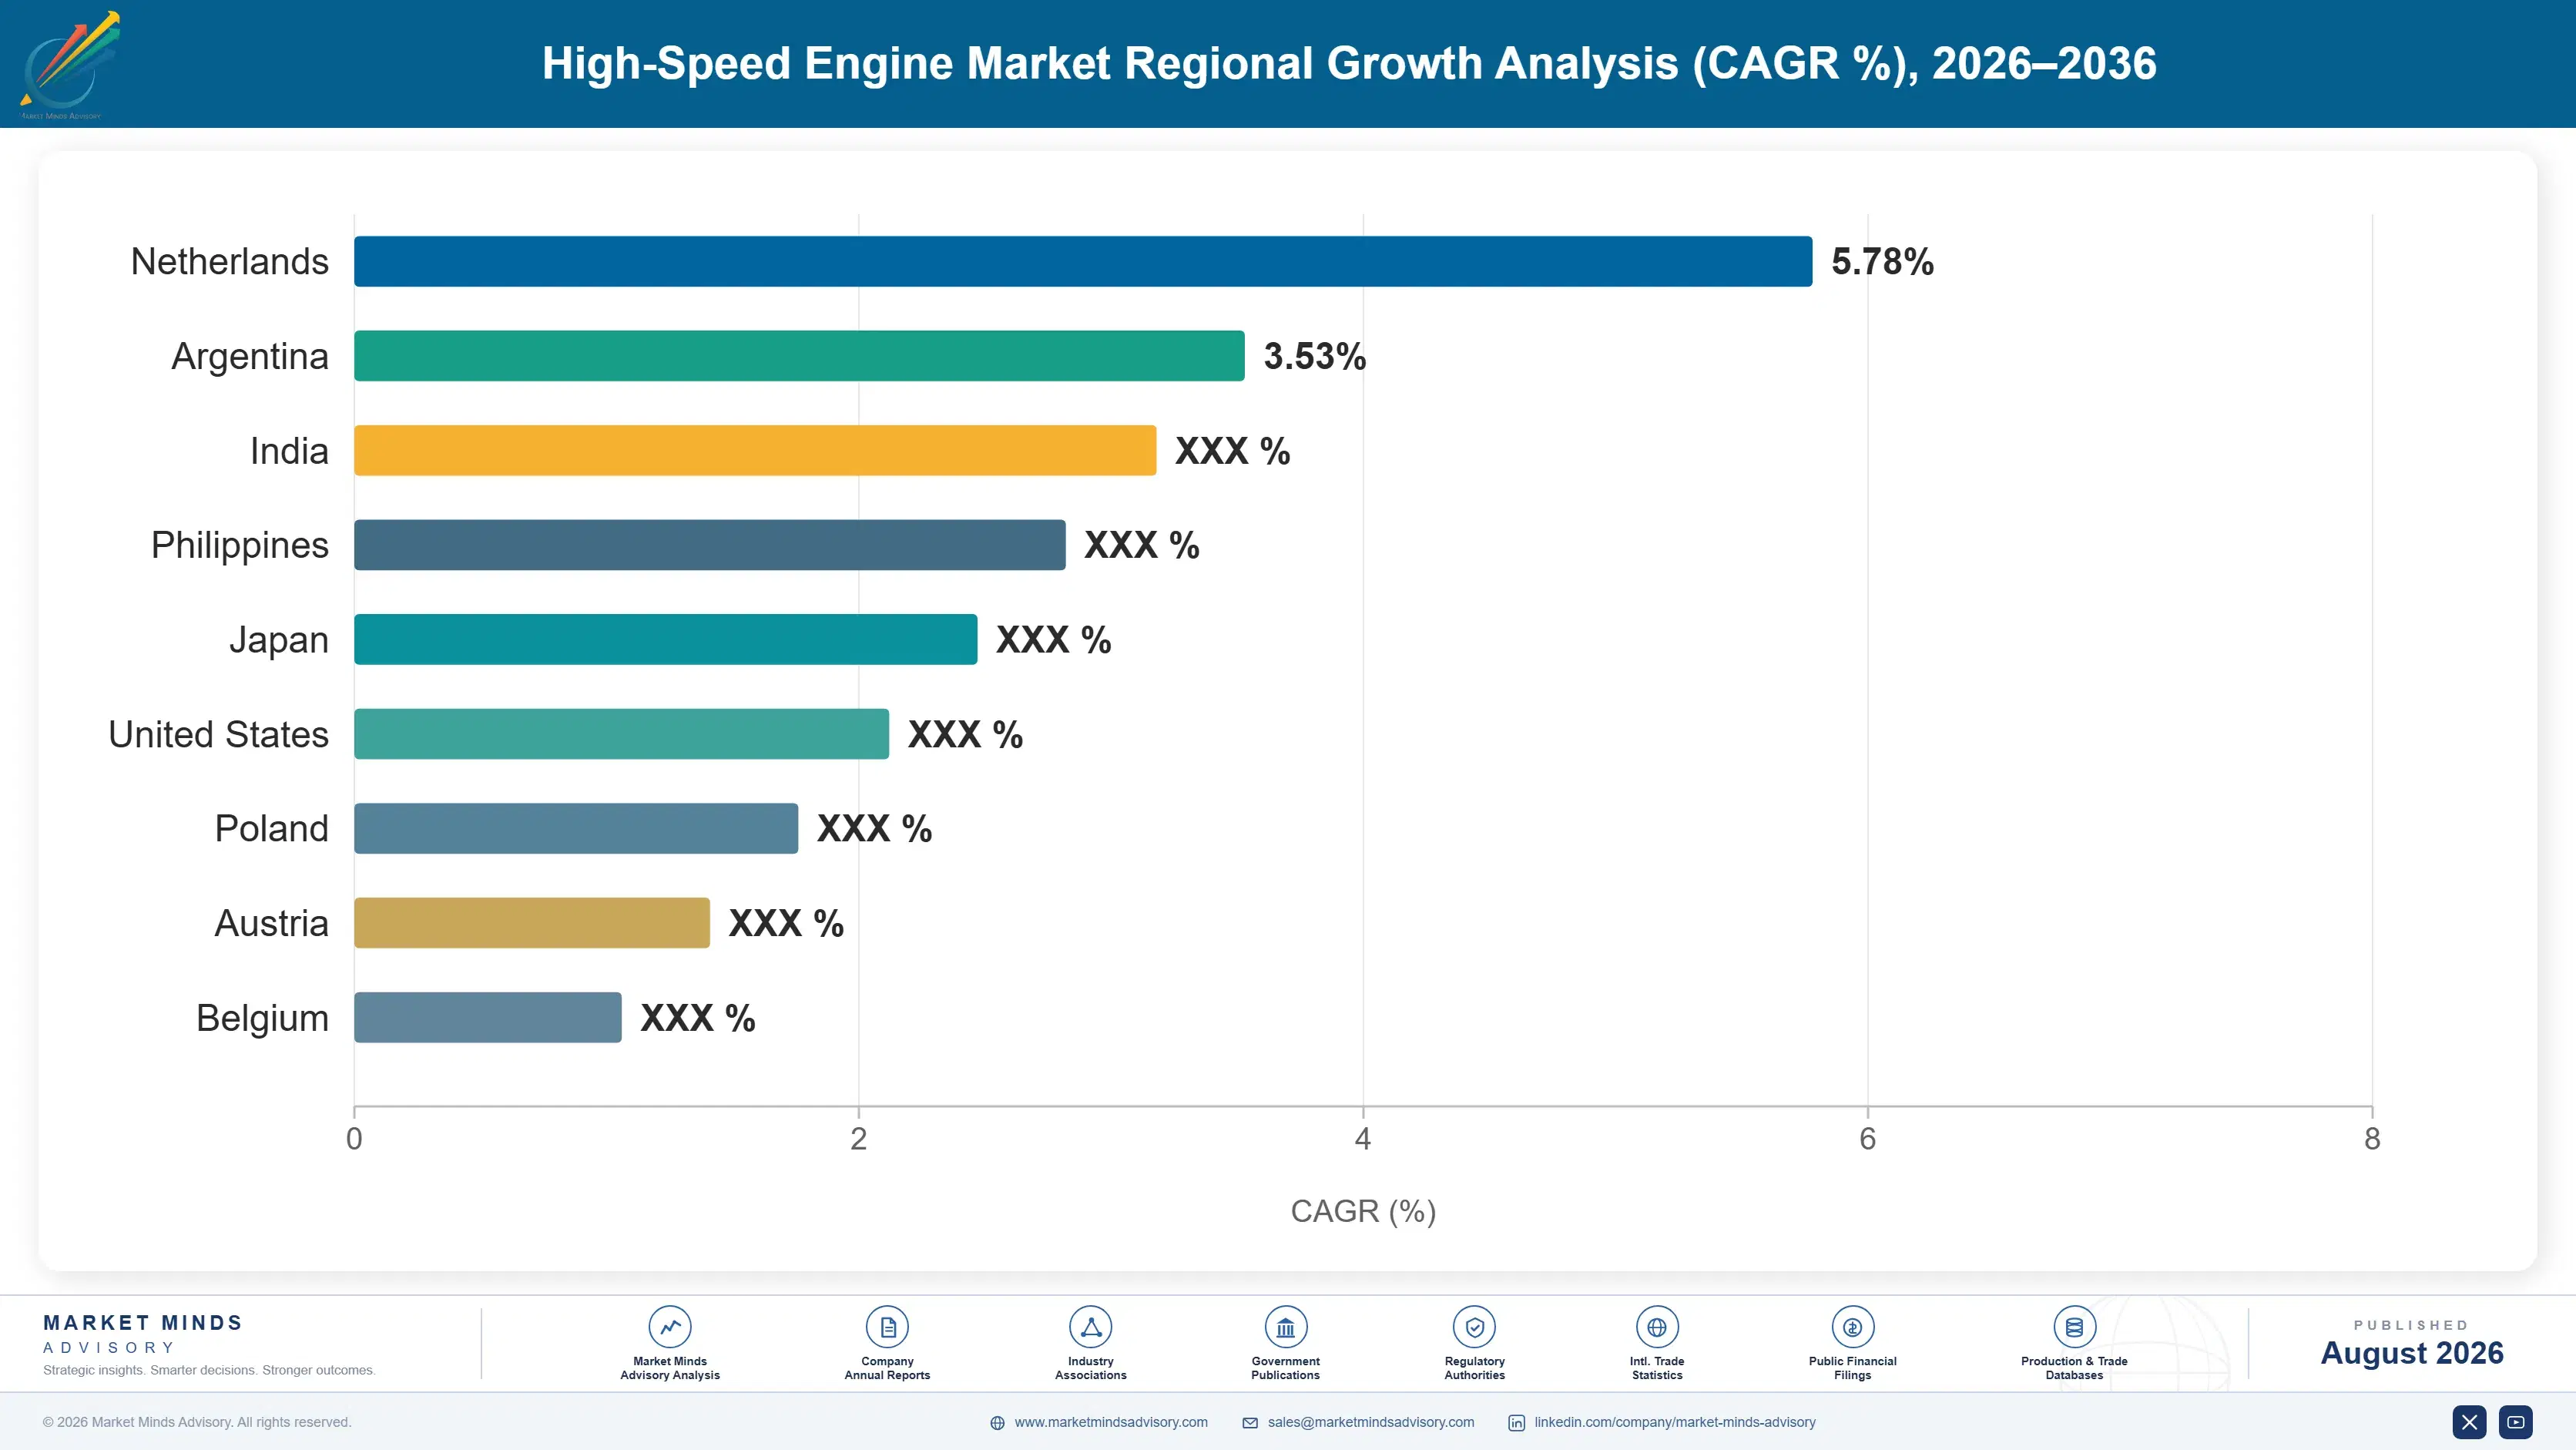
North America holds 29% of value on data centre construction that has no equivalent elsewhere. East Asia follows at 26% on shipbuilding and genset manufacture, a completely different mechanism. Two demand stories sit inside one market table and they move independently. Forecasting the total means forecasting both.

North America

Data centre construction is what puts this region at the top of the table, and it would not be there otherwise. Hyperscale operators specify backup generation measured in tens of megawatts per facility and accept nothing less reliable than diesel, which has consumed engine capacity faster than manufacturing could respond. Order lead times past 26 months are the visible consequence. Beyond that, North American rail traction remains a meaningful demand source and inland marine towboat rebuilding adds steady volume. Growth at 8.6% is the strongest of the developed regions and rests almost entirely on a single application whose durability nobody in the industry can confidently forecast. That concentration is worth watching carefully.
Share: 29% | CAGR: 8.6% (2026 to 2036)

Western Europe

Nothing here is growing quickly and the technology leadership sits here anyway. German and Scandinavian manufacturers developed most of the dual-fuel and methanol platforms that the rest of the world is now ordering, funded through years when the commercial case looked doubtful. Northern European emission control areas made the regulatory pressure real earlier here than anywhere. Data centre construction is expanding across Ireland, the Nordics and the Netherlands, though grid connection policy in several of those markets is deliberately steering operators away from diesel backup. Growth at 5.8% is the weakest of the seven regions and understates how much of the world's engine engineering still happens here. Engineering and volume have separated entirely.
Share: 20% | CAGR: 5.8% (2026 to 2036)
Regional intelligence for 5 additional markets available in the complete report: East Asia, South Asia and Pacific, Latin America, Middle East and Africa, Eastern Europe. Contact sales@marketmindsadvisory.com.
high-speed-engine-market-country-cagr-analysis-1787553261391

Where Engine Margin Actually Sits

Four moves matter and only one of them involves selling more engines. The metal earns thin returns and the installed base earns most of the profit, which every manufacturer knows and rather fewer organise around. Allocating scarce capacity well is worth more right now than adding capacity anybody may regret later. The regret would last thirty years.

Allocate scarce capacity to the stickiest installed base

With lead times past 26 months a manufacturer is choosing customers rather than winning them, and that choice sets aftermarket revenue for twenty-five years. A data centre operator with a dealer service contract is worth considerably more over the engine life than a marine buyer who will use independent yards for every overhaul. Aftermarket already provides 44% of manufacturer revenue at margins the unit sale cannot approach. Allocating by order date rather than by lifetime value is the default and it is leaving a great deal of annuity on the table.
Market Impact: Protects the full 44% share of aftermarket revenue

Sell conversion-ready platforms rather than fully capable ones

Owners want alternative fuel optionality and cannot justify paying for capability they cannot use, because bunkering infrastructure for methanol and hydrogen barely exists. A conversion-ready engine costs a fraction of a fully capable one and preserves the option, which is exactly what the buyer actually wants. Around 18% of new marine orders now carry some alternative fuel provision and the conversion-ready share of that is rising fast. Manufacturers pushing full capability are losing orders to competitors who understood that the customer was buying insurance rather than a fuel strategy. That distinction decides quite a few tenders.
Market Impact: Reaches the 18% of marine orders specifying alternatives

Package grid balancing plants, not individual gas engines

A utility building a fast-start balancing plant is buying dispatch capability, not engines, and it wants a delivered plant with controls, grid interface and a performance guarantee. Manufacturers selling engines into that market leave the integration margin to somebody else. Growth at 8.6% in spark-ignited gas is happening whether or not anybody packages it, and the packaged sale carries considerably higher value per megawatt alongside a service contract that locks the aftermarket. The capability required is project engineering rather than combustion engineering, which is a different hire and a different organisation. Very few engine builders have made it.
Market Impact: Captures integration margin across an 8.6% growth segment

Qualify Asian foundries before the next capacity squeeze

Casting and crankshaft supply rather than assembly is what caps output, and the Western foundry base has contracted for thirty years because it was never profitable enough to attract investment. Lead times past 26 months are the visible result. Qualifying additional foundry capacity in Asia takes eighteen months of process validation and dimensional verification, which means the decision has to be made before the constraint bites rather than during it. Manufacturers doing that work now will convert the next demand surge into revenue while competitors are still explaining delivery dates to customers.
Market Impact: Attacks the 26 month delivery lead time directly

Who Controls the Margin Pool

Five manufacturers hold 51% of high-speed engine supply, measured on engine revenue at manufacturer level across marine, generation and rail, the basis used throughout this section. Concentration is moderate and the practical position is tighter, because capacity constraints mean several of these companies are turning business away rather than competing for it. The gap between leaders and the next tier is dealer and service network depth, not engine design.
Competition currently runs on delivery date more than anything else. Behind that sit three durable dimensions. Alternative fuel platform availability, particularly dual-fuel and methanol. Service network reach, which decides who captures the aftermarket. And packaged plant capability for grid balancing, where the sale is a project rather than a product. Price argument has largely disappeared while capacity is short.

Rankings shift when capacity catches up and price returns, which will expose whoever expanded on the assumption that data centre demand lasts. Chinese manufacturers hold cost positions that Western builders cannot match and are qualifying into applications that were closed to them a decade ago. Marine and rail hold longer, because service network reach takes decades to build and buyers there weigh it heavily.
high-speed-engine-market-company-positioning-matrix-1787553261923

Competitive Moat and Risk Dimensions

CATERPILLAR

Moat: Dealer network reach

Caterpillar's independent dealer network covers every market where an engine might be installed, and it provides parts availability and field service that no competitor can match at the same response times. That network took a century to build and it captures the aftermarket revenue where the profit sits, which is the reason customers accept the price premium on the unit.
CATERPILLAR

Risk: Data centre demand concentration

A large share of current order intake depends on hyperscale data centre construction, and that demand could moderate quickly if grid connection policy improves or if computing capacity expansion slows. Capacity added against it would sit idle for decades. Competitors weighted toward marine and rail carry a steadier if less exciting exposure.
CUMMINS

Moat: Emissions engineering depth

Cummins built aftertreatment and emissions engineering capability across on-highway and off-highway applications over decades, and that knowledge transfers directly into meeting marine and stationary rules. The company certifies engines against more regulatory regimes than most competitors attempt, which means a customer in an unusual jurisdiction generally finds a compliant option available already.
CUMMINS

Risk: On-highway business drag

Most of the company's revenue comes from on-highway truck engines, a market facing its own electrification transition and its own cyclicality. Power generation and marine compete internally for capital against that larger business, which slows decisions that competitors focused purely on industrial power can take quickly.

Players Tracked

Prominent Players

Caterpillar
Cummins
Rolls-Royce Power Systems
Yanmar Holdings
Volvo Penta

Other Key Players

Wärtsilä
MAN Energy Solutions
Deutz
Scania
Mitsubishi Heavy Industries
Weichai Power
HD Hyundai Infracore
Daihatsu Diesel
John Deere Power Systems
Isuzu Motors
Kubota
FPT Industrial
Liebherr
Moteurs Baudouin
Guangxi Yuchai Machinery

Recent Developments

MARCH 2025

Caterpillar expanded large engine production capacity in the United States

Caterpillar commissioned additional large engine assembly and test capacity at a United States site, responding to data centre backup generation order intake the existing lines could not absorb. The investment was organic and funded internally, with no partner or acquisition involved, and casting supply remained the binding constraint afterwards.
Signal: Assembly capacity expanded and lead times barely moved, which confirms the constraint sits upstream in foundry supply
SEPTEMBER 2025

Rolls-Royce Power Systems signed a multi-year genset supply agreement with a hyperscale data centre operator

Rolls-Royce Power Systems entered a multi-year supply agreement covering large standby generating sets for a hyperscale data centre operator across several European and North American sites. The arrangement was a supply agreement rather than a joint venture, with no equity participation, and it includes long-term service coverage.
Signal: Capacity is being contracted forward by buyers rather than bought on order, which tells you how tight allocation has become
JANUARY 2026

Yanmar Holdings commissioned methanol-capable marine engine production in Japan

Yanmar Holdings brought methanol-capable high-speed marine engine production into service at a Japanese facility, targeting coastal and workboat operators ordering ahead of tightening carbon intensity requirements. The expansion was organic rather than acquisitive and followed several years of platform development funded internally. Bunkering infrastructure remains the open question.
Signal: Platform capability is arriving ahead of the fuel infrastructure, which leaves owners buying optionality they cannot yet exercise

What Moves Engine Cost

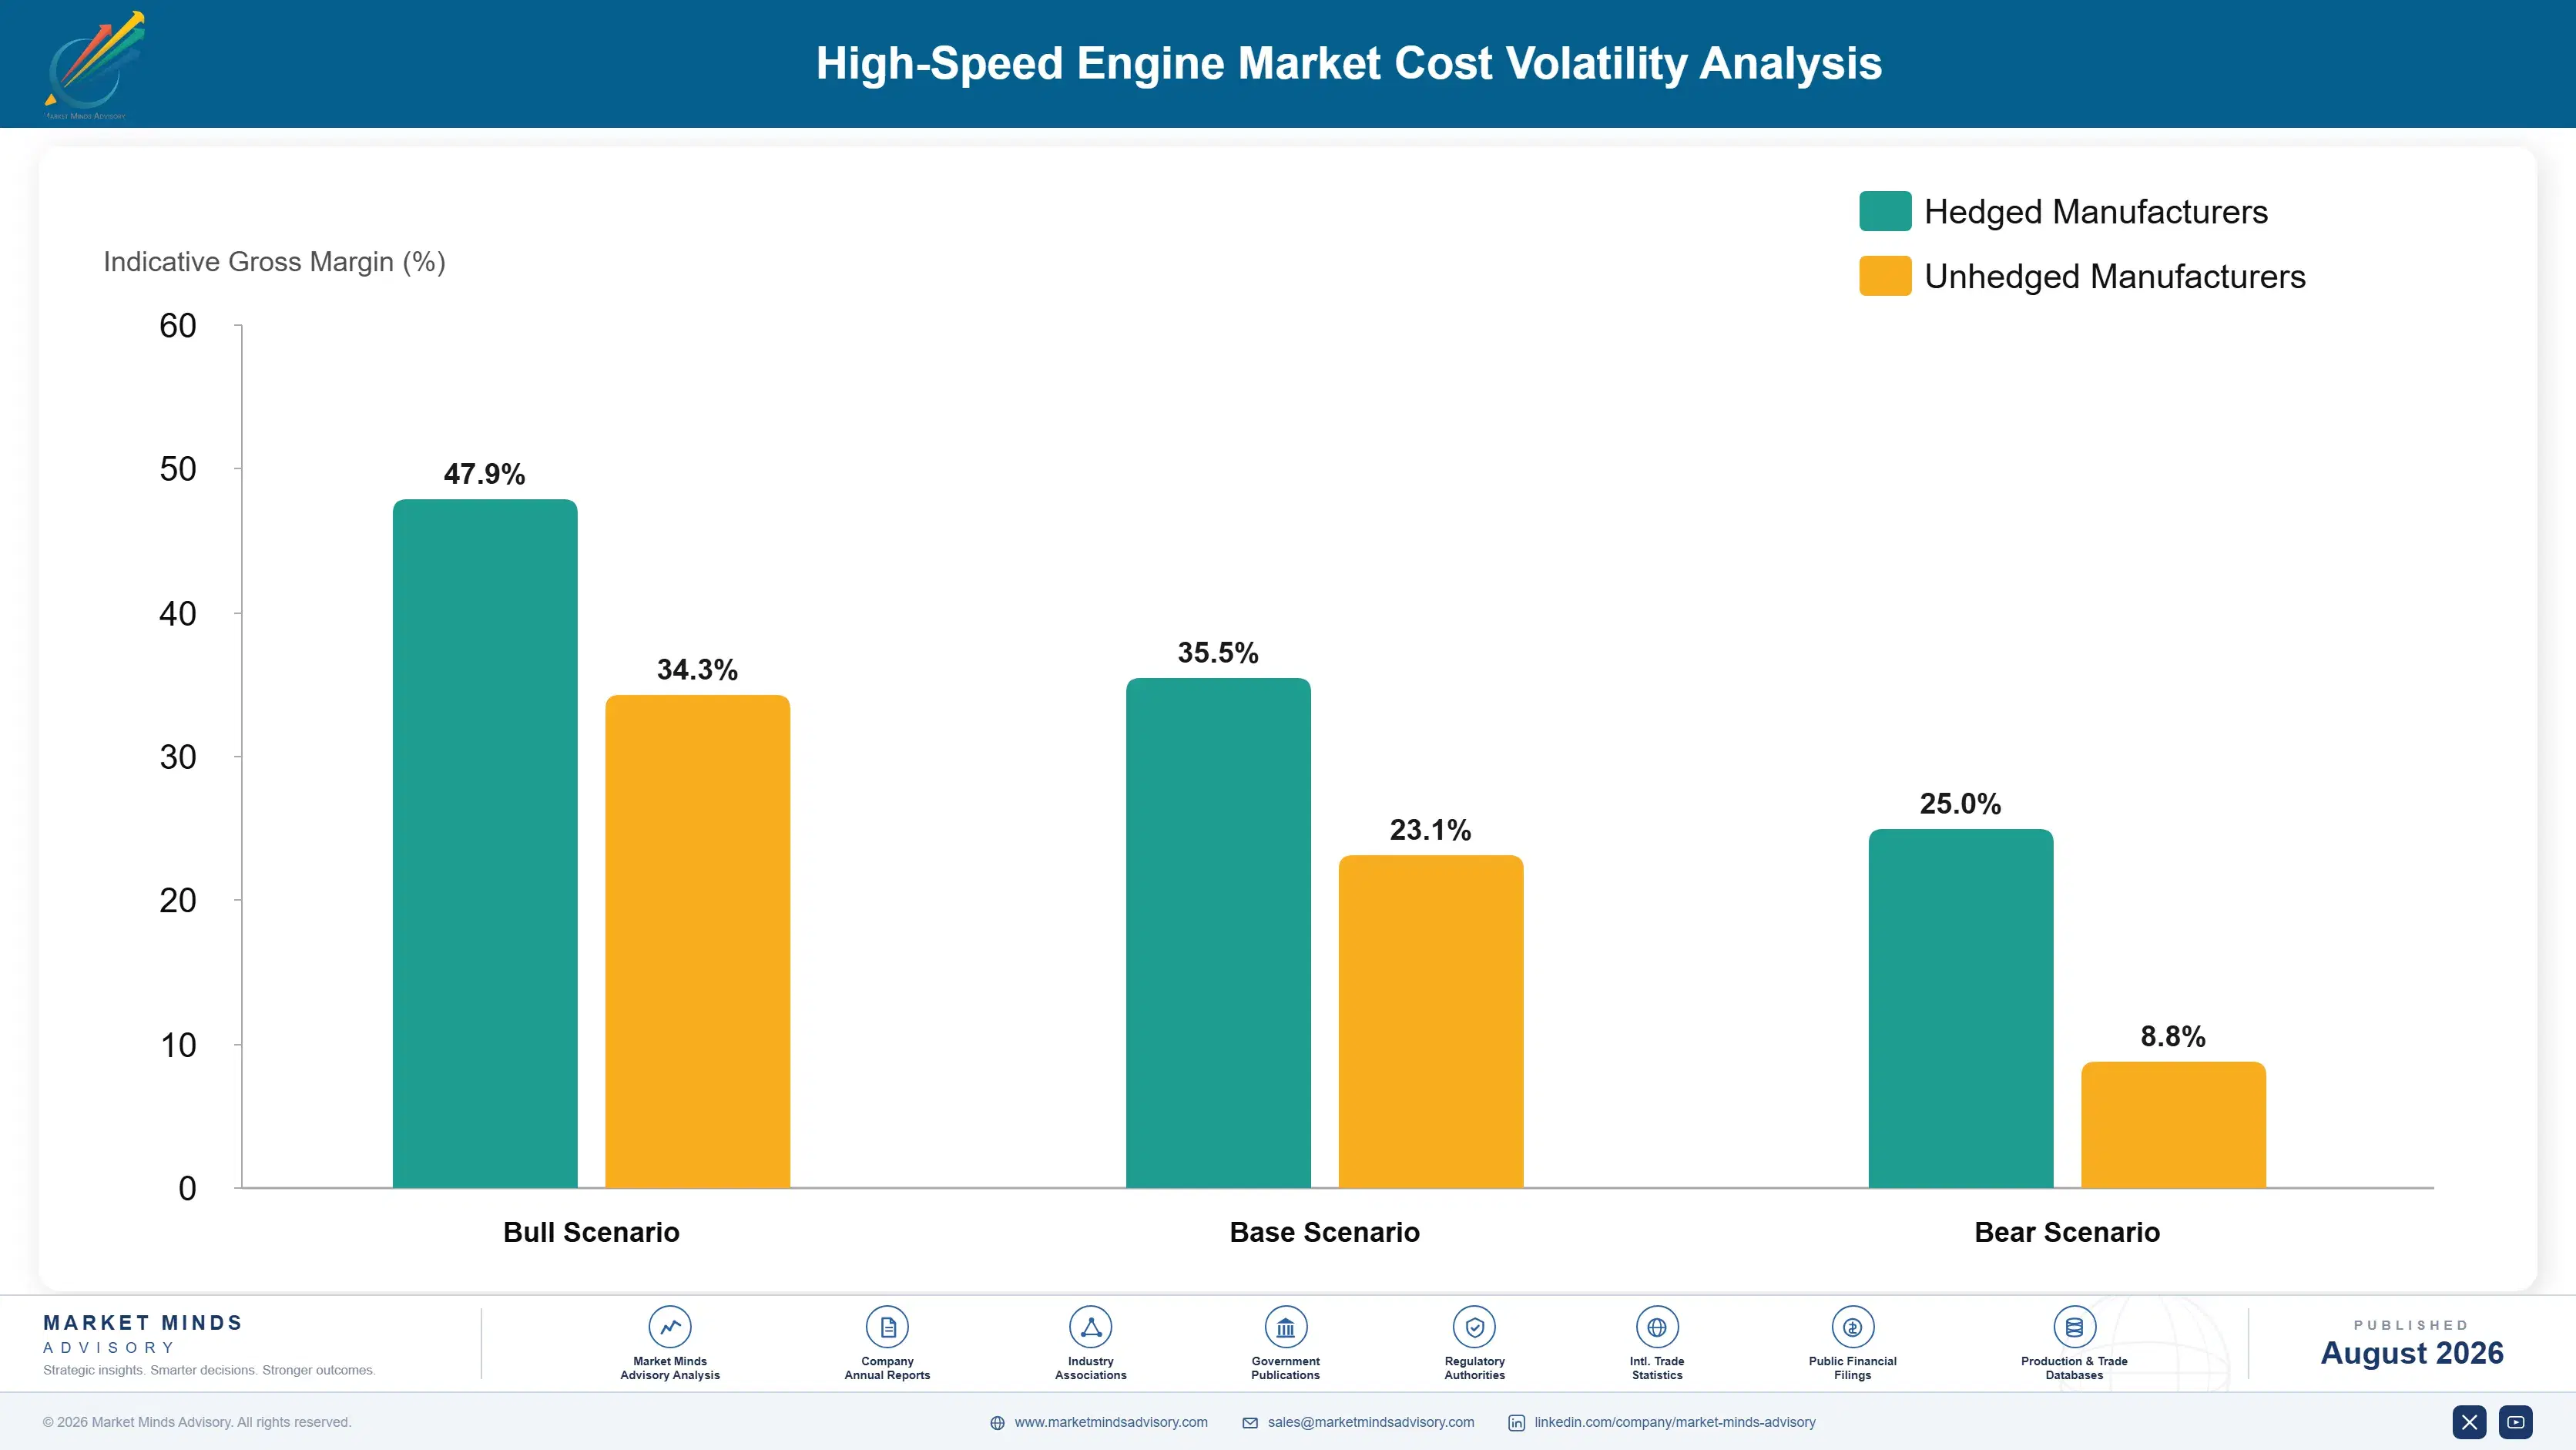
Iron and steel castings account for around 33% of engine cost of goods, with machining labour, fuel systems, turbochargers and electronics making up the balance. Castings come from foundries concentrated in Europe, India and increasingly China. Fuel injection equipment comes from a very small number of specialists. Aftertreatment catalyst carries its own supply concentration in platinum group metals.
European energy prices through 2022 hit foundries harder than most manufacturing, because melting iron is electricity-intensive and cannot be paused. IEA data show European industrial electricity running well above American levels, and several European foundries closed under it. Cummins reported input cost pressure across its power systems segment in its Annual Report 2022. Engine makers on fixed-price project contracts absorbed most of it, since a genset quoted eighteen months ahead cannot be repriced.

The long quotation horizon is what makes this exposure unusual. A manufacturer quoting a genset for delivery in 26 months is pricing against a cost base it cannot forecast, and every foundry closure narrows the alternatives further. Manufacturers with captive foundry capacity carry a smaller exposure than those buying castings on the open market. Asian builders gain further from energy and labour costs European operations cannot approach.
high-speed-engine-market-cost-volatility-analysis-1787553262120

Index long-horizon project quotations to published metal benchmarks

Quoting a genset for delivery 26 months out against a fixed price transfers every input movement to the manufacturer over a period nobody can forecast. Indexing to published iron, steel and copper benchmarks with reset at order confirmation removes the exposure and buyers accept it since the alternative is a padded quotation. Resistance sits with procurement rather than engineering.

Qualify additional foundry capacity before the constraint bites

Foundry qualification takes eighteen months of process validation and dimensional verification, which means the work has to start before capacity is short rather than during it. The Western foundry base has contracted for thirty years and will not expand on the strength of one demand surge. Manufacturers doing this now will convert the next surge into revenue rather than apologies.

Redesign components to reduce machining cycle time

Crankshaft and block machining consume more capacity than assembly does, and much of that cycle time comes from designs settled decades ago when machine tools were slower and labour was cheaper. Revisiting tolerance stacks and feature geometry recovers capacity without capital, which is the cheapest output any manufacturer can find. Engineering resistance to reopening proven designs is the main obstacle.

Portfolio Architecture for Margin Defence

Margin in this industry does not sit where the revenue sits. New engine sales run at gross margins in the high teens to low twenties, because the metal is heavy, the competition is capable and the buyer compares quotations. Parts and service run at roughly double that, and they arrive over twenty-five years from an installed base the customer cannot easily take elsewhere. Aftermarket already provides 44% of manufacturer revenue and considerably more than 44% of the profit.
The tension is that unit sales build the installed base and unit sales earn almost nothing, so a manufacturer has to keep selling metal at thin margins to feed the business that actually pays. That works until capacity is short, at which point every unit allocated to a customer who will service elsewhere is a permanent loss rather than a delayed sale. Very few manufacturers allocate on that basis, mostly because sales incentives reward order intake.

High-value pools sit in long-term service agreements, packaged grid balancing plants and alternative fuel platforms where development cost creates a genuine barrier. None of the three is where most of the revenue currently is. Casting capacity by itself defends nothing at all beyond the current squeeze.

Volume / Commodity-Adjacent

Conventional diesel gensets and standard marine propulsion units where several capable builders compete on quotation and delivery date. The seven-point range separates manufacturers with captive foundry capacity from those buying castings on the open market at current prices.
Gross Margin: 15%-22%

Premium / Certified

Emissions-certified platforms for regulated marine and stationary applications, and packaged installations sold with controls and performance guarantees. The eight-point spread reflects how much integration the manufacturer performs against how much the customer contracts separately.
Gross Margin: 26%-34%

Sustainability / Regulatory / Next-Generation

Dual-fuel, methanol and hydrogen-capable platforms, and the long-term service agreements attached to them. The twelve-point range is wide because platform development cost varies enormously and pricing reflects scarcity of certified options rather than manufacturing cost.
Gross Margin: 34%-46%
high-speed-engine-market-portfolio-architecture-1787553262622

High-value Sub-segments and Strategic Watch-out

Long-Term Service Agreements

Aftermarket provides 44% of manufacturer revenue and considerably more of the profit, arriving over twenty-five years from an installed base that is expanding faster than at any point in decades. Every unit shipped now is annuity later. Allocation decisions today set that revenue. Very few boards see it.
Gross Margin: 38%-46%

Dual-Fuel Marine Platforms

Compounding at 11.1% on emissions rules rather than fuel economics, and defended by platform development cost that took years to fund. Around 18% of new marine orders now carry alternative fuel provision. Conversion-ready ordering is where the volume is actually going. Few builders have noticed that.
Gross Margin: 34%-44%

Conventional Diesel Gensets

The volume that fills assembly lines and builds the installed base, currently constrained by casting supply rather than by demand. Data centre buildout takes 31% of generation engine value and nobody knows how long it lasts. Manage the allocation carefully rather than the price. Price will return eventually.
Gross Margin: 15%-22%

Foundry Capacity Exposure

Castings set 33% of engine cost and come from a Western base that has contracted for thirty years without attracting investment. Lead times past 26 months are the visible result. Qualification takes eighteen months, so the decision has to precede the constraint rather than follow it.
Gross Margin: 15%-30%

How Engine Demand Renews

Engine demand renews on two clocks. The unit sale is a capital event happening once per installation, cyclical and lumpy and dependent on somebody's investment decision. Parts and service run continuously across twenty-five years afterwards, with overhaul intervals near 24,000 hours bringing prime power units back roughly every three years. That second clock is the business, and the first exists mainly to wind it.
Stickiness varies enormously by vertical. Data centre operators with dealer service contracts almost never change supplier, since uptime risk outweighs any parts saving. Rail operators run their own workshops and buy parts wherever they are cheapest, which makes that installed base less valuable than the unit count suggests. Marine sits between the two, sticky in coastal operations with regular home ports and loose in deep-sea trades that overhaul wherever the vessel happens to be.

The buyer has changed and most sales organisations have not. Engine selection once sat with plant engineers and naval architects weighing fuel consumption and footprint. It increasingly sits with data centre capacity planners who care about delivery date above everything, and with shipowners weighing regulatory exposure a decade out. Neither of those buyers has ever compared specific fuel consumption curves.
high-speed-engine-market-end-use-penetration-index-1787553263127

Where To Place The Bet

These are among the four positions where our research anticipates prominent divergence between winners and laggards over the coming forecast period. Each is grounded in the demand model, the regulatory perimeter, and the announced capacity pipeline.
01 / CAPACITY ALLOCATION DISCIPLINE

Allocate scarce engines by lifetime value

With lead times past 26 months a manufacturer is choosing customers rather than winning them, and each allocation decision sets twenty-five years of parts and service revenue that provides 44% of the top line and considerably more of the profit. A unit sent to a buyer who will overhaul at an independent yard is a permanent loss rather than a delayed sale. Allocating by order date is the industry default and it is quietly expensive in ways nobody measures at all.
02 / CONVERSION-READY PLATFORM POSITIONING

Sell optionality, not alternative fuel capability

Around 18% of new marine orders now carry alternative fuel provision and none of it saves money at current prices, because bunkering infrastructure for methanol and hydrogen barely exists anywhere a vessel actually trades today. What the owner is buying is insurance against a regulation that has not arrived yet, which a conversion-ready platform delivers at a small fraction of the cost of full capability. Manufacturers pushing complete systems are losing tenders to competitors who understood the question being asked.
03 / FOUNDRY QUALIFICATION TIMING

Qualify casting capacity before the next squeeze

Castings set around 33% of engine cost and the binding constraint on output is foundry supply rather than assembly, which is why expanding assembly capacity moved lead times almost not at all this year. Qualification of a new foundry takes eighteen months of process validation and dimensional verification, so the decision has to be made before demand arrives rather than after it has already arrived. Manufacturers starting that work now will convert the next surge into revenue instead of apologies and lost orders.
04 / BALANCING PLANT PACKAGING

Sell dispatch capability, not gas engines

A utility building a fast-start balancing plant wants controls, grid interface and a performance guarantee, and a manufacturer supplying only engines hands the integration margin to somebody else for no particularly good reason. Spark-ignited gas grows at 8.6% whether or not anybody packages it, and the packaged sale carries higher value per megawatt alongside a service contract that locks the aftermarket for decades afterwards. The capability required is project engineering, which is a hire rather than a decade-long research programme.

Engagement Snapshot From the Field

A live engagement with an industry participant carrying material or product regulatory and market exposure ahead of a defining policy shift, showing how our research translates into a defensible multi-year portfolio strategy.
MARKET MINDS ADVISORY · CLIENT ENGAGEMENT SUMMARY
High-Speed Engine Producer Strategic Portfolio Review and Transition Roadmap 2026·Investment Scenario on High-Speed Engine Exposure Evaluation 2025-26
CLIENT PROFILE
A European power systems manufacturer with annual revenue around EUR 3.1 billion (client-reported, unverified by MMA), of which high-speed engines and gensets accounted for roughly 70%. Order intake had roughly doubled across two years on data centre demand and delivery lead times had extended past two years. The commercial organisation was allocating capacity strictly by order date, which nobody had ever questioned.
STRATEGIC CHALLENGE
The board was considering a capital programme to expand casting and machining capacity, estimated at roughly EUR 240 million (client-reported, unverified by MMA), and could not establish whether the demand justifying it would persist. Separately, aftermarket attachment on recently delivered units was running below the company's historical average and nobody could explain why.
MMA APPROACH
MMA modelled lifetime revenue by customer type across the client's order book, separating buyers with dealer service contracts from those with in-house or independent maintenance. Data centre construction pipelines and grid connection policy across the client's launch markets were reviewed for how long backup demand plausibly persists. Foundry qualification lead times and available Asian capacity were benchmarked through the expert interview programme.
KEY FINDINGS
  1. Allocating strictly by order date had directed roughly a third of scarce capacity to buyers who would never purchase parts, which explained the aftermarket attachment decline entirely.
  2. Lifetime revenue per unit varied by more than a factor of two between customer types, a difference the commercial organisation had never measured or acted upon.
  3. Grid connection policy in two of the client's largest markets was actively steering data centre operators away from diesel backup, which materially shortened the plausible demand horizon.
  4. Qualifying two additional Asian foundries would recover most of the constrained output at a fraction of the proposed capital programme and without leaving stranded assets afterwards.
CLIENT PROFILE
A European power systems manufacturer with annual revenue around EUR 3.1 billion (client-reported, unverified by MMA), of which high-speed engines and gensets accounted for roughly 70%. Order intake had roughly doubled across two years on data centre demand and delivery lead times had extended past two years. The commercial organisation was allocating capacity strictly by order date, which nobody had ever questioned.
STRATEGIC CHALLENGE
The board was considering a capital programme to expand casting and machining capacity, estimated at roughly EUR 240 million (client-reported, unverified by MMA), and could not establish whether the demand justifying it would persist. Separately, aftermarket attachment on recently delivered units was running below the company's historical average and nobody could explain why.
MMA APPROACH
MMA modelled lifetime revenue by customer type across the client's order book, separating buyers with dealer service contracts from those with in-house or independent maintenance. Data centre construction pipelines and grid connection policy across the client's launch markets were reviewed for how long backup demand plausibly persists. Foundry qualification lead times and available Asian capacity were benchmarked through the expert interview programme.
KEY FINDINGS
  1. Allocating strictly by order date had directed roughly a third of scarce capacity to buyers who would never purchase parts, which explained the aftermarket attachment decline entirely.
  2. Lifetime revenue per unit varied by more than a factor of two between customer types, a difference the commercial organisation had never measured or acted upon.
  3. Grid connection policy in two of the client's largest markets was actively steering data centre operators away from diesel backup, which materially shortened the plausible demand horizon.
  4. Qualifying two additional Asian foundries would recover most of the constrained output at a fraction of the proposed capital programme and without leaving stranded assets afterwards.
RECOMMENDED STRATEGY
Phase 1: Phase one: reallocate remaining capacity by modelled lifetime value rather than order date, and rewrite the sales incentive that rewards order intake alone. Phase 2: Phase two: qualify two Asian foundries immediately rather than funding the capital programme, accepting eighteen months of validation work before any output arrives. Phase 3: Phase three: attach long-term service agreements at the point of order rather than after commissioning, when the customer has considerably less reason to sign one.
OUTCOME
The capital programme was deferred and two Asian foundries entered qualification, at a cost the client reported as roughly EUR 18 million (client-reported, unverified by MMA). Allocation now runs on modelled lifetime value. Service agreement attachment at order has risen and the client reports the aftermarket forecast has changed materially.

Frequently Asked Questions

Foundational context covering the market sizes, CAGR, scope, country, region and competition that inform every finding below. This section is provided to cover basics and most often pre-purchase conversations, answered from the MMA Primary Research Dataset.

What is the current size of the High-Speed Engine Market?

The market was valued at USD 21.4 billion in 2025, rising to an estimated USD 22.98 billion in 2026. North America holds the largest regional share at 29% of value.

How large will the High-Speed Engine Market be by 2036?

MMA forecasts USD 46.93 billion by 2036 under the base case, an expansion multiple of 2.04 times the 2026 value. That represents USD 23.95 billion of incremental value.

What is the CAGR for the High-Speed Engine Market 2026 to 2036?

The base case runs at 7.4% compound annual growth between 2026 and 2036, with a bull case at 8.7% and a bear case at 6.2%. Historical growth from 2020 to 2025 was 6.0%.

Which segment is growing fastest?

Dual-fuel engines lead at 11.1%, half again the market rate, driven by marine emissions rules rather than fuel economics. Alternative-fuel capable platforms follow at 10.4%.

Who are the major companies in the High-Speed Engine Market?

Caterpillar, Cummins, Rolls-Royce Power Systems, Yanmar Holdings and Volvo Penta hold 51% between them. Dealer network reach and emissions engineering depth sustain those positions rather than manufacturing scale.

Which country is growing fastest?

India leads at 10.2%, driven by industrial standby demand where grid supply genuinely fails and by data centre construction arriving on top of it. Both grow independently.

Report Segmentation Architecture

The full report scope spans multiple orthogonal segmentation dimensions, with cross-tabulated demand data provided for each dimension pair. Coverage extends further to regional breakdowns, trend trajectories, and the competitive detail needed to support segment-level decision-making.

By Fuel and Combustion Configuration

  • High-Speed Diesel Engines
  • Spark-Ignited Natural Gas Engines
  • Dual-Fuel Engines
  • Alternative-Fuel Capable Engines
  • Heavy Fuel and Multi-Fuel Engines
  • Biofuel and Renewable Diesel Optimised Engines

By End-Use Industry

  • Marine Propulsion and Auxiliary
  • Data Centre Backup Power
  • Industrial and Commercial Standby
  • Grid Balancing and Distributed Generation
  • Rail Traction
  • Mining and Remote Site Power

By Sales Model

  • Direct Manufacturer Supply
  • Dealer Network Supply
  • Packaged Plant Contracting
  • Original Equipment Integration
  • Long-Term Service Agreement

By Region

  • North America
  • Western Europe
  • East Asia
  • South Asia and Pacific
  • Latin America
  • Middle East and Africa
  • Eastern Europe

Scope, Methodology, and Coverage

Every figure in this report is reproducible from documented input assumptions. The scope below maps the historical period, the forecast horizon, the segmentation dimensions, and the countries covered, alongside the underlying primary and qualitative methodology.
Historical Period
2020 to 2025
Forecast Period
2026 to 2036
Base Year
2025 (USD billions; MMA Primary Research Dataset, August 2026)
Market Definition
The market comprises reciprocating internal combustion engines rated above 1,000 revolutions per minute supplied for marine propulsion and auxiliary duty, stationary and mobile power generation, and rail traction, across diesel, spark-ignited gas, dual-fuel and alternative-fuel configurations. Value is measured at engine manufacturer level and includes packaged generating sets. Medium-speed and low-speed marine engines below 1,000 revolutions per minute, on-highway truck and bus engines, gas turbines, portable generators under 50 kilowatts, battery energy storage, and fuel cell systems fall outside scope.
Quantitative Units
USD billions (current prices); thousand engine units shipped annually; USD per kilowatt of installed output by configuration
Segmentation Dimensions
By Fuel and Combustion Configuration; By End-Use Industry; By Sales Model; By Region
Regions Covered
North America, Western Europe, East Asia, South Asia and Pacific, Latin America, Middle East and Africa, Eastern Europe
Countries Covered
United States, Canada, Mexico, Germany, France, United Kingdom, Italy, Netherlands, Norway, Sweden, Finland, Denmark, Poland, Czechia, Hungary, China, Japan, South Korea, Taiwan, India, Singapore, Indonesia, Thailand, Australia, Brazil, Chile, Argentina, Saudi Arabia, United Arab Emirates, South Africa
Key Companies Profiled
Caterpillar, Cummins, Rolls-Royce Power Systems, Yanmar Holdings, Volvo Penta, Wärtsilä, MAN Energy Solutions, Deutz, Scania, Mitsubishi Heavy Industries, Weichai Power, HD Hyundai Infracore, Daihatsu Diesel, John Deere Power Systems, Isuzu Motors, Kubota, FPT Industrial, Liebherr, Moteurs Baudouin, Guangxi Yuchai Machinery
Quantitative Methodology
Primary survey, n=3,800 respondents, Q4 2025, six countries; demand-side model with trade association cross-validation
Qualitative Methodology
47 expert interviews, Q4 2025; applied to validate demand model assumptions, identify emerging dynamics, and assess competitive positioning
Report Format
PDF and XLSX data workbook (Word format preview document)
Publisher
Market Minds Advisory
Report Code
MMA-2026-CON-231
Published
August 2026
Contact
sales@marketmindsadvisory.com | www.marketmindsadvisory.com

Purchase the full High-Speed Engine Market Report (2026 to 2036).

The full report sizes the global high-speed engine market to 2036 across six fuel and combustion configurations and seven regions, measured at engine manufacturer level across marine, generation and rail applications. It separates data centre backup demand from marine and grid balancing throughout, since the three move independently and are routinely reported together. Competitive analysis covers 20 participants evaluated on engine revenue at manufacturer level, with moat and risk assessment for the two leaders. Aftermarket economics are traced from overhaul intervals through to service agreement attachment, and input cost exposure runs from foundry supply to fixed-price project quotation. Four quantified revenue levers close the analysis.
Six-configuration segment sizing with segment-level growth rates
Seven-region share and growth breakdown to 2036
Twenty-participant competitive map on one revenue basis
Aftermarket lifetime value modelled by customer and vertical
Input cost exposure traced to foundry and casting supply
Four quantified revenue levers with commercial impact ranges

Built For The People Who Decide

From boardroom strategy to bench-side execution, this report is read cover-to-cover by leaders shaping the next decade of their industry, turning demand scenarios, market dynamics and valuation benchmarks into decisions.
CXOs/ Presidents/ VPs/ Managers
M&A and Corporate Development
Strategy Teams and R&D Heads
Procurement and Product Directors
Regulatory and Compliance Leaders
Investor Relations and Equity Analysts