Market Minds Advisory
High Purity Solvents Market

High Purity Solvents Market: Fabs, Cells, and Scarce Capacity

Battery electrolyte and semiconductor fabs now outbid pharmaceutical buyers for the same ultra-high-purity solvent capacity, forcing qualified producers to allocate scarce cleanroom-grade output across customers who cannot easily substitute one solvent grade for another.

Lead Analyst

Bilal Shaikh

Published

September 2026

Make Smarter Decisions with Customized Research Insights

Request a free sample report and evaluate market opportunities, growth trends, and competitive dynamics relevant to your business needs.

2025 MARKET VALUE$3.2BMarket Size 2025
2036 FORECAST VALUE$7.5BBase Case , 2026 to 2036
CAGR 2026 TO 20368.1 %Bull 9.4% / Bear 6.9%
INCREMENTAL OPPORTUNITY$4.1BNet 10- year value creation
EXPANSION MULTIPLE2.18x2036 value over 2026 base
Strategic Levers
M&A Pipeline
Regional Outlook
Country Rankings
Competitive Intelligence
Segmental Deep-dive
Call-Us : 91 93563 13602

Executive Snapshot and Market Trajectory

Semiconductor fabs are not the only ones bidding for cleanroom-grade solvent anymore. Battery electrolyte manufacturers now compete directly for the same ultra-high-purity acetonitrile, NMP, and DMC capacity, and producers without spare qualified output are turning away long-standing pharmaceutical customers rather than expanding capacity fast enough.
Battery and energy storage is the fastest-growing application at 11.2% CAGR, more than 1.3 times the market average, as EV and grid-storage cell manufacturers scale electrolyte solvent purchases faster than producers can qualify new capacity. Geographic concentration favors East Asia, where South Korean and Chinese battery giga-factories and Japanese and Taiwanese semiconductor fabs together consume the majority of global cleanroom-grade output, while North America and Western Europe retain the deepest pharmaceutical-grade purification expertise.
Ownership concentrates among a handful of specialty chemical majors and Japanese electronic-materials specialists, since ultra-high-purity production requires cleanroom infrastructure smaller producers cannot easily replicate at comparable scale. Semiconductor-grade purity specifications keep tightening as chip geometries shrink, pushing qualification cycles longer even as demand accelerates rapidly across every major application category today. Buyers increasingly dual-source across geographies following pandemic-era disruption, rewarding producers with multiple certified sites over single-site rivals.
Market Definition
The high purity solvents market covers solvents refined to ultra-low metallic and particulate impurity thresholds, typically 99.9% purity or higher, sold for semiconductor fabrication, pharmaceutical and API synthesis, battery electrolyte formulation, and precision electronics cleaning use. It excludes standard industrial-grade and technical-grade solvents that do not meet electronic or pharmaceutical purity specifications, and finished battery cells or semiconductor devices that merely incorporate these solvents during manufacturing.
Base Year Value
$3.2B in 2025 (MMA Primary Research Dataset, August 2026)
Forecast Period
2026 to 2036, eleven discrete annual values
CAGR
8.1% base case. Bull 9.4%. Bear 6.9%.
Fastest Growth Segment
Battery and Energy Storage: 11.2% CAGR
Fastest Growth Country
South Korea: 11.8% CAGR
Fastest Growth Region
South Asia and Pacific: 10.1% CAGR
Largest Region
East Asia: 28% of 2025 global value
Market Leaders
BASF SE, Merck KGaA, Honeywell International Inc., Kanto Chemical Co., Inc., Avantor, Inc. Source: MMA Analysis based on company annual reports.
Primary Survey
n=3,800 procurement and R&D decision-makers, Q4 2025, six countries
Methodology
Demand-side build-up, cross-validated against public data, 47 expert interviews

High Purity Solvents Market Forecast Scenarios

high-purity-solvents-market-size-forecast-scenario-1787552917602
High purity solvent demand grew steadily across 2020 to 2025, expanding at a 7.0% historical CAGR as semiconductor fab construction accelerated following the 2021 chip shortage while battery electrolyte demand began scaling meaningfully only after 2022 as EV production ramped globally. Pharmaceutical-grade demand remained the most stable sub-segment throughout, growing predictably alongside generic drug manufacturing capacity additions across India and China.
The base case carries the market to an 8.1% CAGR through three mechanisms. First, battery giga-factory expansion across South Korea, China, and increasingly the United States pulls electrolyte solvent demand ahead of new qualified production capacity. Second, semiconductor fab construction tied to CHIPS Act and equivalent Asian and European subsidy programs keeps expanding cleanroom-grade demand as new fabs require independently qualified solvent supply chains. Third, generic pharmaceutical manufacturing expansion across India sustains steady API-grade solvent demand growth throughout the forecast period.
The bull case reaches 9.4% if two or more additional battery giga-factories reach full electrolyte-grade solvent qualification faster than currently planned, pulling demand sharply forward. The bear case falls to 6.9% if semiconductor capital spending slows amid a cyclical chip demand downturn, delaying new fab construction and the qualified solvent supply contracts that typically accompany each new facility.

Where Qualification Scarcity Beats Raw Capacity

High purity solvents sit at the convergence of three demand-side booms happening simultaneously. Semiconductor fabs, battery giga-factories, and generic pharmaceutical manufacturers all compete for the same limited pool of cleanroom-qualified production capacity, even though each buyer group specifies different impurity thresholds and testing protocols entirely. That overlap is straining a supply base that expanded slowly for decades before facing three simultaneous demand shocks within a single five-year window.
MARKET CONCENTRATIONCR5: 54%Top five producers hold over half global capacity
AVERAGE SELLING PRICE$4.20/kgSemiconductor-grade solvent commands a consistently steep price premium
TOP PRODUCER SHAREJapan: 22%Japan supplies roughly a fifth of global output
CAPACITY UTILISATION81%Qualified cleanroom lines run near full operating capacity
EXPORT TRADE INTENSITY36%More than a third of tonnage crosses borders
R&D COST SHARE16% of COGSPurification research absorbs a consistently meaningful cost share
Commercially, qualification depth separates this market more than price does. Semiconductor customers requalify a solvent supplier against parts-per-trillion metallic impurity specifications before approving a source, and rarely switch once validated given the cost of requalifying an entire fabrication process. Pharmaceutical buyers show comparable rigidity for regulatory reasons, since any solvent change in an approved drug manufacturing process triggers fresh regulatory filing requirements.
Over the next decade, capacity allocation discipline will matter as much as raw production growth, since qualified cleanroom capacity cannot be built overnight regardless of capital available. Producers who prioritize long-term contracted customers over opportunistic spot sales during tight periods will preserve the qualification relationships that generate durable multi-year revenue streams. Capacity discipline, more than chemistry innovation, will decide who captures the next decade of growth.
"Everyone assumes this is a chemistry story. It's actually an allocation story. The producers winning right now are the ones deciding whose call to take when they can't supply everyone."
Director, Specialty Chemicals and Electronic Materials Practice · MMA Chemicals and Materials / Electronic and Specialty Chemicals Practice · August 2026

Market Trends

Battery Giga-Factories Outbid Semiconductor Fabs For Solvent Capacity

Battery electrolyte manufacturers require ultra-high-purity NMP, DMC, and acetonitrile at volumes that have grown faster than qualified production capacity can expand, and several giga-factory operators have begun offering premium pricing to secure allocation that previously went to semiconductor or pharmaceutical customers by default. South Korean and Chinese battery makers, racing to lock in supply ahead of planned capacity additions across Europe and North America, have signed multi-year offtake agreements directly with solvent producers rather than distributors. This directly competing demand is forcing producers to make allocation decisions that were largely unnecessary before 2022.
Market Impact: Adds demand from 12 new fabs
Chip Geometry Shrinkage Tightens Solvent Purity Thresholds

As semiconductor manufacturers move toward smaller process nodes, acceptable metallic and particulate impurity thresholds in cleaning and photoresist solvents keep tightening, often into the parts-per-trillion range for advanced logic and memory fabrication. Producers unable to consistently hit these tighter specifications risk losing qualification entirely rather than simply competing on price, since a single contamination event can compromise an entire wafer batch and trigger a costly supplier requalification process. Leading producers including Kanto Chemical and Stella Chemifa have invested heavily in purification and analytical testing capability specifically to serve advanced-node fabs, widening the gap between qualified and merely adequate suppliers.
Market Impact: Battery segment grows 1.4 times faster

Market Opportunities and Growth Drivers

CHIPS Act And Global Fab Subsidies Expand Cleanroom Demand

Government semiconductor subsidy programs, including the American CHIPS Act, the European Chips Act, and comparable programs in Japan, South Korea, and India, are funding a wave of new fab construction that each require independently qualified solvent supply chains before production can begin. Every new fab represents a multi-year qualification opportunity for solvent producers, since fabs typically qualify two or three suppliers per grade to ensure supply security rather than single-sourcing critical inputs. Intel, TSMC, and Samsung have all announced new fab construction in the United States since 2022, each requiring fresh solvent supplier qualification.
Market Impact: Adds 6 to 9 months delay

EV Battery Production Scales Electrolyte Solvent Consumption

Global EV production keeps scaling, and every battery cell requires electrolyte solvent, typically a blend of ethylene carbonate, dimethyl carbonate, and other high-purity components, in volumes that track cell manufacturing capacity directly. South Korean, Chinese, and increasingly American and European giga-factories have added substantial new cell production capacity since 2022, and each new facility requires qualified electrolyte solvent supply before commercial production can begin at scale. This demand is also pulling investment toward domestic solvent production capacity in regions that previously relied entirely on imports. Domestic capacity investment is accelerating across several regions simultaneously.
Market Impact: Adds 15% to dual-sourcing costs

Market Restraints and Challenges

Qualified Capacity Cannot Expand As Fast As Demand

Building new ultra-high-purity solvent production capacity requires cleanroom infrastructure and extensive analytical qualification that takes years to complete, a root cause that is fundamentally an engineering and regulatory timeline constraint rather than a capital availability problem. The commercial impact shows up as allocation shortages during demand surges, forcing some customers, typically smaller or newer buyers, to accept longer lead times or seek alternative suppliers who may not fully meet specification requirements. Producers are responding by expanding capacity at existing qualified sites and by prioritizing long-term contracted volume. Buyers accustomed to abundant supply are adjusting expectations accordingly.
Market Impact: Diverts 10% of capacity to batteries

Single-Country Concentration Raises Geopolitical Supply Risk

A meaningful share of global ultra-high-purity solvent production concentrates in Japan and a handful of other East Asian countries, a root cause rooted in decades of accumulated purification expertise that is genuinely difficult to replicate quickly elsewhere. The commercial impact became visible during Japan's 2019 export restrictions on select high-purity chemicals to South Korea, which briefly disrupted Korean semiconductor production planning and highlighted the risk of concentrated single-country supply. Buyers are responding by qualifying second-source suppliers in different countries and supporting domestic capacity development elsewhere. Diversification now ranks among the top supply chain priorities industry-wide.
Market Impact: Advanced-node demand grows 1.2 times faster
3 additional market trends, 3 additional growth drivers, and 3 additional restraints and challenges are covered in the full report. Contact sales@marketmindsadvisory.com to access the complete intelligence.

Segment CAGR and Growth Architecture

Segmentation follows end-use application, a single commercial logic tracking who specifies purity threshold, testing protocol, and qualification pathway. Semiconductor manufacturing, pharmaceutical and API synthesis, battery and energy storage, electronics and PCB, specialty coatings, and general industrial use each demand distinct purification levels, so commercial position tracks application-specific qualification rather than base solvent chemistry alone.
high-purity-solvents-market-market-share-analysis-1787552918399

Battery and Energy Storage

Battery and energy storage is the fastest-growing high purity solvent application at 11.2% CAGR, roughly 1.4 times the overall market rate, as EV and grid-storage cell manufacturers scale electrolyte solvent purchases faster than producers can qualify new capacity. Ethylene carbonate, dimethyl carbonate, and acetonitrile represent the largest volume electrolyte components, each requiring tight moisture and metallic impurity control since even trace contamination can degrade battery cycle life measurably. South Korean and Chinese battery giga-factories have signed multi-year offtake agreements directly with solvent producers, securing allocation that previously went to semiconductor or pharmaceutical customers. That direct competition for scarce qualified capacity makes this segment's growth durable rather than speculative. Few other electronic material categories can claim comparable demand certainty.
CAGR 11.2%

Semiconductor Manufacturing

Semiconductor manufacturing remains the second-fastest segment at 9.8% CAGR and the largest by current revenue, anchored by wafer cleaning, photoresist, and etching process solvents that require parts-per-trillion metallic impurity control for advanced logic and memory fabrication. CHIPS Act and equivalent Asian and European subsidy programs are funding a wave of new fab construction, and each new facility requires independently qualified solvent supply chains, typically qualifying two or three suppliers per grade for supply security. Kanto Chemical and Stella Chemifa have both expanded advanced-node qualified capacity since 2022, widening the gap between suppliers capable of meeting the tightest specifications and those serving only legacy nodes. Growth here remains more predictable than battery demand, since construction timelines are announced years in advance.
CAGR 9.8%
Full segment breakdown across 6 segments available in the complete report.

Regional Architecture and Country Demand Map

East Asia leads at 28% of 2025 value on Japanese, South Korean, and Taiwanese manufacturing clusters, narrowly ahead of North America's pharmaceutical and fab-construction demand base. South Asia and Pacific posts the fastest regional growth as Indian pharmaceutical and emerging electronics manufacturing scale beyond East Asian centers.

North America

North America holds 26% of value, anchored by CHIPS Act-driven fab construction from Intel, TSMC, and Samsung's new American facilities alongside Honeywell and Avantor's domestic high-purity production capacity. The region's pharmaceutical-grade solvent demand also remains substantial, supported by generic and branded drug manufacturing across multiple states. Growth of 8.4% sits close to the global base rate, reflecting genuine new fab-driven demand offset partly by the multi-year lag between subsidy announcement and actual qualified solvent supply contract signing. Domestic production capacity expansion, encouraged by both CHIPS Act incentives and growing concern about East Asian supply concentration, is gradually reducing the region's historical reliance on imported cleanroom-grade material from Japan and South Korea specifically.
Share: 26% | CAGR: 8.4% (2026 to 2036)

Western Europe

Western Europe underperforms the base rate at 6.6%, reflecting a smaller domestic semiconductor and battery manufacturing base relative to East Asia and North America, even as the European Chips Act attempts to close that gap through direct subsidy. BASF, Merck KGaA, and Solvay all maintain significant high-purity solvent production capacity, serving both domestic fabs and export pharmaceutical customers across Germany, France, and Switzerland. German battery cell manufacturing investment, though smaller in scale than Asian giga-factories, is beginning to pull incremental electrolyte solvent demand regionally. The region's growth trajectory depends significantly on whether European Chips Act-funded fab construction proceeds on the timeline currently announced, since delays have already pushed some qualification-driven demand later than initially projected.
Share: 20% | CAGR: 6.6% (2026 to 2036)
Regional intelligence for 5 additional markets available in the complete report: East Asia, South Asia and Pacific, Latin America, Middle East and Africa, Eastern Europe. Contact sales@marketmindsadvisory.com.
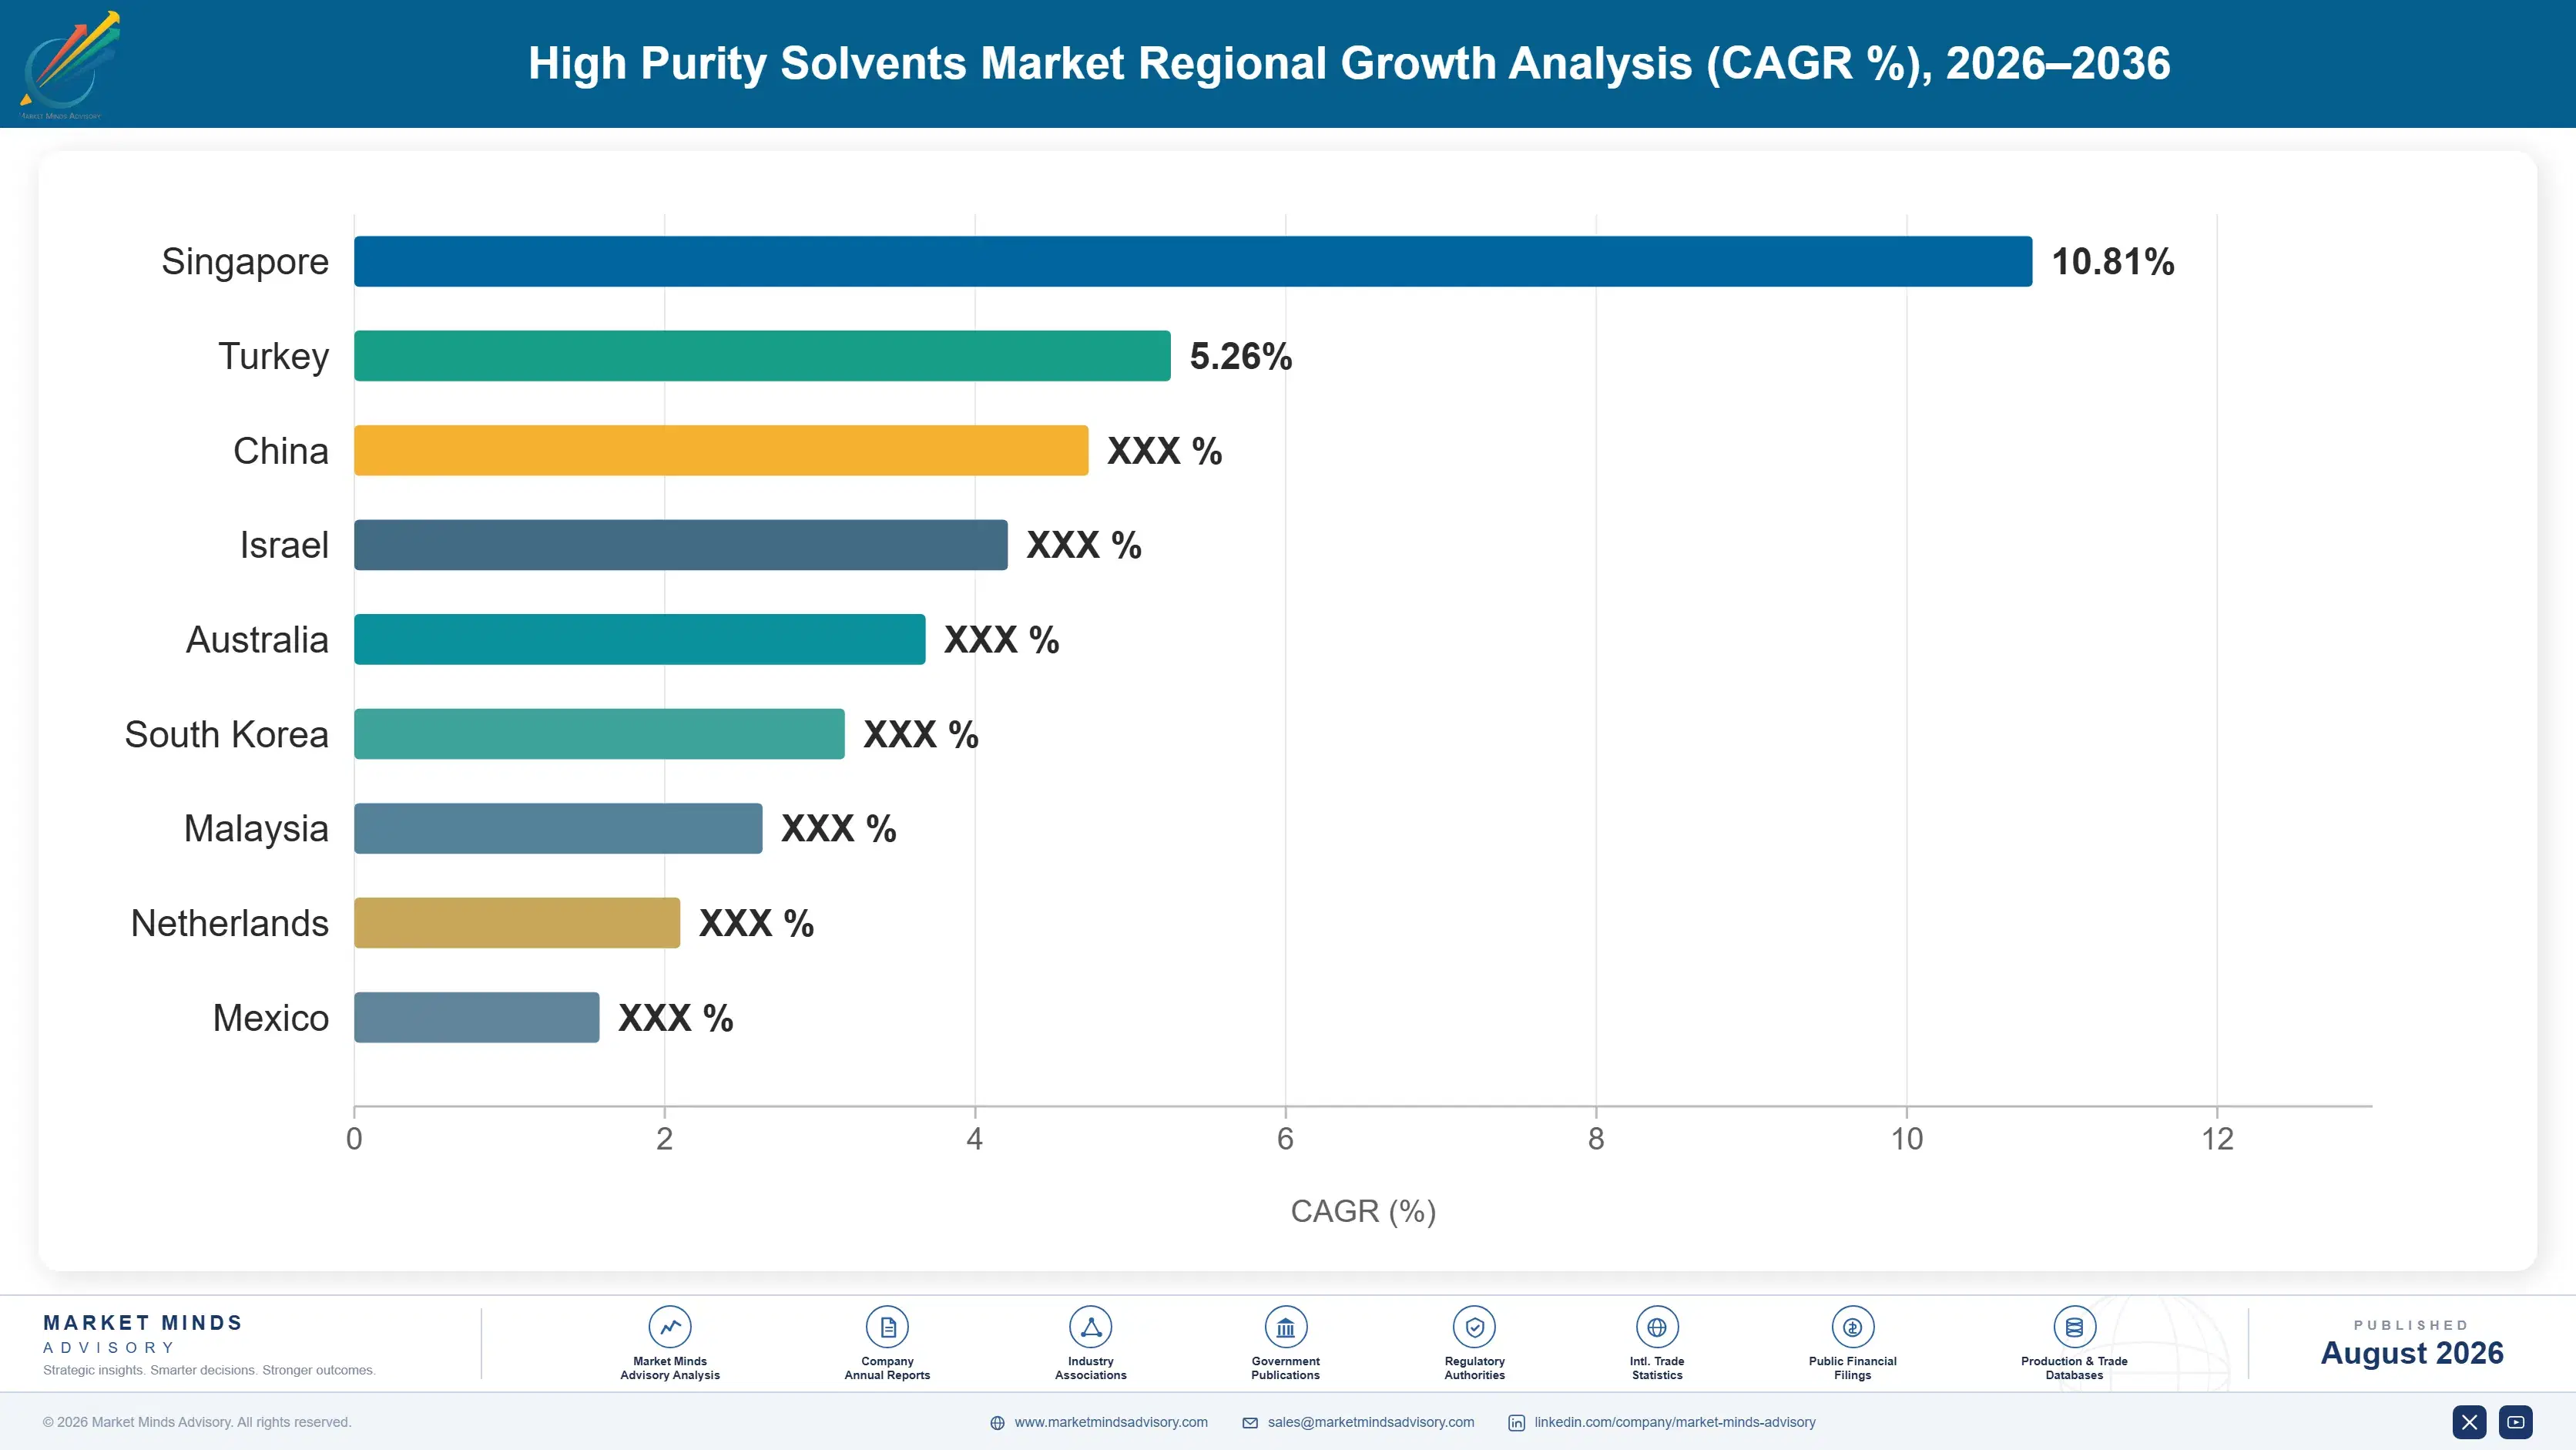
high-purity-solvents-market-country-cagr-analysis-1787552919216

Where Solvent Producers Capture Real Value

Margin in this market concentrates in qualification depth and allocation discipline, not raw production volume. The framing below identifies four commercial moves that shift revenue toward long-term contracted customers, advanced-node qualification, and capacity investment that basic commodity solvent sale cannot capture, each grounded in where buyers already pay a premium: purity consistency, supply security, and qualification speed.

Prioritize Long-Term Contracts Over Opportunistic Spot Sales

During periods of tight qualified capacity, producers face a choice between selling opportunistically at elevated spot prices or preserving allocation for long-term contracted customers who provide durable multi-year revenue visibility. Producers who prioritize contracted relationships build customer loyalty that pays off during the next demand surge, when contracted customers remember which suppliers protected their allocation during the previous shortage. This matters especially in semiconductor and pharmaceutical applications, where switching requires costly requalification customers actively avoid repeating. Producers who built this reputation through 2022 and 2023 are now winning first refusal on new qualification opportunities.
Market Impact: Contract renewal rates reach roughly 90% for loyal suppliers

Invest In Advanced-Node Qualification Ahead Of Fab Construction

Semiconductor fab construction is publicly announced years before production begins, giving solvent producers advance notice to invest in the purification and analytical testing capability needed to qualify for advanced-node specifications before competitors even begin the process. Kanto Chemical and Stella Chemifa have both demonstrated this playbook, securing qualification with new fabs before construction completed, locking in multi-year supply relationships competing producers cannot easily match. This positioning matters because fabs typically qualify only two or three suppliers per grade, meaning late qualifiers may be locked out for a facility's operating life, capturing roughly 20% of new fab volume.
Market Impact: Early qualification captures roughly 20% of new fab volume

Build Domestic Capacity In Under-Served Growth Regions

India, Vietnam, and parts of Latin America are scaling electronics and pharmaceutical manufacturing faster than domestic high-purity solvent production capacity can follow, leaving these regions dependent on imports that carry longer lead times and currency risk for local buyers. Producers who build qualified production capacity directly in these under-served regions capture both the logistics advantage of proximity and the government incentive support many countries now offer. This is a longer-term play than serving East Asian demand, but early movers face materially less competition, and incentive programs can offset construction costs, cutting delivered lead times by roughly 40% for local buyers.
Market Impact: Regional production cuts delivered lead times by 40%

Offer Dual-Sourcing Programs To Reduce Buyer Concentration Risk

Buyers increasingly want to reduce single-country supply concentration following Japan's 2019 export restriction episode, and producers who proactively offer dual-sourcing programs across multiple certified production sites in different countries win specification from risk-conscious procurement teams even at a modest price premium over single-source alternatives. This works particularly well with semiconductor and battery customers, who treat supply chain resilience as a board-level risk management priority following pandemic-era disruption experience across their broader supply base. Producers offering multi-site qualified capacity have reported winning specification from customers explicitly seeking to reduce concentration risk, even when a single-source competitor offered a marginally lower price.
Market Impact: Multi-site suppliers command a 5% to 8% premium

Who Controls the Margin Pool

Concentration is moderately high: the top five producers hold an estimated 54% of global qualified capacity, measured on a consistent basis of certified cleanroom-grade production capacity across applications. The gap between leader and challenger is substantial, since purification infrastructure and decades of qualification history create real barriers smaller entrants cannot quickly overcome.
Competitive activity currently runs along three lines. First, advanced-node qualification: producers race to meet tightening semiconductor purity specifications, since this is where the highest margin now concentrates. Second, battery electrolyte allocation: producers negotiate long-term offtake agreements directly with giga-factory operators rather than serving spot demand. Third, geographic diversification: several majors are building qualified capacity outside East Asia to serve buyers seeking reduced concentration risk.

Pressure is building from demand growing faster than qualified capacity can expand, rewarding producers with disciplined allocation strategy over those chasing every spot sale opportunistically. Producers slow to invest in advanced-node qualification risk losing specification to faster-moving competitors as chip geometries shrink, even ones with larger capacity. Meanwhile, geopolitical concentration risk rewards multi-country footprints over single-site specialists. Rankings will likely shift toward whichever five producers best combine qualification depth with geographic diversification.
high-purity-solvents-market-company-positioning-matrix-1787552920064

Competitive Moat and Risk Dimensions

BASF SE

Moat: Global Multi-Site Production Footprint

BASF operates high-purity solvent production across multiple countries and continents, giving it both geographic diversification that risk-conscious semiconductor and battery customers increasingly value and the scale to absorb capital-intensive cleanroom infrastructure investment that smaller regional competitors cannot easily match. Its broad customer base spans pharmaceutical, electronics, and battery applications.
BASF SE

Risk: Broad Focus Limits Specialization Depth

BASF's diversified focus across many chemical categories, while a scale advantage, can mean less specialized investment in the most advanced semiconductor purity qualification relative to Japanese specialists like Kanto Chemical who concentrate resources entirely on electronic-materials purification and analytical capability development over time. That gap is difficult to close quickly.
MERCK KGAA

Moat: Deep Semiconductor-Grade Qualification History

Merck's EMD Performance Materials division holds decades of accumulated qualification history with leading semiconductor fabs worldwide, giving it a trusted-supplier position that newer entrants cannot replicate regardless of how much capital they invest in matching purity specifications alone across comparable applications and regions. Few rivals can match that track record.
MERCK KGAA

Risk: Concentrated Exposure To Semiconductor Cycles

Merck's electronic-materials business carries meaningful exposure to semiconductor industry capital spending cycles, which have historically proven volatile, meaning a cyclical chip demand downturn could compress this segment's revenue more sharply than for competitors with a more diversified end-market customer base and application spread. Diversification remains a work in progress.

Players Tracked

Prominent Players

BASF SE
Merck KGaA
Honeywell International Inc.
Kanto Chemical Co., Inc.
Avantor, Inc.

Other Key Players

Mitsubishi Chemical Corporation
Sumitomo Chemical Co., Ltd.
Tokuyama Corporation
Stella Chemifa Corporation
Fujifilm Electronic Materials
DuPont de Nemours, Inc.
Solvay S.A.
Eastman Chemical Company
Central Glass Co., Ltd.
Wako Pure Chemical Industries
Ultra Pure Chemicals Co., Ltd
Air Water Inc.
SK Materials
Soulbrain Co., Ltd.
ENEOS Corporation

Recent Developments

MARCH 2024

SK Materials Signs Multi-Year Battery Electrolyte Supply Deal

SK Materials signed a multi-year electrolyte solvent supply agreement in March 2024 with a major South Korean battery giga-factory operator, securing allocation ahead of planned capacity expansion. This was a commercial supply contract, not a joint venture or acquisition, extending SK Materials' existing battery materials customer relationships.
Signal: A large supply contract, not a corporate deal, shows battery demand now rivals semiconductor allocation priority.
JULY 2024

Kanto Chemical Expands Advanced-Node Qualified Capacity In Japan

Kanto Chemical announced an investment to expand advanced-node qualified cleanroom production capacity at its Japanese operations in July 2024, targeting leading-edge logic and memory fabs. The expansion was an organic capacity investment, not an acquisition or joint venture, aimed at capturing tightening semiconductor purity demand.
Signal: An organic capacity expansion confirms Japanese specialists are racing to stay ahead of tightening purity thresholds.
FEBRUARY 2025

Honeywell Announces New Domestic High-Purity Production Facility

Honeywell announced construction of a new domestic high-purity solvent production facility in February 2025, targeting CHIPS Act-linked fab customers seeking reduced reliance on East Asian imports. This was an organic capacity investment, not a merger or acquisition, extending Honeywell's existing electronic materials manufacturing footprint further.
Signal: A domestic capacity buildout, not a deal, reflects growing customer demand for supply diversified away from Asia.

Feedstock And Purification, Not Labor

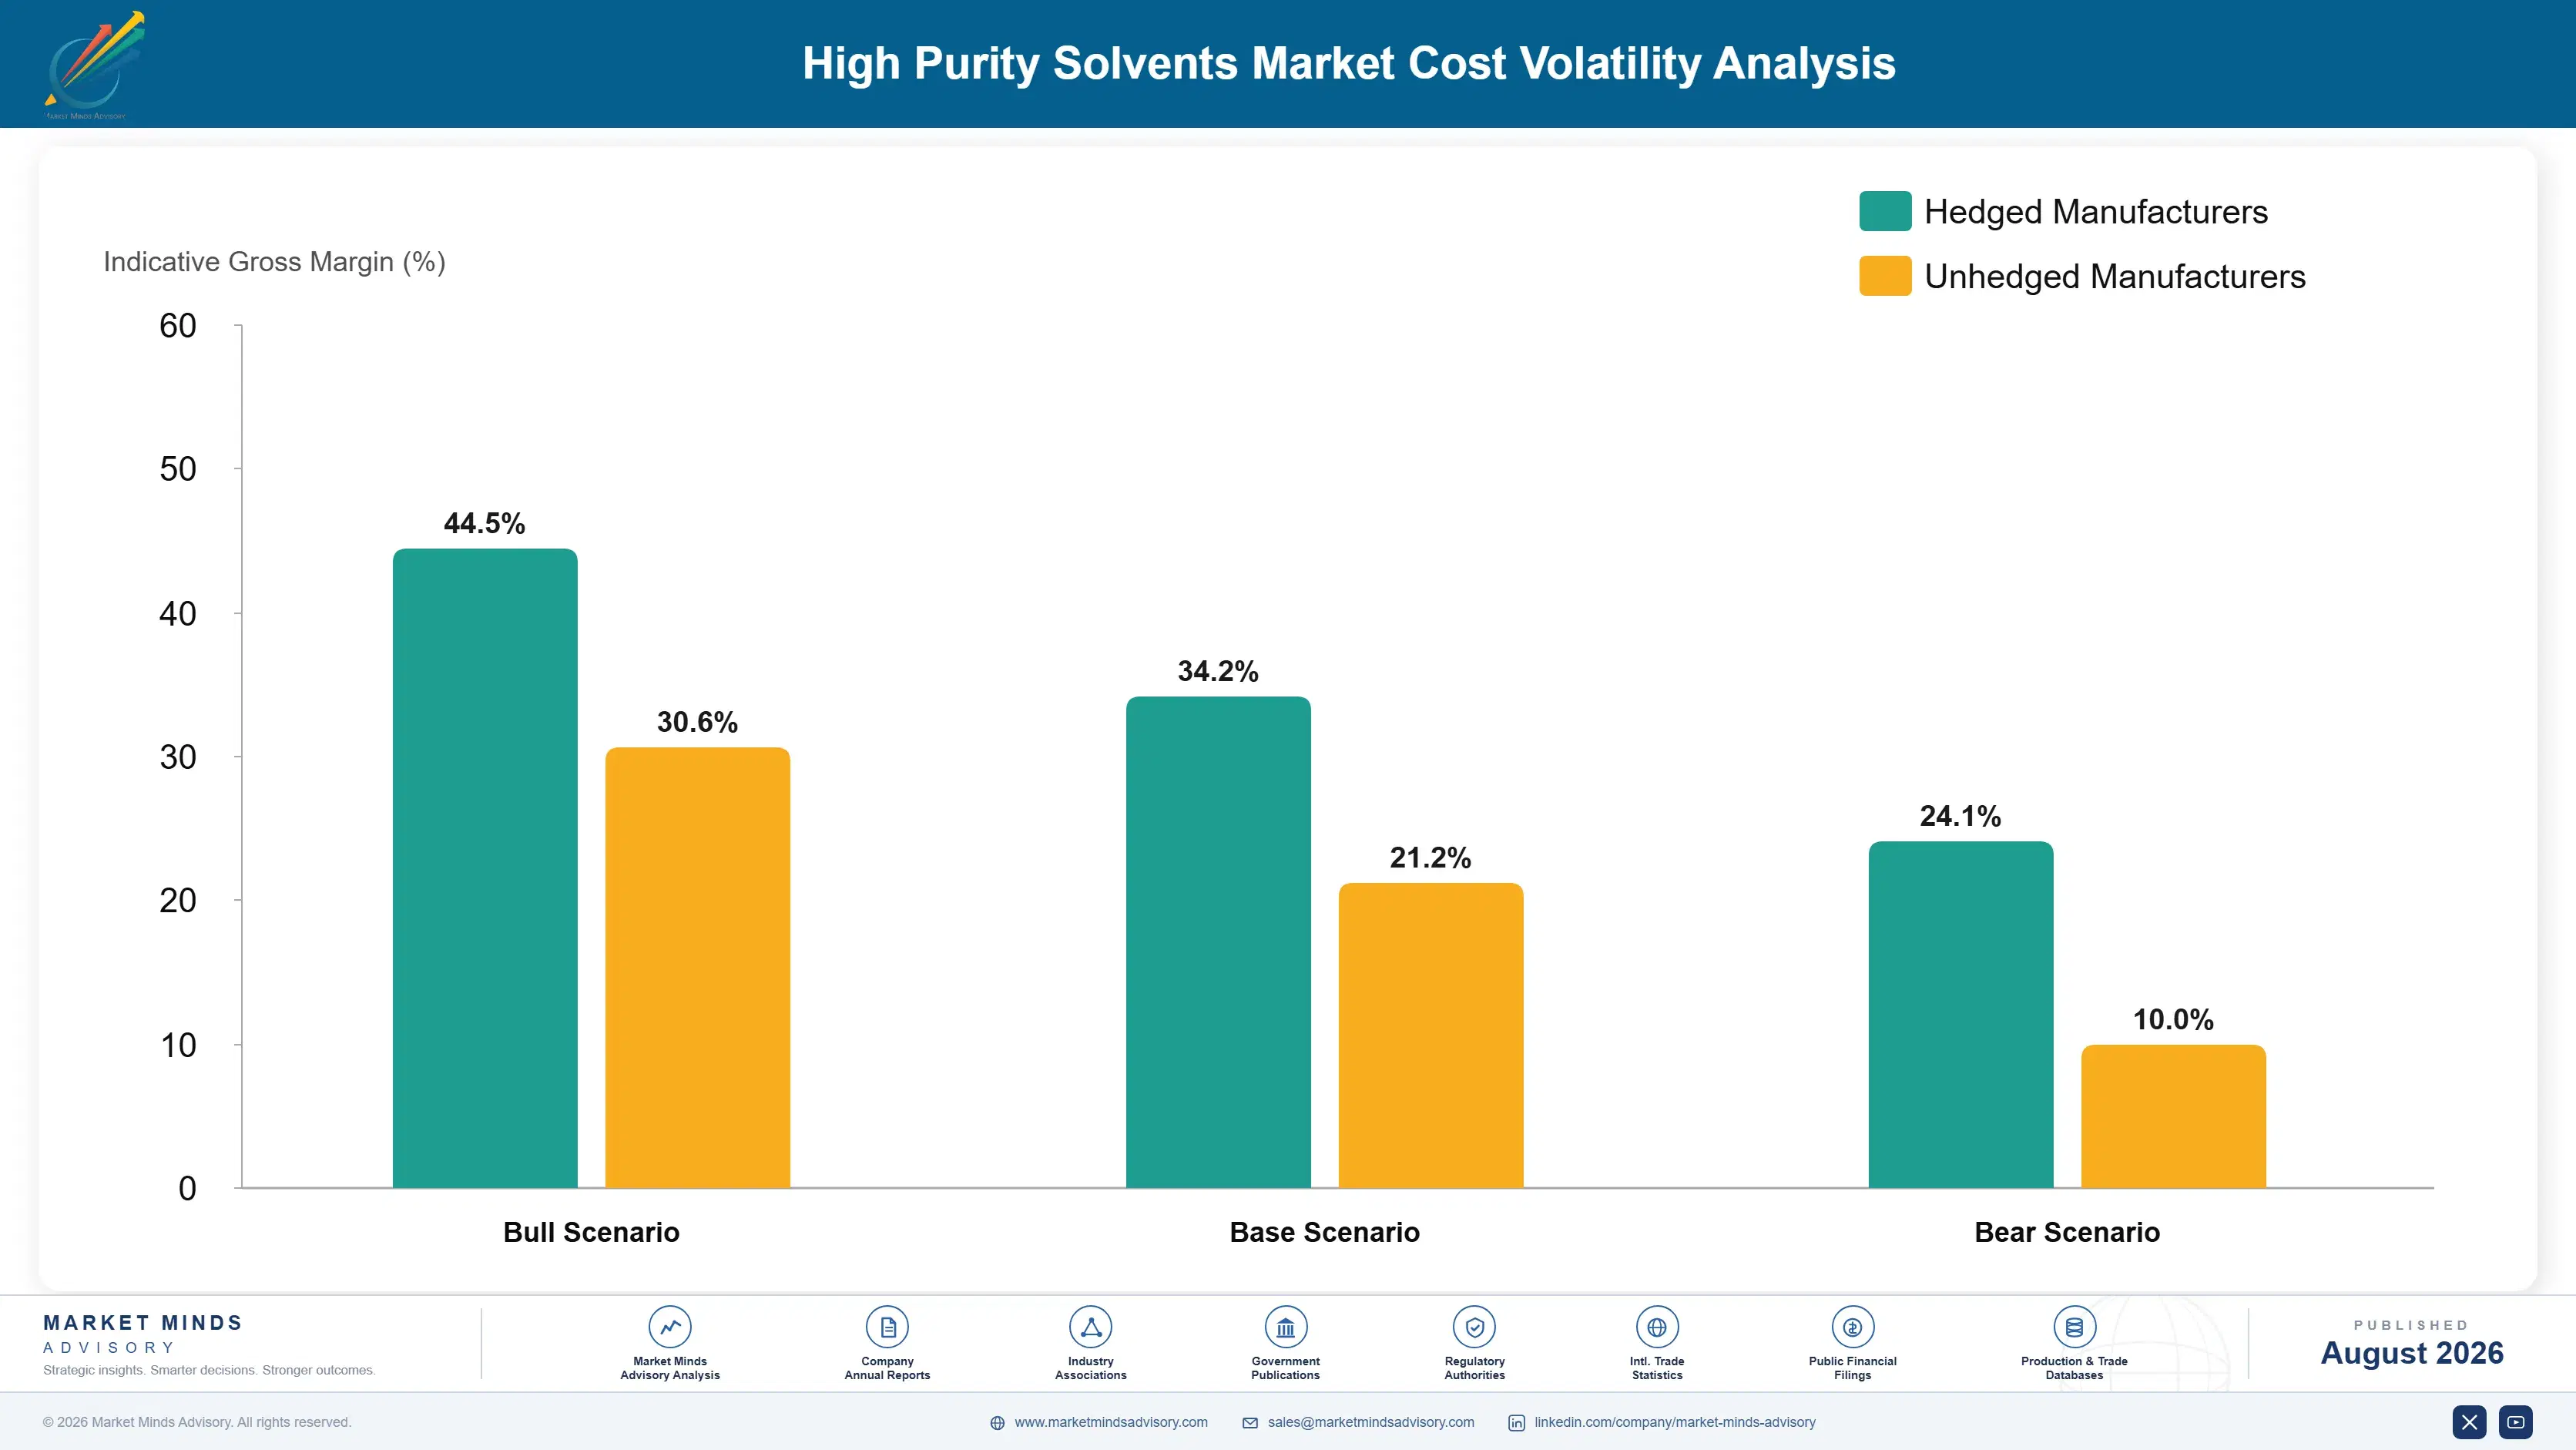
Base petrochemical feedstock represents 40% to 48% of processing cost of goods sold, since high purity solvents begin as standard industrial-grade chemicals before extensive purification. Purification process energy and specialized equipment depreciation account for another 25% to 32%, while analytical testing and quality certification add 12% to 18%. Packaging and logistics absorb the remainder of total delivered cost.
The 2022 petrochemical price spike illustrated this exposure directly. EIA data recorded naphtha and ethylene benchmark prices climbing sharply following crude oil volatility tied to the Russia-Ukraine conflict, and BASF's 2022 annual report disclosed materially higher feedstock costs across its specialty solvents portfolio during that period. Producers with fixed-price customer contracts signed before the spike absorbed significant margin compression, while those with index-linked pricing or shorter repricing intervals passed cost through more quickly and preserved margin more effectively.

Exposure varies sharply by contract structure and production integration. Vertically integrated majors who produce their own base petrochemical feedstock absorb less volatility than smaller purification specialists who purchase feedstock from external suppliers with real pricing power. Producers without backward integration into feedstock face the steepest competitive disadvantage, particularly during tight petrochemical markets when feedstock allocation itself becomes constrained alongside price.
high-purity-solvents-market-cost-volatility-analysis-1787552920378

Secure Long-Term Feedstock Supply Agreements With Producers

Purification specialists without backward integration into base feedstock can secure multi-year supply agreements directly with petrochemical producers, locking in both price and priority allocation during periods of tight supply. This reduces exposure to spot market shortages that have periodically affected specialty feedstock categories across the broader chemicals industry worldwide. Buyers value this predictability highly during shortages.

Pass Feedstock Volatility Through Index-Linked Pricing

Producers who negotiate index-linked pricing formulas tied to published petrochemical benchmarks, rather than fixed multi-year prices, pass feedstock volatility through to customers automatically rather than absorbing it until a scheduled renegotiation point. This structure has become increasingly standard among producers serving semiconductor and battery customers who accept the tradeoff. It also simplifies long-range financial planning considerably.

Pursue Backward Integration Into Base Feedstock Production

Larger producers with sufficient scale can pursue backward integration into base petrochemical feedstock production directly, capturing margin currently paid to upstream suppliers while gaining full control over feedstock quality consistency. This is capital-intensive and works best for producers with sufficient purification volume to justify dedicated investment. Payback typically arrives within two to three years.

Portfolio Architecture for Margin Defence

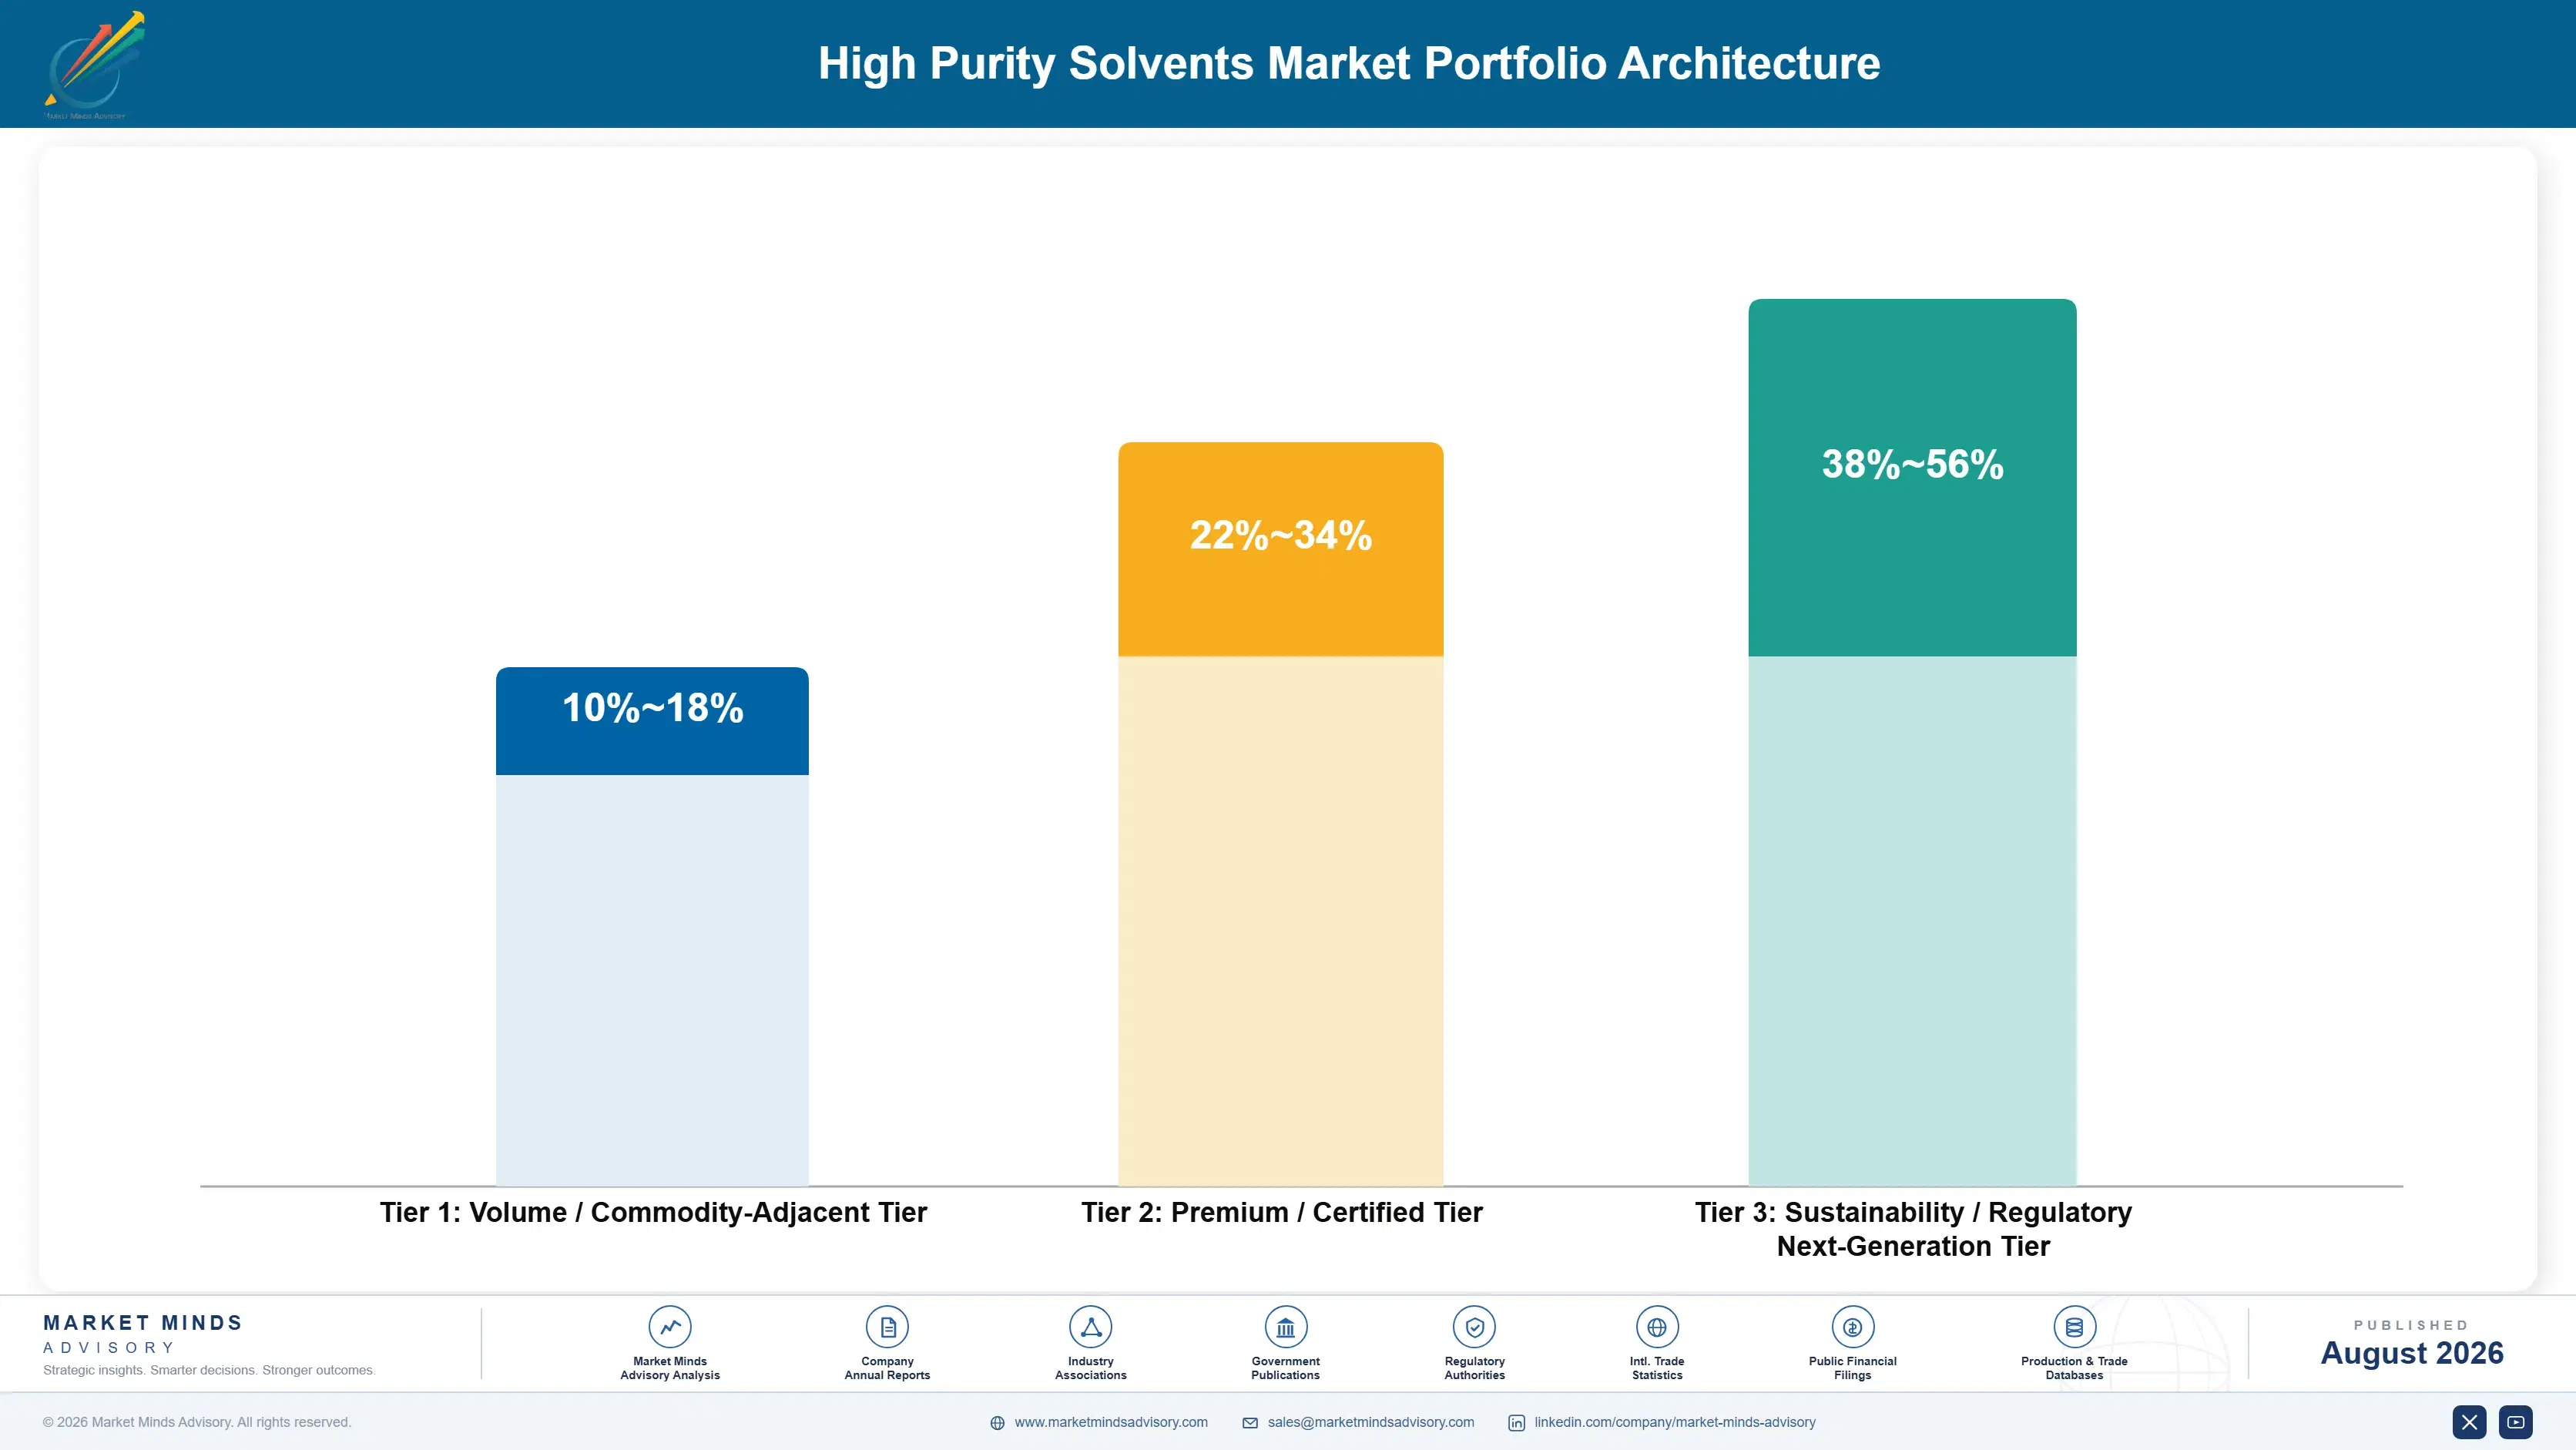
The high purity solvents portfolio splits into three tiers with wide margin separation. General industrial and technical-grade solvent competes largely on delivered cost, forming a comparatively small volume base within this specialty-focused market. Certified pharmaceutical and coatings-grade material commands a substantial premium tied to regulatory qualification. Advanced semiconductor and battery-grade material earns the highest margins, reflecting qualification barriers and limited cleanroom capacity able to consistently meet the tightest impurity specifications.
The tension running through this portfolio is between qualification depth and capacity allocation discipline rather than between volume and margin in the traditional sense. Semiconductor and battery-grade material commands premium pricing precisely because qualified capacity cannot expand quickly, yet producers must still allocate that scarce capacity between competing customer relationships built over years. Pharmaceutical-grade material sits in between, valuable but more predictable, since regulatory qualification cycles are well established and less prone to sudden demand shocks.

High-value pools concentrate specifically where qualification barriers, not raw production scale, determine competitive position. A producer with modest capacity but proven advanced-node semiconductor qualification captures more margin than a much larger general industrial solvent producer. That inversion is reshaping where investment capital in this space actually flows across the industry.

Volume / Commodity-Adjacent Tier

General industrial and technical-grade solvent sold primarily on delivered price to non-specialized manufacturing customers, competing directly against standard commodity solvent producers lacking cleanroom-grade purification capability or qualification history entirely. Margins stay thin across most volume.
Gross Margin: 10-18%

Premium / Certified Tier

Certified pharmaceutical-grade and specialty coatings solvent serving customers who specify tighter impurity tolerances and regulatory documentation than general industrial buyers require across annual qualification and purchasing programs each cycle. Demand stays predictable year to year.
Gross Margin: 22-34%

Sustainability / Regulatory / Next-Generation Tier

Advanced semiconductor-grade and battery electrolyte solvent qualified for cleanroom fabrication and cell manufacturing applications, where scarce purification capability and qualification history determine who captures the resulting premium pricing consistently. Few competitors clear this bar reliably.
Gross Margin: 38-56%
high-purity-solvents-market-portfolio-architecture-1787552921421

High-value Sub-segments and Strategic Watch-out

Battery and Energy Storage

The fastest-growing and increasingly high-margin segment, at 11.2% CAGR and gross margins reaching the mid-50s, driven by EV and grid-storage cell manufacturers whose electrolyte solvent demand has outpaced qualified production capacity since 2022 across nearly every major producing region. Buyers pre-book capacity years in advance.
Gross Margin: 38-56%

Semiconductor Manufacturing

Second-fastest at 9.8% CAGR and the largest segment by current revenue, anchored by wafer cleaning and photoresist solvents where Kanto Chemical and Stella Chemifa hold accumulating advanced-node qualification advantages newer entrants find difficult to replicate quickly at comparable specification. Fab construction timelines are announced years ahead.
Gross Margin: 35-52%

Pharmaceutical and API Manufacturing

A steady volume segment growing near 7.5%, supplying API-grade solvent to generic and branded drug manufacturers on multi-year contracts, priced competitively but benefiting from durable regulatory qualification barriers that limit new entrant competition significantly. Regulatory qualification barriers remain durable and stable. Demand stays steady across economic cycles.
Gross Margin: 22-34%

General Industrial Applications

The slowest-growing visible category, facing steady price pressure from standard commodity solvent producers and limited differentiation opportunity, leaving this segment's growth tied closely to broader industrial production volume rather than any specification-driven premium available today. Few producers differentiate meaningfully in this category. Growth here trails the broader market consistently.
Gross Margin: 10-18%

Allocation, Not Price, Governs Demand

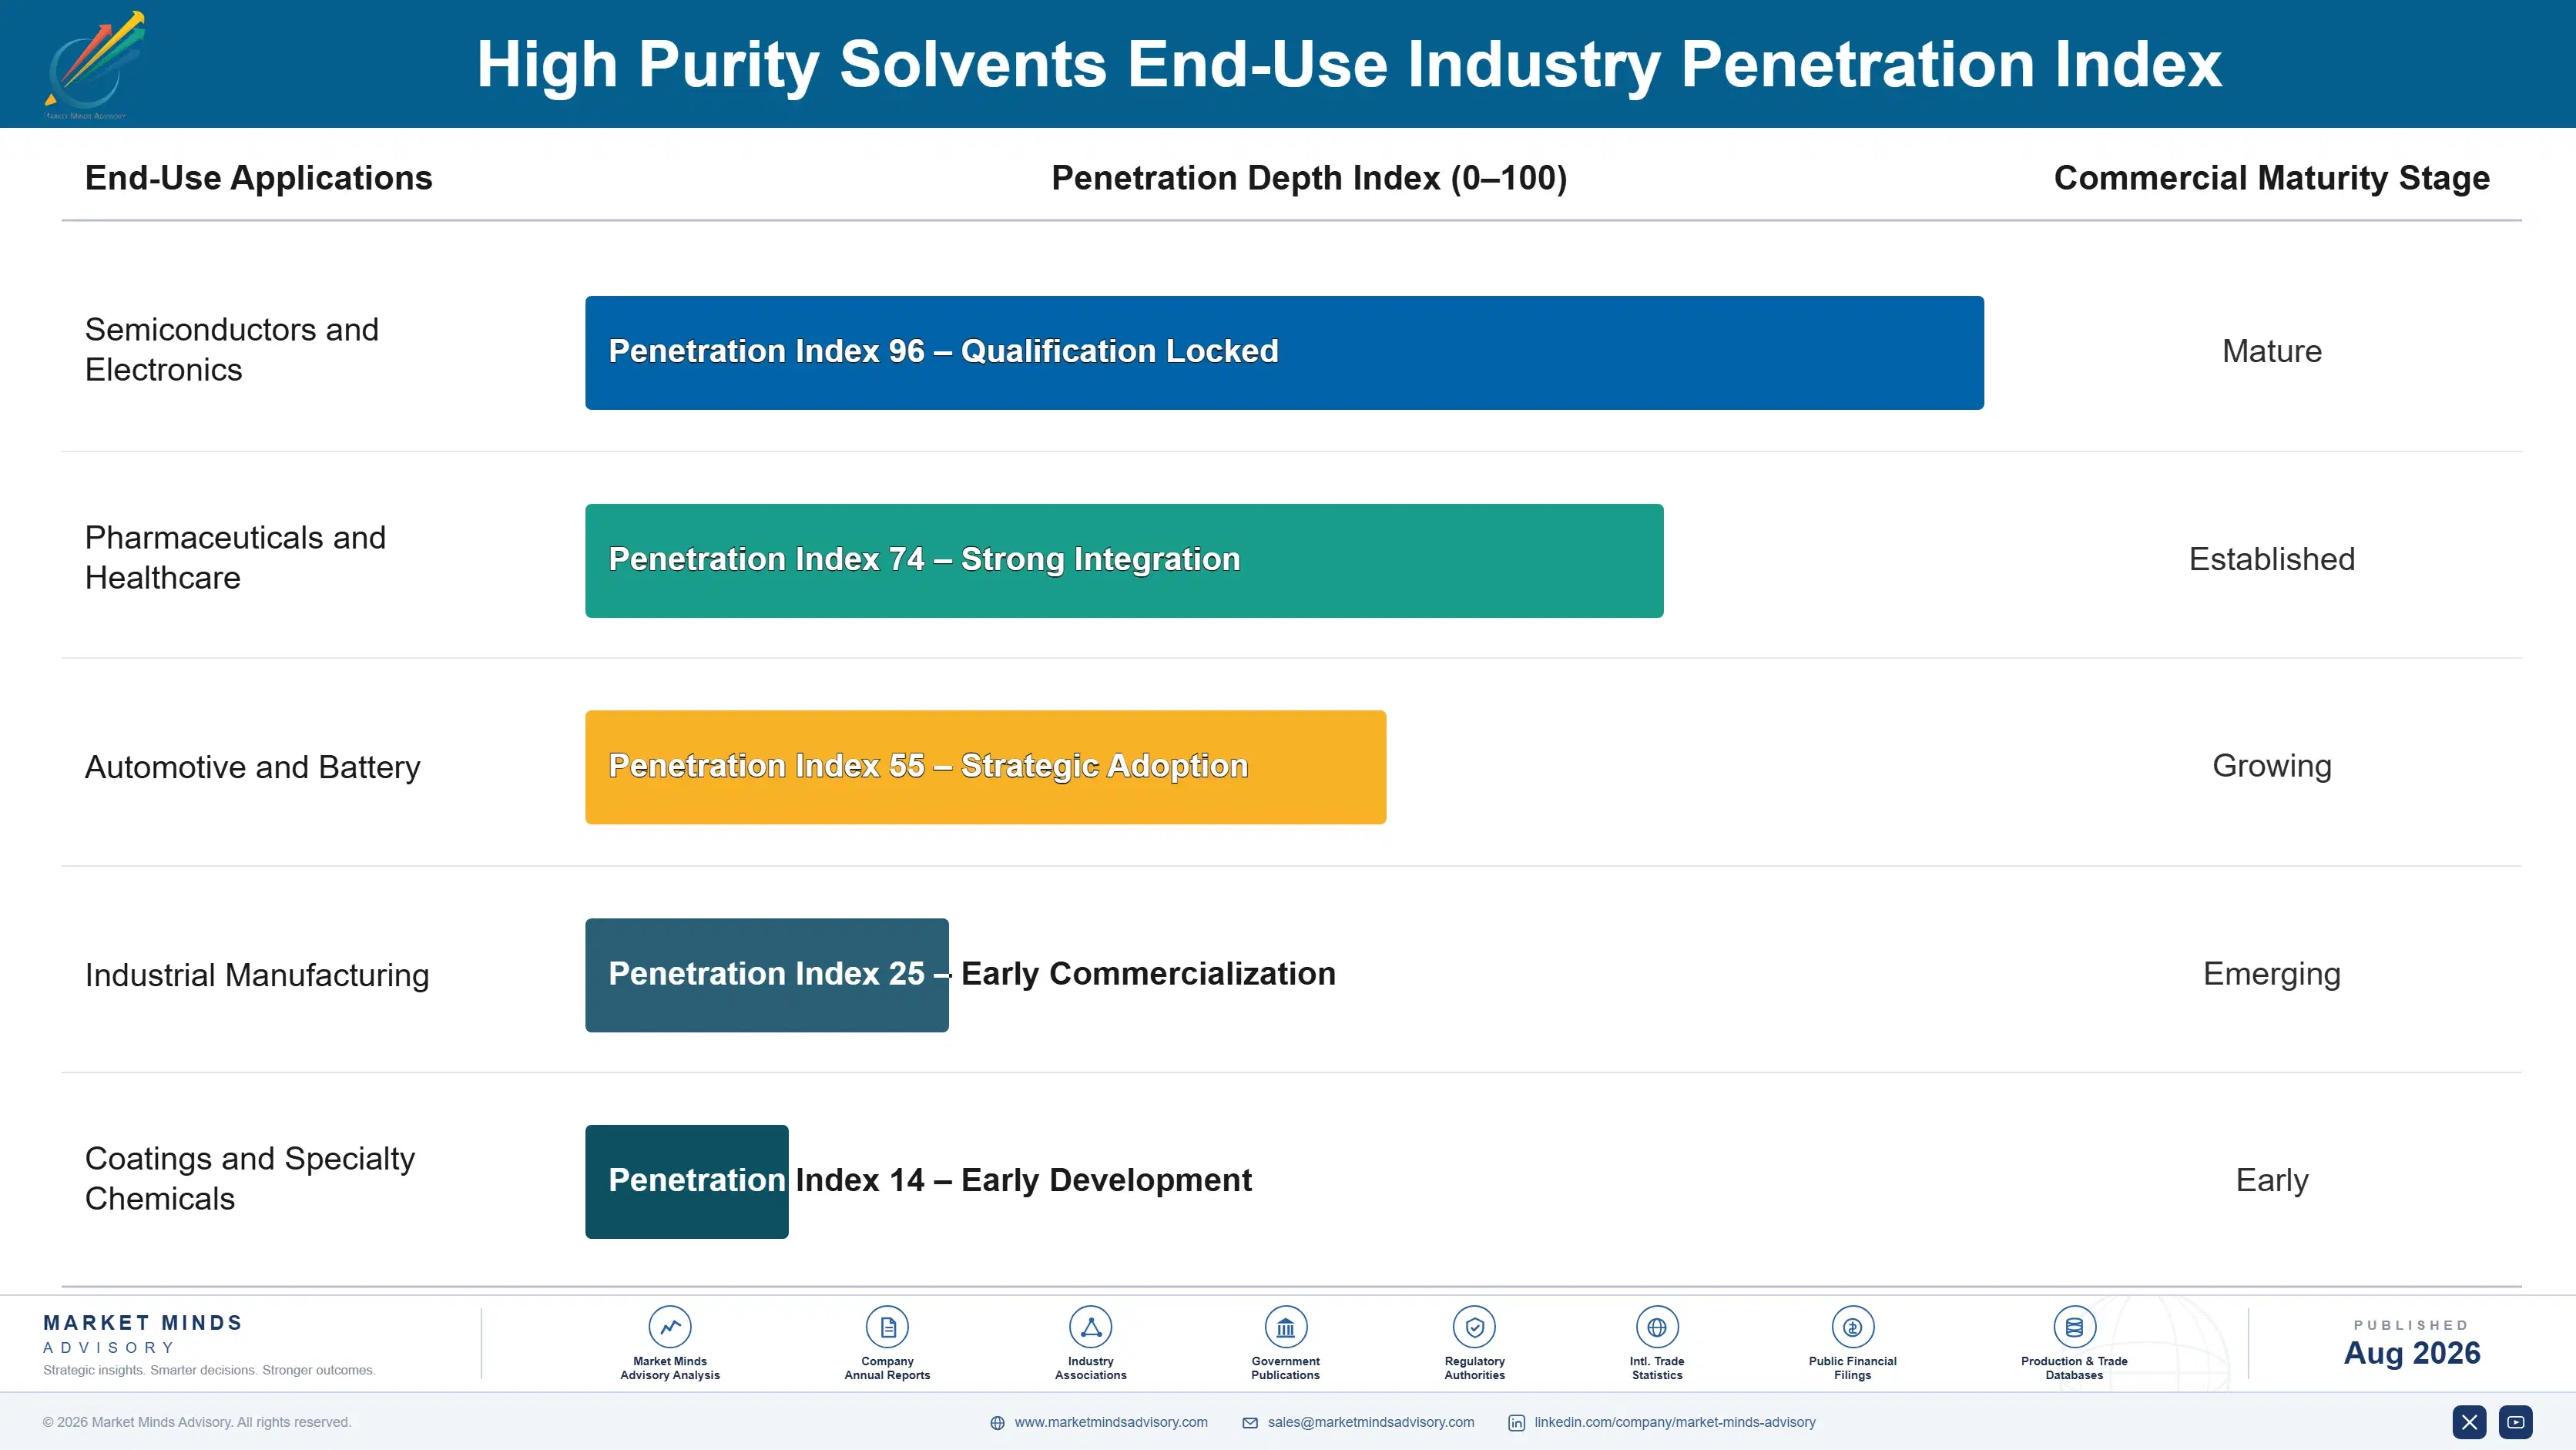
Demand here runs on qualification cycles and allocation relationships rather than simple purchase contracts. Semiconductor customers commit to a validated solvent supplier for the life of a fabrication process, often many years, since any change triggers costly requalification testing across an entire production line. Battery and pharmaceutical customers commit similarly, given the regulatory and technical cost of switching an approved supplier once qualified.
Adoption depth varies sharply by end-use vertical. Semiconductor manufacturers show the deepest stickiness of all, given the multi-million-dollar cost of requalifying an approved fabrication process against an alternate solvent source. Battery and pharmaceutical customers show comparable stickiness once qualified, though newer battery giga-factories sometimes dual-source deliberately for supply security reasons. General industrial buyers sit at the loosest end, treating solvent largely as a substitutable commodity input purchased primarily on price.

Buyer profiles are shifting as procurement moves from viewing high purity solvents as a simple input purchase toward treating supplier qualification as a strategic risk management decision. Younger procurement teams at semiconductor and battery manufacturers increasingly factor in geographic sourcing diversification, not just price, following the 2019 Japan-Korea export restriction episode and pandemic-era disruption memories.
high-purity-solvents-market-end-use-penetration-index-1787552922859

Where MMA Sees Solvents Diverging

These are among the four positions where our research anticipates prominent divergence between winners and laggards over the coming forecast period. Each is grounded in the demand model, the regulatory perimeter, and the announced capacity pipeline.
01 / CAPACITY ALLOCATION DISCIPLINE

Contract loyalty will separate winners from opportunistic spot sellers

Raw production capacity no longer determines competitive position in this market the way it once did before demand began outpacing qualified supply. Producers who prioritized long-term contracted customers over opportunistic spot sales during the 2022 and 2023 tight-capacity period are now winning first right of refusal on new qualification opportunities that competitors cannot access. Over the next decade, we expect this allocation discipline to matter more than raw capacity expansion, rewarding producers who build durable customer loyalty over chasing spot premiums.
02 / ADVANCED-NODE QUALIFICATION TIMING

Early semiconductor qualification will compound into lasting specification advantage

Semiconductor fab construction is announced years before production begins, and producers who invest in advanced-node purification capability ahead of that timeline are securing qualification before competitors even begin the process. Kanto Chemical and Stella Chemifa's early positioning with new fabs has already locked in multi-year supply relationships that competing producers cannot realistically catch up to on capability alone. We expect this compounding advantage to widen further as chip geometries continue shrinking, rewarding producers who invested in purification capability years before the tightest specifications became commercially unavoidable.
03 / BATTERY ELECTROLYTE DEMAND SHIFT

Electrolyte solvent demand will keep outgrowing semiconductor volume sharply

Battery and energy storage solvent demand already grows at roughly 1.4 times the overall market rate, and that gap should widen rather than close as EV and grid-storage giga-factory construction continues through the forecast period. Semiconductor demand remains dependable but consistently slower on a percentage basis, growing with fab construction that is itself somewhat cyclical relative to steadily expanding battery cell manufacturing capacity. Producers positioned to serve both channels, but with genuine electrolyte-grade qualification capability, will command pricing power single-application specialists increasingly cannot match.
04 / GEOGRAPHIC CONCENTRATION RISK

Multi-country production footprints will separate resilient producers from exposed ones

Producers concentrated in a single country remain directly exposed to the kind of geopolitical supply disruption that Japan's 2019 export restriction episode demonstrated clearly to the whole industry. That exposure already reshaped South Korean semiconductor procurement strategy meaningfully and shows no sign of becoming less relevant as geopolitical tension between major producing nations persists. We expect buyers to continue rewarding producers with multi-country qualified production footprints over single-site specialists, even when the single-source alternative offers a modestly lower price for comparable material quality.

Engagement Snapshot From the Field

A live engagement with an industry participant carrying material or product regulatory and market exposure ahead of a defining policy shift, showing how our research translates into a defensible multi-year portfolio strategy.
MARKET MINDS ADVISORY · CLIENT ENGAGEMENT SUMMARY
High Purity Solvents Producer Strategic Portfolio Review and Transition Roadmap 2026·Investment Scenario on High Purity Solvents Exposure Evaluation 2025-26
CLIENT PROFILE
A battery cell manufacturer building a new giga-factory in Europe approached MMA while evaluating electrolyte solvent supply options ahead of planned facility commissioning. The client reported planned annual solvent procurement spend exceeding USD 35 million, with an internal target of securing dual-source qualified supply within twelve months to avoid delaying its production ramp timeline (client-reported, unverified by MMA).
STRATEGIC CHALLENGE
Management needed to secure electrolyte-grade solvent supply sufficient for full production ramp while avoiding overreliance on a single East Asian supplier given growing awareness of geopolitical concentration risk. No internal team had directly compared qualification timelines, delivered cost, and supply security tradeoffs across the shortlisted producer options genuinely available to the company.
MMA APPROACH
MMA benchmarked qualification timelines and delivered cost across five shortlisted producers, modeled production ramp delay risk under single-source versus dual-source scenarios, and assessed each producer's geographic production footprint and historical supply reliability during past demand surges. We also evaluated contract pricing structures to identify genuine feedstock cost pass-through protection versus fixed pricing that could compress margin later.
KEY FINDINGS
  1. Single-sourcing from the lowest-cost East Asian producer carried meaningful geopolitical concentration risk that the client's original procurement plan had not adequately weighted before the engagement began (client-reported, unverified by MMA).
  2. A dual-source strategy combining one East Asian and one European producer added a modest cost premium but reduced supply disruption risk substantially based on historical allocation behavior during past tight-capacity periods.
  3. Qualification timelines varied by up to seven months across shortlisted producers, with faster-qualifying options carrying a price premium that proved smaller than the value of avoiding a delayed production ramp.
  4. The client's original supplier shortlist had underweighted producers with multi-country production footprints in favor of the single lowest-cost option available at the time.
CLIENT PROFILE
A battery cell manufacturer building a new giga-factory in Europe approached MMA while evaluating electrolyte solvent supply options ahead of planned facility commissioning. The client reported planned annual solvent procurement spend exceeding USD 35 million, with an internal target of securing dual-source qualified supply within twelve months to avoid delaying its production ramp timeline (client-reported, unverified by MMA).
STRATEGIC CHALLENGE
Management needed to secure electrolyte-grade solvent supply sufficient for full production ramp while avoiding overreliance on a single East Asian supplier given growing awareness of geopolitical concentration risk. No internal team had directly compared qualification timelines, delivered cost, and supply security tradeoffs across the shortlisted producer options genuinely available to the company.
MMA APPROACH
MMA benchmarked qualification timelines and delivered cost across five shortlisted producers, modeled production ramp delay risk under single-source versus dual-source scenarios, and assessed each producer's geographic production footprint and historical supply reliability during past demand surges. We also evaluated contract pricing structures to identify genuine feedstock cost pass-through protection versus fixed pricing that could compress margin later.
KEY FINDINGS
  1. Single-sourcing from the lowest-cost East Asian producer carried meaningful geopolitical concentration risk that the client's original procurement plan had not adequately weighted before the engagement began (client-reported, unverified by MMA).
  2. A dual-source strategy combining one East Asian and one European producer added a modest cost premium but reduced supply disruption risk substantially based on historical allocation behavior during past tight-capacity periods.
  3. Qualification timelines varied by up to seven months across shortlisted producers, with faster-qualifying options carrying a price premium that proved smaller than the value of avoiding a delayed production ramp.
  4. The client's original supplier shortlist had underweighted producers with multi-country production footprints in favor of the single lowest-cost option available at the time.
RECOMMENDED STRATEGY
Phase 1: Phase 1 (0 to 6 months): Qualify a primary East Asian supplier offering the fastest qualification timeline to avoid delaying the planned production ramp schedule. Phase 2: Phase 2 (6 to 12 months): Complete parallel qualification of a European secondary supplier, establishing genuine dual-source supply security ahead of full-scale production. Phase 3: Phase 3 (12 to 36 months): Monitor allocation reliability across both suppliers and evaluate a third qualified source as the facility scales toward full capacity.
OUTCOME
The client completed primary supplier qualification seven months after selection, on schedule for its planned production ramp, while securing a European secondary supplier within the following five months. Reported procurement cost came in approximately 3% above the single-source baseline, a premium management considered justified given the supply security achieved (client-reported, unverified by MMA).

Frequently Asked Questions

Foundational context covering the market sizes, CAGR, scope, country, region and competition that inform every finding below. This section is provided to cover basics and most often pre-purchase conversations, answered from the MMA Primary Research Dataset.

What is the current size of the High Purity Solvents Market?

The global high purity solvents market stands at USD 3.2 billion in 2025, according to MMA Primary Research. Semiconductor manufacturing accounts for the largest share of current revenue.

How large will the High Purity Solvents Market be by 2036?

MMA projects the market will reach USD 7.54 billion by 2036, up from USD 3.46 billion in 2026, an expansion multiple of roughly 2.18 times over the forecast period.

What is the CAGR for the High Purity Solvents Market 2026 to 2036?

The base case CAGR is 8.1% across 2026 to 2036. MMA's bull scenario reaches 9.4% and the bear scenario falls to 6.9%, depending on semiconductor capital spending cycles and battery expansion.

Which segment is growing fastest?

Battery and energy storage grows fastest at 11.2% CAGR, roughly 1.4 times the overall market rate, as EV and grid-storage cell manufacturers scale electrolyte solvent purchases.

Who are the major companies in the High Purity Solvents Market?

Leading producers include BASF, Merck KGaA, Honeywell, Kanto Chemical, and Avantor. Together these five account for an estimated 54% of global qualified cleanroom-grade production capacity worldwide.

Which country is growing fastest?

South Korea posts the fastest national growth at approximately 11.8% CAGR, supported by battery giga-factory expansion and continued semiconductor fabrication capacity additions across the country.

Report Segmentation Architecture

The full report scope spans multiple orthogonal segmentation dimensions, with cross-tabulated demand data provided for each dimension pair. Coverage extends further to regional breakdowns, trend trajectories, and the competitive detail needed to support segment-level decision-making.

By Application

  • Semiconductor Manufacturing
  • Pharmaceutical and API Manufacturing
  • Battery and Energy Storage
  • Electronics and PCB Cleaning
  • Specialty Coatings and Chemicals
  • General Industrial Applications

By End-Use Industry

  • Semiconductors and Electronics
  • Pharmaceuticals and Healthcare
  • Automotive and Battery
  • Industrial Manufacturing
  • Coatings and Specialty Chemicals

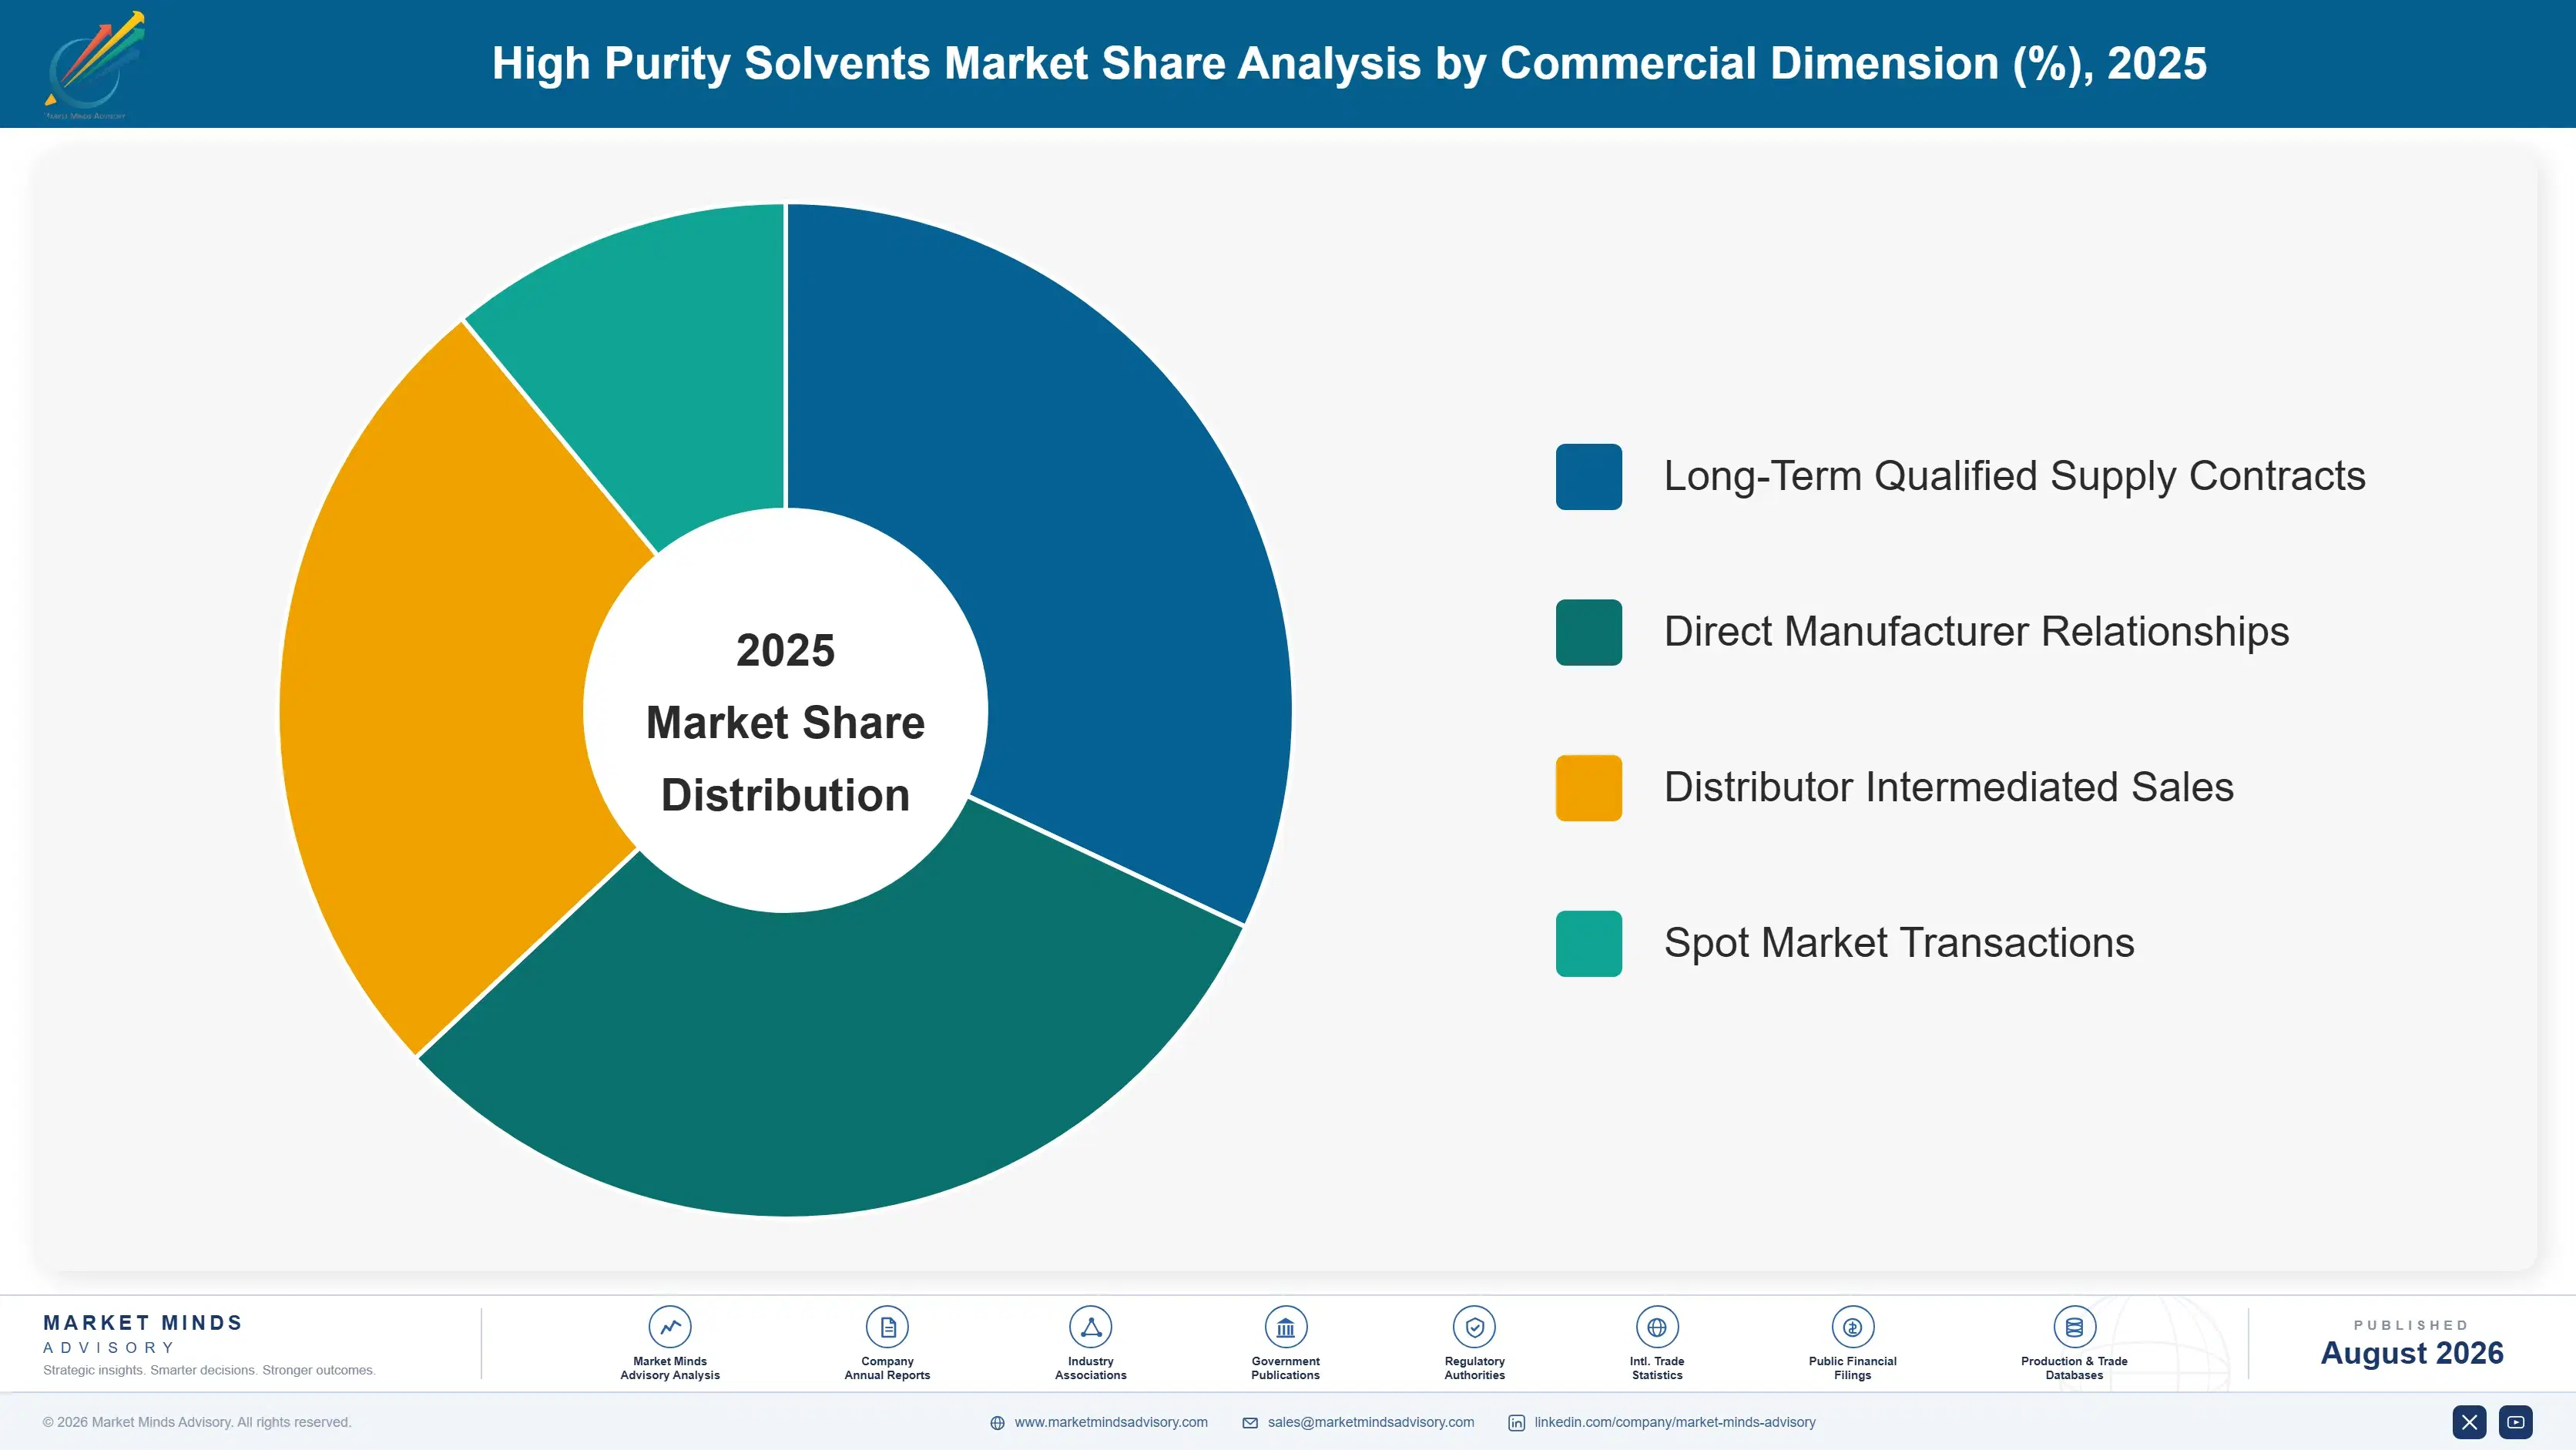
By Commercial Dimension

  • Long-Term Qualified Supply Contracts
  • Direct Manufacturer Relationships
  • Distributor Intermediated Sales
  • Spot Market Transactions

By Region

  • North America
  • Western Europe
  • East Asia
  • South Asia and Pacific
  • Latin America
  • Middle East and Africa
  • Eastern Europe

Scope, Methodology, and Coverage

Every figure in this report is reproducible from documented input assumptions. The scope below maps the historical period, the forecast horizon, the segmentation dimensions, and the countries covered, alongside the underlying primary and qualitative methodology.
Historical Period
2020 to 2025
Forecast Period
2026 to 2036
Base Year
2025 (USD billions; MMA Primary Research Dataset, August 2026)
Market Definition
The high purity solvents market covers solvents refined to ultra-low metallic and particulate impurity thresholds, typically 99.9% purity or higher, sold for semiconductor fabrication, pharmaceutical and API synthesis, battery electrolyte formulation, and precision electronics cleaning use. It excludes standard industrial-grade and technical-grade solvents that do not meet electronic or pharmaceutical purity specifications, and finished battery cells or semiconductor devices that merely incorporate these solvents during manufacturing.
Quantitative Units
USD billions (current prices); metric tonnes of qualified solvent where applicable
Segmentation Dimensions
By Application; By End-Use Industry; By Commercial Dimension; By Region
Regions Covered
North America, Western Europe, East Asia, South Asia and Pacific, Latin America, Middle East and Africa, Eastern Europe
Countries Covered
USA, China, Germany, France, UK, Japan, South Korea, India, Australia, Canada, Brazil, Mexico, Indonesia, Vietnam, Thailand, Malaysia, UAE, Saudi Arabia, South Africa, Nigeria, Turkey, Poland, Netherlands, Italy, Spain, Sweden, Switzerland, Argentina, Colombia, Singapore, and additional markets relevant to this sector
Key Companies Profiled
BASF SE, Merck KGaA, Honeywell International Inc., Kanto Chemical Co., Inc., Avantor, Inc., Mitsubishi Chemical Corporation, Sumitomo Chemical Co., Ltd., Tokuyama Corporation, Stella Chemifa Corporation, Fujifilm Electronic Materials, DuPont de Nemours, Inc., Solvay S.A., Eastman Chemical Company, Central Glass Co., Ltd., Wako Pure Chemical Industries, Ultra Pure Chemicals Co., Ltd, Air Water Inc., SK Materials, Soulbrain Co., Ltd., ENEOS Corporation
Quantitative Methodology
Primary survey, n=3,800 respondents, Q4 2025, six countries; demand-side model with trade association cross-validation
Qualitative Methodology
47 expert interviews, Q4 2025; applied to validate demand model assumptions, identify emerging dynamics, and assess competitive positioning
Report Format
PDF and XLSX data workbook (Word format preview document)
Publisher
Market Minds Advisory
Report Code
MMA-2026-CHM-104
Published
August 2026
Contact
sales@marketmindsadvisory.com | www.marketmindsadvisory.com

Purchase the full High Purity Solvents Market Report (2026 to 2036).

The full MMA High Purity Solvents Market report sizes global demand across six application segments, five end-use industries, four commercial models, and seven regions through 2036. It profiles twenty participants on a consistent qualified-capacity basis, scoring each on purification depth, geographic footprint, and advanced-node qualification history. Scenario models quantify how battery giga-factory expansion, semiconductor fab subsidy programs, and geopolitical supply concentration risk move both volume and realizable price across the forecast period. The report also includes delivered-cost modelling by application, a feedstock price sensitivity analysis, a qualification-timeline benchmark, and a capacity-allocation competitive scorecard built for procurement, strategy, and investment teams.
Application-Level Demand Sizing Across Six Segments
Twenty-Company Competitive Benchmarking On Qualification Depth
Battery And Semiconductor Demand Scenario Modelling
Feedstock Price Sensitivity And Margin Impact Analysis
Regional Trade Flow And Country Growth Mapping
Advanced-Node Qualification Pipeline And Capacity Tracking

Built For The People Who Decide

From boardroom strategy to bench-side execution, this report is read cover-to-cover by leaders shaping the next decade of their industry, turning demand scenarios, market dynamics and valuation benchmarks into decisions.
CXOs/ Presidents/ VPs/ Managers
M&A and Corporate Development
Strategy Teams and R&D Heads
Procurement and Product Directors
Regulatory and Compliance Leaders
Investor Relations and Equity Analysts