Market Minds Advisory
High-Pressure Booster Market

High-Pressure Booster Market: Seal Life Decides the Economics, Not the Pressure Rating

Boosters are bought on maximum pressure and duty cycle, then run on seals that need changing every few thousand hours, which is exactly where the whole ownership cost quietly accumulates.

Lead Analyst

David Horsley

Published

September 2026

Make Smarter Decisions with Customized Research Insights

Request a free sample report and evaluate market opportunities, growth trends, and competitive dynamics relevant to your business needs.

2025 MARKET VALUE$4.6BMarket Size 2025
2036 FORECAST VALUE$11.2BBase Case , 2026 to 2036
CAGR 2026 TO 20368.4 %Bull 9.6% / Bear 7.2%
INCREMENTAL OPPORTUNITY$6.2BNet 10- year value creation
EXPANSION MULTIPLE2.24x2036 value over 2026 base
Strategic Levers
M&A Pipeline
Regional Outlook
Country Rankings
Competitive Intelligence
Segmental Deep-dive
Call-Us : 91 93563 13602

Executive Snapshot and Market Trajectory

Buyers specify maximum pressure and compare capital cost. Seals are what actually determine the bill, running around 3,800 hours before replacement and consuming roughly 44% of lifetime ownership cost across parts and the downtime that goes with each change. Almost no quotation states that interval anywhere.
Growth runs at 8.4% and hydrogen carries the fastest part of it. Hydrogen refuelling and compression boosters grow at 12.6%, exactly 1.50 times the market rate, where 700 bar dispensing pressure and hydrogen embrittlement together rule out conventional equipment. East Asia holds the largest share at 30%, on Chinese and Korean industrial gas, electronics, and hydrogen infrastructure demand. Air-driven boosters follow at 9.4% as the volume configuration.
Concentration reaches 41% across the top five measured on units shipped weighted by pressure rating. Sealing technology rather than pressure capability is the barrier, and manufacturers who develop their own seal systems rather than buying them hold both the margin and the replacement revenue that follows every installation. Seal specialists capture margin from every builder who does not develop their own. Chinese producers are meanwhile entering the general industrial pressure ranges steadily.
Market Definition
This market covers pressure boosting equipment that raises fluid or gas pressure above standard supply levels for industrial process, testing, and dispensing applications, spanning air-driven liquid and gas boosters, hydraulic intensifiers and pressure amplifiers, hydrogen refuelling and compression boosters, water jet cutting and testing pumps, and seal kits and replacement service. General industrial pumps and compressors operating below booster pressure ranges, standard hydraulic power units, gas cylinders and storage vessels, and pipeline transmission compressors fall outside scope.
Base Year Value
$4.6B in 2025 (MMA Primary Research Dataset, August 2026)
Forecast Period
2026 to 2036, eleven discrete annual values
CAGR
8.4% base case. Bull 9.6%. Bear 7.2%.
Fastest Growth Segment
Hydrogen Refuelling and Compression Boosters: 12.6% CAGR
Fastest Growth Country
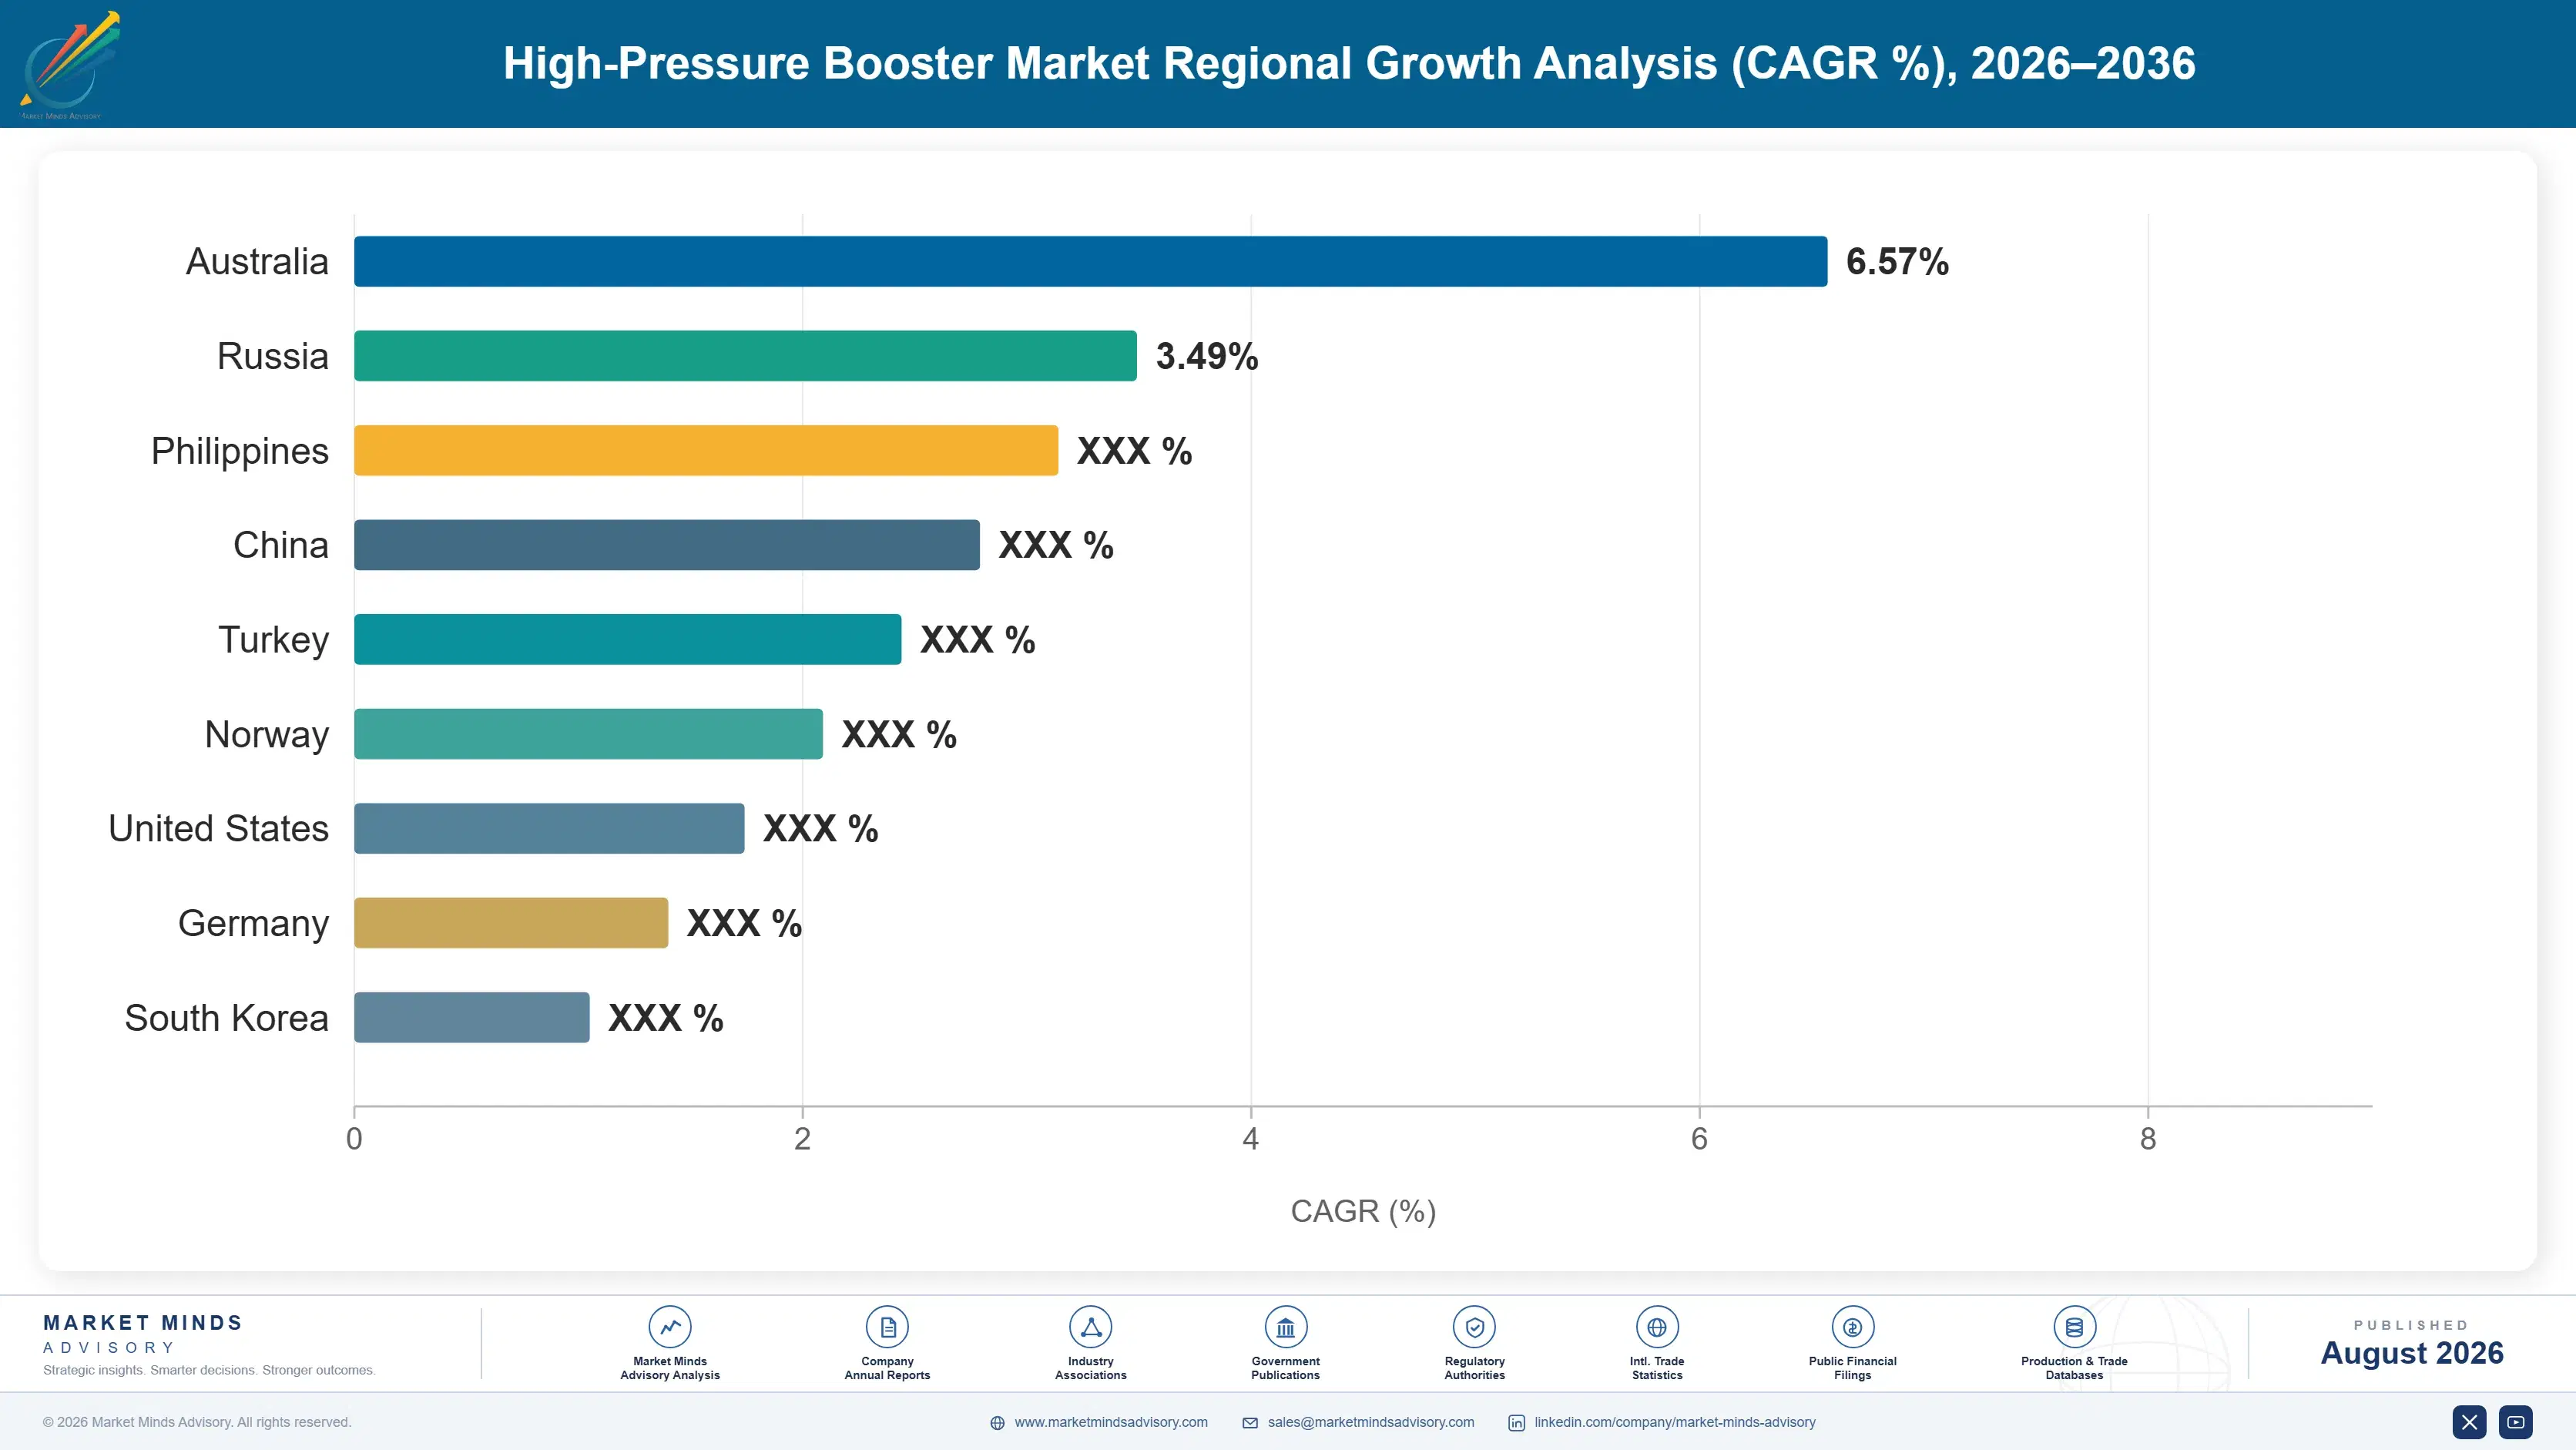
India: 10.8% CAGR
Fastest Growth Region
South Asia and Pacific: 10.4% CAGR
Largest Region
East Asia: 30% of 2025 global value
Market Leaders
Haskel International, Maximator, Hydratron, Resato International, SC Hydraulic Engineering. Source: MMA Analysis based on company annual reports.
Primary Survey
n=3,800 procurement and R&D decision-makers, Q4 2025, six countries
Methodology
Demand-side build-up, cross-validated against public data, 47 expert interviews

High-Pressure Booster Market Forecast Scenarios

high-pressure-booster-market-size-forecast-scenario-1787301900405
The 2020 to 2025 period ran at 7.0% and industrial testing rather than any new application carried it. Pressure testing demand for pipelines, vessels, and components held steady while general industrial capital spending fell through 2020 and recovered unevenly afterward. Hydrogen refuelling projects began appearing at the end of the period and produced far more announcements than installed equipment.
Three mechanisms carry the 8.4% base case. Hydrogen infrastructure is the largest, since 700 bar dispensing requires compression equipment that conventional industrial supply does not reach. Semiconductor and electronics manufacturing is the second, where high purity gas boosting supports processes that keep expanding. And component pressure testing is the third, driven by certification requirements across automotive, aerospace, and energy equipment. None of the three depends on general industrial capital spending recovering.
The 9.6% bull case rests on hydrogen refuelling stations reaching announced build rates, since each station consumes compression equipment with seal replacement demand following behind it. The 7.2% bear case is hydrogen project deferral combined with industrial testing weakness, which would leave the market dependent on replacement parts demand from an installed base that grows only slowly.

Where the Ownership Cost Actually Sits

Every high-pressure booster quotation leads with maximum pressure and flow at pressure, and those figures get compared across suppliers as though they settled the question. They do not. Dynamic seals in a booster operating at several thousand bar wear against a moving surface under enormous load, and they need replacing around every 3,800 hours in continuous service. That is where the money goes.
SEAL REPLACEMENT INTERVAL3,800 hoursBefore dynamic seal packages require replacement in continuous service
SEAL SHARE OF OWNERSHIP44%Of lifetime cost consumed by seal parts and associated downtime
HYDROGEN DISPENSING PRESSURE700 barRequired at the nozzle, well beyond conventional industrial equipment range
TOP FIVE CONCENTRATION41%Moderate, concentrated on sealing technology rather than pressure capability
AFTERMARKET REVENUE SHARE37%Of total market from seal kits, parts, and service work
AIR CONSUMPTION PER CYCLE31%Of operating cost from compressed air driving pneumatic booster units
Seal parts and the downtime around each change consume roughly 44% of lifetime ownership cost, which dwarfs the capital difference between competing machines at the same rating. A buyer who selects on purchase price and then discovers a short seal interval has bought an expensive machine cheaply. Suppliers who quote seal life alongside pressure rating lose some comparisons and win the customers who calculate properly.
Aftermarket revenue follows directly from that, running around 37% of the total market in seal kits, parts, and service. Manufacturers who develop their own sealing systems capture it; those who buy seal packages from a specialist hand the recurring revenue and much of the technical position to a supplier the customer never sees. That distinction explains more about which manufacturers earn well than any pressure rating does.
"A customer showed me two boosters from different suppliers, same rating, twenty percent apart on price. Over five years the cheaper one cost half as much again. Neither quotation had mentioned seal life at all."
Director, Fluid Handling and High Pressure Systems Practice · MMA Industrial Equ

Market Trends

Hydrogen Dispensing Creates A Distinct Equipment Class

Vehicle refuelling requires 700 bar at the nozzle, and hydrogen embrittles conventional materials while leaking through seals that hold every other gas comfortably. Equipment for that duty is engineered differently from the ground up rather than uprated from industrial designs. Hydrogen boosters grow at 12.6% against 8.4% for the market, and seal replacement intervals in hydrogen service run shorter than in general industrial duty, which raises aftermarket content further. Station build rates rather than industrial cycles determine this demand entirely. Announcements have consistently exceeded installed equipment by a wide margin so far.
Market Impact: Seals last about 3,800 hours

Buyers Begin Comparing Seal Life Alongside Pressure Rating

Operators who have replaced seal packages every few thousand hours on one machine specify differently for the next, and that learning is spreading through pressure testing, semiconductor, and industrial gas applications. Seal parts and downtime carry roughly 44% of lifetime ownership cost, so the comparison reverses whenever it happens. Suppliers still quoting maximum pressure and capital price are winning fewer repeat orders than their product performance would otherwise support. A supplier stating seal interval loses some headline comparisons and wins the repeat orders. Buyers who calculate properly do not go back to whoever surprised them.
Market Impact: Aftermarket carries 37% of revenue

Market Opportunities and Growth Drivers

Component Certification Testing Requires Pressures Nothing Else Reaches

Automotive fuel systems, aerospace hydraulics, and energy equipment all require burst and proof testing at multiples of working pressure, and those figures exceed what standard pumps deliver. Certification requirements make that testing mandatory rather than optional, so demand follows regulatory cycles rather than industrial capital spending. Test laboratories also run equipment hard, which shortens seal intervals well below the 3,800 hours typical of intermittent industrial service and raises aftermarket demand. Laboratories also buy complete systems rather than components, which puts a supplier inside a process. Certification testing is mandatory rather than discretionary, so demand persists through downturns.
Market Impact: Seals are 44% of ownership cost

Semiconductor Gas Handling Demands High Purity Boosting

Wafer fabrication uses specialty gases delivered at pressures and purities that ordinary compression cannot maintain, since any lubricant contact or seal contamination ruins the process. Oil-free booster designs with metallic or specialised polymer sealing serve that requirement and command pricing that reflects consequence rather than capability. Fab construction across East Asia and increasingly the United States and Europe has expanded this application considerably faster than general industrial demand. A seal failure here ruins a process batch worth far more than the equipment itself. Material compatibility documentation matters, and substitution carries genuine risk for the customer.
Market Impact: Air is 31% of operating cost

Market Restraints and Challenges

Purchase Comparison Ignores The Dominant Cost

Seal parts and the downtime around each replacement carry roughly 44% of lifetime ownership cost, and quotations compare maximum pressure and capital price instead. The root cause is that pressure rating is comparable at quotation while seal life requires application knowledge and honest disclosure. Commercial impact is buyers selecting expensive machines cheaply and blaming the manufacturer afterward. Mitigation runs through seal life stated at quotation, lifetime cost modelling, and service agreements that price the whole ownership period. Maintenance managers who have replaced seal packages repeatedly now specify very differently indeed.
Market Impact: Hydrogen boosters growing at 12.6%

Compressed Air Drive Consumes More Than Buyers Expect

Pneumatically driven boosters consume compressed air continuously while cycling, carrying around 31% of operating cost, and site compressed air is frequently treated as free because it comes from an existing system. The root cause is that air generation cost sits in a plant utilities budget rather than in any equipment account. Commercial impact is oversized installations running inefficiently. Mitigation runs through duty cycle assessment at specification, hydraulic drive alternatives, and air consumption stated explicitly in quotations. Plant energy audits are beginning to reveal air consumption exceeding original equipment capital cost.
Market Impact: Seals carry 44% of ownership cost
4 additional market trends, 3 additional growth drivers, and 2 additional restraints and challenges are covered in the full report. Contact sales@marketmindsadvisory.com to access the complete intelligence.

Segment CAGR and Growth Architecture

Segmentation follows drive method and service application, because those determine sealing requirements, achievable pressure, operating cost, and which contamination or material constraints apply. Pressure rating and flow capacity both cut across every drive method rather than separating them, which makes either a considerably weaker primary dimension for this market. Drive method decides operating cost and sealing requirement together.
high-pressure-booster-market-market-share-analysis-1787301900952

Hydrogen Refuelling And Compression Boosters

The fastest application at 12.6%, exactly 1.50 times the market rate, and engineered from the ground up rather than uprated from industrial designs. Vehicle dispensing requires 700 bar at the nozzle while hydrogen embrittles conventional materials and escapes through seals that contain every other gas comfortably. Seal replacement intervals in hydrogen service run shorter than the 3,800 hours typical elsewhere, which raises aftermarket content further. Station build rates rather than any industrial cycle determine demand, and announcements have so far consistently exceeded actual installed equipment by a wide margin. Material compatibility documentation makes these installations considerably stickier than industrial equivalents. Substitution carries genuine safety risk, which removes any casual price comparison from the conversation entirely.
CAGR 12.6%

Air-Driven Liquid And Gas Boosters

Second fastest at 9.4% and the volume configuration across pressure testing, industrial gas, and general process applications, using shop compressed air to drive a reciprocating amplifier. The design is simple, requires no electrical supply in hazardous areas, and stalls safely at set pressure rather than continuing to build. Air consumption carries around 31% of operating cost and is routinely ignored because site air appears free. Seal life determines everything else about ownership economics across this configuration. Chinese manufacturers are entering these pressure ranges at costs Western producers cannot approach. Aftermarket seal supply rather than equipment margin is where this configuration earns anything at all. Duty cycle assessment is rarely done.
CAGR 9.4%
Full segment breakdown across 5 segments available in the complete report.

Regional Architecture and Country Demand Map

East Asia leads at 30% on Chinese and Korean industrial gas, semiconductor, and hydrogen infrastructure demand together. Western Europe follows on testing and hydrogen equipment engineering, ahead of North America. South Asia and Pacific grows fastest. Aftermarket service network reach varies enormously between these regions.

East Asia

Thirty percent, the largest share, and three demand sources arrive together here in a way they do nowhere else. Chinese and Korean semiconductor fabrication requires high purity gas boosting at scale, Chinese hydrogen refuelling deployment leads every other country by installed station count, and industrial gas and pressure testing demand tracks a manufacturing base larger than any other. Japanese suppliers hold high-specification sealing positions. Growth at 9.4% runs above the market rate, driven by hydrogen infrastructure and fab construction simultaneously. Aftermarket seal supply through domestic channels is developing faster than Western manufacturers expected. Chinese producers are also entering general industrial pressure ranges at aggressive pricing. Hydrogen station counts here lead every other country by a wide margin.
Share: 30% | CAGR: 9.4% (2026 to 2036)

Western Europe

Engineering capability rather than installed volume carries this 24%. German, Dutch, and British manufacturers developed much of the sealing technology this market depends on, and hydrogen booster designs originating here are specified into projects worldwide. Pressure testing demand for energy and automotive component certification is substantial and steady. Aftermarket service networks are the most developed anywhere. Growth at 6.8% is the slowest of any region, reflecting mature industrial demand rather than any weakness in technical position. Manufacturers here who developed sealing in-house capture aftermarket that competitors hand to specialists. Hydrogen engineering capability originating in the region is specified into projects worldwide. Industrial demand growth is modest throughout. Aftermarket revenue capture here is the highest anywhere in this market.
Share: 24% | CAGR: 6.8% (2026 to 2036)
Regional intelligence for 5 additional markets available in the complete report: North America, South Asia and Pacific, Latin America, Middle East and Africa, Eastern Europe. Contact sales@marketmindsadvisory.com.
high-pressure-booster-market-country-cagr-analysis-1787301901611

Selling Seal Life and Owning Aftermarket

Seals last around 3,800 hours and carry roughly 44% of ownership cost, aftermarket runs 37% of the market, and compressed air drives 31% of operating cost. Value comes from quoting seal life honestly, from owning sealing technology, and from selling service agreements. The seal rather than the pressure rating decides the whole economics here.

Quote Seal Life Alongside The Pressure Rating

Seal parts and replacement downtime carry roughly 44% of lifetime ownership cost, while quotations compare maximum pressure and capital price and settle nothing that matters. A supplier stating seal interval at quotation loses some comparisons on headline price and wins the buyers who calculate properly, and those buyers reorder. Operators who have already replaced seals every few thousand hours specify differently next time, which makes the honest quotation a durable position rather than a concession. Test laboratories are already adding guaranteed seal interval and consumable cost to their tender criteria.
Market Impact: Seals carry 44% of the lifetime own

Develop Sealing Technology Rather Than Buying Packages

Aftermarket seal kits, parts, and service run around 37% of total market revenue, and a manufacturer buying seal packages from a specialist hands both that recurring stream and the underlying technical position to a supplier the customer never meets. Developing sealing in-house captures the margin, allows material selection matched to the application, and is the actual barrier in this market rather than pressure capability, which many manufacturers can reach. It also opens hydrogen and high purity applications that purchased packages cannot satisfy. Material compatibility is a sealing question rather than a pressure one.
Market Impact: Aftermarket runs 37% of the total m

Sell Service Agreements Covering Whole Ownership Periods

Seal replacement every 3,800 hours creates a predictable service event that most manufacturers leave to distributors or to the customer's own maintenance team, which is where a competitor's seal kit enters the installed base. Agreements covering scheduled replacement across an ownership period convert that into contracted revenue and keep the original manufacturer present. They also produce operating data that makes the next equipment specification far easier to win. Distributor-supplied kits enter an installed base the original manufacturer paid to win. Refuelling operators are already contracting scheduled replacement across station networks.
Market Impact: Seals replace roughly every 3,800 h

State Compressed Air Consumption Explicitly In Quotations

Pneumatic boosters consume around 31% of operating cost in compressed air, and site air is routinely treated as free because it arrives from an existing plant system rather than from any metered supply. Stating consumption explicitly, and offering hydraulic drive alternatives wherever duty cycles justify them, removes a cost that buyers otherwise discover afterward. It also positions the supplier as the party who understood the application rather than the one who sold the cheapest machine. Plant energy audits have already found air consumption exceeding the original equipment capital cost outright.
Market Impact: Air consumption is 31% of the opera

Who Controls the Margin Pool

Concentration reaches 41% across the top five measured on units shipped weighted by pressure rating, and sealing technology holds it there rather than any pressure capability. Reaching several thousand bar is achievable for many manufacturers; sustaining it across thousands of hours with predictable seal life is not, and that difference decides both reliability and the aftermarket revenue that follows. The leader to challenger gap is widest in hydrogen and high purity applications.
Competitive activity runs on three fronts. Sealing system development is the first and by far the most consequential, since it determines seal life, aftermarket capture, and material compatibility all at once. Hydrogen-specific engineering is the second, because embrittlement and permeation require design from first principles rather than uprating. And aftermarket service network reach is the third, which decides who supplies the replacement kits.

Pressure arrives from two directions. Component manufacturers supplying seal packages capture margin from every builder who does not develop their own. And Chinese manufacturers are entering general industrial pressure ranges at costs Western producers cannot approach. Both pressures attack positions that equipment manufacturing alone was never going to defend.

Rankings shift on hydrogen project awards rather than industrial volume.
high-pressure-booster-market-company-positioning-matrix-1787301902318

Competitive Moat and Risk Dimensions

HASKEL INTERNATIONAL

Moat: Sealing depth and hydrogen engineering

Developing sealing systems in-house rather than buying packages captures the aftermarket revenue that follows every installation and allows material selection matched to gas compatibility, which matters enormously in hydrogen service. Hydrogen booster designs engineered from first principles rather than uprated from industrial ranges then hold a position competitors cannot reach by specification alone. Both capabilities took decades to build.
HASKEL INTERNATIONAL

Risk: Hydrogen deployment lags announcements

Hydrogen refuelling build rates have consistently fallen short of announced programmes, and a position weighted toward that application carries timing exposure no commercial effort resolves. Industrial and testing demand continues regardless and grows more slowly. Concentration in the fastest-growing application means concentration in the one whose timing nobody controls.
MAXIMATOR

Moat: Testing systems and application breadth

Supplying complete pressure testing systems rather than boosters alone puts the company inside a customer's certification process rather than in a component tender, and that testing is mandatory rather than discretionary. Application breadth across testing, industrial gas, and hydrogen also spreads engineering cost while giving the sealing knowledge repeated exposure to different service conditions.
MAXIMATOR

Risk: Systems work carries project timing

Complete testing systems are project sales with long lead times and lumpy revenue recognition, which sits awkwardly against the steady aftermarket stream that stabilises earnings in this market. Component competitors carry none of that engineering overhead. Systems capability wins the specification and complicates the quarter considerably.

Players Tracked

Prominent Players

Haskel International
Maximator
Hydratron
Resato International
SC Hydraulic Engineering

Other Key Players

Parker Hannifin
IDEX Corporation
Graco
Interpump Group
KAMAT
Hammelmann
Uraca
Nikkiso
PDC Machines
Hydro-Pac
Sera Group
Sitema
Air Squared
Shenzhen Vevor
Jiangsu Hanpu

Recent Developments

JANUARY 2025

Test laboratory specifies seal interval in equipment tender

A component certification laboratory added guaranteed seal replacement interval and consumable cost to its booster equipment tender criteria, following ownership costs well above what capital comparison had implied. The change was a procurement specification revision rather than any warranty claim, dispute, or supplier arrangement change.
Signal: Seal life enters tenders only after somebo
APRIL 2025

Manufacturer brings hydrogen seal development in-house

A booster manufacturer moved hydrogen-service sealing development into its own engineering organisation, replacing purchased seal packages to capture aftermarket revenue and control material compatibility. The change was internal capability investment rather than any acquisition, joint venture, or licensing arrangement with a seal specialist. Development covered several seal families.
Signal: The seal supplier holds the aftermarket th
AUGUST 2025

Refuelling station operator contracts scheduled seal replacement

A hydrogen refuelling operator contracted scheduled compression seal replacement across its station network rather than responding to failures, converting unplanned outages into planned maintenance events. The arrangement was a service contract rather than any joint venture, acquisition, or equity investment with the equipment manufacturer. Intervals were set against operating hours.
Signal: Contracted seal replacement keeps the orig

Seals, Machining and Pressure Testing

Precision machining of pressure-containing components carries roughly 29% of manufactured cost, sealing systems and consumable packages about 18%, forged and bar stock materials near 17%, drive assemblies and valves around 15%, and pressure testing, certification, assembly, and overhead the balance. Sealing cost is modest at manufacture and dominant across ownership, which is exactly the inversion buyers keep missing.
Specialty alloy and stainless bar pricing moved sharply through 2021 and 2022, and several fluid handling manufacturers disclosed material cost increases and extended lead times in annual filings covering those years. Machining capacity was the more acute constraint, since pressure-containing components require tolerances and inspection that general subcontractors cannot deliver. Skilled machining labour cost rose alongside and has not retreated at all. Inspection capacity remains a genuine constraint.

The competitive disadvantage mechanism runs through sealing capability rather than through material purchasing. A manufacturer buying seal packages pays a specialist's margin at manufacture and again on every replacement across a machine's life, while an integrated producer captures both and can match material to service conditions. Alloy and machining cost broadly the same for everyone; the sealing system does not, and it decides the aftermarket entirely.
high-pressure-booster-market-cost-volatility-analysis-1787301902594

Develop sealing systems rather than purchasing seal packages

Purchased seal packages carry a specialist's margin at manufacture and again on every replacement across a machine's operating life, which is roughly 37% of market revenue flowing to a supplier the customer never sees. Integrated development captures both and allows material selection matched to gas compatibility and temperature. The metallurgy and polymer knowledge involved takes years to build properly.

Qualify machining subcontractors on inspection rather than price

Pressure-containing components require tolerances and inspection documentation that general engineering subcontractors cannot reliably deliver, and a dimensional failure discovered at pressure test consumes the whole component. Qualifying subcontractors on measurement capability rather than on hourly rate costs more per hour and considerably less per accepted part. Most manufacturers learn this after scrapping something expensive.

Design ranges around shared pressure-containing component families

Precision machining carries roughly 29% of manufactured cost, and designing a distinct cylinder and body set for every model prevents volume in exactly the highest cost operation. Ranges built on shared pressure-containing families spread that machining volume considerably wider. The design constraint is real, and it costs far less than the machining disadvantage it removes across a product life.

Portfolio Architecture for Margin Defence

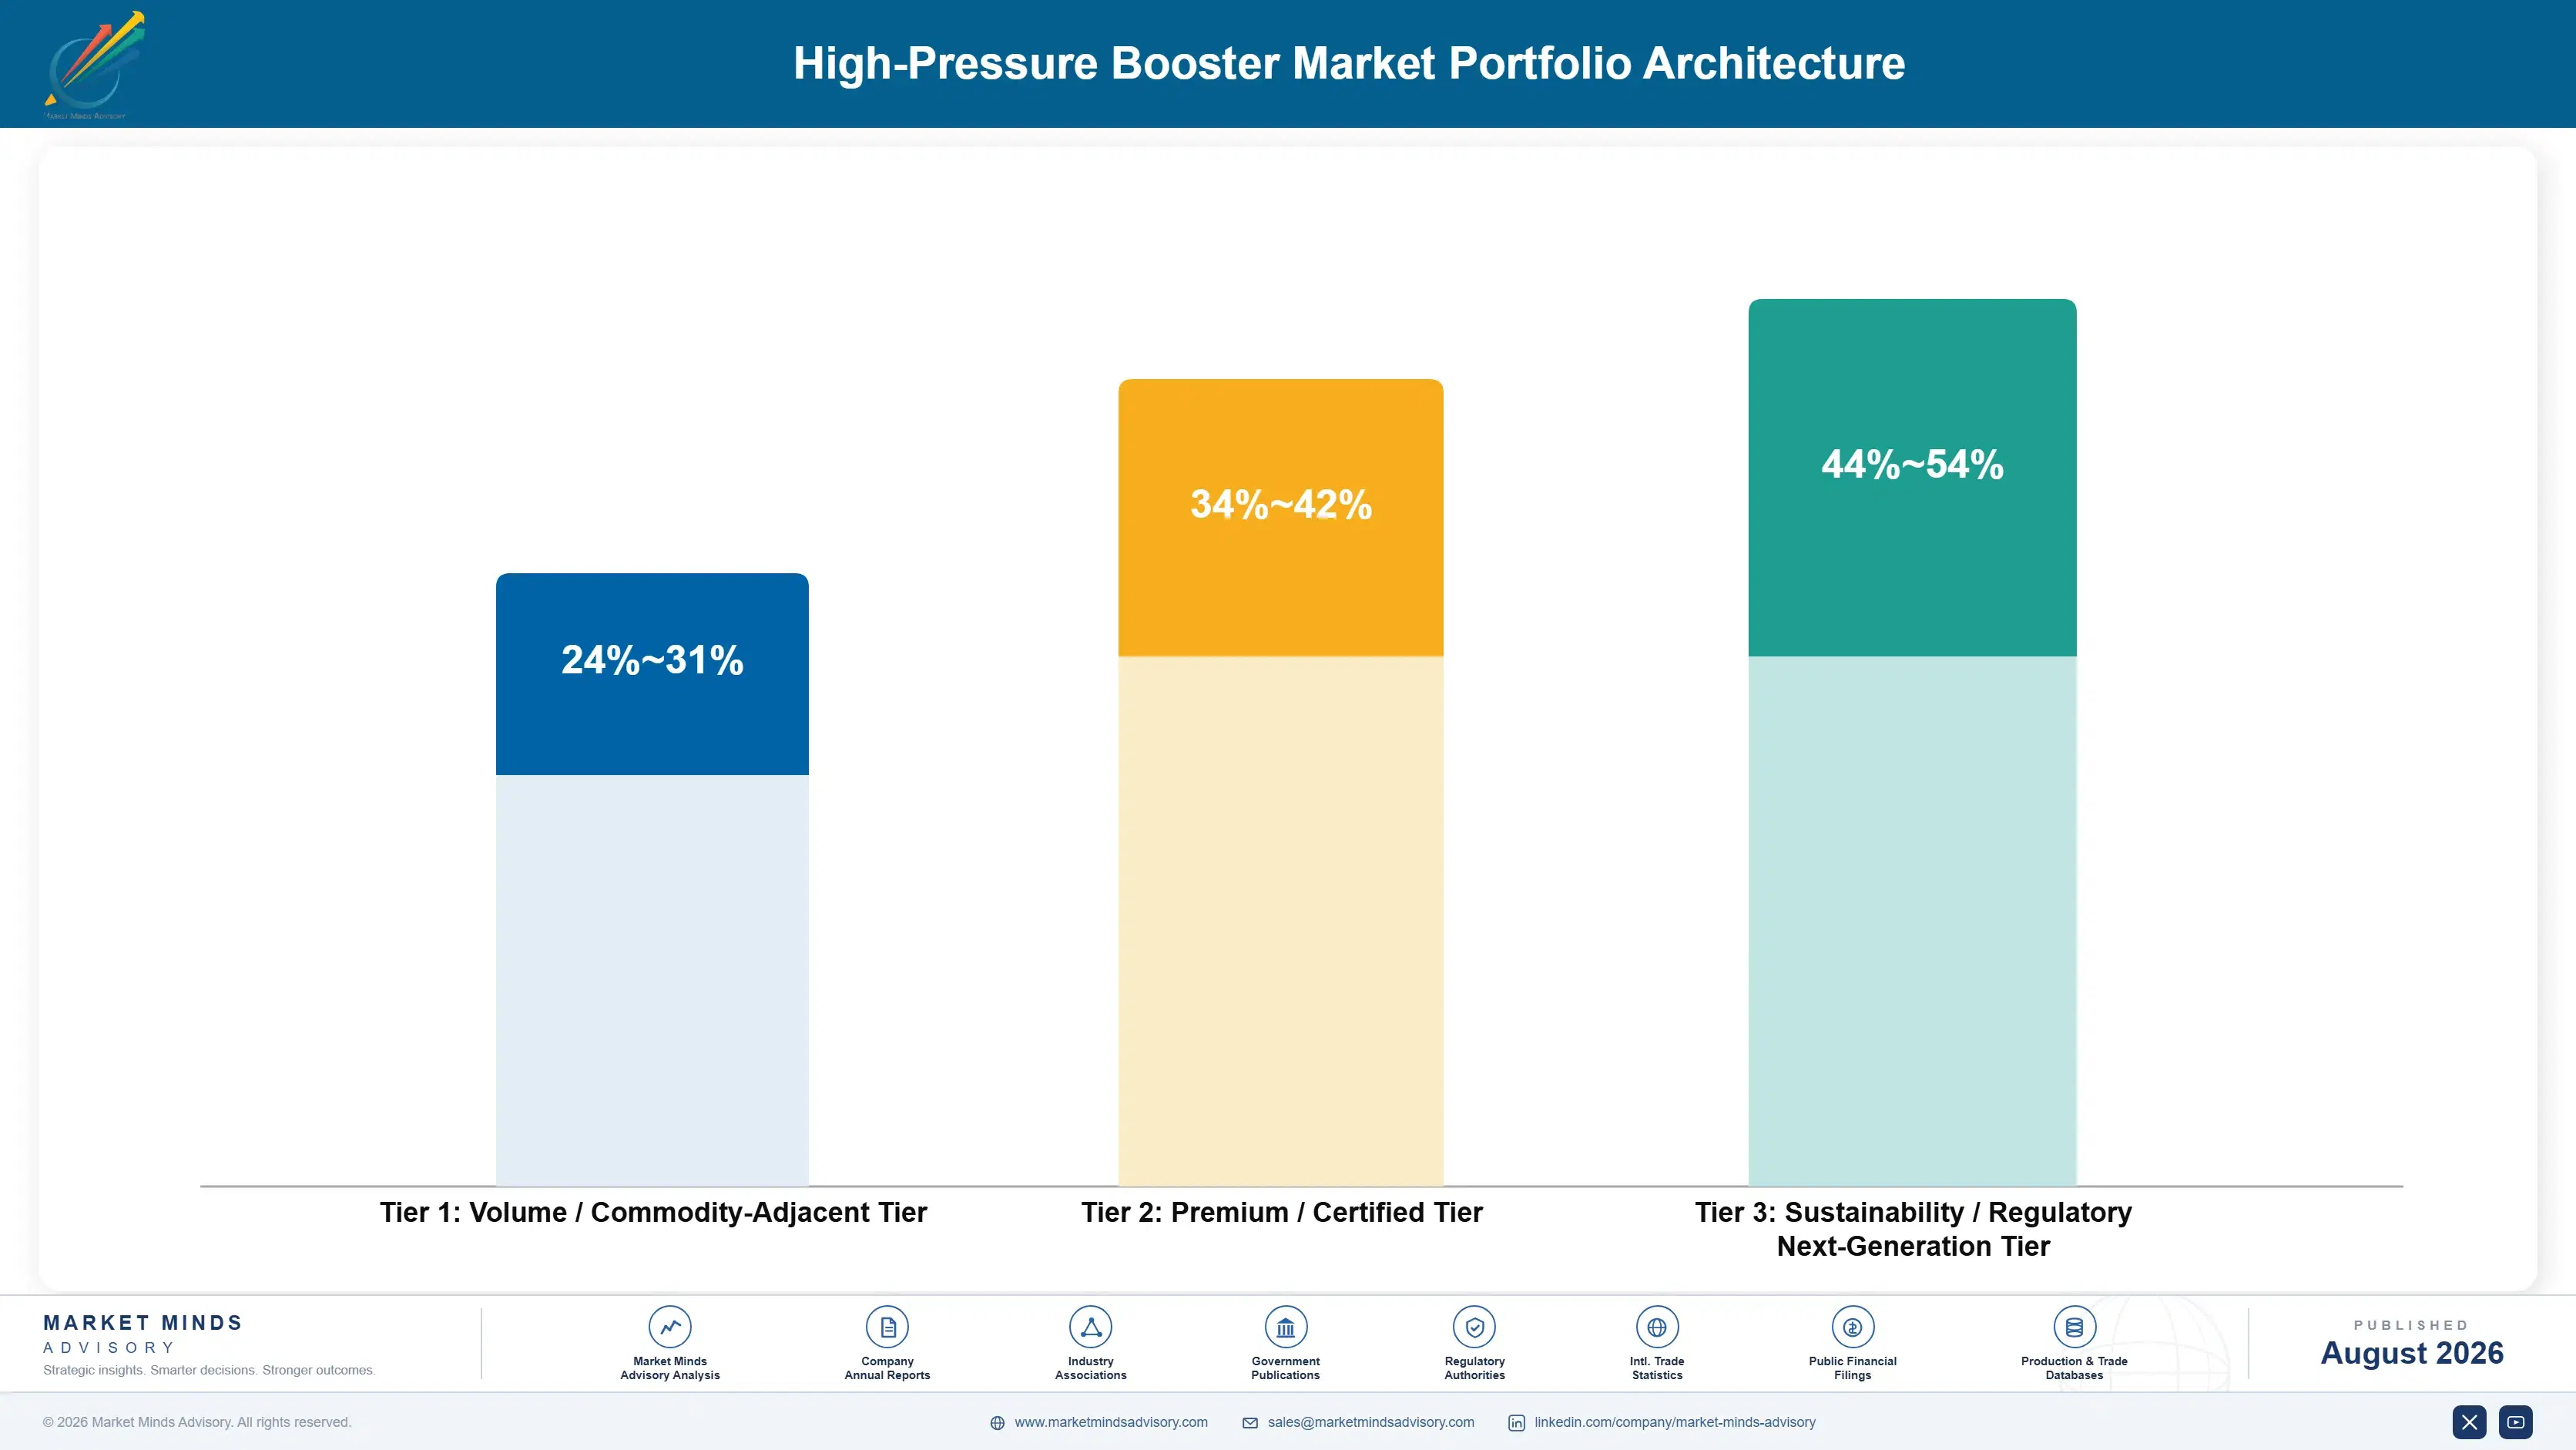
Three tiers describe this business and the spread follows sealing and application difficulty rather than pressure rating alone. General industrial boosters sit at the bottom, competing on capital price where Chinese manufacturers are entering steadily. Testing and process systems occupy the middle, sold on capability and integration. Hydrogen and high purity equipment sits at the top, where material compatibility and contamination consequence both apply and price comparison largely stops.
The tension is that aftermarket revenue, at roughly 37% of the market, attaches to whoever owns the sealing system rather than to whoever built the machine. A manufacturer buying seal packages watches that stream flow to a specialist across the whole installed base it created. One that developed sealing captures it and holds a technical position simultaneously. That single choice separates the earning manufacturers from the rest.

High-value pools concentrate where contamination or leakage has consequences beyond the equipment. Semiconductor gas handling and hydrogen dispensing are the clearest cases, since a seal failure ruins a process batch or creates a safety event rather than merely stopping a machine. Both pools sit well outside the capital price comparison entirely.

Volume / Commodity-Adjacent Tier

General industrial air-driven boosters for straightforward pressure duties, compared on capital price where Chinese manufacturers are entering steadily. Seal life is rarely quoted here, which is precisely where the ownership cost problem originates.
Gross Margin: 24-31%

Premium / Certified Tier

Pressure testing systems and process installations sold on capability and integration rather than component price. Certification testing is mandatory rather than discretionary, which puts the supplier inside a customer process instead of a tender.
Gross Margin: 34-42%

Sustainability / Regulatory / Next-Generation Tier

Hydrogen refuelling and high purity gas boosters where material compatibility, embrittlement, and contamination consequence all apply together. Best margin by a clear distance, and engineered from first principles rather than uprated from industrial ranges.
Gross Margin: 44-54%
high-pressure-booster-market-portfolio-architecture-1787301903150

Equipment, Seals and Service

Revenue arrives as equipment at installation and then as seal kits and service every few thousand operating hours, which makes the aftermarket stream considerably larger than the original sale across a machine life. Roughly 37% of total market revenue sits in that stream, and it flows to whoever owns the sealing system rather than automatically to the manufacturer who supplied the machine originally.
Stickiness depends on who holds the seal specification and the service relationship. A customer with a manufacturer service agreement buys original kits and stays inside that relationship; one maintaining equipment internally buys whichever kit a distributor stocks, and that decision rarely returns to the original supplier. Hydrogen and high purity installations stick considerably harder, since material compatibility documentation matters and substitution carries genuine risk.

Buyer profiles shifted as ownership costs accumulated across installed fleets. The earlier buyer was a project engineer comparing pressure ratings and capital prices at specification. The current conversation increasingly includes a maintenance manager who has replaced seal packages repeatedly and asks about intervals and consumable cost before anything else. Those buyers ask about consumable cost and service response before comparing capital prices.
high-pressure-booster-market-end-use-penetration-index-1787301903673

What We Would Tell a Board

These are among the four positions where our research anticipates prominent divergence between winners and laggards over the coming forecast period. Each is grounded in the demand model, the regulatory perimeter, and the announced capacity pipeline.
01 / SEAL LIFE DISCLOSURE

Quote the interval and lose the wrong comparisons

Seal parts and the downtime surrounding each replacement together carry roughly 44% of lifetime ownership cost, while quotations compare maximum pressure and capital price alone, settling nothing that actually matters to the buyer. A supplier stating the seal interval at quotation loses some comparisons on headline price and wins the buyers who calculate properly, and those particular buyers then reorder afterward. Operators who have already replaced seal packages every few thousand hours specify very differently indeed the next time around.
02 / SEALING CAPABILITY OWNERSHIP

The seal supplier is taking your aftermarket

Aftermarket seal kits, replacement parts, and service run around 37% of total market revenue, and a manufacturer buying seal packages hands both that recurring stream and the underlying technical position to a supplier the end customer never even meets. Developing sealing systems in-house captures that margin and allows material selection matched to gas compatibility and service temperature directly. That sealing capability is the genuine barrier in this market rather than pressure capability, which a great many manufacturers can now reach.
03 / SERVICE CONTRACT CAPTURE

A predictable failure is a contract, not a nuisance

Seal replacement roughly every 3,800 operating hours creates an entirely predictable service event that most manufacturers simply leave to distributors, or to the customer's own maintenance team to handle for themselves. That is exactly the point at which a competitor's seal kit enters an installed base which the original manufacturer created and paid a great deal to win. Agreements covering scheduled replacement convert that event into contracted revenue, and they produce operating data that makes winning the next equipment specification considerably easier.
04 / AIR CONSUMPTION TRANSPARENCY

Free compressed air is nothing of the sort

Pneumatically driven boosters consume around 31% of operating cost in compressed air, and site air is routinely treated as free because it arrives from an existing plant system rather than any metered supply. Stating consumption explicitly at quotation and offering hydraulic drive alternatives where duty cycles justify them removes a cost buyers otherwise discover through an energy audit. It also positions the supplier as the party who understood the application properly rather than the one who sold the cheapest available machine.

Engagement Snapshot From the Field

A live engagement with an industry participant carrying material or product regulatory and market exposure ahead of a defining policy shift, showing how our research translates into a defensible multi-year portfolio strategy.
MARKET MINDS ADVISORY · CLIENT ENGAGEMENT SUMMARY
High-Pressure Booster Producer Strategic Portfolio Review and Transition Roadmap 2026·Investment Scenario on High-Pressure Booster Exposure Evaluation 2025-26
CLIENT PROFILE
A high pressure equipment manufacturer with approximately 130 million dollars in annual revenue (client-reported, unverified by MMA), producing air-driven boosters and pressure testing systems across industrial, energy, and laboratory customers in two regions. Sealing packages were purchased from a specialist supplier, aftermarket revenue was modest, and gross margin had declined for three consecutive years despite growing unit volume.
STRATEGIC CHALLENGE
Management attributed the margin decline to competitive capital pricing and proposed a machining cost reduction programme. The board wanted an independent view on where margin was actually leaking before committing capital to a manufacturing initiative that addressed only a portion of the cost structure. Aftermarket flows had never been traced at all. Consumable margin was entirely unmeasured.
MMA APPROACH
We traced aftermarket seal kit demand across the client's installed base to determine who was actually supplying it. Margin was decomposed between equipment and consumables. Lost repeat orders were reviewed against whether seal life had been quoted originally, and hydrogen and high purity opportunities were assessed against the client's existing sealing capability.
KEY FINDINGS
  1. The substantial majority of seal kits consumed across the client's installed base were being supplied directly by the seal specialist rather than by the client itself.
  2. Consumable margin at the specialist exceeded the client's equipment margin, on parts fitted exclusively to machines the client had built and sold.
  3. Repeat order rates were markedly higher among the minority of customers where seal interval had been stated in the original quotation. Disclosure explained the difference.
  4. Hydrogen and high purity opportunities had been declined on material compatibility grounds the client could not resolve without owning sealing development. Capability was the constraint.
CLIENT PROFILE
A high pressure equipment manufacturer with approximately 130 million dollars in annual revenue (client-reported, unverified by MMA), producing air-driven boosters and pressure testing systems across industrial, energy, and laboratory customers in two regions. Sealing packages were purchased from a specialist supplier, aftermarket revenue was modest, and gross margin had declined for three consecutive years despite growing unit volume.
STRATEGIC CHALLENGE
Management attributed the margin decline to competitive capital pricing and proposed a machining cost reduction programme. The board wanted an independent view on where margin was actually leaking before committing capital to a manufacturing initiative that addressed only a portion of the cost structure. Aftermarket flows had never been traced at all. Consumable margin was entirely unmeasured.
MMA APPROACH
We traced aftermarket seal kit demand across the client's installed base to determine who was actually supplying it. Margin was decomposed between equipment and consumables. Lost repeat orders were reviewed against whether seal life had been quoted originally, and hydrogen and high purity opportunities were assessed against the client's existing sealing capability.
KEY FINDINGS
  1. The substantial majority of seal kits consumed across the client's installed base were being supplied directly by the seal specialist rather than by the client itself.
  2. Consumable margin at the specialist exceeded the client's equipment margin, on parts fitted exclusively to machines the client had built and sold.
  3. Repeat order rates were markedly higher among the minority of customers where seal interval had been stated in the original quotation. Disclosure explained the difference.
  4. Hydrogen and high purity opportunities had been declined on material compatibility grounds the client could not resolve without owning sealing development. Capability was the constraint.
RECOMMENDED STRATEGY
Phase 1: Phase 1 (months one to twelve): defer the machining programme, begin in-house sealing development starting with the highest volume seal families. Phase 2: Phase 2 (months twelve to twenty-four): state seal interval in every quotation and launch scheduled replacement service agreements. across the installed base. Phase 3: Phase 3 (months twenty-four to forty-two): enter hydrogen and high purity applications once sealing capability supports the material requirements. and compatibility documentation.
OUTCOME
The machining programme was deferred. In-house sealing development covered the two highest volume families within four quarters, service agreements began recovering aftermarket revenue from the installed base, and the first hydrogen enquiry was quoted rather than declined (client-reported, unverified by MMA). Machining costs were left unchanged throughout.

Frequently Asked Questions

Foundational context covering the market sizes, CAGR, scope, country, region and competition that inform every finding below. This section is provided to cover basics and most often pre-purchase conversations, answered from the MMA Primary Research Dataset.

What is the current size of the High-Pressure Booster Market?

The market is valued at USD 4.6 billion in 2025, rising to USD 4.99 billion in 2026. Scope covers pressure boosting equipment and its seal and service aftermarket, not general pumps, compressors, or storage vessels.

How large will the High-Pressure Booster Market be by 2036?

MMA forecasts USD 11.18 billion by 2036, an increase of USD 6.19 billion over the 2026 base. That represents an expansion multiple of 2.24 times across the forecast period.

What is the CAGR for the High-Pressure Booster Market 2026 to 2036?

The base case CAGR is 8.4%, with a bull case of 9.6% and a bear case of 7.2%. The historical rate from 2020 to 2025 was 7.0%, carried by industrial testing rather than any new application.

Which segment is growing fastest?

Hydrogen refuelling and compression boosters at 12.6%, exactly 1.50 times the market rate. Vehicle dispensing requires 700 bar and materials that resist embrittlement, which rules out conventional industrial equipment.

Who are the major companies in the High-Pressure Booster Market?

Haskel International, Maximator, Hydratron, Resato International, and SC Hydraulic Engineering lead on units shipped weighted by pressure rating. The top five hold 41%, concentrated on sealing technology rather than pressure capability.

Which country is growing fastest?

India at 10.8%, where industrial gas, pressure testing, and chemical process investment are expanding simultaneously while manufacturers supplying export markets require documented proof and burst testing.

Report Segmentation Architecture

The full report scope spans multiple orthogonal segmentation dimensions, with cross-tabulated demand data provided for each dimension pair. Coverage extends further to regional breakdowns, trend trajectories, and the competitive detail needed to support segment-level decision-making.

By Drive Method And Service Application

  • Air-Driven Liquid And Gas Boosters
  • Hydraulic Intensifiers And Pressure Amplifiers
  • Hydrogen Refuelling And Compression Boosters
  • Water Jet Cutting And Testing Pumps
  • Seal Kits And Replacement Service

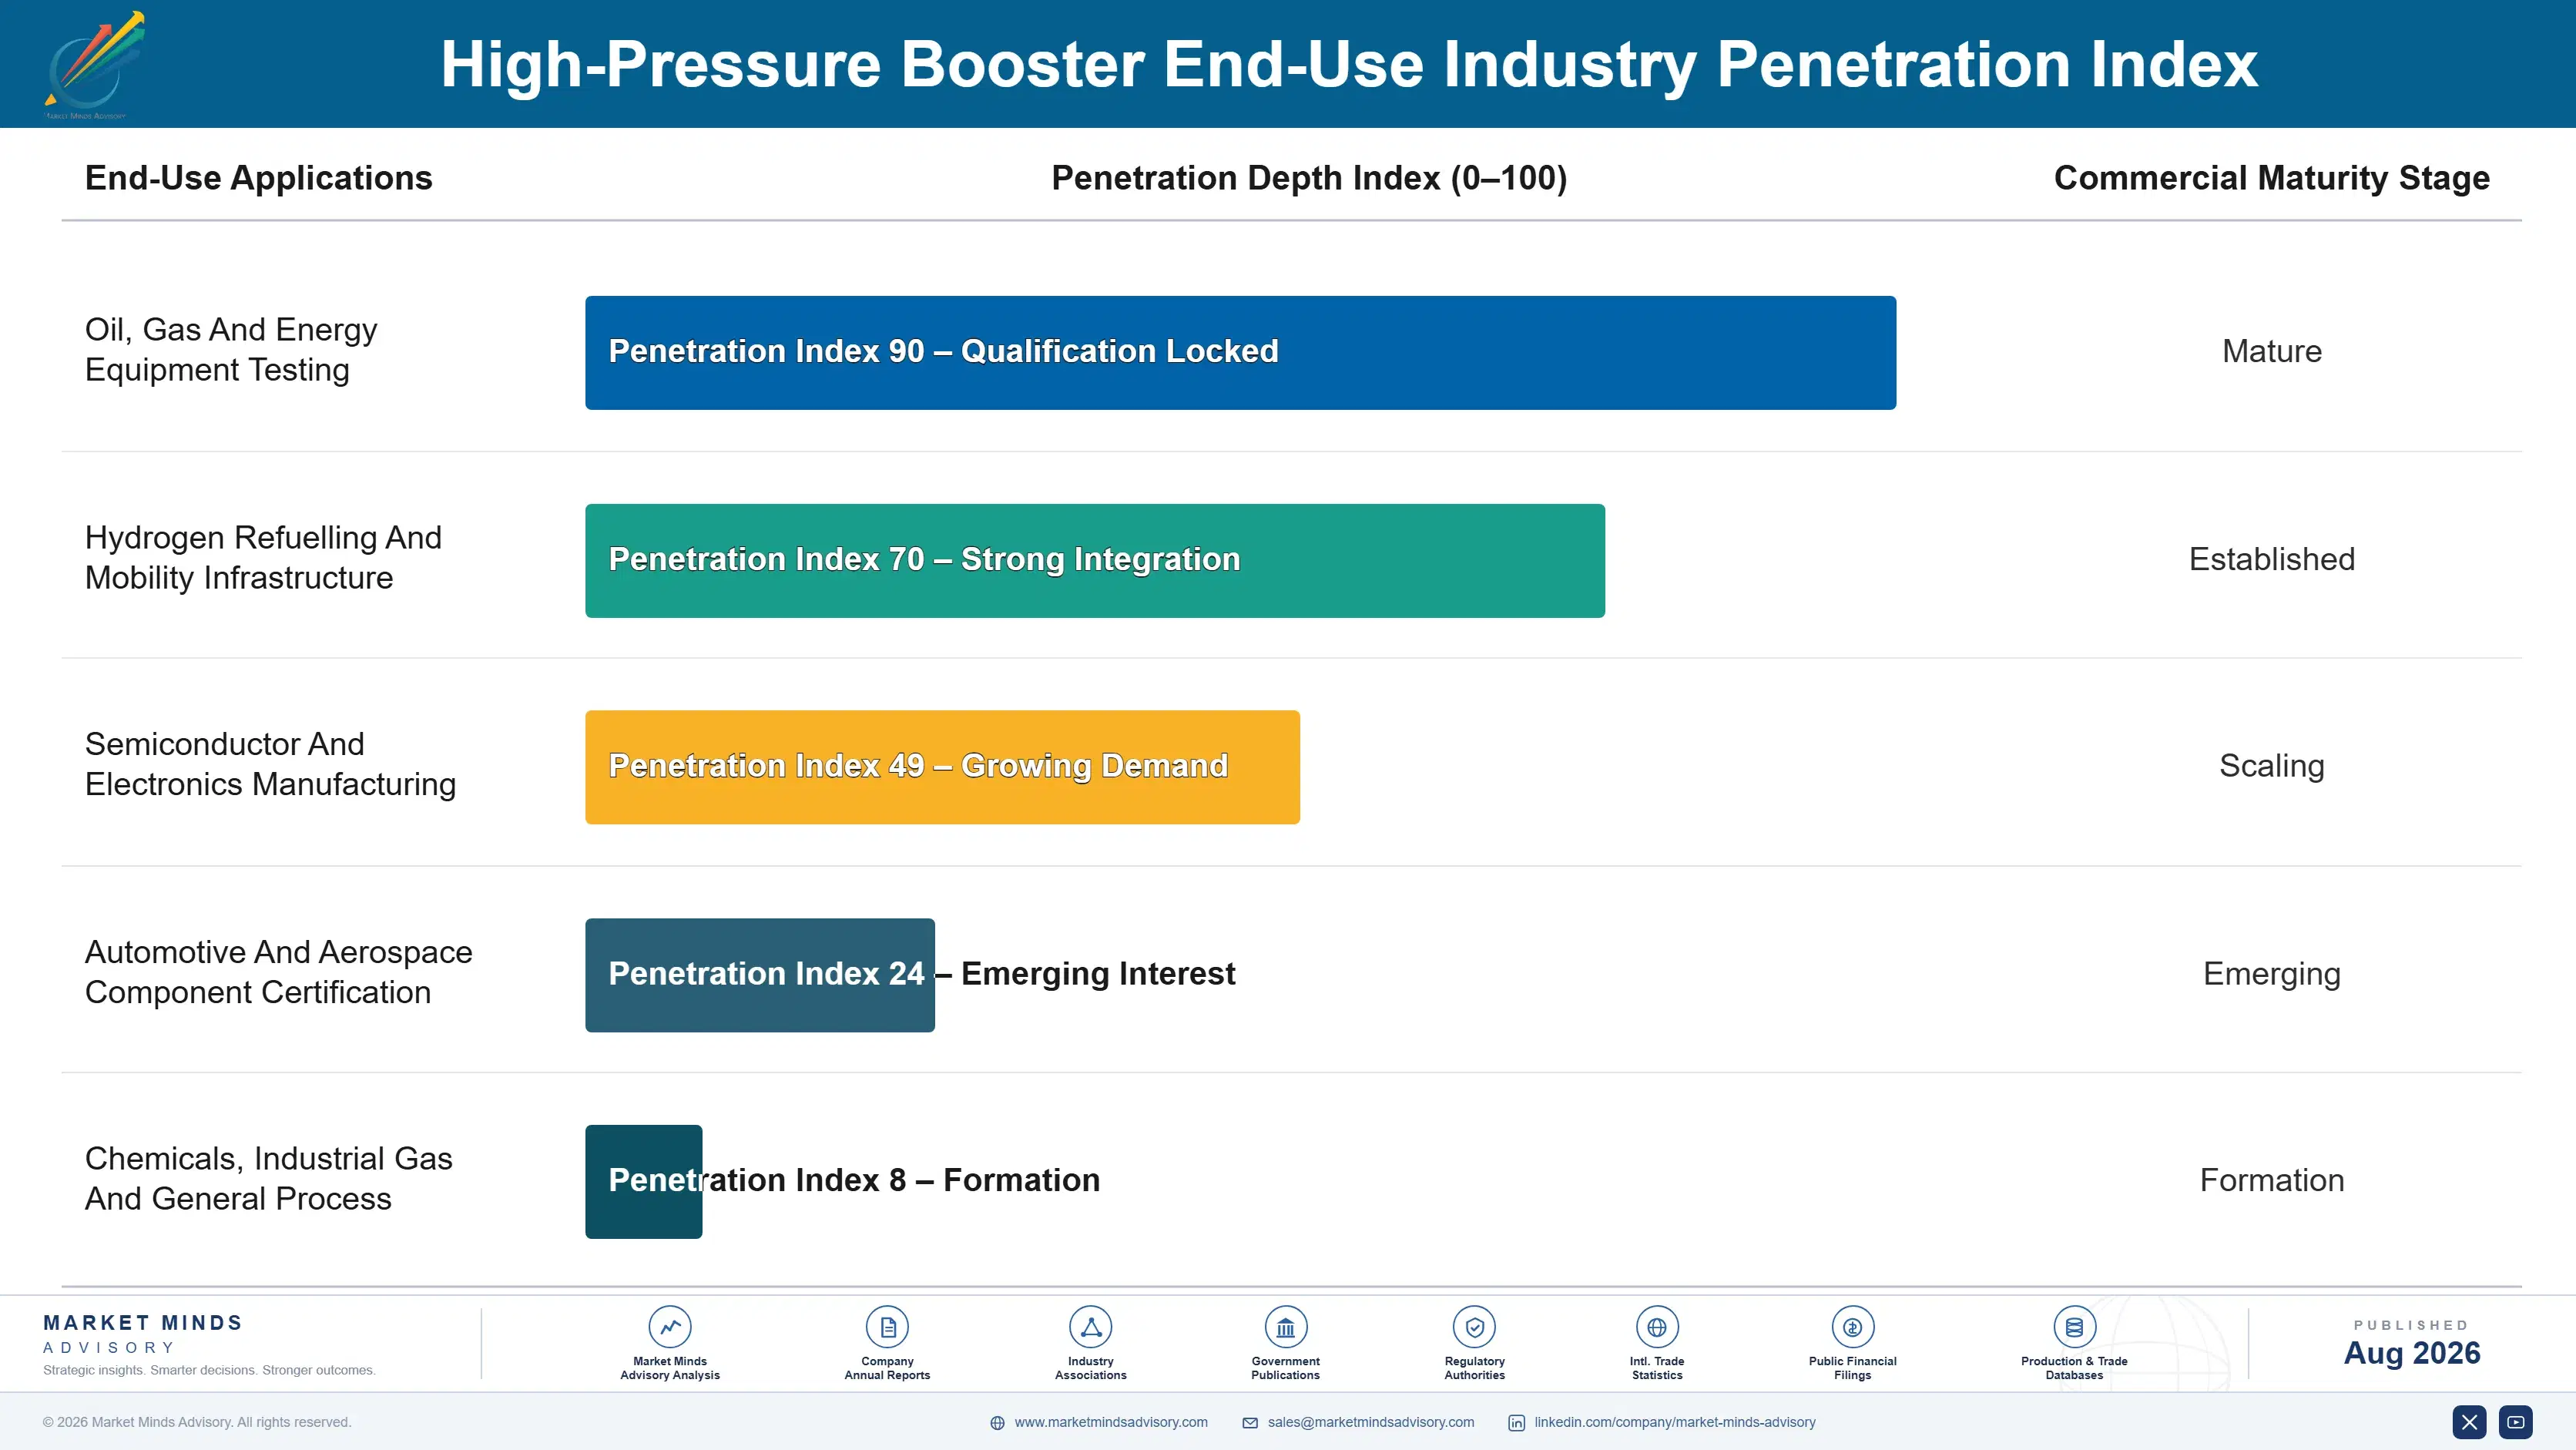
By End-Use Industry

  • Oil, Gas And Energy Equipment Testing
  • Hydrogen Refuelling And Mobility Infrastructure
  • Semiconductor And Electronics Manufacturing
  • Automotive And Aerospace Component Certification
  • Chemicals, Industrial Gas And General Process

By Commercial Model

  • Direct Equipment Supply To End Users
  • Complete Testing System Integration Projects
  • Distributor And Industrial Reseller Channels
  • Scheduled Service And Seal Replacement Agreements
  • Original Equipment Supply To Machine Builders

By Region

  • East Asia
  • Western Europe
  • North America
  • South Asia and Pacific
  • Latin America
  • Middle East and Africa
  • Eastern Europe

Scope, Methodology, and Coverage

Every figure in this report is reproducible from documented input assumptions. The scope below maps the historical period, the forecast horizon, the segmentation dimensions, and the countries covered, alongside the underlying primary and qualitative methodology.
Historical Period
2020 to 2025
Forecast Period
2026 to 2036
Base Year
2025 (USD billions; MMA Primary Research Dataset, August 2026)
Market Definition
This market comprises pressure boosting equipment that raises liquid or gas pressure above standard supply levels for industrial process, testing, dispensing, and compression applications, measured at manufacturer revenue across equipment sales, systems projects, and aftermarket consumables and service. Coverage spans air-driven liquid and gas boosters, hydraulic intensifiers and pressure amplifiers, hydrogen refuelling and compression boosters, water jet cutting and testing pumps, and seal kits and replacement service supplied for that equipment. General industrial pumps and compressors operating below booster pressure ranges, standard hydraulic power units, gas cylinders, storage vessels and tube trailers, pipeline transmission compressors, and compressed air generation equipment fall outside scope.
Quantitative Units
USD billions (current prices); units shipped weighted by pressure rating; seal replacement intervals in operating hours; aftermarket against original equipment revenue split
Segmentation Dimensions
By Drive Method And Service Application; By End-Use Industry; By Commercial Model; By Region
Regions Covered
East Asia, Western Europe, North America, South Asia and Pacific, Latin America, Middle East and Africa, Eastern Europe
Countries Covered
China, Japan, South Korea, Taiwan, Germany, Netherlands, United Kingdom, France, Italy, Switzerland, United States, Canada, Mexico, India, Australia, Singapore, Brazil, Argentina, Saudi Arabia, United Arab Emirates, Qatar, South Africa, Poland, Czechia, and additional markets relevant to this sector
Key Companies Profiled
Haskel International, Maximator, Hydratron, Resato International, SC Hydraulic Engineering, Parker Hannifin, IDEX Corporation, Graco, Interpump Group, KAMAT, Hammelmann, Uraca, Nikkiso, PDC Machines, Hydro-Pac, Sera Group, Sitema, Air Squared, Shenzhen Vevor, Jiangsu Hanpu
Quantitative Methodology
Primary survey, n=3,800 respondents, Q4 2025, six countries; demand-side model with trade association cross-validation
Qualitative Methodology
47 expert interviews, Q4 2025; applied to validate demand model assumptions, identify emerging dynamics, and assess competitive positioning
Report Format
PDF and XLSX data workbook (Word format preview document)
Publisher
Market Minds Advisory
Report Code
MMA-2026-CON-693
Published
August 2026
Contact
sales@marketmindsadvisory.com | www.marketmindsadvisory.com

Purchase the full High-Pressure Booster Market Report (2026 to 2036).

The full report sizes high-pressure boosters across five drive and application categories, five end-use industries, five commercial models, and seven regions, with aftermarket consumables reported separately from original equipment throughout. Lifetime ownership cost is modelled including seal replacement and downtime, since capital comparison alone reverses the answer across most duty cycles. Sealing capability is assessed separately from pressure capability, because it determines aftermarket capture. Competitive profiling covers twenty companies on units shipped weighted by pressure rating, and hydrogen station build rates are tracked against announced programmes.
Aftermarket consumables reported separately from original equipment revenue
Lifetime ownership cost modelled including seal replacement and downtime
Sealing capability assessed separately from pressure rating capability
Hydrogen station build rates tracked against announced programme volumes
Compressed air consumption quantified across pneumatic booster duty cycles
Seal interval performance compared across service conditions and gases

Built For The People Who Decide

From boardroom strategy to bench-side execution, this report is read cover-to-cover by leaders shaping the next decade of their industry, turning demand scenarios, market dynamics and valuation benchmarks into decisions.
CXOs/ Presidents/ VPs/ Managers
M&A and Corporate Development
Strategy Teams and R&D Heads
Procurement and Product Directors
Regulatory and Compliance Leaders
Investor Relations and Equity Analysts