Market Minds Advisory
High Performance Data Analytics (HPDA) Market

High Performance Data Analytics (HPDA) Market: High Performance Data Analytics Market: Utilisation Economics, Accelerator Supply and Workload Placement 2026 to 2036

A supercomputing cluster costs the same whether it runs at 90% utilisation or 40%. That single fact governs how this equipment is bought, priced, shared and eventually justified to somebody.

Lead Analyst

Published

September 2026

Make Smarter Decisions with Customized Research Insights

Request a free sample report and evaluate market opportunities, growth trends, and competitive dynamics relevant to your business needs.

2025 MARKET VALUE$19.6BMarket Size 2025
2036 FORECAST VALUE$65.6BBase Case , 2026 to 2036
CAGR 2026 TO 203611.6 %Bull 12.9% / Bear 10.3%
INCREMENTAL OPPORTUNITY$43.7BNet 10- year value creation
EXPANSION MULTIPLE3.00x2036 value over 2026 base
Strategic Levers
M&A Pipeline
Regional Outlook
Country Rankings
Competitive Intelligence
Segmental Deep-dive
Call-Us : 91 93563 13602

Executive Snapshot and Market Trajectory.

A high performance computing cluster costs the same to own whether it runs at 90% utilisation or at 40%. That single fact governs how this equipment gets bought, priced, shared and eventually justified to whoever signed for it, far more than any benchmark comparison ever does.
The market reaches USD 21.9 billion in 2026 and USD 65.6 billion by 2036, a 3.00 times expansion at 11.6% annually. Accelerator-based analytics infrastructure grows at 17.4%, half again the market rate of 11.6%, because the workloads that justify these systems have moved decisively toward parallel computation. East Asia holds 28% of global spending, and India compounds fastest of any market at 18.6% on national computing programmes that are being funded right now.
Five suppliers hold 58% of high performance analytics infrastructure and software revenue, and accelerator supply concentration sits underneath that as the more binding constraint. Hewlett Packard Enterprise, Dell Technologies, Lenovo, Atos Eviden and Fujitsu lead on system integration work. Delivery timelines depend on accelerator allocation that none of them fully controls, which shapes competitive position considerably more than engineering capability or benchmark performance ever manage to.
Market Definition
This report covers high performance data analytics infrastructure and software by system class: accelerator-based analytics infrastructure, general-purpose cluster compute systems, high performance storage and parallel file systems, cluster interconnect and fabric equipment, workload management and scheduling software, and analytics frameworks and runtime environments. It excludes general enterprise data centre servers, cloud infrastructure services sold by hour, business intelligence and reporting software, database licences, and consulting or managed analytics services.
Base Year Value
$19.6B in 2025 (MMA Primary Research Dataset, September 2026)
Forecast Period
2026 to 2036, eleven discrete annual values
CAGR
11.6% base case. Bull 12.9%. Bear 10.3%.
Fastest Growth Segment
Accelerator-Based Analytics Infrastructure: 17.4% CAGR
Fastest Growth Country
India: 18.6% CAGR
Fastest Growth Region
South Asia and Pacific: 13.9% CAGR
Largest Region
East Asia: 28% of 2025 global value
Market Leaders
Hewlett Packard Enterprise, Dell Technologies, Lenovo, Atos Eviden and Fujitsu lead on high performance analytics infrastructure and software revenue. Source: MMA Analysis.
Primary Survey
n=3,800 procurement and R&D decision-makers, Q4 2025, six countries
Methodology
Demand-side build-up, cross-validated against public data, 47 expert interviews

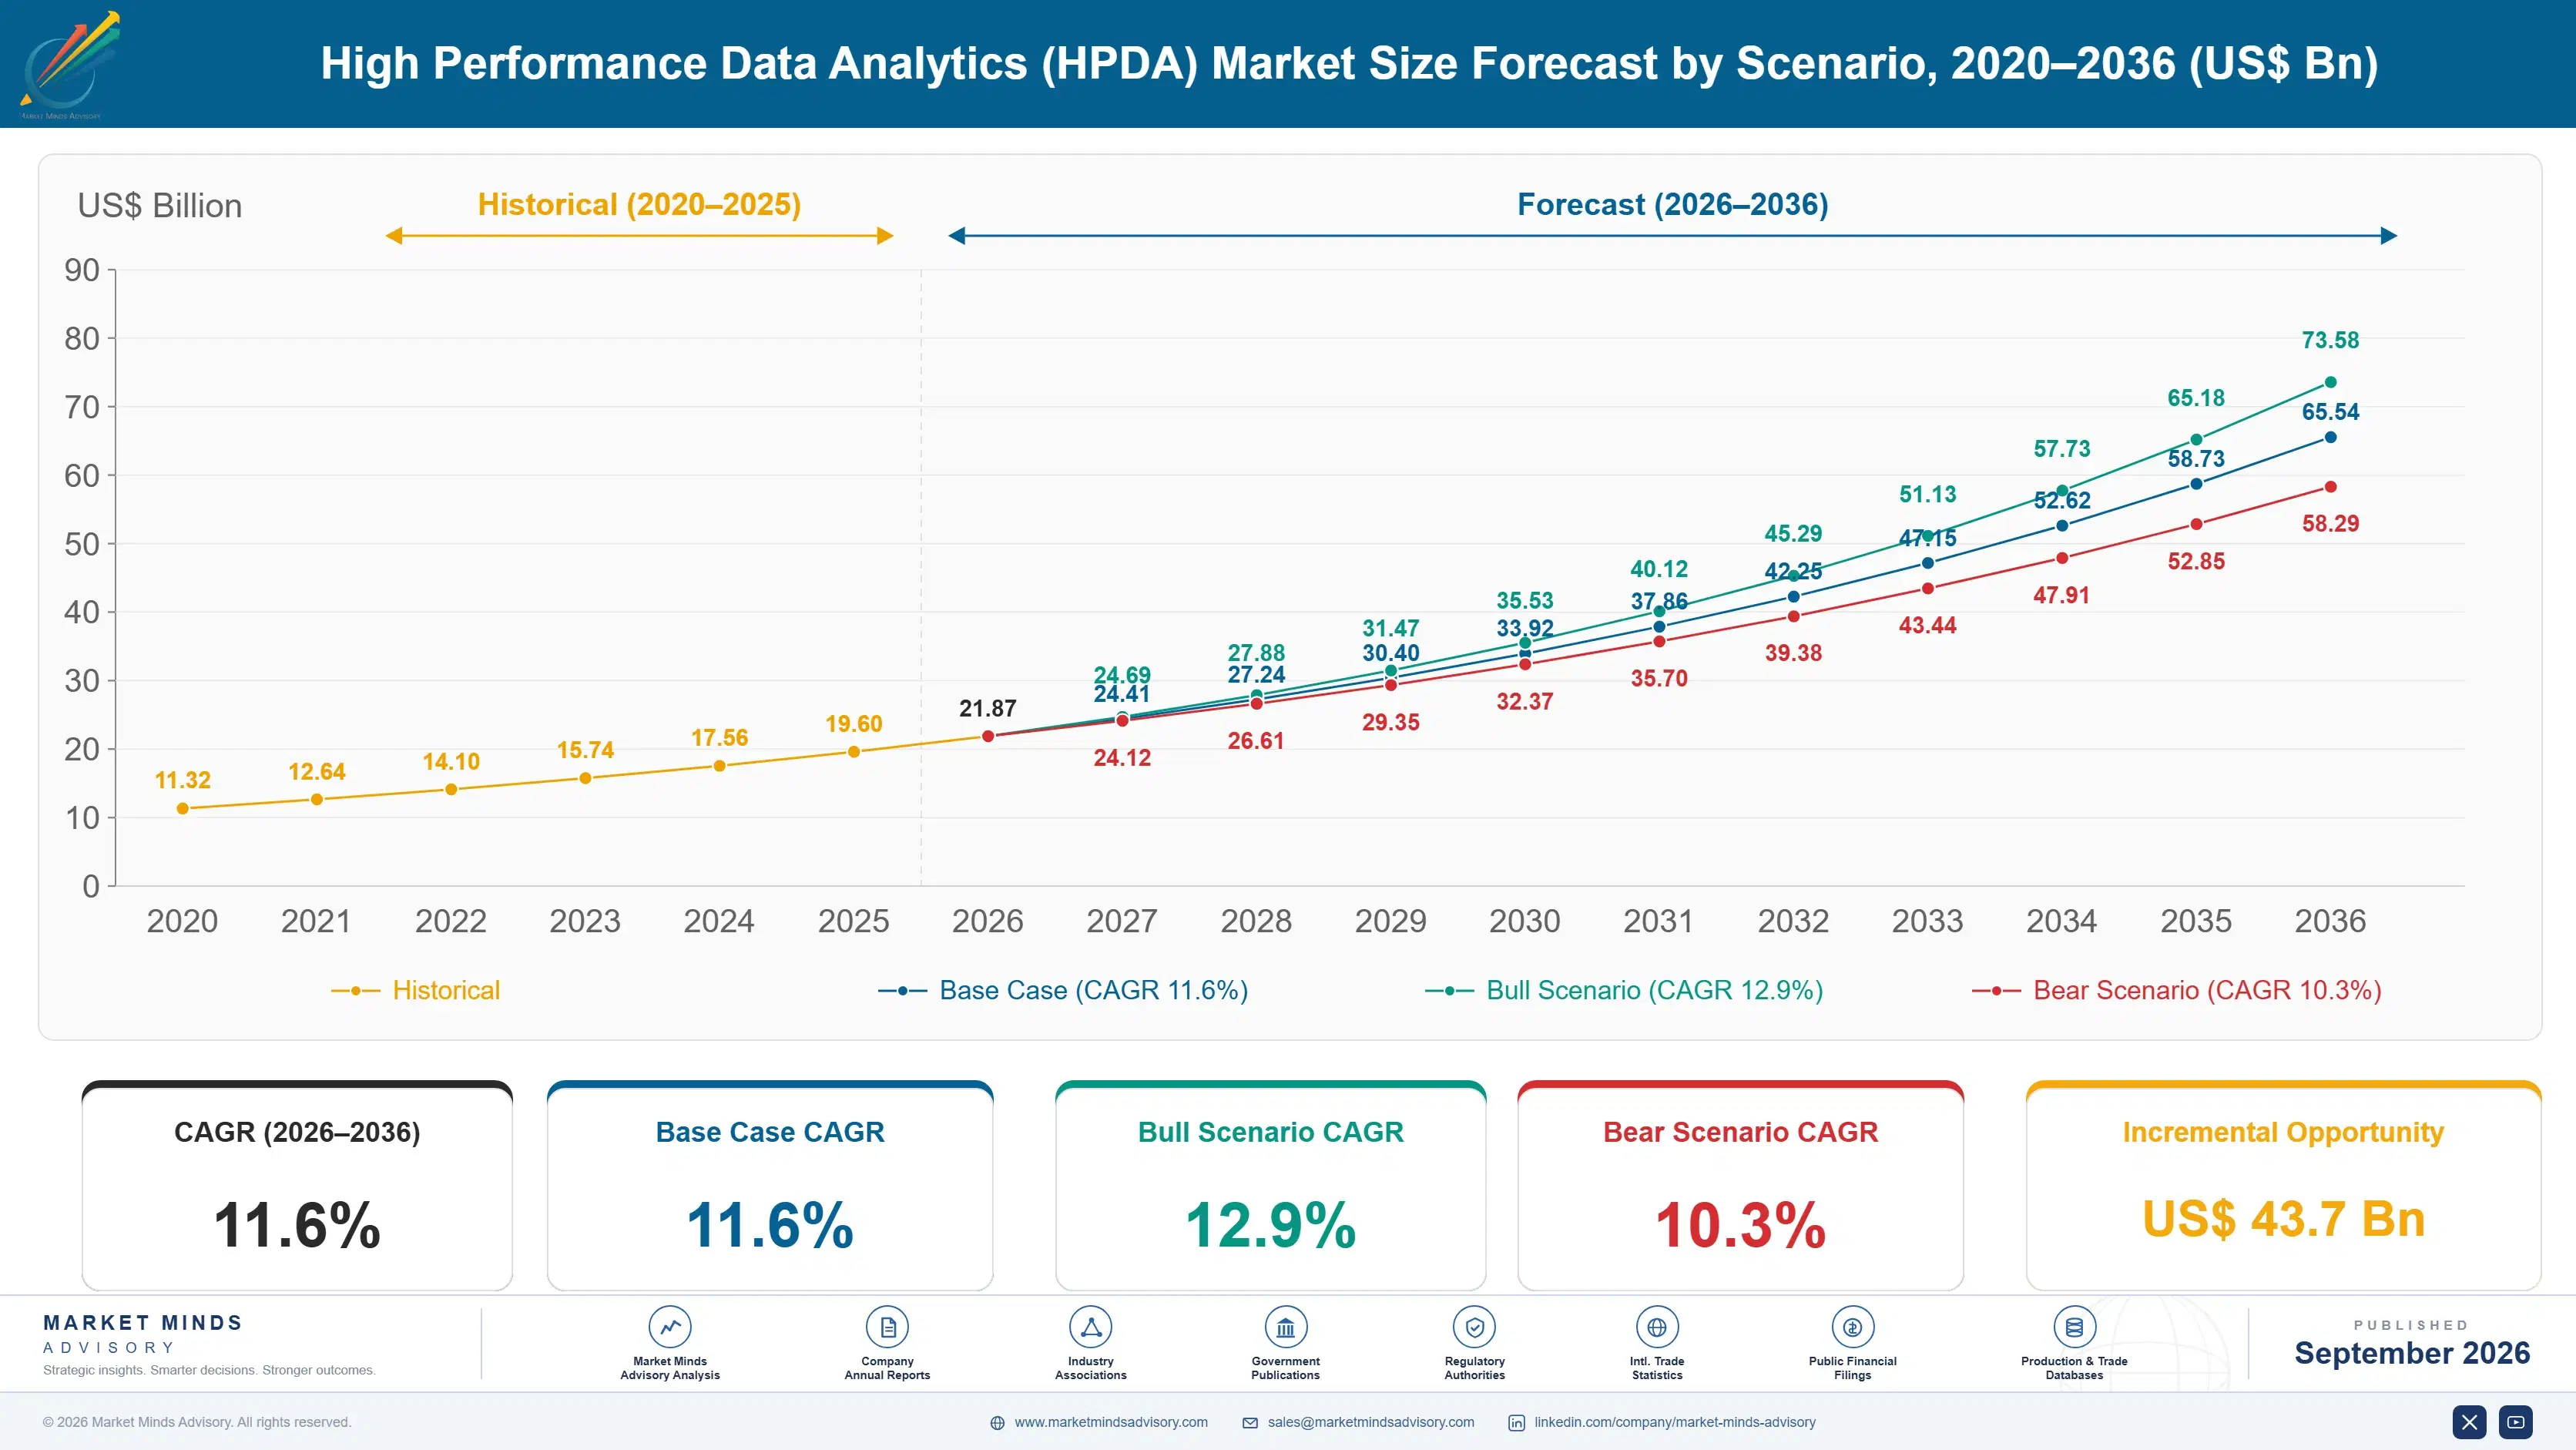
High Performance Data Analytics (HPDA) Market Forecast Scenarios

high-performance-data-analytics-hpda-market-size-forecast-scenario-1789993872674
Between 2020 and 2025 the category compounded at 10.4%, and the period reordered what these systems are actually bought for. Scientific simulation had driven the market for decades; machine learning training arrived and pulled procurement toward parallel accelerator architectures within a few years. Accelerator supply then became the binding constraint on delivery rather than budget, and organisations that had never competed for silicon allocation found themselves doing exactly that.
The base case holds 11.6% on three mechanisms. Workloads keep shifting toward parallel computation, which raises accelerator content per system and therefore value per deployment rather than merely unit count. National computing programmes across India, the Gulf and Southeast Asia are funding capability that did not previously exist anywhere in those countries. And utilisation pressure pushes organisations toward shared and scheduled infrastructure, which raises spending on workload management software considerably.
The bull case at 12.9% assumes accelerator supply eases enough that deferred deployments arrive alongside new ones, compressing demand into a shorter period. The bear case at 10.3% is that cloud consumption absorbs workloads that would otherwise have justified owned infrastructure, which removes capital purchases from this market entirely even as the underlying computation continues growing.

Utilisation Decides The Economics

The economics of this market rest on a fixed cost. A cluster depreciates on the same schedule whether it runs at 90% utilisation or 40%, and owned installations average around 63%. Every commercial argument in the category traces back to that gap: sharing arrangements, scheduling software, consortium purchasing and the persistent temptation to move the whole workload into a cloud where somebody else carries the idle time.
TOP FIVE CONCENTRATION58%Among system integrators rather than the component suppliers underneath
AVERAGE CLUSTER UTILISATION63%Across owned academic and enterprise installations during normal operation
ACCELERATOR SHARE OF COST46%Parallel compute silicon within total system purchase price
DEPLOYMENT LEAD TIME9 monthsFrom purchase order through to production workload acceptance
SYSTEM REFRESH CYCLE5 yearsBefore compute capability falls behind competing new installations
POWER DENSITY PER RACK58 kilowattsRequiring cooling that conventional facilities frequently cannot supply
What is bought has changed faster than who buys it. Scientific simulation drove this market for decades and now sits alongside machine learning training, which pulls procurement toward parallel accelerators. Those accelerators are roughly 46% of system cost and their supply, not budget, determines delivery dates. Institutions that never had to compete for silicon allocation now find themselves negotiating for it years ahead of need.
The third constraint is physical and it catches buyers repeatedly. Modern accelerator racks draw around 58 kilowatts, which conventional data centre cooling was never designed to remove. Organisations buy the system and then discover the building cannot host it, adding facility work and months of delay to a project already sized against a 9 month lead time. Site readiness now determines schedules as often as supply does.
"The question nobody asks early enough is where the machine will actually sit. Procurement runs a rigorous benchmark comparison, signs, and then somebody walks into the machine room and works out the cooling cannot take it. That conversation costs more months than the supply queue does."
Director, High Performance Computing and Advanced Analytics Practice · MMA Technology Practice · September 2026

Market Trends

Accelerator Architecture Displaces General Purpose Cluster Compute

Machine learning training and increasingly simulation itself both favour massively parallel computation, which pulled procurement toward accelerator-based systems within a remarkably short period of time. Accelerators now account for roughly 46% of total system cost, so the shift raises value per deployment rather than simply changing what happens to get installed. Accelerator-based analytics infrastructure grows at 17.4% against 11.6% for the market as a whole. General-purpose cluster compute still serves those workloads that parallelise poorly or not at all, and that category now grows at only a fraction of the overall market rate.
Market Impact: India compounds at 18.6% annually
Power Density Turns Facilities Into A Constraint

Accelerator racks now draw around 58 kilowatts each, which conventional air-cooled data centre design was never built to handle at anything approaching this scale. Organisations repeatedly complete a procurement and then discover that the building cannot host what they have bought, adding facility work and several further months to a project already carrying a 9 month component lead time. Liquid cooling has moved from exotic to entirely routine across new installations of any size, and site readiness now determines actual delivery schedules roughly as often as component supply itself does.
Market Impact: Utilisation averages just 63%

Market Opportunities and Growth Drivers

National Programmes Fund Capability That Did Not Exist

India compounds at 18.6%, ahead of every other market measured here, on national computing programmes funding capability that did not previously exist anywhere in the country at all. Gulf states and several Southeast Asian governments have been doing much the same thing recently, treating national computing capacity as strategic infrastructure rather than as any kind of commercial return calculation. Those buyers purchase complete systems rather than expanding anything existing, and they specify against strategic capability targets rather than against a payback period, which changes what actually wins the tender entirely.
Market Impact: Lead times run 9 months

Utilisation Pressure Drives Shared Infrastructure Investment

Owned clusters average around 63% utilisation while depreciating at their full cost regardless, which is a gap that every finance function eventually notices and then quite reasonably starts asking questions about. The response so far has been shared installations, consortium purchasing arrangements between institutions and considerably more investment in scheduling and workload management software than previously. Workload management and scheduling grows at 13.8% as a direct result, well above the market rate, because software lifting utilisation by ten points is worth considerably more than hardware delivering the same additional throughput.
Market Impact: Utilisation sits near 63%

Market Restraints and Challenges

Accelerator Allocation Rather Than Budget Limits Delivery

System integrators cannot deliver any faster than they receive accelerators, and allocation is decided by a very small number of silicon suppliers whom none of the integrators actually control. The root cause is that advanced parallel compute silicon is manufactured at a handful of foundries against demand that has consistently exceeded available capacity. Commercially this means a fully funded and approved project simply waits regardless of anything. Mitigation runs through multi-year allocation agreements, architectural flexibility across accelerator types, and honest scheduling that does not promise dates the supply chain cannot actually support.
Market Impact: Accelerators reach 46% of cost

Cloud Consumption Removes Capital Purchases Entirely

An organisation running variable workloads at 63% average utilisation has a genuine argument for renting capacity rather than owning it outright, and that argument only gets stronger as accelerator prices rise. The root cause is straightforward enough: the buyer pays for idle capacity in an owned cluster and does not pay for it in a rented one. Commercially this removes capital purchases from the market entirely, even where the underlying computation itself keeps growing. Mitigation runs through hybrid arrangements, sustained-workload economics favouring ownership, and data residency requirements ruling out public infrastructure.
Market Impact: Racks now draw 58 kilowatts
4 additional market trends, 3 additional growth drivers, and 2 additional restraints and challenges are covered in the full report. Contact sales@marketmindsadvisory.com to access the complete intelligence.

Segment CAGR and Growth Architecture

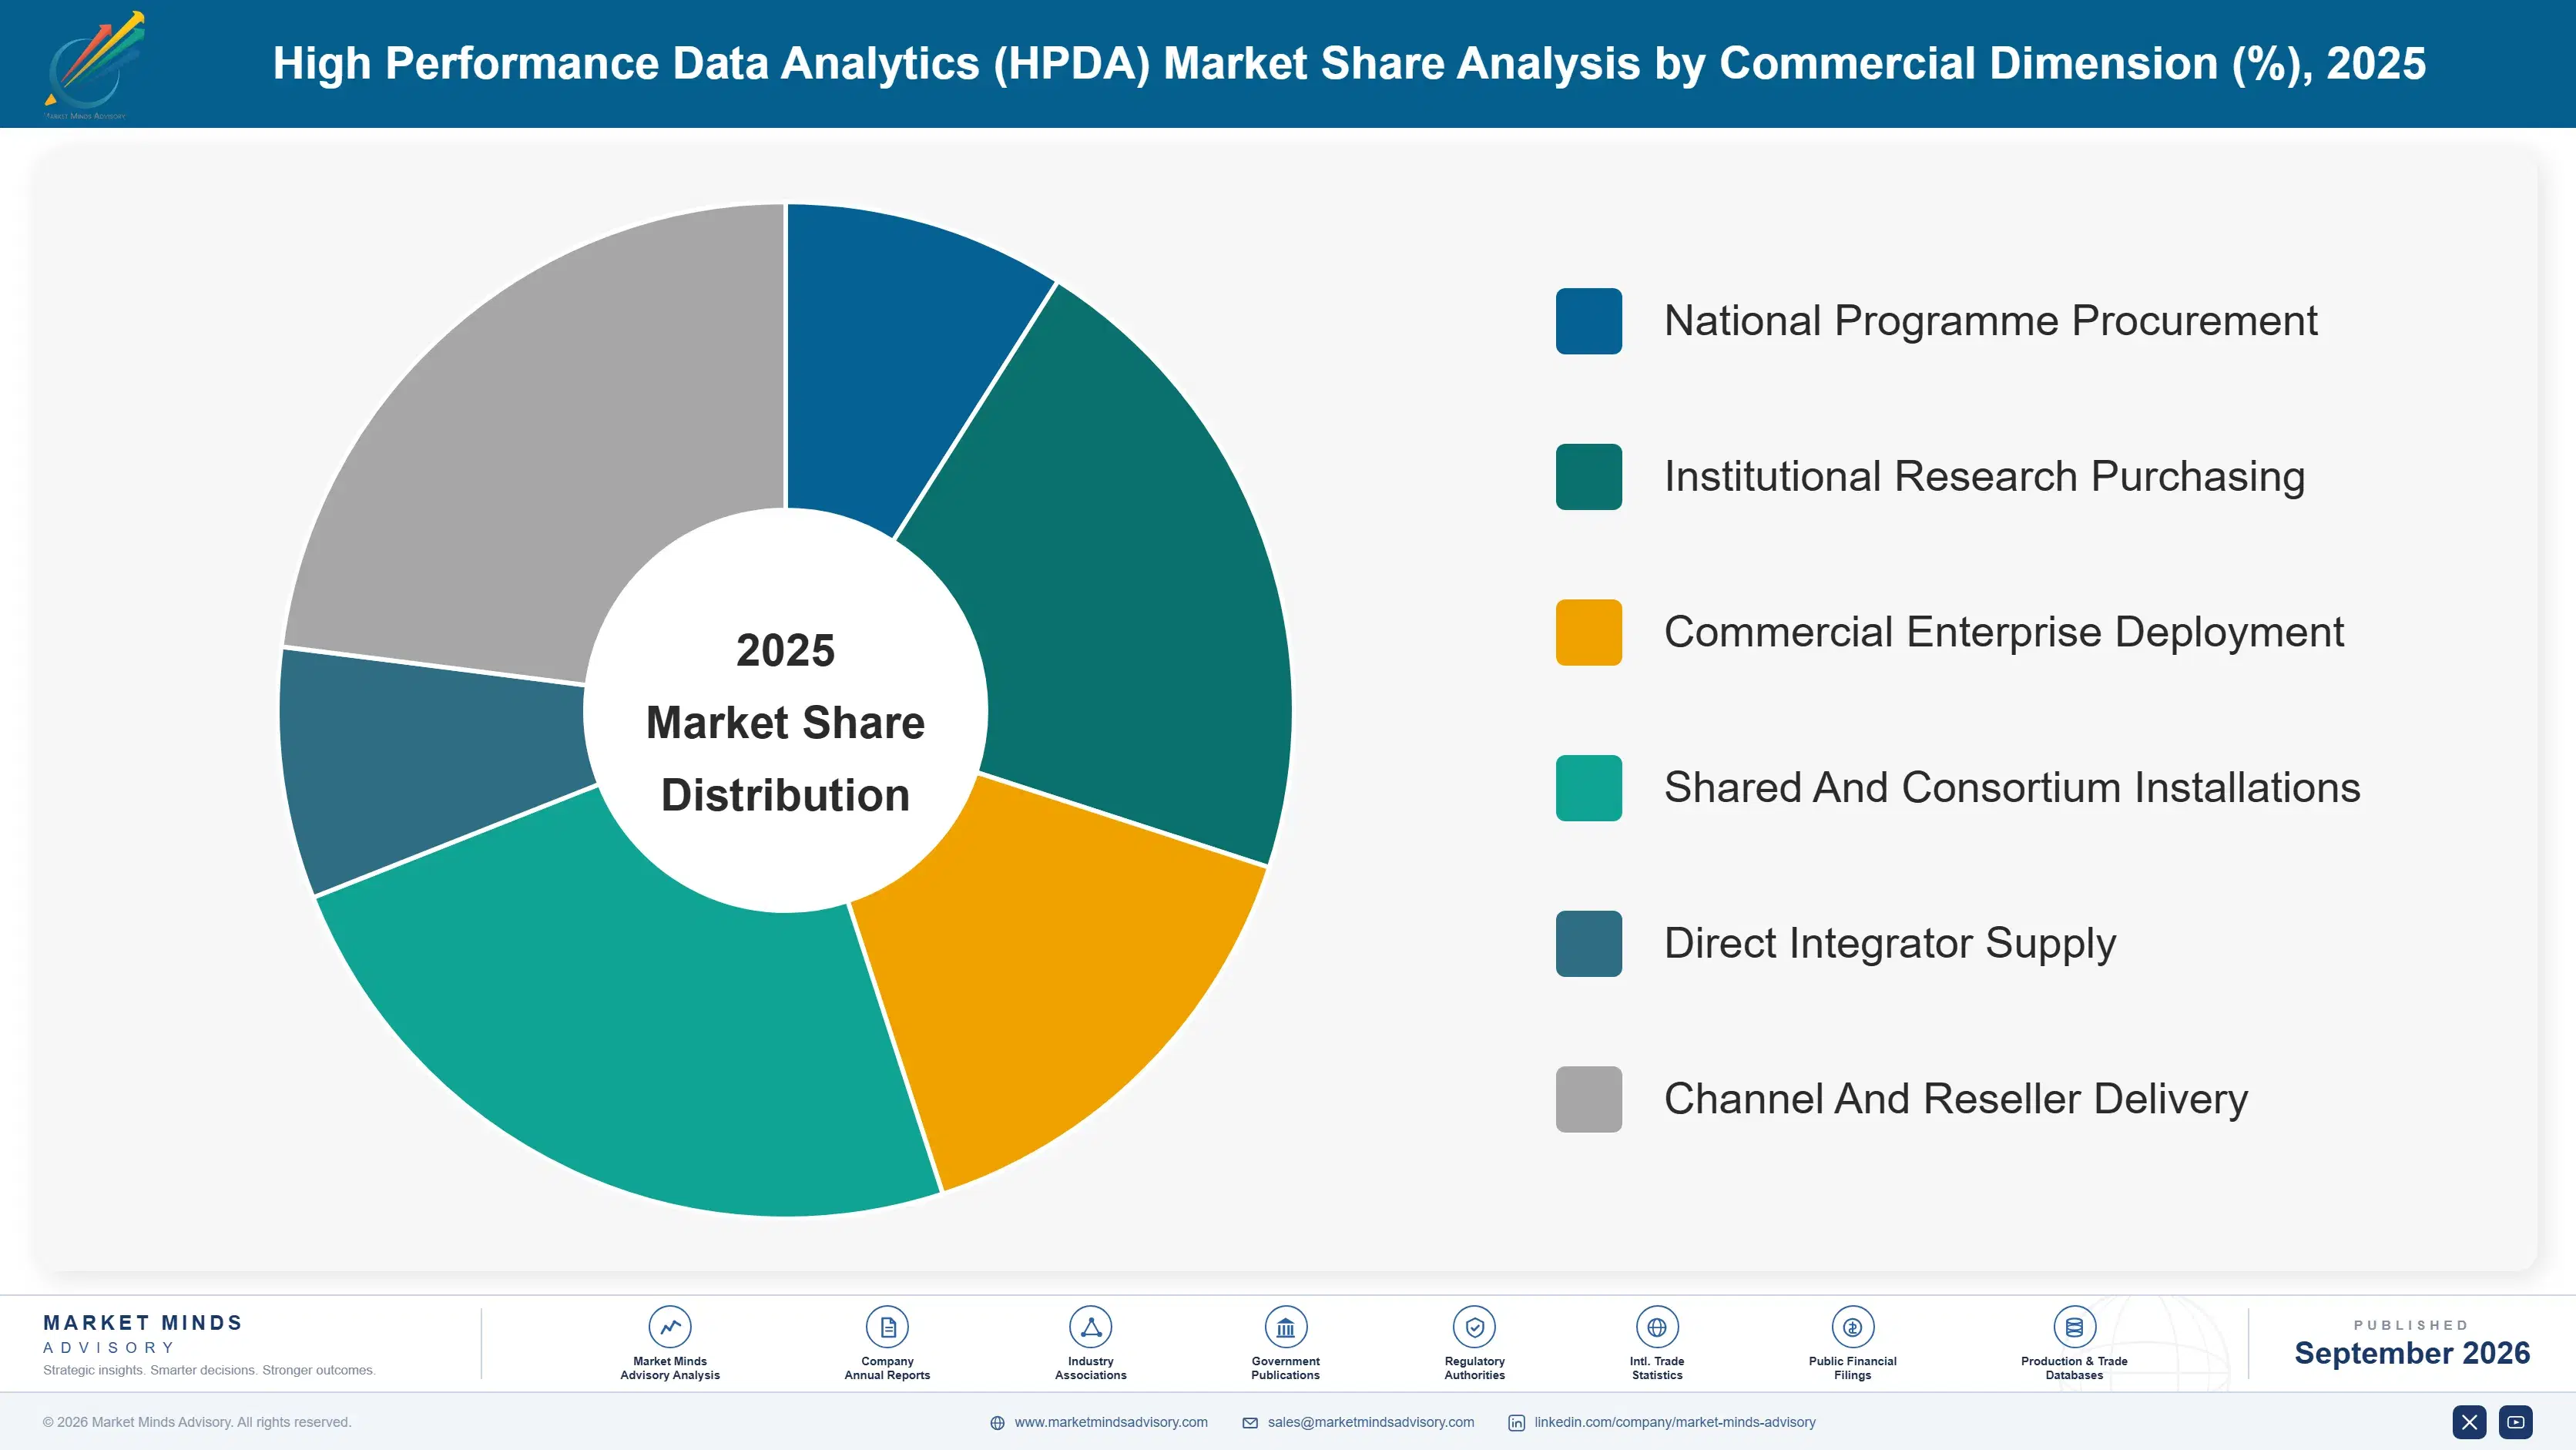
Segmentation follows system class, since each carries different growth exposure, different supply constraints and different competitive dynamics. Six classes cover the market, running from accelerator-based infrastructure and general-purpose cluster compute through storage, interconnect, workload management software and analytics runtimes. Buyer institution type and deployment model are separate commercial dimensions handled elsewhere in this report.
high-performance-data-analytics-hpda-market-market-share-analysis-1789993873287

Accelerator-Based Analytics Infrastructure

Accelerator-based infrastructure grows at 17.4%, half again the market rate of 11.6%, because the workloads justifying these systems moved decisively toward parallel computation. Machine learning training drove that shift and simulation codes increasingly follow it. Accelerators now represent roughly 46% of total system cost, so this is a change in value per deployment rather than in the number of systems installed. The commercial peculiarity is that supply rather than demand sets the pace: integrators cannot deliver faster than they receive silicon, and allocation is decided by a very small group of silicon suppliers that none of them controls in any way at all. Buyers have started asking about allocation during evaluation.
CAGR 17.4%

Workload Management And Scheduling Software

Workload management and scheduling compounds at 13.8% on the simplest arithmetic in this market. An owned cluster averages around 63% utilisation while depreciating at full cost regardless, so software raising utilisation by ten points delivers more usable capability than hardware providing equivalent additional throughput and costs a fraction as much. Shared installations and consortium arrangements between institutions make scheduling harder and consequently more valuable still. The buyer for this software is frequently the finance function rather than the research computing team, which makes for a different conversation entirely from the one most infrastructure suppliers are organised to have. Shared installations and consortium arrangements raise the value of good scheduling further still.
CAGR 13.8%
Full segment breakdown across 6 segments available in the complete report.

Regional Architecture and Country Demand Map

East Asia holds 28% of high performance analytics spending, ahead of every other region, on Chinese and Japanese national computing programmes running alongside substantial industrial and semiconductor design deployment. North America follows closely behind it at 26%, on research institutions and commercial analytics infrastructure combined.

East Asia

East Asia takes 28% of high performance analytics spending, the largest regional share, on national computing programmes that treat capability as strategic infrastructure rather than as a return calculation. Chinese installations operate at very large scale with substantial domestic component content, which insulates them partly from the accelerator allocation constraints affecting everybody else. Japanese research computing has a long institutional history and Fujitsu supplies both domestically and internationally. South Korean and Taiwanese semiconductor firms run substantial private installations for chip design and process simulation work. Growth at 12.8% sits comfortably above the global rate right across the region. Domestic component content is considerably higher here than in any other region measured.
Share: 28% | CAGR: 12.8% (2026 to 2036)

North America

Twenty-six percent of spending reaches North America, split between federal research institutions, universities and a growing volume of commercial analytics infrastructure. Federal laboratory procurement operates on multi-year cycles and at a scale that no commercial buyer anywhere approaches, and those systems set architectural direction the rest of the market follows afterwards. Hewlett Packard Enterprise and Dell Technologies both hold substantial positions across this region on integration credibility. Cloud consumption competes harder in this region than anywhere else, particularly among the commercial buyers running genuinely variable workloads. Growth at 11.0% sits marginally below the global rate on exactly that competition from rented capacity. Facility power capability constrains several older institutional sites considerably.
Share: 26% | CAGR: 11.0% (2026 to 2036)
Regional intelligence for 5 additional markets available in the complete report: Western Europe, South Asia and Pacific, Latin America, Middle East and Africa, Eastern Europe. Contact sales@marketmindsadvisory.com.
high-performance-data-analytics-hpda-market-country-cagr-analysis-1789993873818

Where HPDA Deals Are Decided

A cluster costs exactly the same idle as it does busy, accelerator allocation rather than budget sets every single delivery date, and the fastest growing buyers are funding national capability rather than calculating any payback period on it at all. The four levers below follow those conditions rather than any argument about benchmark performance.

Sell Utilisation Improvement Alongside Raw Capacity

Owned clusters average around 63% utilisation while continuing to depreciate at full cost regardless of whether anything at all is running on them. Software and scheduling that lift utilisation by ten points deliver more usable throughput than a hardware expansion of equivalent capital value, at a fraction of the capital cost. Suppliers selling raw capacity alone are answering only the question that the research computing team originally asked. Suppliers selling utilisation improvement are answering the question the finance function will inevitably ask when the next expansion request eventually arrives on somebody's desk.
Market Impact: Utilisation averaging just 63% leaves genuine spare headroom

Commit Accelerator Allocation Before Quoting Dates

Accelerators account for roughly 46% of total system cost, and allocation from a very small group of silicon suppliers determines when anything actually ships to anybody. An integrator holding committed multi-year allocation can quote delivery dates that a buyer will plan an entire facility programme around; one without it cannot commit at all, and loses tenders on schedule risk rather than on any question of price. Buyers have learned to ask that question directly during evaluation, and an honest 9 month date beats an optimistic one that then slips twice.
Market Impact: Accelerators carry fully 46% of total system cost

Scope Facility Readiness Inside The Proposal

Accelerator racks draw around 58 kilowatts each, which conventional data centre cooling was never designed to remove at scale, and organisations repeatedly buy systems that their existing buildings simply cannot host at all. Adding a facility assessment and cooling design into the proposal itself converts a delay that would otherwise damage the supplier relationship into additional scope that the supplier actually gets paid for. Competitors who leave site readiness entirely to the customer are arranging a project failure that the customer will still remember at the next refresh in 5 years.
Market Impact: Racks drawing 58 kilowatts demand entirely new cooling

Sell Capability Targets To National Programmes

India compounds at 18.6% and Gulf programmes are funding computing capability as deliberate industrial policy rather than calculating any commercial return on the money at all. Those buyers purchase complete systems outright rather than expanding anything they already operate, and they specify against strategic capability targets rather than a payback period, which makes the entire commercial conversation a different one from the outset. Suppliers presenting cost per unit of throughput are answering a question the buyer did not ask, while the tender itself is being decided on demonstrated capability and on delivery certainty instead.
Market Impact: India alone compounds at fully 18.6% every year

Who Controls the Margin Pool

Five suppliers hold 58% of high performance analytics infrastructure and software revenue, and accelerator supply concentration sits underneath that figure as the more binding constraint on everybody. Hewlett Packard Enterprise, Dell Technologies, Lenovo, Atos Eviden and Fujitsu lead the field on system integration capability. All participants here are assessed consistently on high performance analytics infrastructure and software revenue rather than on any broader corporate measure of scale.
Competition runs on delivery certainty and facility integration far more than on benchmark performance, since architectures are broadly comparable between suppliers, and buyers have been disappointed on schedule repeatedly over recent years. The second dimension is workload management software, because utilisation improvement delivers more usable capability than equivalent hardware spending, and institutional finance functions have now started to understand that point rather clearly.

Pressure comes from cloud infrastructure absorbing workloads that would previously have justified owned systems, particularly the variable ones where the utilisation argument bites hardest. Rankings shift where national programmes are funding capability from nothing, across India, the Gulf and Southeast Asia, rather than where established institutions simply refresh the installations they already own and operate today.
high-performance-data-analytics-hpda-market-company-positioning-matrix-1789993874345

Competitive Moat and Risk Dimensions

HEWLETT PACKARD ENTERPRISE

Moat: Large System Integration Depth

HPE has delivered installations at the largest scales anybody operates, including federal laboratory systems where integration complexity exceeds anything a commercial buyer encounters. That experience carries into smaller deployments as delivery credibility, which matters enormously to buyers who have been disappointed on schedule before. Assembling comparable reference depth requires having actually built those systems, which cannot be shortened.
HEWLETT PACKARD ENTERPRISE

Risk: Accelerator Allocation Dependency

Accelerators represent roughly 46% of system cost and allocation is decided by a very small group of silicon suppliers the integrator does not control in any meaningful way. Delivery certainty, which is the core of the position, therefore rests on somebody else's manufacturing capacity. No amount of integration capability compensates when the components simply do not arrive on schedule.
DELL TECHNOLOGIES

Moat: Commercial Buyer Reach

Dell reaches commercial analytics buyers who never approached the traditional supercomputing suppliers, through existing enterprise infrastructure relationships and a considerably broader channel. That matters because commercial deployment is growing faster than research institution procurement, and those buyers evaluate differently. The relationship exists before the analytics requirement does, which is a position that specialist suppliers cannot replicate quickly.
DELL TECHNOLOGIES

Risk: Cloud Substitution Exposure

Commercial buyers with variable workloads have the strongest case for renting capacity rather than owning it, since they pay for idle time in an owned cluster running near 63% utilisation and do not in a rented one. That argument bites hardest in exactly the buyer segment this position depends on. Defending it requires sustained-workload economics that genuinely favour ownership.

Players Tracked

Prominent Players

Hewlett Packard Enterprise
Dell Technologies
Lenovo
Atos Eviden
Fujitsu

Other Key Players

NVIDIA
Advanced Micro Devices
Intel
IBM
Supermicro
Penguin Solutions
DataDirect Networks
NetApp
Weka
Altair Engineering
Cornelis Networks
Inspur
Sugon
NEC
Hitachi

Recent Developments

JULY 2025

Indian National Programme Commissions New Computing Capability

Indian national computing programmes commissioned high performance analytics capability across multiple institutions, capacity development rather than any corporate transaction. Those buyers purchase complete systems rather than expanding existing installations, and specify against strategic capability targets rather than a payback period, which changes how tenders are evaluated.
Signal: National capability buyers evaluate on demonstrated capability rather than on any cost per unit of throughput.
DECEMBER 2024

Liquid Cooling Becomes Standard In New Accelerator Installations

Major system integrators moved to liquid cooling as the default approach for new accelerator-based installations, an engineering shift rather than any commercial transaction. Accelerator racks now draw around 58 kilowatts, which conventional air-cooled data centre design was never built to remove at any meaningful scale.
Signal: Facility capability now constrains deployment schedules roughly as often as the component supply chain itself does.
APRIL 2025

European Joint Programmes Extend Shared Computing Arrangements

European joint computing programmes extended shared installation arrangements across participating member states, a funding and coordination development rather than any merger. Shared capability raises utilisation above the roughly 63% typical of individually owned clusters, while reducing the total number of separate systems purchased across the region.
Signal: Coordination raises utilisation efficiently while simultaneously reducing the number of separate systems the region actually buys.

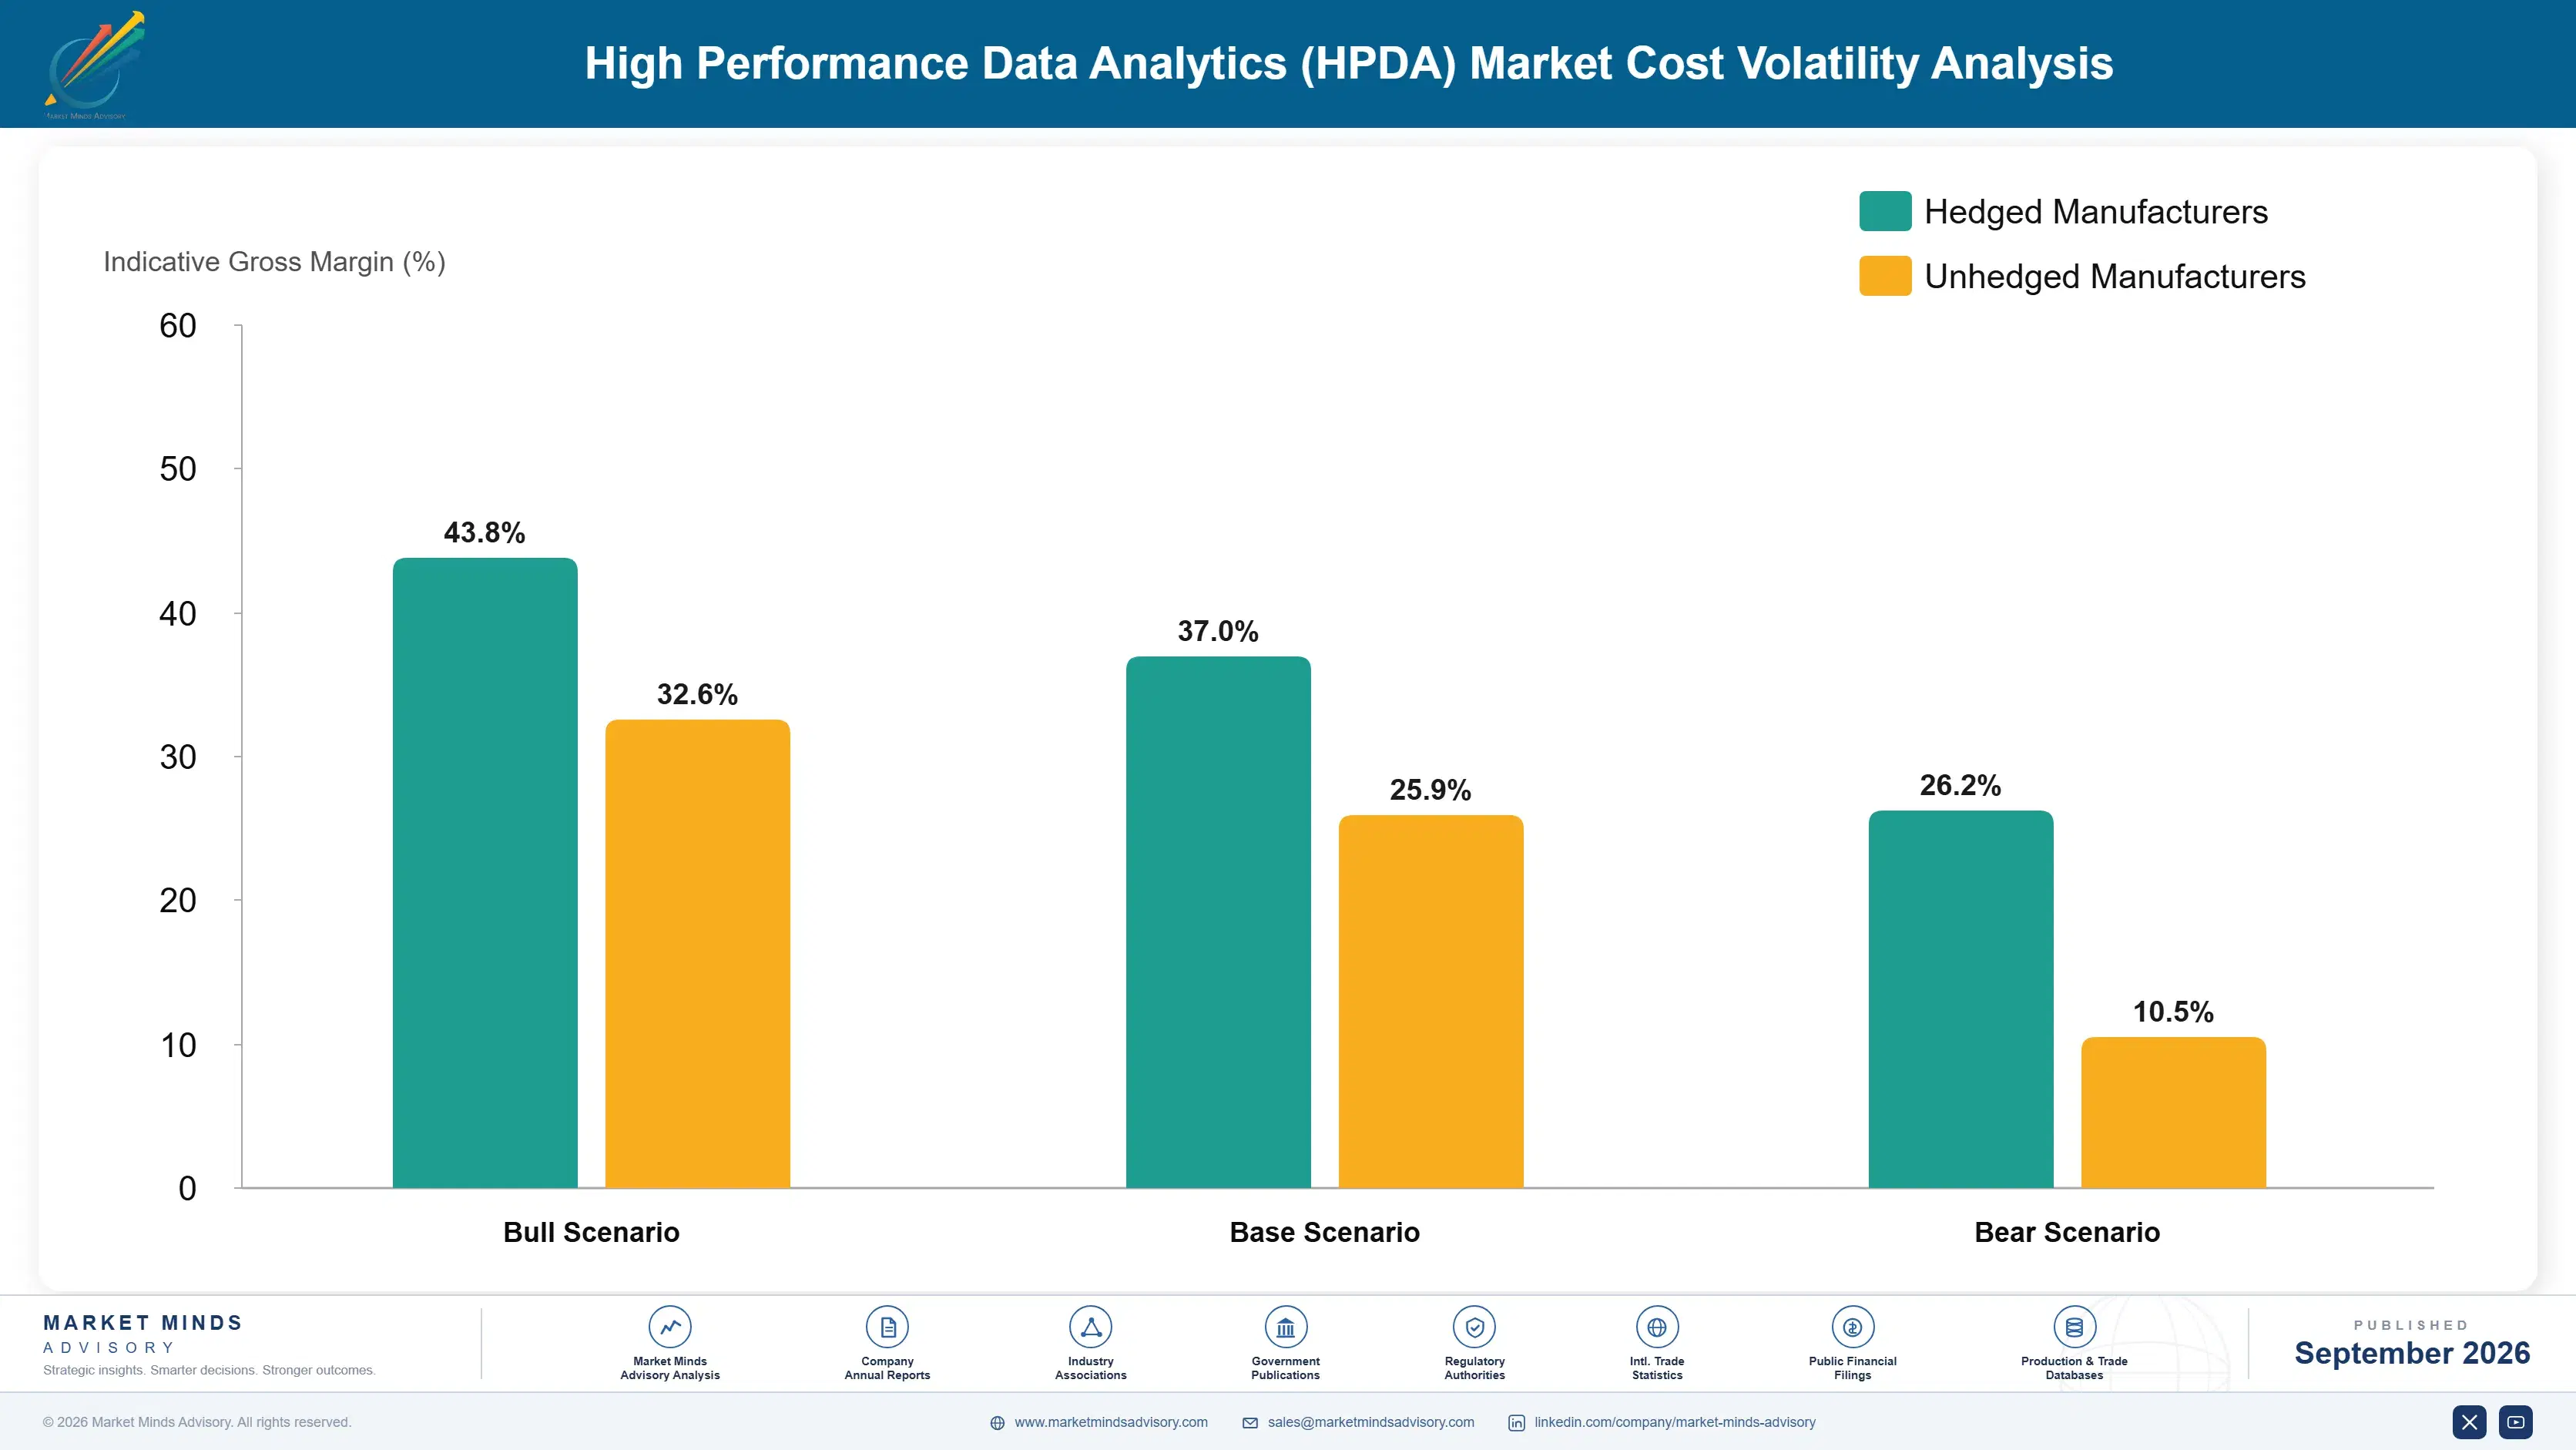
What These Systems Cost To Build

Accelerator silicon accounts for roughly 46% of system cost, sourced from a very small group of suppliers manufacturing at a handful of advanced foundries. Memory takes around 18%, with high bandwidth memory concentrated among three producers. Interconnect and fabric equipment absorbs about 12%, and enclosures, power delivery and liquid cooling hardware take most of the remaining balance across increasingly dense installations.
Accelerator and high bandwidth memory supply tightened severely from 2023 onward as demand exceeded manufacturing capacity, extending delivery on complete systems well beyond a year in some configurations. Hewlett Packard Enterprise Annual Report 2024 and Dell Technologies Annual Report 2024 both record component availability as the principal constraint on order conversion. Integrators holding committed multi-year allocation delivered considerably better through that period than those buying against demand as it arrived.

The competitive disadvantage mechanism is allocation rather than component price. An integrator with committed multi-year accelerator supply can quote delivery dates a buyer will plan a facility programme around, while one without it cannot commit and loses tenders on schedule risk. Exposure concentrates among smaller integrators lacking the volume to secure priority allocation, which is a barrier unrelated to how well they build systems.
high-performance-data-analytics-hpda-market-cost-volatility-analysis-1789993874540

Secure Multi-Year Accelerator Allocation Commitments

Accelerator silicon runs roughly 46% of system cost and availability rather than price has repeatedly been the binding constraint on delivery. Committed multi-year allocation lets an integrator quote dates that buyers can plan facility programmes around. Integrators buying against demand cannot commit to schedule, and buyers have learned to ask the question directly during evaluation rather than afterwards.

Design Architectures Flexible Across Accelerator Types

Systems architected around one accelerator supplier have no route forward when that supplier's allocation runs short, which has happened repeatedly since 2023. Designing for multiple accelerator types costs engineering effort against no immediate return and preserves the ability to deliver something. Integrators locked to a single supplier discover during a shortage that they have no alternative available at all.

Quote Facility Work Within The System Proposal

Racks drawing around 58 kilowatts need cooling that conventional facilities cannot provide, and buyers repeatedly discover this after signing rather than before. Including facility assessment and cooling design within the proposal converts an eventual delay into paid scope. Integrators leaving site readiness entirely to the customer are arranging a project failure they will be blamed for regardless.

Portfolio Architecture for Margin Defence

Margin architecture separates on how much of the value is software or scarce engineering rather than assembled hardware. General-purpose cluster compute earns least, since the components are standard and integration is comparatively routine work. Storage and interconnect sit above it. Workload management software, analytics runtimes and accelerator-based system integration earn most, because each carries either software content or genuinely scarce delivery capability.
The volume versus premium tension runs between hardware pass-through and software. Accelerators are roughly 46% of system cost and integrators earn thin margin on silicon they resell, while workload management software earns several times that on a small fraction of the contract value. Integrators treating software as an attachment to the hardware sale are underweighting the part of the deal that actually produces profit.

High-value pools concentrate in workload management software and in facility-integrated delivery, and neither is reached through hardware capability. Utilisation improvement software sells to the finance function rather than to research computing. Facility integration requires engineering most integrators have historically outsourced. Both are capabilities that have to be built deliberately over time rather than acquired alongside an existing hardware relationship with the customer.

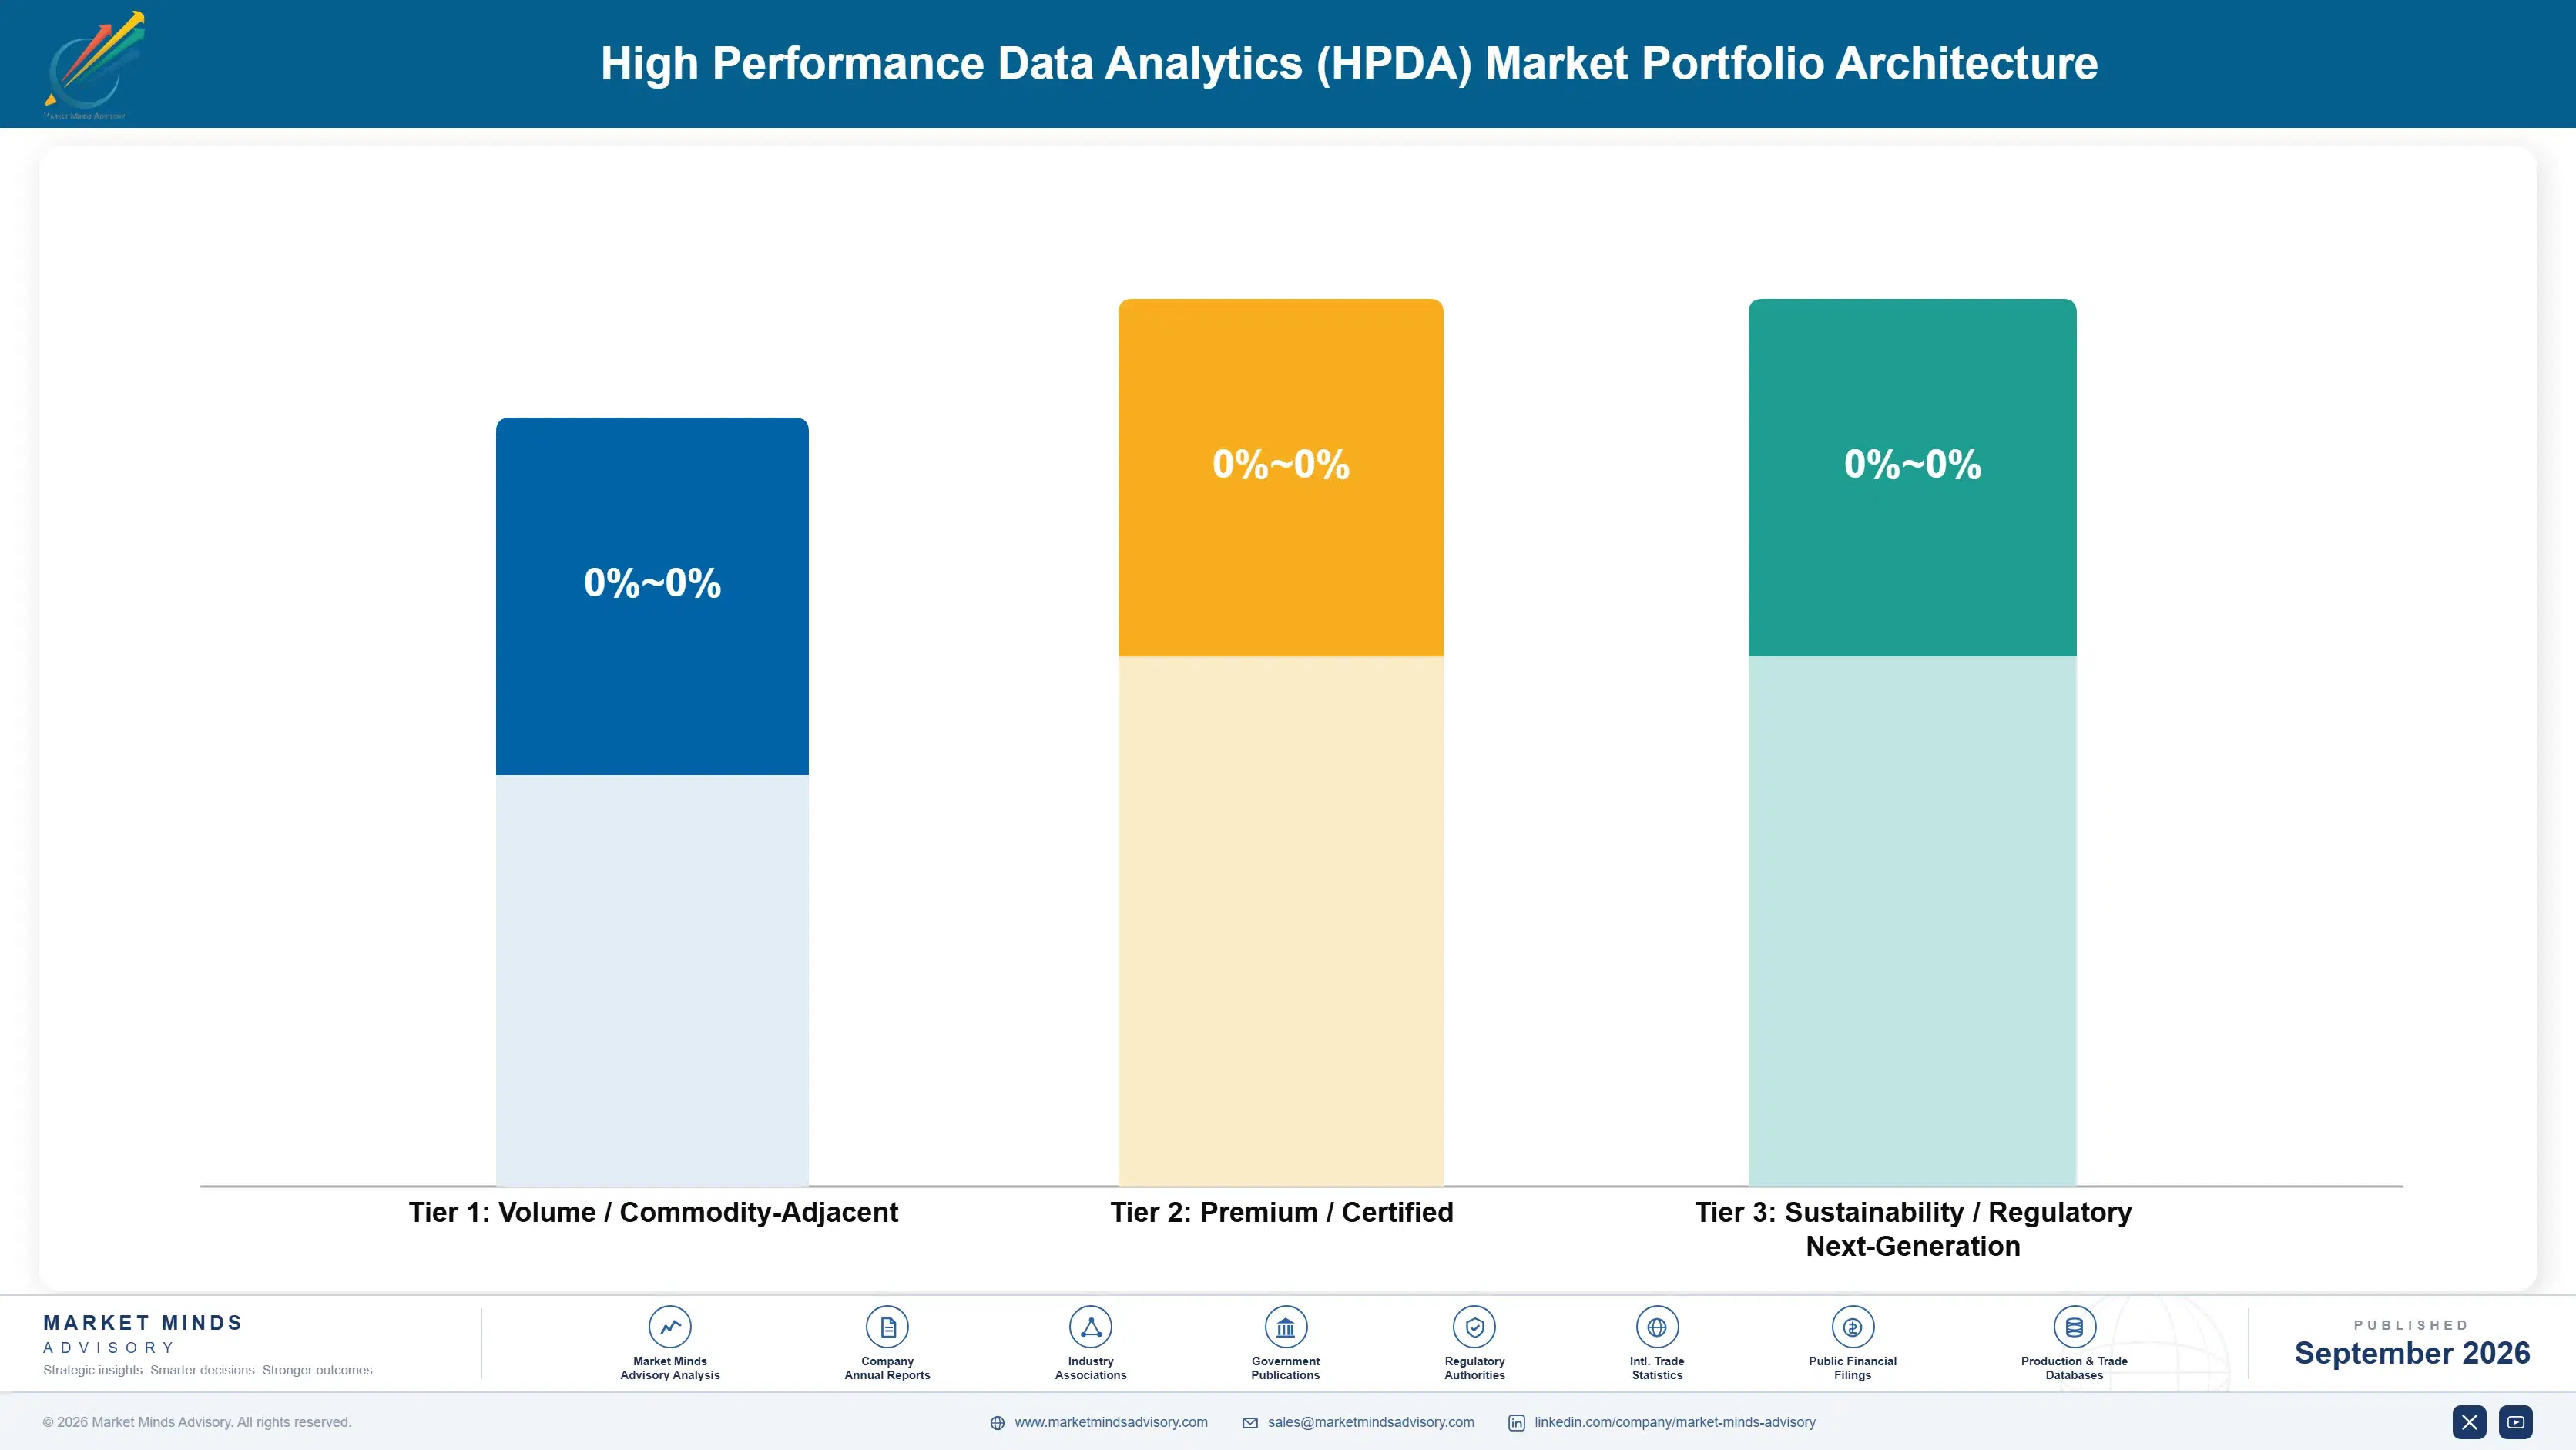
Volume / Commodity-Adjacent

General-purpose cluster compute systems and standard rack integration, where components are broadly standard and assembly is comparatively routine engineering. The ten point spread separates integrators holding support and service attachment from those competing purely on hardware assembly and delivery.
Gross Margin: 18% to 28%

Premium / Certified

High performance storage, parallel file systems and cluster interconnect fabric, where engineering depth and proven performance at scale determine selection. The twelve point spread tracks how much of the delivered value is proprietary rather than resold from component suppliers underneath the system.
Gross Margin: 32% to 44%

Sustainability / Regulatory / Next-Generation

Workload management software, analytics runtime environments and facility-integrated accelerator delivery, where software content or scarce delivery capability rather than hardware determines value. The eighteen point spread reflects how much is genuine software, which varies enormously here.
Gross Margin: 56% to 74%
high-performance-data-analytics-hpda-market-portfolio-architecture-1789993875047

High-value Sub-segments and Strategic Watch-out

Accelerator-Based Analytics Infrastructure

Grows at 17.4% as workloads move decisively toward parallel computation across both machine learning training and conventional simulation codes. The eighteen point spread here reflects delivery capability. Accelerators represent roughly 46% of system cost, and supplier allocation rather than buyer budget determines the delivery dates.
Gross Margin: 56% to 74%

Workload Management And Scheduling Software

Grows at 13.8% because owned clusters average around 63% utilisation while continuing to depreciate at their full cost regardless. The eighteen point spread here reflects underlying software depth. Ten points of utilisation improvement beats an equivalent amount of hardware spending by a very considerable margin.
Gross Margin: 56% to 74%

High Performance Storage And Parallel File Systems

Grows at 11.9% as dataset sizes keep rising alongside compute capability and storage becomes the binding bottleneck across a steadily growing number of workloads. The twelve point spread here reflects proprietary engineering content. Parallel file system capability sits with a comparatively small group of genuinely specialist suppliers.
Gross Margin: 32% to 44%

General-Purpose Cluster Compute Systems

Grows at 5.2%, slowest of the six system classes, serving workloads that parallelise poorly and gain nothing at all from accelerator architectures. The ten point spread here reflects service and support attachment. Components here are standard and the integration work involved is comparatively routine engineering.
Gross Margin: 18% to 28%

Why Installations Stay Put

The annuity here comes from codes and operational familiarity rather than from any contract. Research and engineering codes are tuned to a particular architecture over years, and moving them costs scientist time that nobody has budgeted for or wants to spend. Systems refresh on roughly five year cycles and each refresh strongly favours architectural continuity. An incumbent supplier is consequently selling into a preference it built rather than one it negotiated.
Depth varies considerably by buyer type and by workload. National programme installations are the most entrenched, since the codes, the staff training and frequently the facility itself were built around one architecture. Research institution systems are similar though smaller. Commercial analytics deployments running standard frameworks are far more substitutable, and those buyers also have the strongest cloud alternative available to them.

The buyer has shifted from research computing toward finance and facilities, and that changes what wins. A research computing team evaluated benchmark performance and code compatibility. A finance function evaluates utilisation against depreciation on a cluster running near 63%. A facilities function determines whether 58 kilowatt racks can be hosted at all. Suppliers selling only to the first are addressing one of three parties who now decide.
high-performance-data-analytics-hpda-market-end-use-penetration-index-1789993875538

What Decides HPDA Purchases

These are among the four positions where our research anticipates prominent divergence between winners and laggards over the coming forecast period. Each is grounded in the demand model, the regulatory perimeter, and the announced capacity pipeline.
01 / UTILISATION ECONOMICS SELLING

Sell The Idle Time Back To Finance

Owned clusters average around 63% utilisation while depreciating at their full cost regardless of whether any workload is actually running on them at the time. Software and scheduling that lift utilisation by ten points deliver more usable throughput than a hardware expansion of equivalent capital value, at a small fraction of the cost. Suppliers selling raw capacity are answering the question the research team asked rather than the one that the finance function will eventually get around to asking them.
02 / DELIVERY CERTAINTY COMMITMENT

Quote Dates The Supply Chain Supports

Accelerators account for roughly 46% of system cost and allocation from a very small group of silicon suppliers determines when anything ships, regardless of how well the integrator itself happens to build the systems. An integrator holding committed multi-year allocation can quote delivery dates that a buyer will happily plan an entire facility programme around. Buyers have learned to ask directly during evaluation, and an honest 9 month date now beats an optimistic one that subsequently slips twice before delivery.
03 / FACILITY SCOPE INCLUSION

Own The Cooling Problem Before Signing

Accelerator racks now draw around 58 kilowatts each, which conventional data centre cooling was never designed to remove at scale, and organisations repeatedly buy systems that their buildings simply cannot host without substantial work. Adding facility assessment and cooling design directly into the proposal converts a delay that damages the relationship into scope the supplier is paid for. Competitors leaving site readiness entirely to the customer are arranging a project failure that the buyer will still remember at the next refresh cycle.
04 / NATIONAL PROGRAMME COVERAGE

Meet Capability Targets, Not Payback Periods

India compounds at 18.6% annually and Gulf programmes are funding computing capability as a matter of deliberate industrial policy rather than calculating any commercial return on the investment at all. Those buyers purchase complete systems outright rather than expanding installations they already operate, and they specify against demonstrated strategic capability targets rather than against any commercial payback period whatsoever. Suppliers presenting cost per unit of throughput are answering a question that the buyer sitting in front of them has never once asked them.

Engagement Snapshot From the Field

A live engagement with an industry participant carrying material or product regulatory and market exposure ahead of a defining policy shift, showing how our research translates into a defensible multi-year portfolio strategy.
MARKET MINDS ADVISORY · CLIENT ENGAGEMENT SUMMARY
High Performance Data Analytics (HPDA) Producer Strategic Portfolio Review and Transition Roadmap 2026·Investment Scenario on High Performance Data Analytics (HPDA) Exposure Evaluation 2025-26
CLIENT PROFILE
A national research institution operating three high performance computing installations across two sites, with a refresh approved for the largest and a persistent internal argument about whether to own the replacement at all. Utilisation across the existing systems had never been measured consistently, and each research group believed its own workload justified dedicated capacity that nobody else should touch.
STRATEGIC CHALLENGE
Research computing wanted a larger owned system on architectural continuity grounds, which were entirely legitimate given the tuned codes involved. Finance wanted to move variable workloads to rented capacity. Neither position rested on measured utilisation, and the facility question of whether the building could host modern accelerator racks had not been examined by anybody at all.
MMA APPROACH
MMA measured actual utilisation across all three installations by workload type over a full year, then modelled owned against rented economics for each workload category separately rather than in aggregate. We assessed facility power and cooling capability against modern rack densities, and reviewed accelerator allocation commitments from shortlisted integrators. Work drew on 47 expert interviews conducted in Q4 2025 with institutions and suppliers.
KEY FINDINGS
  1. Measured utilisation averaged around 61% overall, though 2 of the three installations ran well above that while the third sat far below it.
  2. Sustained simulation workloads favoured ownership very clearly, while the variable analytics workloads proved considerably cheaper to run on rented capacity across the year.
  3. The primary machine room could not host racks at modern accelerator densities without substantial cooling work costing real money (client-reported, unverified by MMA).
  4. Only one of the four shortlisted integrators held committed accelerator allocation sufficient to support the delivery dates it had quoted in its proposal.
CLIENT PROFILE
A national research institution operating three high performance computing installations across two sites, with a refresh approved for the largest and a persistent internal argument about whether to own the replacement at all. Utilisation across the existing systems had never been measured consistently, and each research group believed its own workload justified dedicated capacity that nobody else should touch.
STRATEGIC CHALLENGE
Research computing wanted a larger owned system on architectural continuity grounds, which were entirely legitimate given the tuned codes involved. Finance wanted to move variable workloads to rented capacity. Neither position rested on measured utilisation, and the facility question of whether the building could host modern accelerator racks had not been examined by anybody at all.
MMA APPROACH
MMA measured actual utilisation across all three installations by workload type over a full year, then modelled owned against rented economics for each workload category separately rather than in aggregate. We assessed facility power and cooling capability against modern rack densities, and reviewed accelerator allocation commitments from shortlisted integrators. Work drew on 47 expert interviews conducted in Q4 2025 with institutions and suppliers.
KEY FINDINGS
  1. Measured utilisation averaged around 61% overall, though 2 of the three installations ran well above that while the third sat far below it.
  2. Sustained simulation workloads favoured ownership very clearly, while the variable analytics workloads proved considerably cheaper to run on rented capacity across the year.
  3. The primary machine room could not host racks at modern accelerator densities without substantial cooling work costing real money (client-reported, unverified by MMA).
  4. Only one of the four shortlisted integrators held committed accelerator allocation sufficient to support the delivery dates it had quoted in its proposal.
RECOMMENDED STRATEGY
Phase 1: Phase one: commission the facility cooling work before ordering anything, since the machine room could not host the system that had already been approved. Phase 2: Phase two: buy owned capacity sized to the sustained simulation workloads only, and rent capacity for the variable analytics work instead. Phase 3: Phase three: weight integrator selection on committed accelerator allocation rather than on quoted delivery dates, which had already proved unreliable elsewhere.
OUTCOME
The institution completed cooling work first and ordered a smaller owned system than originally approved, renting capacity for variable workloads (client-reported, unverified by MMA). Utilisation on the owned installation rose considerably against the previous system. Utilisation is now measured continuously by workload type, which is the change that outlasted the engagement itself.

Frequently Asked Questions

Foundational context covering the market sizes, CAGR, scope, country, region and competition that inform every finding below. This section is provided to cover basics and most often pre-purchase conversations, answered from the MMA Primary Research Dataset.

What is the current size of the High Performance Data Analytics (HPDA) Market?

Global value reaches USD 21.9 billion in 2026, measured as infrastructure and software revenue across six system classes. The 2025 base for the market is USD 19.6 billion.

How large will the High Performance Data Analytics (HPDA) Market be by 2036?

The market reaches USD 65.6 billion by 2036, an increase of USD 43.7 billion across the forecast period. That represents 3.00 times expansion from the 2026 base.

What is the CAGR for the High Performance Data Analytics (HPDA) Market 2026 to 2036?

The base case runs at 11.6% annually, with a bull case at 12.9% if accelerator supply eases and deferred deployments arrive, and a bear case at 10.3% if cloud consumption absorbs owned infrastructure demand.

Which segment is growing fastest?

Accelerator-based analytics infrastructure grows at 17.4%, half again the market rate of 11.6%. Workloads have moved decisively toward parallel computation across both machine learning and simulation.

Who are the major companies in the High Performance Data Analytics (HPDA) Market?

Hewlett Packard Enterprise, Dell Technologies, Lenovo, Atos Eviden and Fujitsu lead on infrastructure and software revenue, holding 58%. NVIDIA, IBM and Supermicro hold significant component and system positions.

Which country is growing fastest?

India leads at 18.6%, on national computing programmes funding capability that did not previously exist anywhere in the country. Saudi Arabia and Indonesia follow behind it.

Report Segmentation Architecture

The full report scope spans multiple orthogonal segmentation dimensions, with cross-tabulated demand data provided for each dimension pair. Coverage extends further to regional breakdowns, trend trajectories, and the competitive detail needed to support segment-level decision-making.

By System Class

  • Accelerator-Based Analytics Infrastructure
  • Workload Management And Scheduling Software
  • High Performance Storage And Parallel File Systems
  • Cluster Interconnect And Fabric Equipment
  • Analytics Frameworks And Runtime Environments
  • General-Purpose Cluster Compute Systems

By End-Use Industry

  • Academic And Government Research
  • Energy And Reservoir Simulation
  • Financial Services Risk Modelling
  • Life Sciences And Genomics
  • Manufacturing And Engineering Simulation
  • Weather And Climate Modelling

By Commercial Dimension

  • National Programme Procurement
  • Institutional Research Purchasing
  • Commercial Enterprise Deployment
  • Shared And Consortium Installations
  • Direct Integrator Supply
  • Channel And Reseller Delivery

By Region

  • North America
  • Western Europe
  • East Asia
  • South Asia and Pacific
  • Latin America
  • Middle East and Africa
  • Eastern Europe

Scope, Methodology, and Coverage

Every figure in this report is reproducible from documented input assumptions. The scope below maps the historical period, the forecast horizon, the segmentation dimensions, and the countries covered, alongside the underlying primary and qualitative methodology.
Historical Period
2020 to 2025
Forecast Period
2026 to 2036
Base Year
2025 (USD billions; MMA Primary Research Dataset, September 2026)
Market Definition
This report covers high performance data analytics infrastructure and software by system class: accelerator-based analytics infrastructure, general-purpose cluster compute systems, high performance storage and parallel file systems, cluster interconnect and fabric equipment, workload management and scheduling software, and analytics frameworks and runtime environments. It excludes general enterprise data centre servers, cloud infrastructure services sold by hour, business intelligence software, database licences, and consulting or managed analytics services.
Quantitative Units
USD millions, infrastructure and software revenue basis; deployed system count; cluster utilisation as a percentage; accelerator share of system cost; rack power density in kilowatts; deployment lead time in months.
Segmentation Dimensions
System class; end-use industry and workload type; commercial procurement route and buyer type; geography across seven regions.
Regions Covered
North America, Western Europe, East Asia, South Asia and Pacific, Latin America, Middle East and Africa, Eastern Europe
Countries Covered
United States, Canada, Germany, France, Italy, Netherlands, United Kingdom, Spain, Poland, Czechia, China, Japan, South Korea, Taiwan, India, Australia, Singapore, Brazil, Saudi Arabia, United Arab Emirates.
Key Companies Profiled
Hewlett Packard Enterprise, Dell Technologies, Lenovo, Atos Eviden, Fujitsu, NVIDIA, Advanced Micro Devices, Intel, IBM, Supermicro, DataDirect Networks, Weka, Altair Engineering, Inspur, NEC.
Quantitative Methodology
Primary survey, n=3,800 respondents, Q4 2025, six countries; demand-side model with trade association cross-validation
Qualitative Methodology
47 expert interviews, Q4 2025; applied to validate demand model assumptions, identify emerging dynamics, and assess competitive positioning
Report Format
PDF and XLSX data workbook (Word format preview document)
Publisher
Market Minds Advisory
Report Code
MMA-2026-TEC-691
Published
September 2026
Contact
sales@marketmindsadvisory.com | www.marketmindsadvisory.com

Purchase the full High Performance Data Analytics (HPDA) Market Report (2026 to 2036).

This report sizes the global high performance data analytics market from 2026 to 2036 across six system classes, six workload types and seven regions. It explains why cluster utilisation averaging around 63% against full-cost depreciation governs how this equipment is bought and shared. Accelerator allocation is analysed as the binding constraint on delivery rather than budget, with accelerators at roughly 46% of system cost. Facility power density near 58 kilowatts per rack is examined as a deployment constraint that catches buyers repeatedly. Regional analysis explains why East Asia leads at 28% of spending.
Six system classes sized through to 2036
Utilisation economics quantified against full-cost depreciation exposure
Accelerator allocation assessed as the delivery constraint
Twenty named suppliers assessed on infrastructure revenue
Four revenue levers with quantified commercial impact
Anonymised national research institution infrastructure engagement documented fully

Built For The People Who Decide

From boardroom strategy to bench-side execution, this report is read cover-to-cover by leaders shaping the next decade of their industry, turning demand scenarios, market dynamics and valuation benchmarks into decisions.
CXOs/ Presidents/ VPs/ Managers
M&A and Corporate Development
Strategy Teams and R&D Heads
Procurement and Product Directors
Regulatory and Compliance Leaders
Investor Relations and Equity Analysts