Market Minds Advisory
Hedge Fund Market

Hedge Fund Market: Paying For The Rent And The People

Multi-strategy platforms charge investors every cost they incur, salaries and rent included, at around 7.4% of assets a year. Investors queue to pay it because the net returns arrive anyway.

Lead Analyst

Published

September 2026

Make Smarter Decisions with Customized Research Insights

Request a free sample report and evaluate market opportunities, growth trends, and competitive dynamics relevant to your business needs.

2025 MARKET VALUE$114.0BMarket Size 2025
2036 FORECAST VALUE$244.9BBase Case , 2026 to 2036
CAGR 2026 TO 20367.2 %Bull 8.4% / Bear 6.0%
INCREMENTAL OPPORTUNITY$122.7BNet 10- year value creation
EXPANSION MULTIPLE2.00x2036 value over 2026 base
Strategic Levers
M&A Pipeline
Regional Outlook
Country Rankings
Competitive Intelligence
Segmental Deep-dive
Call-Us : 91 93563 13602

Executive Snapshot and Market Trajectory

This industry split into two businesses that share a label and nothing else. Platforms charging every expense through to investors at around 7.4% of assets are oversubscribed, while traditional single managers have watched fees compress for a decade. Nothing else in asset management looks like this.
North America holds 52% of revenue, above the usual regional band, because the largest platforms are headquartered and staffed there. Multi-strategy pass-through platforms grow at 10.8%, half again the market rate of 7.2%, and roughly 38% of that capital is now closed to any new investor at all. Allocators here now compete for access rather than negotiating fees at all, which inverts every single assumption governing the rest of investment management entirely anywhere.
Concentration reaches only 24% by revenue and is far higher among the funds anybody can actually access. What the pass-through structure really buys is the ability to pay portfolio managers whatever an industry of perhaps 4,000 people demands, without the platform absorbing any of it. Guaranteed packages for the best of those people reach levels that no fixed management fee arrangement could ever possibly have funded at all.
Market Definition
The market covers management, pass-through and performance fee revenue earned by hedge fund managers worldwide, spanning multi-strategy pass-through platforms, systematic and quantitative strategies, credit and distressed strategies, macro and managed futures, equity long-short single manager funds, and event driven and relative value strategies. Private equity and venture capital fees, private credit fund management fees, long-only asset management, prime brokerage revenue earned by banks, and fund administration are excluded.
Base Year Value
$114.0B in 2025 (MMA Primary Research Dataset, August 2026)
Forecast Period
2026 to 2036, eleven discrete annual values
CAGR
7.2% base case. Bull 8.4%. Bear 6.0%.
Fastest Growth Segment
Multi-Strategy Pass-Through Platforms: 10.8% CAGR
Fastest Growth Country
Singapore: 9.2% CAGR
Fastest Growth Region
South Asia and Pacific: 9.4% CAGR
Largest Region
North America: 52% of 2025 global value
Market Leaders
Bridgewater Associates, Millennium Management, Citadel, Man Group, Elliott Investment Management. Source: MMA Analysis based on disclosed and estimated management, pass-through and performance fee revenue, company filings and annual reports 2025.
Primary Survey
n=3,800 procurement and R&D decision-makers, Q4 2025, six countries
Methodology
Demand-side build-up, cross-validated against public data, 47 expert interviews

Hedge Fund Market Forecast Scenarios

hedge-fund-industry-size-forecast-scenario-1787916022303
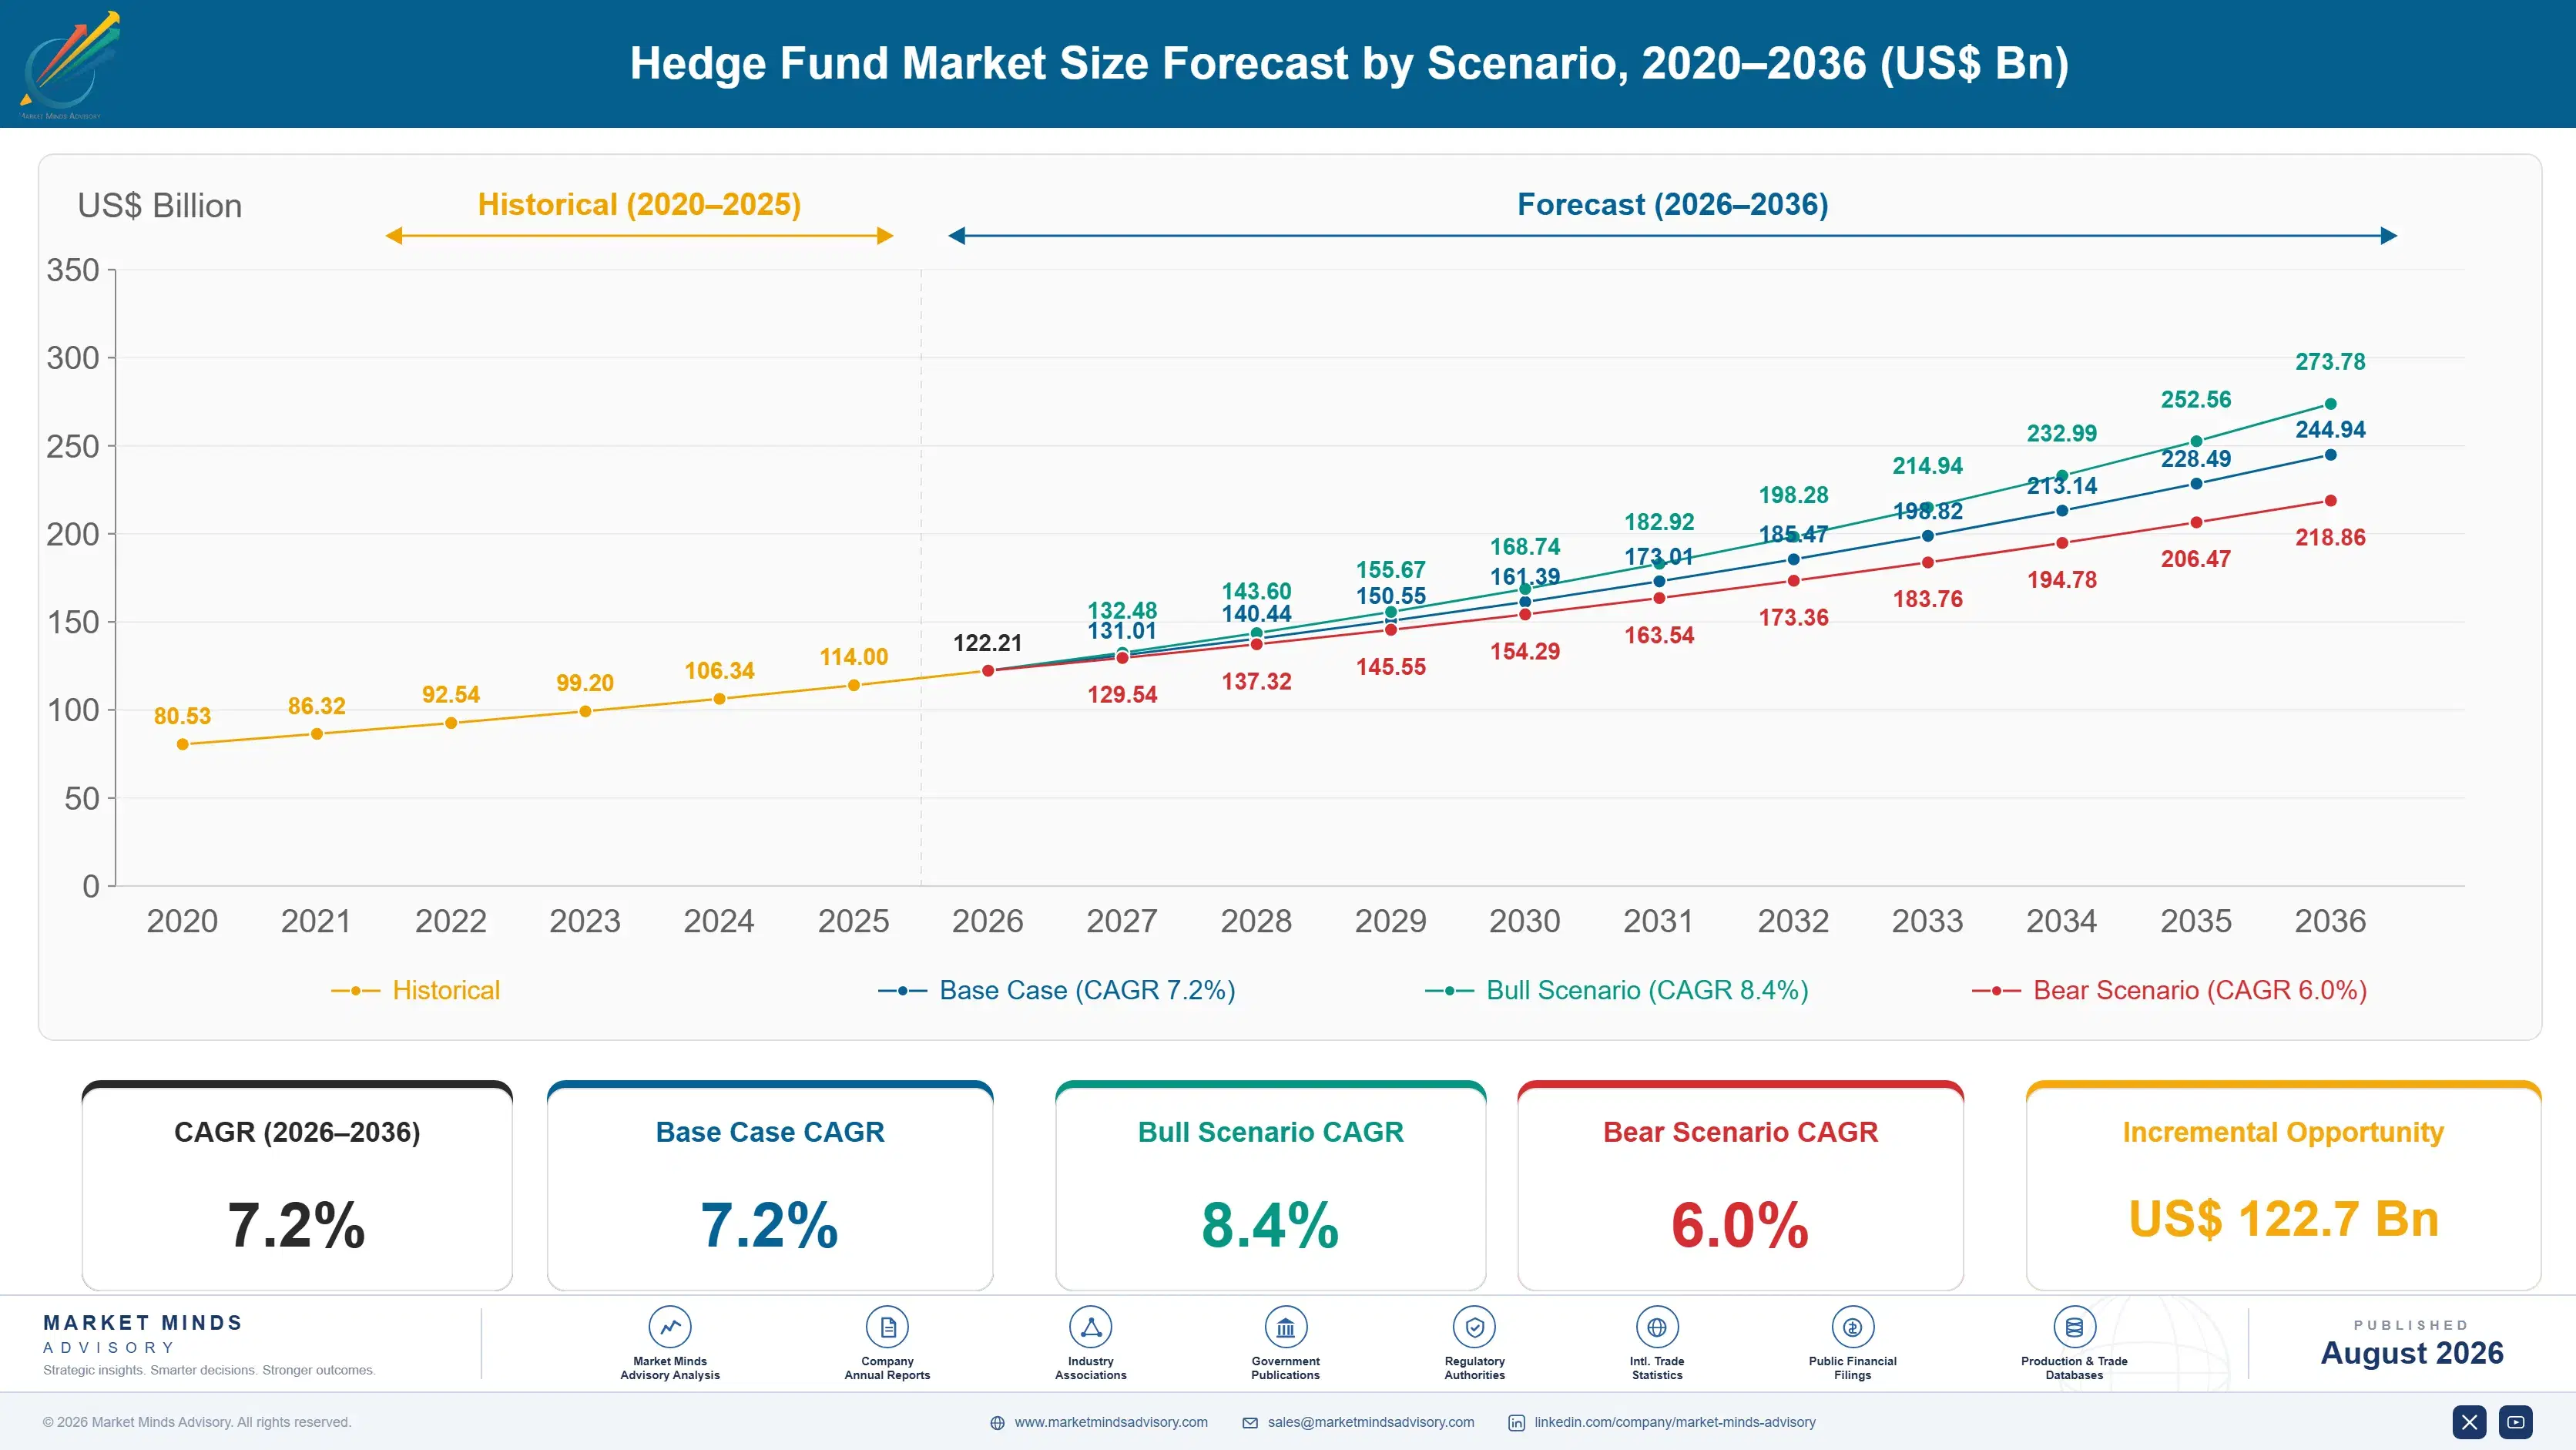
Growth from 2020 to 2025 ran at 6.0% and the average concealed two opposite movements. Multi-strategy platforms gathered assets faster than they could deploy them and several returned capital rather than dilute returns. Single manager equity funds saw fee compression and redemptions across almost every year. Prime financing costs rose as capital treatment tightened following a large family office failure in 2021.
The 7.2% base case rests on three mechanisms. Platform demand keeps outrunning capacity, which supports pass-through economics that would look indefensible in any other part of asset management. Systematic strategies keep growing on capability that scales without adding people. And Asian allocator demand keeps rising as sovereign and pension money there builds alternatives exposure from a genuinely low base. None of the three requires performance to improve at all anywhere.
The bull case at 8.4% assumes platform performance holds and closed funds reopen selectively at premium terms. The bear case at 6.0% is a year where platform netting costs become visible, since investors pay performance fees on winning pods while the overall fund is flat, and that arithmetic has not yet been tested by a genuinely poor year at any of the largest platforms.

Two Industries, One Label

Pass-through is the fact that explains everything else. A multi-strategy platform charges the fund for every cost it incurs, including salaries, technology, market data, legal fees and office rent, which runs around 7.4% of assets annually before any performance fee. Traditional funds charged a management fee and absorbed those costs themselves. Investors have accepted the change because net returns arrived, and because the best platforms stopped taking their money anyway.
FIVE-FIRM CONCENTRATION24%Share of category revenue held by the largest managers
PASS-THROUGH EXPENSE RATIO7.4%Annual costs charged directly to investors by platforms
PERFORMANCE FEE RATE22%Share of gains retained by the manager annually
MULTI-STRATEGY GROSS LEVERAGE6.2Times capital deployed across a platform's total positions
PORTFOLIO MANAGER POPULATION4,000People the whole industry competes hard to employ
CLOSED FUND ASSET SHARE38%Platform capital now unavailable to any new investor
What pass-through actually purchases is people. The industry competes for perhaps 4,000 portfolio managers capable of running institutional capital, and packages for the best of them reach levels no fixed management fee could ever fund. Pass-through removes that constraint entirely, since the platform pays whatever the market demands and the investor covers it. The structure exists because talent costs more than any traditional fee arrangement could support.
Access has become the scarce commodity rather than capital. Around 38% of platform assets sit in funds closed to new investment, and several large managers have returned capital rather than dilute returns by deploying more than their strategies can absorb. That is the exact opposite of the asset-gathering logic governing every other corner of investment management.
"Everybody debates whether pass-through is fair. Nobody seems to notice it is a hiring mechanism. The fund is not buying rent and data terminals, it is buying the right to outbid a competitor for one person, and that person knows exactly what they are worth."
Director, Alternative Investments Practice · MMA Alternative Investment Management Practice · August 2026

Market Trends

Pass-Through Turned Fees Into A Hiring Budget

Charging every expense to the fund at around 7.4% of assets removes any ceiling on what a platform can pay a portfolio manager, because the investor rather than the manager absorbs compensation cost. Guaranteed packages and sign-on arrangements for the best performers now reach levels no traditional management fee could fund at all. That segment grows at 10.8%. Nobody in this industry describes the structure that way publicly, and everybody uses it precisely for that. The investor pays for the hiring and sees it itemised on every single quarterly statement.
Market Impact: Grows systematic strategies at 9.0%

Capacity Rather Than Capital Became The Constraint

Roughly 38% of platform assets sit in funds closed to new money, and several managers have returned capital rather than deploy more than their strategies can genuinely absorb without diluting returns. Allocators now compete for access rather than negotiating terms. That inverts the logic of every other part of investment management, where gathering assets is the entire objective and capacity constraints are something nobody mentions in a pitch. Allocators who lose an allocation join a waiting list rather than negotiating terms, which is a conversation nobody in this industry was having fifteen years ago.
Market Impact: Grows Singapore demand at 9.2%

Market Opportunities and Growth Drivers

Systematic Strategies Scale Without Adding Headcount

Quantitative and systematic managers grow assets without a proportionate increase in investment staff, which produces operating economics that discretionary platforms competing for 4,000 people simply cannot match anywhere. That segment grows at 9.0%. The constraint moves from talent availability to data, compute and research throughput, all of which can be purchased rather than recruited, and all of which scale considerably more predictably than any hiring plan does. The largest systematic managers look nothing at all like the largest discretionary ones on any cost measure anybody cares to examine closely here.
Market Impact: Charges 22% on winning pods

Asian Allocators Build Alternatives Exposure From Low Bases

Sovereign wealth funds, pension arrangements and family offices across Asia hold considerably lower alternatives allocations than North American or European peers and have been raising them steadily for several years. Singapore grows fastest at 9.2% as the regional booking and relationship hub. Those allocators write large tickets and ask harder operational questions than the industry was accustomed to, which has raised the standard of disclosure everybody now provides. Nobody in this industry expected the operational scrutiny to arrive from Asia rather than from any of the established American consultants of all.
Market Impact: Finances 6.2 times gross leverage

Market Restraints and Challenges

Netting Costs Have Not Met A Poor Year

Platform performance fees are charged at pod level, which means investors pay on winning teams even where the overall fund returns nothing, and that arithmetic has never been tested by a genuinely bad year at any of the largest platforms. Root cause is the compensation structure requiring pod-level crystallisation. Commercial impact would be a fee bill without a return. Mitigation involves netting arrangements and hurdles, which portfolio managers resist for entirely obvious reasons. Nobody has explained that arithmetic to an allocator who has not already seen it happen before once.
Market Impact: Charges 7.4% of assets annually

Financing Costs Rose And Are Not Coming Back

Gross leverage across multi-strategy platforms runs around 6.2 times capital and depends entirely on prime brokerage balance sheet, which capital treatment has made considerably more expensive since a large family office failure demonstrated what happens when several primes each see only their own exposure. Root cause is bank capital regulation. Commercial impact is a permanently higher cost of running the same book. Mitigation involves prime diversification and internal financing capability. Nobody in this industry expects that cost to reverse in any regulatory cycle that anybody can currently foresee arriving anywhere.
Market Impact: Closes 38% of platform assets
3 additional market trends, 4 additional growth drivers, and 2 additional restraints and challenges are covered in the full report. Contact sales@marketmindsadvisory.com to access the complete intelligence.

Segment CAGR and Growth Architecture

Segmentation follows strategy and fee structure, since economics, capacity and talent dependency all differ by structure rather than by manager size or domicile. Six categories cover the market without overlap. Manager size, investor type and domicile are treated as separate commercial dimensions throughout this report rather than as segmentation logic in their own right here.
hedge-fund-industry-market-share-analysis-1787916022855

Multi-Strategy Pass-Through Platforms

Pass-through platforms grow at 10.8%, half again the market rate of 7.2%, by charging every cost they incur to the fund at around 7.4% of assets annually and thereby removing any ceiling on what a portfolio manager can be paid. Roughly 38% of that capital is closed to new investment. The structure has never been tested by a genuinely poor year, when investors would pay performance fees on winning pods while receiving nothing overall from the fund itself. Investors would pay substantial fees while receiving nothing at all from the fund, which is a conversation every platform knows is coming and none of them has yet had to hold with anybody.
CAGR 10.8%

Systematic and Quantitative Strategies

Systematic strategies grow at 9.0% and scale assets without proportionate increases in investment headcount, which produces operating economics that discretionary platforms competing for perhaps 4,000 people cannot approach at all. The binding constraint becomes data, compute and research throughput rather than hiring, and all three can be purchased rather than recruited. That difference compounds quietly, and it explains why the largest systematic managers look nothing like the largest discretionary ones on any cost measure. Crowding is the genuine risk rather than talent cost, since similar signals attract similar capital and returns degrade quite quietly when far too many participants end up trading exactly the same patterns simultaneously everywhere at once.
CAGR 9.0%
Full segment breakdown across 6 segments available in the complete report.

Regional Architecture and Country Demand Map

Revenue follows where the managers are staffed and domiciled rather than where the capital originates, and those two geographies diverge more here than in most parts of investment management. Pass-through economics concentrate the revenue precisely where the most expensive people actually happen to sit here.

North America

Share sits at 52%, above the standard regional band, because the largest multi-strategy platforms are headquartered and staffed here and pass-through economics concentrate revenue where the people actually sit. That justification reflects genuine staffing geography rather than any modelling preference. Competition for the roughly 4,000 portfolio managers capable of running institutional capital is fiercest here, and packages set in this market establish the benchmark that every other region ends up paying against. Around 38% of platform assets sit in closed funds and most of that capacity is here, which means an allocator seeking exposure to the strongest managers is frequently seeking exposure to a firm that has already stopped accepting anybody's money.
Share: 52% | CAGR: 6.4% (2026 to 2036)

Western Europe

London remains the second largest concentration of hedge fund staffing anywhere and hosts substantial macro, credit and systematic capability alongside the European offices of American platforms. Regulatory reporting obligations are heavier than in North America and allocators here ask operational questions earlier in diligence. Talent competition is genuinely global, which means London packages track New York ones rather closely regardless of any local cost of living argument. Pass-through structures arrived here later than in North America and allocators questioned them more insistently at the outset, which produced better disclosure practice locally and considerably more uncomfortable conversations for platforms that were accustomed to explaining rather less than any of that beforehand.
Share: 24% | CAGR: 5.6% (2026 to 2036)
Regional intelligence for 5 additional markets available in the complete report: East Asia, South Asia and Pacific, Latin America, Middle East and Africa, Eastern Europe. Contact sales@marketmindsadvisory.com.
hedge-fund-industry-country-cagr-analysis-1787916023391

Buy The People, Charge It Through

Pass-through costs run 7.4% of assets, performance fees reach 22%, gross leverage sits near 6.2 times and 38% of platform capital is closed. Four levers here work on talent economics, capacity discipline, financing diversification and netting structure rather than on gathering assets, which several of the very best managers have already stopped doing entirely.

Treat Pass-Through As A Recruitment Instrument

Charging every cost to the fund at around 7.4% of assets removes any ceiling on what a portfolio manager can be paid, which is the entire commercial purpose of the arrangement whatever anybody says about expense transparency. An industry competing for perhaps 4,000 people cannot afford a compensation ceiling. Platforms treating pass-through as an accounting convention rather than a hiring weapon are losing the only competition that actually decides outcomes. Every platform uses the structure for exactly this and almost nobody describes it that way in any investor presentation anywhere.
Market Impact: Funds the hiring across all 4,000 available candidates

Close The Fund Before Returns Dilute

Roughly 38% of platform assets already sit in closed funds, and managers who returned capital rather than deploy beyond their capacity have protected exactly the returns that keep allocators queuing for access. Gathering assets past the point strategies can absorb them destroys the performance that made the assets available. Every manager knows this and a meaningful number do it anyway, which is why access has become genuinely scarce. Allocators queue for capacity that no longer exists rather than negotiating terms on capacity that does, which tells you everything about where scarcity sits.
Market Impact: Protects the returns across all 38% closed capacity

Diversify Prime Financing Before It Tightens

Gross leverage near 6.2 times depends entirely on prime brokerage balance sheet, and capital treatment has made that balance sheet permanently more expensive since a family office failure showed what happens when each prime sees only its own slice. Concentrating with one or two primes is efficient until it is not. Diversifying costs basis points continuously and removes a dependency that has ended funds before now. Prime brokerage appetite is a decision taken inside a bank on considerations that have nothing whatever to do with how any individual fund has been performing.
Market Impact: Supports that 6.2 times gross leverage far safer

Fix Netting Before A Flat Year Arrives

Performance fees charged at pod level mean investors pay 22% on winning teams while the overall fund returns nothing, and that arithmetic has never been tested by a genuinely poor year at any large platform. Introducing netting or a hurdle costs recruitment competitiveness immediately and visibly. Explaining a fee bill on a flat year to an allocator who has not seen one before costs considerably more than that. The conversation happens either on the platform's terms now or on an unhappy allocator's terms during the year it finally goes wrong.
Market Impact: Addresses the whole 22% pod level netting exposure

Who Controls the Margin Pool

Measured on disclosed and estimated management, pass-through and performance fee revenue, the five largest managers hold a CR5 of just 24%, which understates concentration considerably because so much of the best capacity is closed to new investors entirely. Bridgewater Associates, Millennium Management and Citadel carry the largest positions, Man Group holds substantial systematic and listed presence, and Elliott Investment Management leads in event driven and activist strategies. Nobody outside that group runs both a large discretionary platform and a systematic business of comparable scale.
Three contests define activity. Platforms compete for portfolio managers rather than for assets. Systematic managers compete on research throughput and compute. Credit and macro managers compete on capacity and terms. Each of those three rewards a completely different organisation, and hardly any manager here competes seriously in more than one of them.

Pressure builds from allocators questioning pass-through disclosure and netting arrangements more insistently each year. Rankings shift toward whoever retains talent rather than whoever raises the most capital. Assets under management have stopped explaining very much at all, since so much of the best capacity is closed and the rest is competing on terms nobody publishes anywhere.
hedge-fund-industry-company-positioning-matrix-1787916023924

Competitive Moat and Risk Dimensions

MILLENNIUM MANAGEMENT

Moat: Platform Scale And Risk Discipline

Operating a very large number of independent portfolio manager teams under centralised risk limits produces return characteristics that no single strategy manager can replicate, since diversification across uncorrelated pods is the product rather than any individual insight. Assembling comparable breadth requires recruiting hundreds of managers who each have alternatives, which is harder than raising the capital to pay them.
MILLENNIUM MANAGEMENT

Risk: Talent Cost Inflation Continues

Competition for a small pool of portfolio managers has driven guaranteed packages steadily upward, and pass-through means investors carry that cost visibly on every statement. Rising expense ratios eventually attract allocator resistance regardless of net returns. The structure that funds the hiring is also the structure that displays exactly what the hiring cost.
MAN GROUP

Moat: Systematic Capability At Listed Scale

Running systematic strategies at scale under public company disclosure produces an operating model that grows assets without proportionate headcount and reports its economics openly, which is unusual in an industry built on opacity. Research infrastructure and data assets accumulated over decades cannot be recruited or purchased quickly. The listed structure also provides permanent capital.
MAN GROUP

Risk: Systematic Strategy Crowding Risk

Systematic approaches face crowding as similar signals attract similar capital, and returns degrade when too many participants trade the same patterns simultaneously. Research advantage decays continuously and requires constant reinvestment simply to maintain position. Public disclosure obligations also reveal more about performance and flows than private competitors ever have to.

Players Tracked

Prominent Players

Bridgewater Associates
Millennium Management
Citadel
Man Group
Elliott Investment Management

Other Key Players

Point72
Balyasny Asset Management
ExodusPoint Capital
DE Shaw
Two Sigma
Renaissance Technologies
AQR Capital Management
Brevan Howard
Marshall Wace
Davidson Kempner
King Street Capital
Farallon Capital
Winton
Schonfeld Strategic Advisors
Verition Fund Management

Recent Developments

FEBRUARY 2025

Platform returns capital rather than expand beyond strategy capacity

A multi-strategy platform returned capital to investors rather than deploy assets beyond what its strategies could absorb without diluting returns. This was a capacity decision rather than any performance event, and allocators who lost their allocation joined waiting lists for any future availability instead of complaining.
Signal: Returning money protects the returns that made the money available to anybody in the first place.
JUNE 2025

Allocator group publishes comparison of pass-through expense disclosure

An institutional allocator group published a comparison of how platforms disclose pass-through expenses, highlighting substantial variation in both categorisation and level of detail. This was an analytical publication rather than any regulatory action, and several managers improved their disclosure formats considerably within the following quarter afterwards.
Signal: Disclosure comparison is always the very first stage of every fee negotiation that then follows it.
OCTOBER 2025

Portfolio manager team departs platform for competitor guarantee

A portfolio manager team moved between multi-strategy platforms following a guaranteed compensation arrangement running substantially above prevailing market levels. This was a recruitment outcome rather than any performance matter, and the receiving platform funded that entire guarantee through its own pass-through arrangement without any difficulty.
Signal: Pass-through funds the guarantees and those guarantees then decide exactly where all the talent sits afterwards.

Compensation, Financing, Data

Three costs consume revenue and one of them dwarfs the others. Portfolio manager and analyst compensation, prime brokerage financing on leverage near 6.2 times capital, and market data with technology and compliance together account for 62 to 81% of gross revenue at a typical platform. Compensation dominates entirely, because an industry competing for perhaps 4,000 people prices talent against what a competitor would pay rather than against any internal budget.
Financing then repriced permanently. Bank capital treatment of prime brokerage balances tightened following the 2021 failure of a large family office, which demonstrated that several primes each seeing only their own exposure cannot assess aggregate risk, and Financial Conduct Authority and Securities and Exchange Commission materials document the supervisory response. Man Group Annual Report 2024 disclosures describe the resulting financing cost environment across leveraged strategies.

Exposure divides by whether compensation is charged through or absorbed. Platforms passing costs to investors compete for talent without limit and display the bill on every statement. Traditional managers absorbing compensation from a management fee cannot match the packages and lose people accordingly. That difference explains the industry's split into two businesses far better than any argument about investment philosophy ever has.
hedge-fund-industry-cost-volatility-analysis-1787916024121

Disclose pass-through categories before allocators demand it

Expense charges of around 7.4% of assets vary considerably in how platforms categorise and present them, and allocator groups have begun publishing comparisons. Improving disclosure voluntarily costs a few uncomfortable conversations about what particular expense lines actually contain. It is considerably better than being compared unfavourably in somebody else's published comparative analysis afterwards instead.

Diversify prime relationships beyond one or two banks

Gross leverage near 6.2 times capital depends entirely on prime brokerage willingness, and concentration is efficient until a single relationship reconsiders its appetite. Spreading those balances costs basis points continuously and complicates operations meaningfully. It removes a dependency that has closed funds abruptly on rather more than one previous occasion already in this industry.

Build internal financing capability where scale permits

Capital treatment has made prime balance sheet permanently more expensive and the cost is unlikely to reverse in any foreseeable regulatory cycle. Larger platforms can finance parts of a book internally or through repo relationships directly. Building that capability requires treasury expertise most managers have never needed and removes a steadily growing cost line.

Portfolio Architecture for Margin Defence

Margin follows fee structure rather than strategy quality, which is uncomfortable for an industry that talks constantly about investment skill. Equity long-short single manager funds earn least after a decade of fee compression. Event driven and relative value strategies earn modestly on shrinking allocations. Macro and managed futures earn reasonably when volatility cooperates. Credit and distressed earn well on capacity scarcity. Systematic strategies earn better on operating leverage. Pass-through platforms earn best, on a structure investors accept.
The tension is that the best economics depend on a structure nobody has stress tested. Pass-through platforms charge around 7.4% of assets plus 22% of gains at pod level, and in a flat year investors would pay substantial fees while receiving nothing. That arithmetic has never met a genuinely poor year at any large platform. The structure is excellent and entirely untested, and those two facts sit uncomfortably together.

High-value pools sit in three places. Portfolio manager retention, which decides platform returns and which pass-through exists specifically to fund. Capacity discipline, where closing a fund protects the returns that made it worth investing in. And systematic operating leverage, which grows assets without recruiting from a pool of perhaps 4,000 contested people.

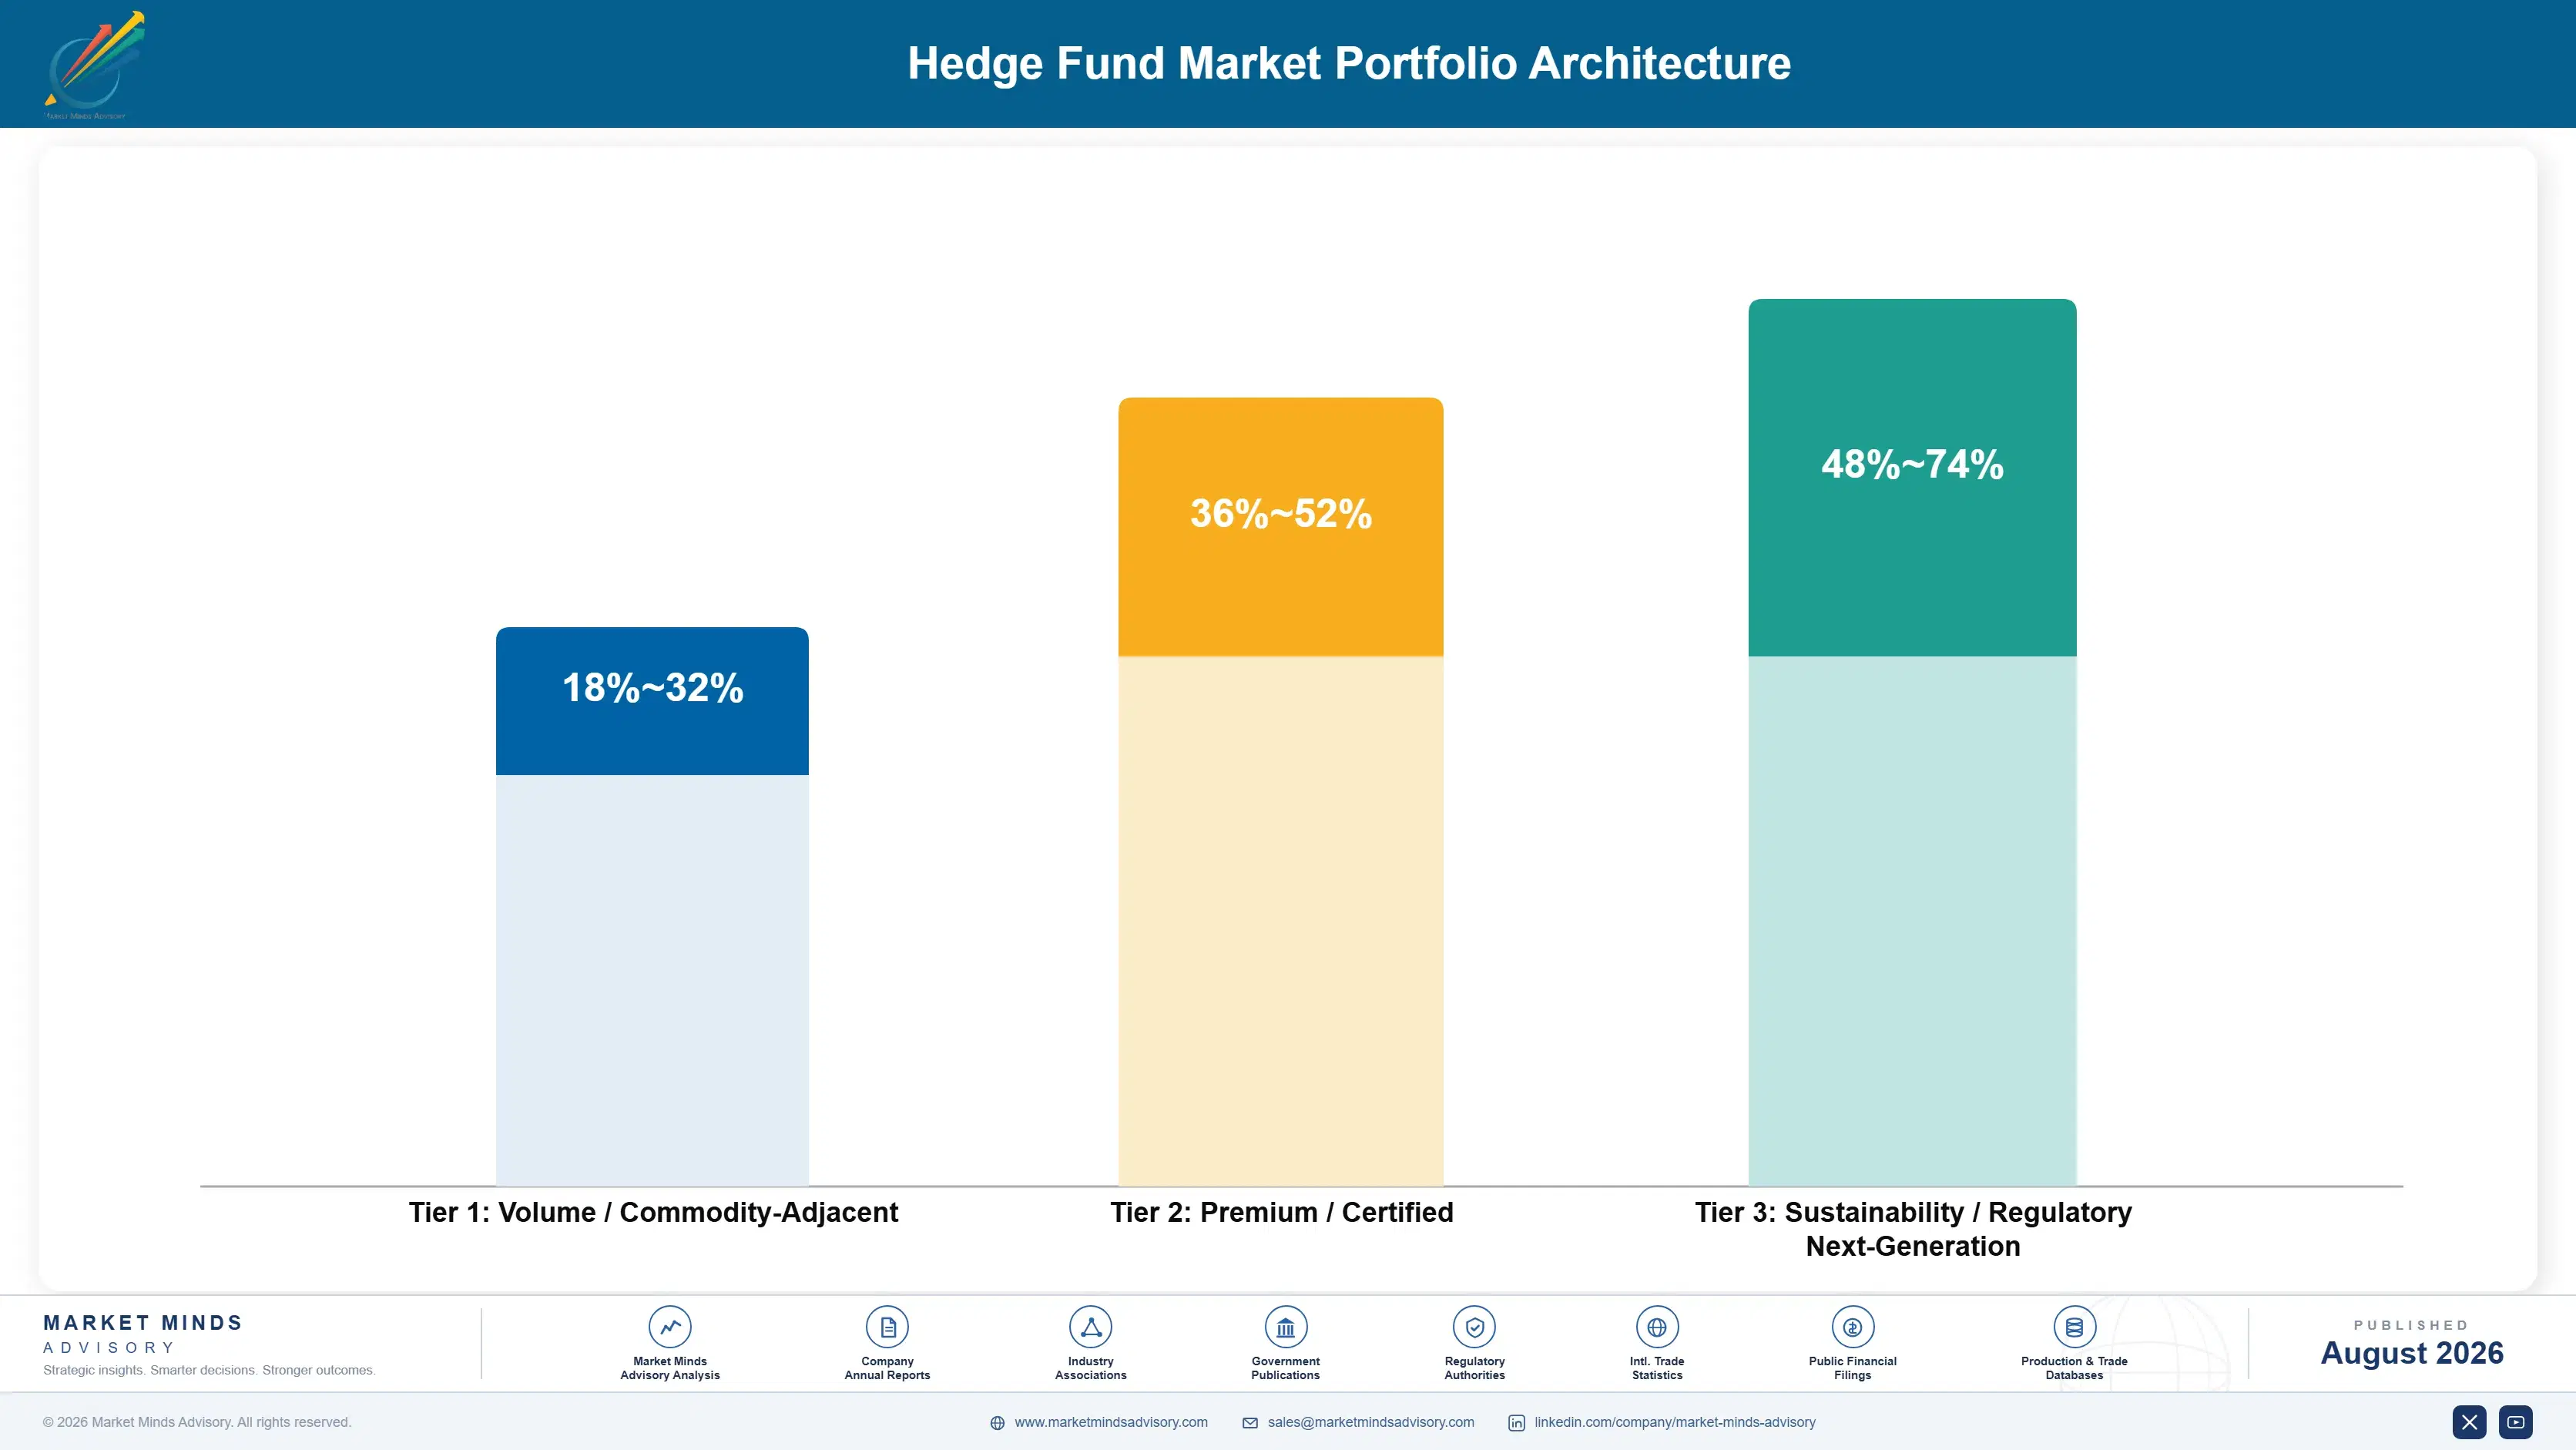
Volume / Commodity-Adjacent

Equity long-short single manager and event driven strategies operating under a decade of fee compression and steady redemptions. The 14-point range separates established managers retaining institutional relationships from smaller funds competing on terms alone.
Gross Margin: 18-32%

Premium / Certified

Macro, managed futures and credit strategies where capacity scarcity and volatility exposure support better terms than equity strategies command. The 16-point spread reflects how differently these perform depending on the market environment in any year.
Gross Margin: 36-52%

Sustainability / Regulatory / Next-Generation

Pass-through platforms and systematic strategies where expense charging or operating leverage produce the strongest economics available anywhere. The 26-point range is wide because pass-through and systematic economics rest on entirely different foundations.
Gross Margin: 48-74%
hedge-fund-industry-portfolio-architecture-1787916024656

High-value Sub-segments and Strategic Watch-out

Pass-Through Platform Structure

Best economics and fastest growth at 10.8%, sustained by demand that consistently exceeds capacity and by a structure investors have accepted without much argument. The risk is that it has never once met a genuinely poor year anywhere. Nobody actually knows how it behaves yet.
Gross Margin: 60-74%

Systematic Operating Leverage

Strong economics from growing assets without recruiting from a contested pool of roughly 4,000 discretionary portfolio managers. The risk is crowding, since similar signals attract similar capital and returns degrade when everybody trades the same patterns. And research advantage decays continuously, requiring constant reinvestment throughout.
Gross Margin: 50-64%

Credit And Macro Capacity

The reliable middle, earning on capacity scarcity and on strategies that perform when other approaches struggle badly. Managers hold it for diversification of their own revenue, not because the terms match platform economics anywhere. Revenue diversification is really the only reason that it stays there.
Gross Margin: 38-50%

Single Manager Fee Compression

The strategic watch-out. A decade of falling fees and steady redemptions with no year of reversal anywhere in the record. The risk is defending a fee level on an asset base that keeps shrinking regardless. And nothing about the record anywhere suggests a turn coming.
Gross Margin: 20-32%

Locked Money, Contested People

Annuity characteristics here rest on lock-ups rather than on satisfaction. Investors commit capital under redemption terms that restrict withdrawal to quarterly or annual windows with notice periods, which produces revenue stability that no monthly liquidity product ever achieves. What is genuinely fragile is the investment team, since a departing portfolio manager takes performance rather than assets and the assets follow considerably later once allocators have worked out what happened.
Stickiness therefore depends on returns and access rather than on any relationship. A closed fund delivering good performance has effectively permanent capital, since investors cannot add and will not leave. An open fund delivering poorly loses money at the first available window. Nothing about relationship management alters either outcome, which several managers with excellent client service functions have discovered at considerable expense to themselves.

The allocator has become considerably more demanding across five years. Early institutional investors bought access and asked comparatively little about operations. Those same investors now examine pass-through categorisation, netting arrangements, prime concentration and key person provisions in detail, and consultants advising them have become markedly better informed. That scrutiny arrived from Asian and Australian allocators as much as from established American ones.
hedge-fund-industry-end-use-penetration-index-1787916025158

Talent Decides Everything

These are among the four positions where our research anticipates prominent divergence between winners and laggards over the coming forecast period. Each is grounded in the demand model, the regulatory perimeter, and the announced capacity pipeline.
01 / TALENT ECONOMICS RECOGNITION

Pass-through is a hiring mechanism, not an expense policy

Charging every single cost through to the fund at around 7.4% of assets removes any ceiling at all on what a platform is able to pay a portfolio manager, which is the entire commercial purpose of that whole arrangement whatever anybody says publicly about expense transparency instead. An industry competing hard for perhaps 4,000 people simply cannot afford any compensation ceiling anywhere. Platforms that treat this as an accounting convention are losing the only competition that genuinely decides outcomes here.
02 / CAPACITY DISCIPLINE ENFORCEMENT

Returning money protects what made it available

Roughly 38% of all platform assets already sit in funds closed to any new investment, and the managers who returned capital rather than deploying beyond genuine strategy capacity have protected exactly the returns that keep allocators queuing up for access in the first place. Gathering assets past the point of absorption destroys the performance that made those assets available at all. Every manager here understands this arithmetic perfectly well and a meaningful number of them still do it anyway regardless.
03 / FINANCING DEPENDENCY REDUCTION

One prime seeing one slice ends badly

Gross leverage near 6.2 times capital depends entirely on somebody's prime brokerage balance sheet, and capital treatment has made that balance sheet permanently rather more expensive since one family office failure demonstrated exactly what happens when several primes each see only their own slice of exposure. Concentrating with one or two relationships is entirely efficient right up until the moment it suddenly is not. Diversifying away costs basis points continuously and removes a dependency that has closed funds before now.
04 / NETTING STRUCTURE PREPARATION

A flat year produces a bill and no return

Performance fees charged at pod level mean investors pay around 22% on winning teams even when the overall fund has returned nothing at all, and that arithmetic has never once been tested by a genuinely poor year at any of the very largest platforms. Introducing any netting or a hurdle costs recruitment competitiveness immediately and visibly. Explaining a substantial fee bill on a flat year to an allocator seeing one for the very first time costs considerably more than that.

Engagement Snapshot From the Field

A live engagement with an industry participant carrying material or product regulatory and market exposure ahead of a defining policy shift, showing how our research translates into a defensible multi-year portfolio strategy.
MARKET MINDS ADVISORY · CLIENT ENGAGEMENT SUMMARY
Hedge Fund Producer Strategic Portfolio Review and Transition Roadmap 2026·Investment Scenario on Hedge Fund Exposure Evaluation 2025-26
CLIENT PROFILE
A mid-sized multi-strategy platform managing capital across roughly forty portfolio manager teams, with reported management, pass-through and performance fee revenue of 420 million dollars (client-reported, unverified by MMA). Pass-through expenses ran above peer levels, prime financing was concentrated with two banks, and no netting arrangement of any kind applied at fund level anywhere at all.
STRATEGIC CHALLENGE
Two allocators had raised pass-through expense levels during annual reviews and one had reduced its allocation, while competitor platforms had begun publishing more detailed expense breakdowns. Management proposed capping pass-through expenses at a stated percentage. That constrained the hiring mechanism the whole platform depends upon, in response to a disclosure problem rather than any actual cost problem.
MMA APPROACH
MMA analysed pass-through expenses by category against peer disclosure formats, then modelled the fee outcome for investors under a flat performance year with pod-level crystallisation. Twenty-four expert interviews with allocators, consultants, prime brokerage heads and portfolio managers established what is actually being examined in diligence now. The analysis treated disclosure quality and netting structure as the routes available forward.
KEY FINDINGS
  1. Pass-through expenses were within peer range once categorised consistently, and the perception of excess came entirely from a disclosure format nobody outside could interpret.
  2. Under a flat year with pod-level crystallisation, investors would have paid substantial performance fees while receiving no return, and no allocator had yet modelled that.
  3. Prime financing concentrated with two banks left the platform exposed to a single appetite decision, and neither relationship had been tested under stress.
  4. Capping pass-through would have removed the platform's ability to match competitor guarantees, and three teams had already received approaches during the year.
CLIENT PROFILE
A mid-sized multi-strategy platform managing capital across roughly forty portfolio manager teams, with reported management, pass-through and performance fee revenue of 420 million dollars (client-reported, unverified by MMA). Pass-through expenses ran above peer levels, prime financing was concentrated with two banks, and no netting arrangement of any kind applied at fund level anywhere at all.
STRATEGIC CHALLENGE
Two allocators had raised pass-through expense levels during annual reviews and one had reduced its allocation, while competitor platforms had begun publishing more detailed expense breakdowns. Management proposed capping pass-through expenses at a stated percentage. That constrained the hiring mechanism the whole platform depends upon, in response to a disclosure problem rather than any actual cost problem.
MMA APPROACH
MMA analysed pass-through expenses by category against peer disclosure formats, then modelled the fee outcome for investors under a flat performance year with pod-level crystallisation. Twenty-four expert interviews with allocators, consultants, prime brokerage heads and portfolio managers established what is actually being examined in diligence now. The analysis treated disclosure quality and netting structure as the routes available forward.
KEY FINDINGS
  1. Pass-through expenses were within peer range once categorised consistently, and the perception of excess came entirely from a disclosure format nobody outside could interpret.
  2. Under a flat year with pod-level crystallisation, investors would have paid substantial performance fees while receiving no return, and no allocator had yet modelled that.
  3. Prime financing concentrated with two banks left the platform exposed to a single appetite decision, and neither relationship had been tested under stress.
  4. Capping pass-through would have removed the platform's ability to match competitor guarantees, and three teams had already received approaches during the year.
RECOMMENDED STRATEGY
Phase 1: Phase one: rebuild pass-through disclosure into peer-comparable categories, since the problem is presentation rather than the actual underlying expense level. Phase 2: Phase two: introduce a partial netting arrangement at fund level before a flat year forces the conversation on somebody else's terms. Phase 3: Phase three: add a third prime relationship, since two banks leave the whole book exposed to a single appetite decision.
OUTCOME
Redisclosure resolved both allocator concerns and the reduced allocation was restored at the following review (client-reported, unverified by MMA). A partial netting arrangement was introduced and portfolio managers accepted it with less resistance than expected. A third prime relationship was established. The expense cap was abandoned, having proposed disabling the hiring mechanism to solve a presentation problem.

Frequently Asked Questions

Foundational context covering the market sizes, CAGR, scope, country, region and competition that inform every finding below. This section is provided to cover basics and most often pre-purchase conversations, answered from the MMA Primary Research Dataset.

What is the current size of the Hedge Fund Market?

The market was worth 114.0 billion dollars in management, pass-through and performance fee revenue in 2025, across platform, systematic, credit, macro, equity and event strategies. It reaches 122.21 billion dollars in 2026.

How large will the Hedge Fund Market be by 2036?

MMA forecasts 244.94 billion dollars by 2036, an increase of 122.73 billion dollars over the 2026 base. That represents an expansion multiple of 2.00 times across the forecast period.

What is the CAGR for the Hedge Fund Market 2026 to 2036?

The base case compounds at 7.2% annually. The bull case reaches 8.4% if platform performance holds and closed funds reopen selectively, while the bear case sits at 6.0%.

Which segment is growing fastest?

Multi-strategy pass-through platforms, at 10.8%, half again the market rate of 7.2%. Charging every cost through funds compensation no traditional fee arrangement could ever support.

Who are the major companies in the Hedge Fund Market?

Bridgewater Associates, Millennium Management, Citadel, Man Group and Elliott Investment Management lead on estimated revenue. Concentration understates reality, since much of the best capacity is closed.

Which country is growing fastest?

Singapore at 9.2%, functioning as the regional booking and relationship hub for platforms building Asian investment capability and and for serving the allocators based there.

Report Segmentation Architecture

The full report scope spans multiple orthogonal segmentation dimensions, with cross-tabulated demand data provided for each dimension pair. Coverage extends further to regional breakdowns, trend trajectories, and the competitive detail needed to support segment-level decision-making.

By Strategy and Fee Structure

  • Multi-Strategy Pass-Through Platforms
  • Systematic and Quantitative Strategies
  • Credit and Distressed Strategies
  • Macro and Managed Futures
  • Equity Long-Short Single Manager
  • Event Driven and Relative Value

By End-Use Industry

  • Public Pension Arrangements
  • Sovereign Wealth Funds
  • Endowments and Foundations
  • Insurance Company Portfolios
  • Family Offices and Private Wealth
  • Fund of Funds and Consultants

By Commercial Dimension

  • Direct Institutional Subscription
  • Consultant Recommended Allocation
  • Seeding and Acceleration Arrangements
  • Management Company Stake Investment
  • Managed Account Platform Access
  • Capacity Reservation Agreements

By Region

  • North America
  • Western Europe
  • East Asia
  • South Asia and Pacific
  • Latin America
  • Middle East and Africa
  • Eastern Europe

Scope, Methodology, and Coverage

Every figure in this report is reproducible from documented input assumptions. The scope below maps the historical period, the forecast horizon, the segmentation dimensions, and the countries covered, alongside the underlying primary and qualitative methodology.
Historical Period
2020 to 2025
Forecast Period
2026 to 2036
Base Year
2025 (USD billions; MMA Primary Research Dataset, August 2026)
Market Definition
Scope covers management, pass-through and performance fee revenue earned by hedge fund managers worldwide, spanning multi-strategy pass-through platforms, systematic and quantitative strategies, credit and distressed strategies, macro and managed futures, equity long-short single manager funds, and event driven and relative value strategies. Revenue is measured as management fees, expenses charged through to funds under pass-through arrangements, and performance or incentive fees crystallised at fund or pod level. Private equity and venture capital management and carried interest, private credit fund management fees, long-only and index asset management, prime brokerage and financing revenue earned by banks, fund administration and custody revenue, and proprietary trading conducted outside any fund structure are excluded from the market size and all derived figures.
Quantitative Units
USD billions of fee revenue (current prices); assets under management in USD trillions; pass-through expenses as percentage of assets; performance fee rate as percentage of gains; gross leverage as multiple of capital
Segmentation Dimensions
By Strategy and Fee Structure; By End-Use Industry; By Commercial Dimension; By Region
Regions Covered
North America, Western Europe, East Asia, South Asia and Pacific, Latin America, Middle East and Africa, Eastern Europe
Countries Covered
USA, UK, Singapore, Hong Kong, Japan, Switzerland, Canada, Australia, UAE, Saudi Arabia, Netherlands, Sweden, Brazil, South Korea, Poland
Key Companies Profiled
Bridgewater Associates, Millennium Management, Citadel, Man Group, Elliott Investment Management, Point72, Balyasny Asset Management, ExodusPoint Capital, DE Shaw, Two Sigma, Renaissance Technologies, AQR Capital Management, Brevan Howard, Marshall Wace, Davidson Kempner, King Street Capital, Farallon Capital, Winton, Schonfeld Strategic Advisors, Verition Fund Management
Quantitative Methodology
Primary survey, n=3,800 respondents, Q4 2025, six countries; demand-side model with trade association cross-validation
Qualitative Methodology
47 expert interviews, Q4 2025; applied to validate demand model assumptions, identify emerging dynamics, and assess competitive positioning
Report Format
PDF and XLSX data workbook (Word format preview document)
Publisher
Market Minds Advisory
Report Code
MMA-2026-TEC-321
Published
August 2026
Contact
sales@marketmindsadvisory.com | www.marketmindsadvisory.com

Purchase the full Hedge Fund Market Report (2026 to 2036).

The full report runs to 185 pages and covers all six strategy categories, seven regions and 20 profiled managers in detail. It includes the complete segment CAGR set, pass-through expense analysis against traditional fee structures, and modelling of investor fee outcomes under flat performance with pod-level crystallisation. Company profiles carry evaluation on disclosed and estimated management, pass-through and performance fee revenue, with moat and risk assessment for the top five managers. The competitive section extends to 14 tracked capacity, disclosure and talent developments across 2024 and 2025. Primary research inputs include a quantitative survey of 3,800 respondents and 47 expert interviews conducted in Q4 2025.
Six strategy categories with individual CAGR forecasts
Seven regions reflecting staffing geography rather than capital origin
Twenty manager profiles on consistent fee revenue basis
Fourteen tracked capacity and talent developments with commercial interpretation
Pass-through expenses analysed against traditional management fee structures
Netting outcomes modelled under flat performance and pod crystallisation

Built For The People Who Decide

From boardroom strategy to bench-side execution, this report is read cover-to-cover by leaders shaping the next decade of their industry, turning demand scenarios, market dynamics and valuation benchmarks into decisions.
CXOs/ Presidents/ VPs/ Managers
M&A and Corporate Development
Strategy Teams and R&D Heads
Procurement and Product Directors
Regulatory and Compliance Leaders
Investor Relations and Equity Analysts