Market Minds Advisory
Hearing Aids Market

Hearing Aids Market: The Device Was Never the Expensive Part

Manufacturers own the acoustics and the chips, retail clinics own the customer and most of the price, and the fight over which of those two positions matters is now openly under way.

Lead Analyst

Alice Ballenger

Published

September 2026

Make Smarter Decisions with Customized Research Insights

Request a free sample report and evaluate market opportunities, growth trends, and competitive dynamics relevant to your business needs.

2025 MARKET VALUE$12.8BMarket Size 2025
2036 FORECAST VALUE$29.9BBase Case , 2026 to 2036
CAGR 2026 TO 20368.0 %Bull 9.2% / Bear 6.8%
INCREMENTAL OPPORTUNITY$16.0BNet 10- year value creation
EXPANSION MULTIPLE2.16x2036 value over 2026 base
Strategic Levers
M&A Pipeline
Regional Outlook
Country Rankings
Competitive Intelligence
Segmental Deep-dive
Call-Us : 91 93563 13602

Executive Snapshot and Market Trajectory

The device accounts for roughly 28% of what a patient pays for a fitted hearing aid. Audiologist time, clinic overhead, and the follow-up visits carry the rest, which is why manufacturers bought retail chains and why the over-the-counter category threatens the channel rather than the technology.
Growth runs at 8.0% and the direct channel leads it. Direct-to-consumer and over-the-counter devices grow at 12.0%, exactly 1.50 times the market rate, reaching mild and moderate losses that never entered a clinic at all. East Asia holds the largest share at 29%, on Chinese and Japanese ageing populations and domestic manufacturing scale together. Receiver-in-canal prescription devices follow at 9.0% and remain the dominant professional fitting form.
Concentration is very high at 84% across the top five measured on units shipped, and it rests on acoustic signal processing and custom chip development that very few companies can fund. The same five own much of the retail network they sell through, which is a vertical position now being contested from the consumer electronics side. Consumer electronics makers are now adding amplification to earbuds people already own and wear without any stigma attached.
Market Definition
This market covers wearable hearing amplification devices for hearing loss, spanning behind-the-ear prescription devices, receiver-in-canal prescription devices, custom in-the-ear and completely-in-canal devices, direct-to-consumer and over-the-counter devices, and bone conduction and single-sided deafness devices. Cochlear implants and surgically implanted systems, personal sound amplification products not intended for hearing loss, audiometric diagnostic equipment, assistive listening room systems, and clinic service fees billed separately fall outside scope.
Base Year Value
$12.8B in 2025 (MMA Primary Research Dataset, August 2026)
Forecast Period
2026 to 2036, eleven discrete annual values
CAGR
8.0% base case. Bull 9.2%. Bear 6.8%.
Fastest Growth Segment
Direct-to-Consumer and Over-the-Counter Devices: 12.0% CAGR
Fastest Growth Country
India: 10.4% CAGR
Fastest Growth Region
South Asia and Pacific: 10.0% CAGR
Largest Region
East Asia: 29% of 2025 global value
Market Leaders
Sonova, Demant, WS Audiology, GN Store Nord, Starkey. Source: MMA Analysis based on company annual reports.
Primary Survey
n=3,800 procurement and R&D decision-makers, Q4 2025, six countries
Methodology
Demand-side build-up, cross-validated against public data, 47 expert interviews

Hearing Aids Market Forecast Scenarios

hearing-aids-market-size-forecast-scenario-1787301080626
The 2020 to 2025 period ran at 6.8% and channel disruption defined it more than any technology change. Clinic visits collapsed through 2020 and recovered slowly, while remote fitting capability advanced from a curiosity into a standard feature. The American over-the-counter category opened in 2022 and produced far less volume than forecast, largely because self-fitting proved harder for users than regulators expected.
Three mechanisms carry the 8.0% base case. Population ageing across high-income and Chinese populations is the largest, adding candidates faster than any adoption change. Direct channel expansion is the second, reaching mild and moderate losses that never entered a clinic. And rechargeable and connected device replacement is the third, shortening a replacement cycle that had stretched well beyond what the acoustics justified. None of the three depends on an acoustic performance breakthrough arriving.
The 9.2% bull case rests on self-fitting software closing the outcome gap against professional fitting, which would move a substantial share of mild loss out of clinics entirely. The 6.8% bear case is retail channel consolidation slowing as manufacturers digest acquisitions, combined with reimbursement pressure in the European systems that fund fitted devices most generously.

Where the Money Sits in the Channel

A fitted hearing aid costs a patient a great deal, and roughly 28% of that is the device. The remainder pays for audiologist assessment, fitting, real-ear verification, and the follow-up appointments that make the device usable, plus clinic overhead. Understand that split and almost everything about this industry's structure becomes legible, including why five manufacturers own around 41% of the fitting outlets that sell their products.
DEVICE SHARE OF PRICE28%Of what a patient pays for a professionally fitted device
MANUFACTURER OWNED RETAIL41%Of fitting outlets owned by the companies supplying them
UNTREATED LOSS SHARE76%Of people with measurable loss using no device at all
AVERAGE REPLACEMENT CYCLE6 yearsBetween devices, shortening as connected features are adopted
TOP FIVE CONCENTRATION84%Very high, on acoustic processing and custom chip development
SELF-FITTING ABANDONMENT23%Of direct channel purchasers who stop using the device
Vertical integration was a rational response to a simple fact: the party who owns the patient relationship captures most of the price and controls which brand gets fitted. Manufacturers who left retail to independents watched their access narrow as chains consolidated. Buying clinics secured distribution and margin at once. It also created a business where a manufacturer competes with its own independent customers, which is uncomfortable and largely unavoidable.
The over-the-counter category was supposed to break that. It has not, yet. Roughly 76% of people with measurable hearing loss use no device, which is an enormous untapped population, but around 23% of direct channel purchasers abandon their device. Self-fitting turns out to be genuinely difficult, and the professional service the channel removes is a larger part of the outcome than the price comparison suggested.
"Everyone assumed the barrier was price. We interviewed abandoners and the barrier was that it sounded wrong and nobody was there to change it. That is a service problem wearing a pricing costume."
Director, Hearing Health and Medical Devices Practice · MMA Medical Devices and

Market Trends

Direct Channels Reach Losses That Never Saw A Clinic

Around 76% of people with measurable hearing loss use no device, and most of that population never presented to an audiologist in the first place. Direct-to-consumer and over-the-counter devices grow at 12.0% against 8.0% for the market by reaching mild and moderate losses at a price point and a purchase route that avoids clinical gatekeeping. Abandonment near 23% is the qualifier: reach has been proven and retention has not. Self-fitting proves harder than the regulatory framework assumed, since a first-time wearer cannot tell a badly configured device from normal amplified hearing. Hybrid models are where the category is now heading.
Market Impact: Some 76% remain untreated
Manufacturers Compete With Their Own Retail Customers

Roughly 41% of fitting outlets are owned by the manufacturers supplying the industry, which secures distribution and creates a permanent conflict with the independent audiologists who still fit the remainder. Independents respond by favouring the manufacturers who do not compete with them, which is a shrinking group. The dynamic has pushed consolidation further rather than resolving it, and it leaves the industry unusually exposed to any channel that bypasses fitting entirely. Holding both positions halfway is the worst available outcome, and several groups have arrived there by default. The decision is strategic rather than incremental.
Market Impact: Cycle averages 6 years

Market Opportunities and Growth Drivers

Population Ageing Adds Candidates Faster Than Adoption

Age-related hearing loss rises steeply beyond sixty-five and the affected cohorts are expanding across every high-income country and across China simultaneously. That growth is mechanical and it does not reverse. Since roughly 76% of people with measurable loss currently use no device, the addressable population grows even where adoption rates stay flat, which is what makes this market unusually predictable compared with most medical device categories over a ten-year horizon. Chinese adoption in particular sits far below Western levels against the largest affected population anywhere. Improvement from that base moves global volume considerably.
Market Impact: Abandonment now reaches 23%

Connected Features Shorten A Stretched Replacement Cycle

Replacement has averaged around six years, considerably longer than the acoustics alone would justify, because a working device with adequate sound gave a wearer no reason to return. Rechargeable batteries, direct phone streaming, and app-based adjustment give reasons that have nothing to do with hearing performance. Manufacturers gain replacement volume from features that are effectively consumer electronics, which is also precisely how consumer electronics companies enter the category. Competing on those features means fighting on ground where hearing manufacturers hold no advantage whatever. Industrial design and brand both favour the entrant rather than the incumbent.
Market Impact: Device is 28% of price

Market Restraints and Challenges

Self-Fitting Abandonment Undermines The Direct Channel Case

Roughly 23% of direct channel purchasers stop using their device, and the root cause is that self-fitting is harder than the regulatory framework assumed: a first-time wearer cannot easily distinguish a poorly configured device from the normal strangeness of amplified hearing. Commercial impact is a category proving reach without proving retention. Mitigation runs through guided remote fitting, structured acclimatisation programmes, and hybrid models pairing a low-cost device with limited professional support. Reach in this channel has been proven and retention has not, which is the whole question. Returns and warranty claims cost more than guided fitting would.
Market Impact: Direct channel growing at 12.0%

Service Cost Rather Than Device Cost Blocks Adoption

The device accounts for roughly 28% of what a fitted patient pays, so cutting device cost addresses a minority of the affordability obstacle while leaving audiologist time untouched. The root cause is that professional fitting is labour-intensive and the labour is scarce. Commercial impact is that price competition on devices barely moves the 76% untreated population. Mitigation runs through remote fitting, tiered service models, and technician-delivered fitting under audiologist supervision. Around 76% of measurable loss goes untreated, and that population responds to total cost rather than device price. Audiologist wages also rise faster than device costs fall.
Market Impact: Manufacturers own 41% of outlets
4 additional market trends, 3 additional growth drivers, and 2 additional restraints and challenges are covered in the full report. Contact sales@marketmindsadvisory.com to access the complete intelligence.

Segment CAGR and Growth Architecture

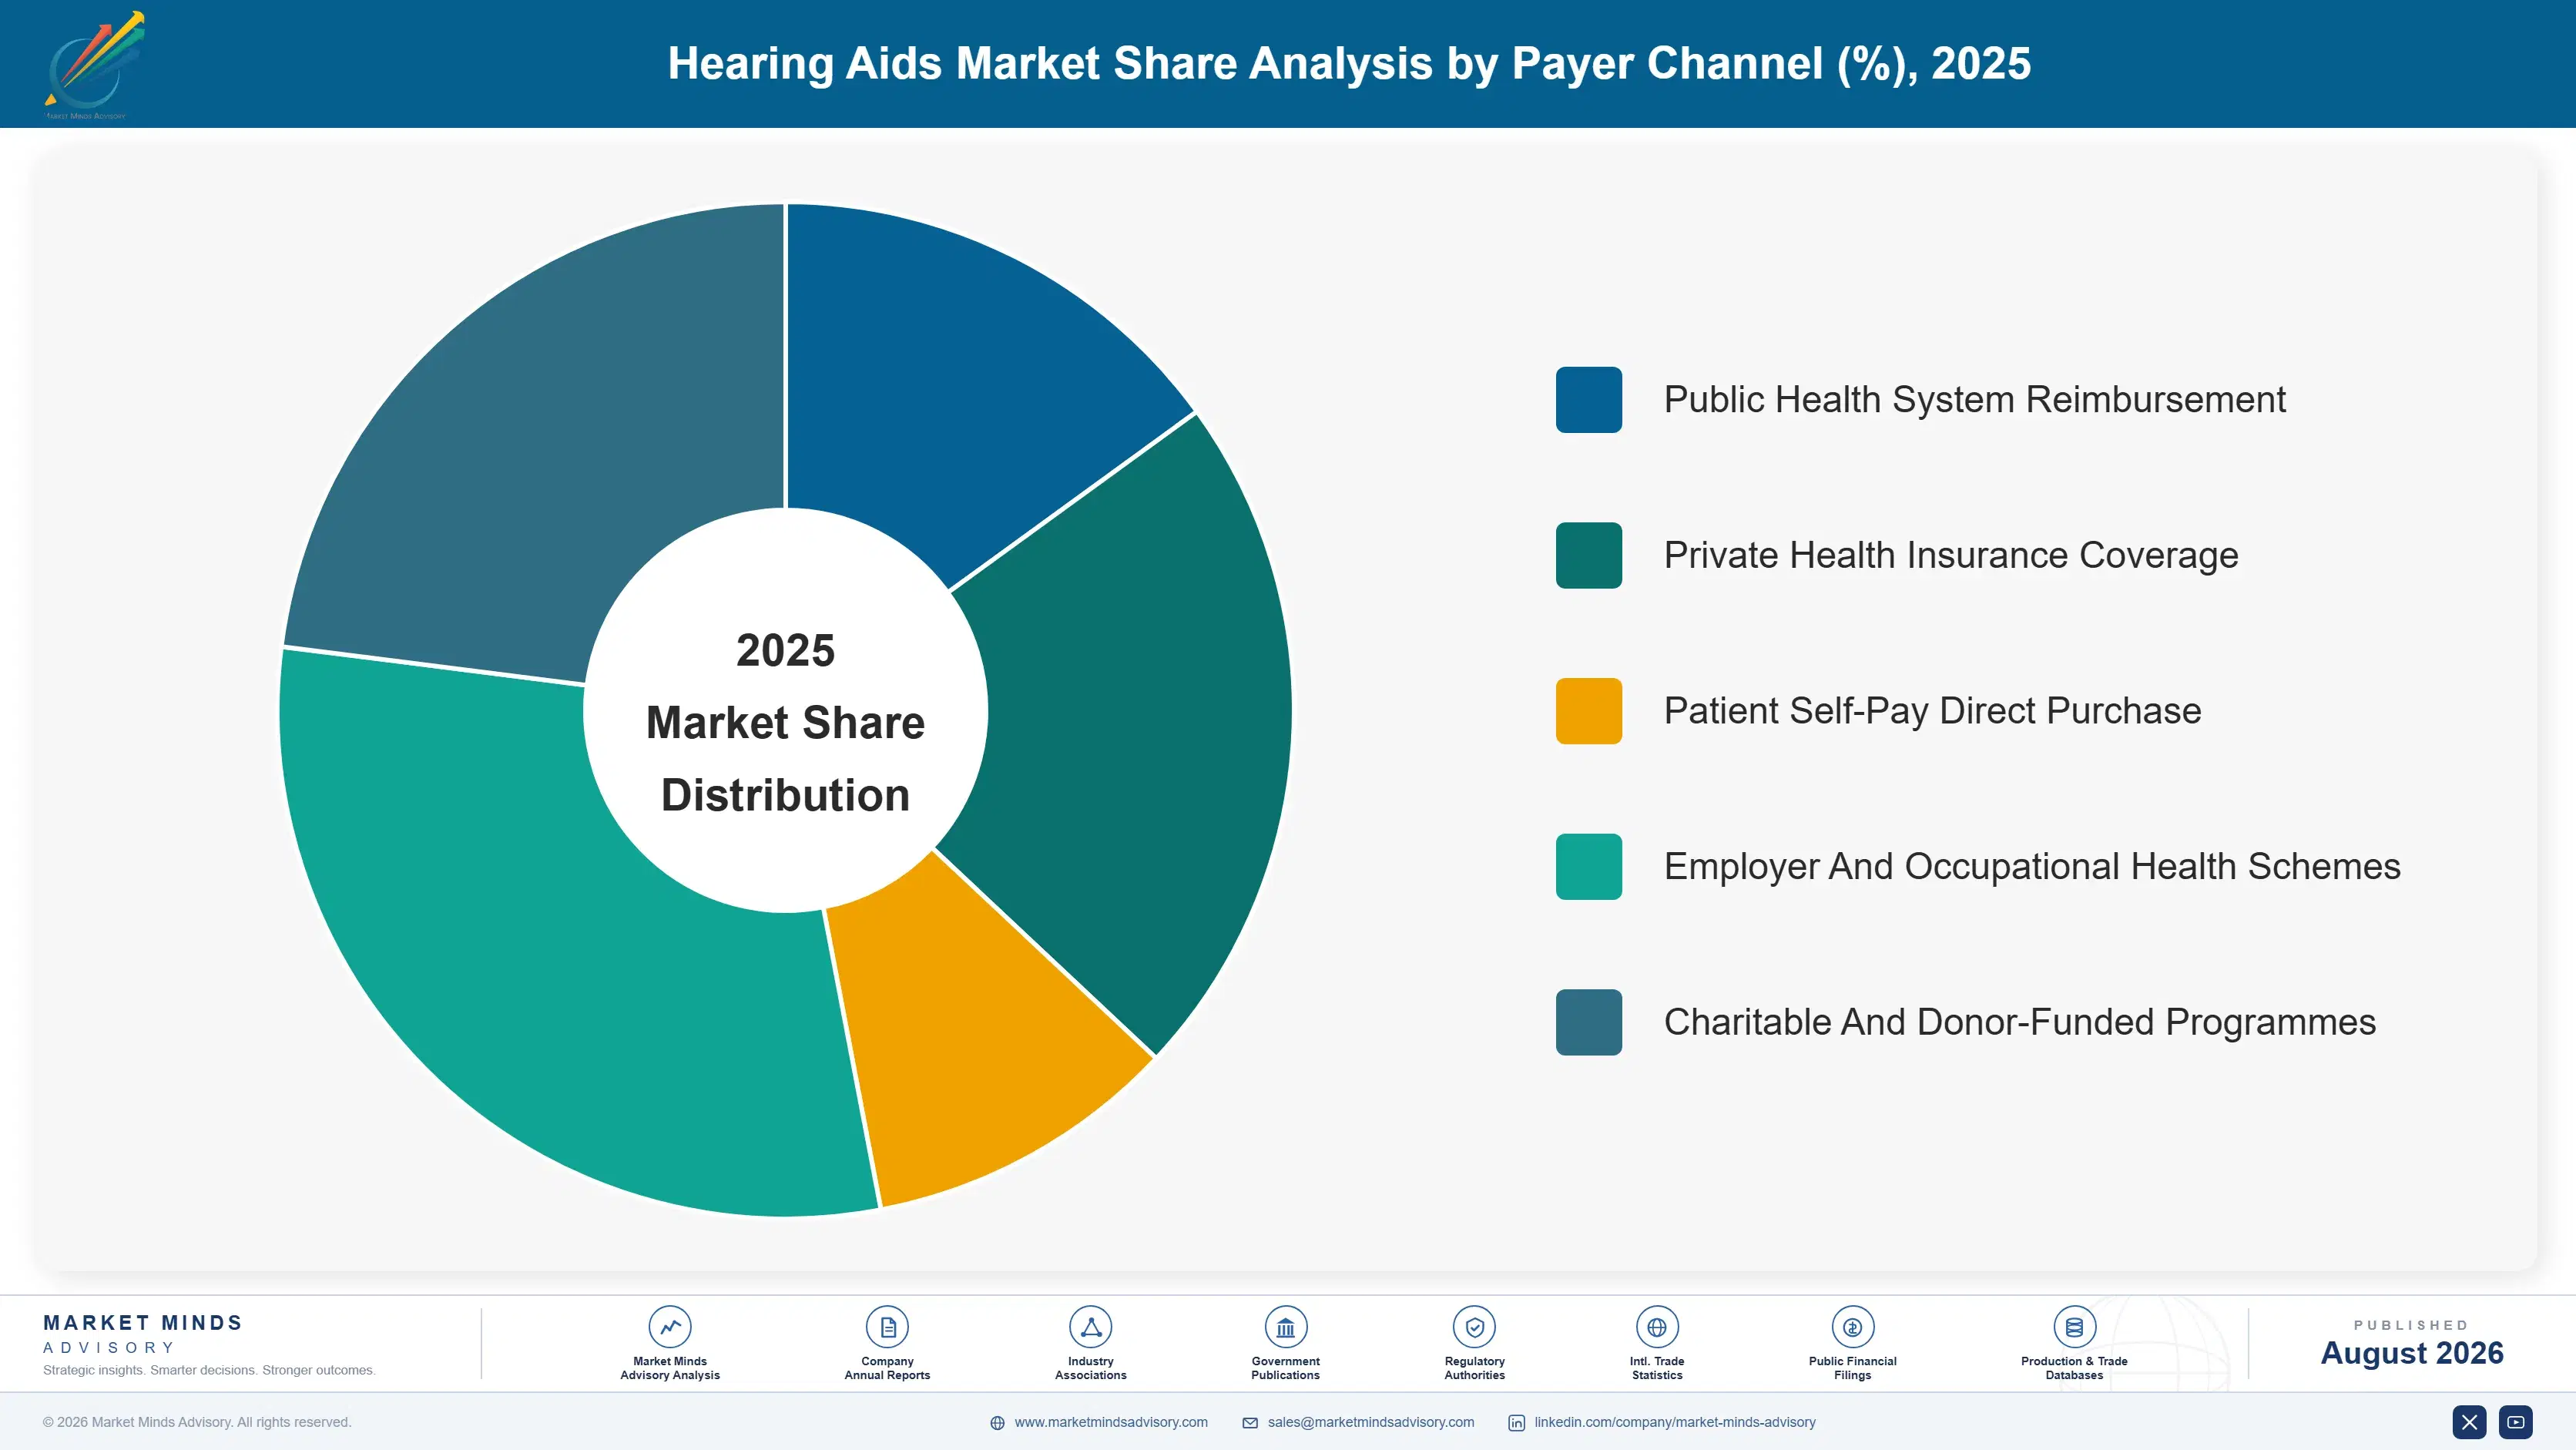
Segmentation follows device form and fitting route together, because those two things determine the clinical pathway required, who ends up capturing the patient relationship, and which price point and channel each product actually reaches. Fitting route decides who owns that relationship, which is what makes severity of loss and end-user age considerably weaker primary dimensions here.
hearing-aids-market-market-share-analysis-1787301081157

Direct-To-Consumer And Over-The-Counter Devices

The fastest route at 12.0%, exactly 1.50 times the market rate, and the only one reaching people who never presented to an audiologist. Roughly 76% of those with measurable loss use no device, and most of that population never entered the clinical pathway rather than declining it on price. Abandonment near 23% is the unresolved problem, since self-fitting proves harder than the regulatory framework assumed. Hybrid models pairing a low-cost device with limited remote professional support are where the category is now heading. Chinese manufacturers and consumer electronics companies both compete here on terms favouring neither established brand nor audiological expertise. Price and convenience decide, and no clinical relationship defends an incumbent at all.
CAGR 12.0%

Receiver-In-Canal Prescription Devices

Second fastest at 9.0% and the dominant prescription form, having displaced conventional behind-the-ear devices across most fittings because the receiver sits in the canal while electronics stay behind the ear. That geometry gives better sound, less occlusion, and a smaller visible profile at once, which addresses the cosmetic objection that keeps many candidates out of clinics. Rechargeable and connected variants are shortening the six-year replacement cycle. Fitting still requires professional assessment and real-ear verification, which anchors the category firmly inside clinics. Roughly 41% of the outlets doing that fitting are owned by the manufacturers supplying them. European reimbursement tendering nonetheless compresses pricing steadily across this form despite its strong clinical position.
CAGR 9.0%
Full segment breakdown across 5 segments available in the complete report.

Regional Architecture and Country Demand Map

East Asia leads at 29% on Chinese and Japanese ageing populations combined with substantial domestic manufacturing capacity. Western Europe follows on reimbursement depth, ahead of North America. South Asia and Pacific grows fastest as Indian screening and access expand. Channel structure differs sharply between these regions.

East Asia

Twenty-nine percent, the largest share, and demographics combined with manufacturing capacity explain it rather than adoption rates. Japan has among the oldest populations anywhere and China has the largest absolute number of people with hearing loss on earth, though Chinese adoption remains far below Western levels. Domestic Chinese manufacturers supply direct channel devices at prices Western brands cannot match, and export substantial volume. Growth at 9.0% runs above the market rate, driven by Chinese adoption improving from a low base rather than by demographics alone. Manufacturer-owned retail is far less developed here than in Europe, so distribution runs through hospitals and independent outlets. Direct channel devices are growing quickly on affordability across Chinese secondary cities.
Share: 29% | CAGR: 9.0% (2026 to 2036)

Western Europe

Reimbursement depth rather than population size carries this 25%. German, French, Nordic, and Dutch systems fund fitted hearing aids through defined benefits, which produces adoption rates well above the global picture and correspondingly disciplined pricing through tendering and reference schemes. Manufacturer-owned retail is most developed here, and independent audiologists have consolidated defensively in response. Growth at 6.4% is the slowest of any region, reflecting mature adoption and persistent reimbursement pressure rather than any weakness in demand. Independent audiologists have consolidated defensively in response to that integration, and several now contract preferentially with unintegrated suppliers. Direct channel volume remains small because reimbursement makes professional fitting affordable. Adoption rates are the highest anywhere.
Share: 25% | CAGR: 6.4% (2026 to 2036)
Regional intelligence for 5 additional markets available in the complete report: North America, South Asia and Pacific, Latin America, Middle East and Africa, Eastern Europe. Contact sales@marketmindsadvisory.com.
hearing-aids-market-country-cagr-analysis-1787301081671

Owning the Patient, Not the Chip

The device is roughly 28% of what a fitted patient pays, manufacturers own about 41% of outlets, some 76% of measurable loss goes untreated, and 23% of direct purchasers abandon. Value comes from fixing retention, from tiering service cost, and from choosing channel position deliberately. The patient relationship rather than the device decides most outcomes here.

Fix Retention Before Chasing Direct Channel Volume

Roughly 23% of direct channel purchasers abandon their device, and the reason is that self-fitting is genuinely difficult rather than that the product is inadequate. A first-time wearer cannot distinguish a badly configured device from the ordinary strangeness of amplified hearing. Guided remote fitting and structured acclimatisation cost far less than the returns, warranty claims, and reputational damage abandonment produces. Reach in this channel is proven; retention is the unsolved half and it decides whether the category matters. Hybrid models pairing a low-cost device with limited professional support are where the category is heading.
Market Impact: Abandonment currently runs near 23% of all purchasers

Attack Service Cost Rather Than Device Cost

The device carries roughly 28% of what a fitted patient pays, so competing on device price addresses a minority of the affordability problem while leaving the audiologist time that dominates it entirely untouched. Remote fitting, technician-delivered service under audiologist supervision, and tiered service packages all reduce the larger number. Around 76% of measurable loss goes untreated, and that population responds to the total cost of getting fitted rather than to the price on a device. Audiologist wages rise faster than device costs fall, which makes this the cost that actually matters.
Market Impact: Device is only 28% of the patient price

Decide Whether To Own Retail Or Serve It

Manufacturers own roughly 41% of fitting outlets, which secures distribution and permanently compromises relationships with the independent audiologists fitting the rest. Independents increasingly favour suppliers who do not compete with them, and that group keeps shrinking. Holding both positions halfway is the worst outcome available: too integrated to be trusted by independents, too small in retail to control access. The decision is strategic rather than incremental and most groups have made it by default. Independents still fit most devices across several major markets, which makes their supply preference commercially material.
Market Impact: Manufacturers now own about 41% of fitting outlets

Use Connected Features To Shorten Replacement

Replacement averages around six years, considerably longer than acoustic performance justifies, because a device that still works gives a wearer no reason to return to a clinic. Rechargeable batteries, direct phone streaming, and app adjustment create reasons unrelated to hearing performance and pull replacement forward. The same features are exactly how consumer electronics companies enter this category, so the strategy carries a cost: it competes on ground where hearing manufacturers hold no advantage. Around 76% of measurable loss remains untreated, so replacement volume is not the only route to growth.
Market Impact: Replacement cycle currently averages about 6 full years

Who Controls the Margin Pool

Concentration is very high at 84% across the top five measured on units shipped, and it rests on two barriers rather than one. Acoustic signal processing and custom low-power chip development require sustained research spending that a small manufacturer cannot fund. Ownership of roughly 41% of fitting outlets then controls access to the patients. The leader to challenger gap is wide, and challengers have historically arrived through acquisition rather than through organic growth.
Competitive activity concentrates on three fronts. Signal processing in noisy environments is the first, which is where wearers actually judge a device and where differentiation genuinely exists. Retail network ownership is the second, since it determines which brand gets fitted regardless of comparative performance. And connected feature parity is the third, increasingly a qualifying requirement rather than a differentiator.

Pressure arrives from two directions. Consumer electronics companies are adding amplification to earbuds people already own and wear without stigma. And Chinese manufacturers supply direct channel devices at prices Western brands cannot approach. Both pressures land in the direct channel, where no clinical relationship defends anybody at all. Neither touches premium prescription fitting yet.

Rankings move on retail acquisitions rather than on product launches.
hearing-aids-market-company-positioning-matrix-1787301082193

Competitive Moat and Risk Dimensions

SONOVA

Moat: Retail scale and processing research

Owning one of the largest fitting networks anywhere alongside sustained investment in acoustic signal processing gives control of both the patient relationship and the product that relationship dispenses. Independents cannot easily switch a patient away from a device fitted in an owned clinic. Building either capability takes years, and building both together has required more than a decade of acquisitions.
SONOVA

Risk: Owned retail alienates independent channels

A manufacturer that owns fitting outlets competes directly with the independent audiologists who still fit most devices in several markets, and those independents increasingly favour suppliers who do not. The conflict has no resolution short of choosing one side. Retail scale that secures distribution simultaneously closes access to a channel the company still needs.
DEMANT

Moat: Diagnostic and device breadth

Supplying audiometric diagnostic equipment alongside hearing devices puts a manufacturer inside the clinical workflow before any device decision is taken, which shapes fitting preference in ways promotion cannot. Breadth across hearing devices, diagnostics, and hearing implants also spreads research cost across more revenue than a device-only competitor can manage. Both positions took decades to assemble.
DEMANT

Risk: Clinical breadth misses direct channels

Capabilities built around professional clinical workflow contribute almost nothing in a direct-to-consumer channel growing at half again the market rate, where the purchase never involves a clinician at all. Diagnostic integration is an advantage only where diagnosis happens professionally. The strongest asset in one channel is simply irrelevant in the fastest-growing one.

Key Players

Sonova
Demant
WS Audiology
GN Store Nord
Starkey

Others

Amplifon
Eargo
Cochlear
MED-EL
Rion
Audina Hearing Instruments
IntriCon
Zounds Hearing
Sound World Solutions
Nuheara
Jinghao Medical
Austar Hearing
Horentek
Arphi Electronics
Microson

Recent Developments

FEBRUARY 2025

Manufacturer adds guided remote fitting to direct channel devices

A hearing device manufacturer introduced guided remote fitting sessions with hearing professionals for its direct channel products, addressing abandonment rates that had run well above professionally fitted equivalents. The addition was organic service development rather than any acquisition, joint venture, or partnership with a teleaudiology provider.
Signal: Direct channel retention is a service problem, and removing service entirely created it in the first place.
MAY 2025

Consumer electronics maker adds amplification to mainstream earbuds

A consumer electronics manufacturer enabled hearing amplification features on earbuds already owned by a large installed base, reaching people with mild loss who had never considered a hearing device. The change was a software feature release rather than any acquisition, joint venture, or arrangement with a hearing manufacturer.
Signal: Devices people already wear without stigma reach a population clinics have never touched or ever will.
SEPTEMBER 2025

Independent audiologist group signs supply deal excluding integrated makers

A network of independent audiology clinics contracted preferential supply with manufacturers holding no owned retail presence, citing direct competition from integrated suppliers for its patients. The arrangement was a commercial supply agreement rather than any acquisition, joint venture, or equity investment between the parties. Several manufacturers were excluded entirely.
Signal: Independents are now organising deliberately against the vertical integration that secured distribution for their own suppliers

Chips, Acoustics and Clinic Labour

For manufacturers, custom low-power signal processing chips carry roughly 23% of device cost of goods sold, microphones and receivers about 19%, shell and custom moulding near 14%, batteries and rechargeable assemblies around 11%, and assembly, test, and packaging the balance. For the vertically integrated groups, clinic labour and property across owned retail networks exceeds device manufacturing cost by a wide margin.
Semiconductor allocation through 2021 and 2022 constrained the custom low-power chips these devices depend on, and several listed hearing manufacturers disclosed component shortages and extended lead times in annual filings covering those years. Availability has normalised. Audiologist wages then rose persistently through the recovery on a labour shortage that has not eased, and that cost sits in the larger part of the delivered price. Wage pressure has not eased since.

The competitive disadvantage mechanism runs through clinic labour rather than through component sourcing. A vertically integrated group carries audiologist wages across an owned network, and those wages rise faster than device costs fall, so integration that secures distribution also imports the fastest-growing cost in the industry. Manufacturers selling only devices avoid it entirely and give up the patient relationship in exchange.
hearing-aids-market-cost-volatility-analysis-1787301082388

Deliver fitting through technicians under audiologist supervision

Audiologist wages rise faster than device costs fall, and they sit inside the majority of what a patient actually pays for a fitting, so clinic labour is the cost that matters most to any vertically integrated group. Trained technicians performing the routine fitting steps under audiologist supervision reduce it without removing professional oversight entirely.

Use remote follow-up instead of clinic appointments

Follow-up appointments consume clinic capacity and audiologist time for adjustments that remote software can now deliver adequately in most cases. Shifting routine follow-up out of the clinic frees capacity for the initial fittings that generate revenue. Wearers generally prefer it, and the capability was proven when clinic access collapsed rather than being introduced deliberately afterward.

Design shared chip platforms across product families

Custom low-power signal processing carries roughly 23% of device cost of goods sold and requires development spending only a few companies can fund at all. Platforms shared across prescription, direct channel, and value product families spread that investment across far more units. The engineering discipline is harder than it sounds, since direct channel devices need different processing behaviour entirely.

Portfolio Architecture for Margin Defence

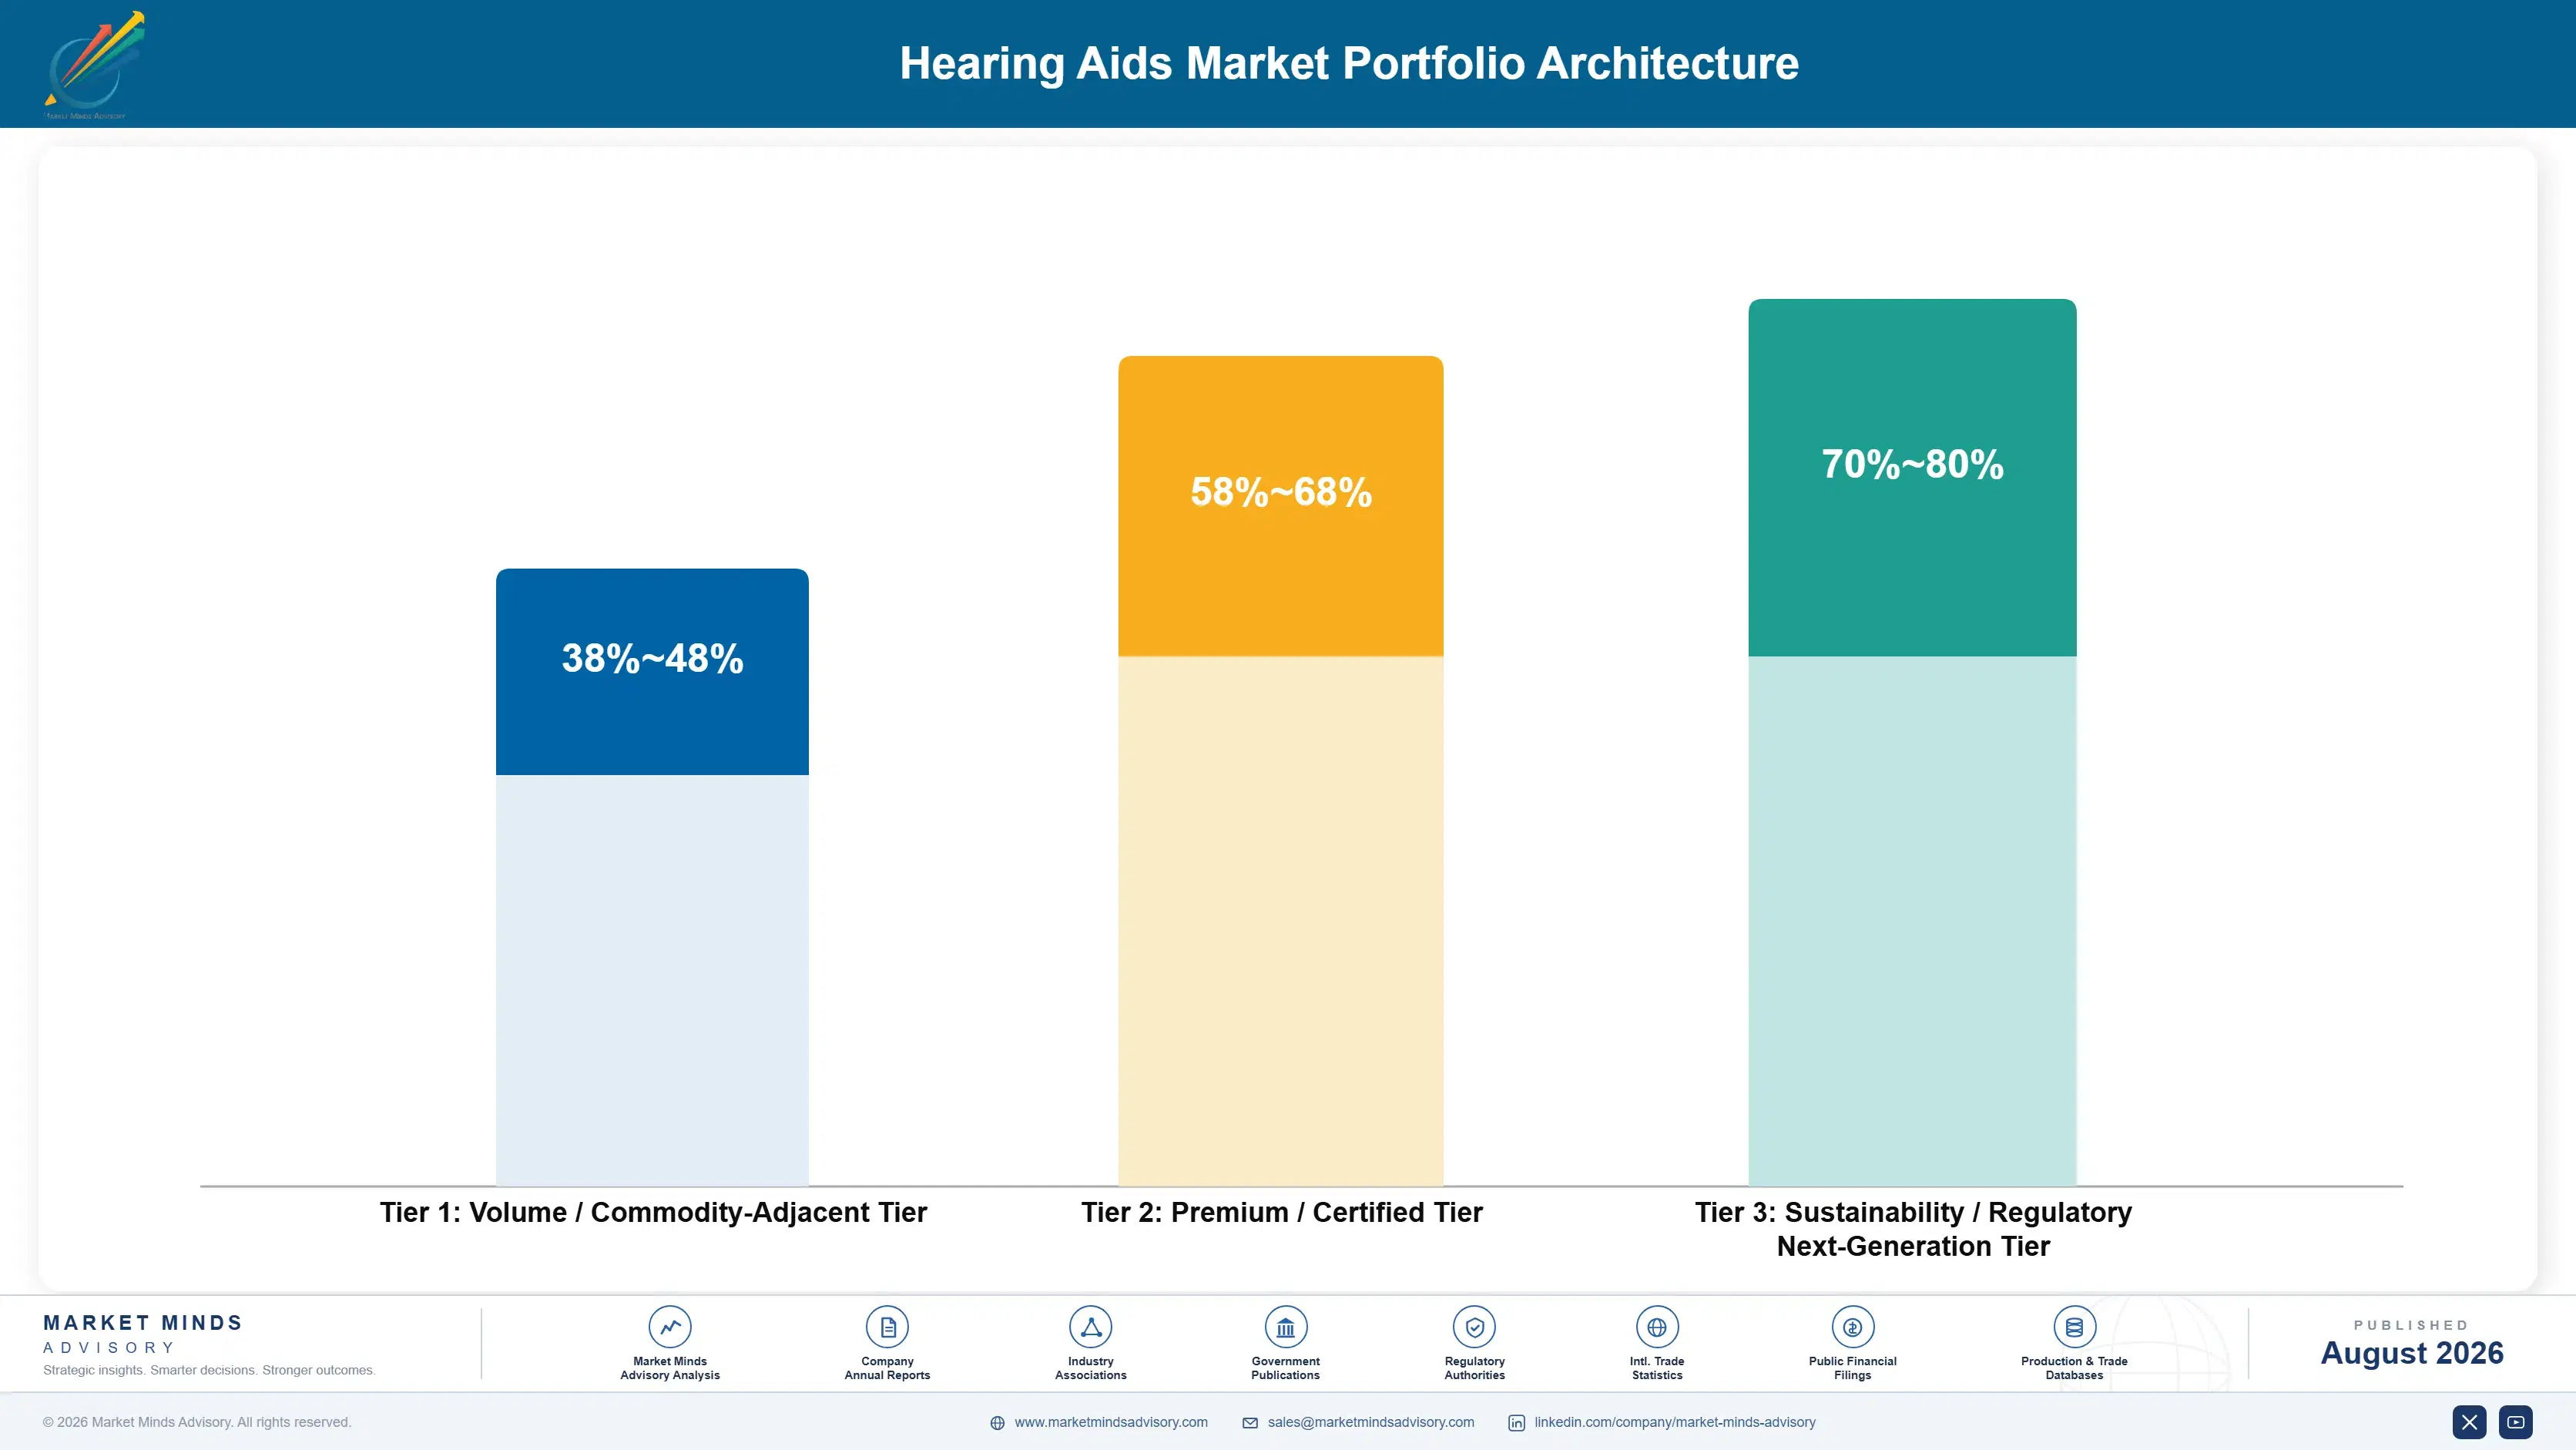
Three tiers describe this business and the spread is set by fitting route rather than by acoustic capability. Direct channel and value prescription devices sit at the bottom, competing on price where no clinical relationship defends anybody. Standard prescription fittings occupy the middle, protected by the professional relationship. Premium custom and connected devices sit at the top, where signal processing in noise genuinely differentiates and patients pay for it.
The tension is that the growth is in the tier with the weakest defences. Direct channel volume grows at 12.0% against 8.0% for the market and competes against Chinese manufacturers and consumer electronics companies on price and convenience, neither of which favours an incumbent. Premium prescription holds the margin and grows slowly. Almost every manufacturer is trying to hold both positions with one organisation.

High-value pools concentrate where hearing in noise is the problem being solved. Complex losses and demanding listening environments both require processing that cheaper devices cannot deliver, and patients notice immediately. Complex and asymmetric losses pool value similarly, because cheaper devices simply cannot process them adequately. Both pools sit firmly inside the professional channel.

Volume / Commodity-Adjacent Tier

Direct channel, over-the-counter, and value prescription devices competing on price where no clinical relationship defends an incumbent. Chinese manufacturers and consumer electronics companies both compete here on terms that favour neither established brand nor audiological expertise.
Gross Margin: 38-48%

Premium / Certified Tier

Standard prescription behind-the-ear and receiver-in-canal fittings delivered through professional channels. The audiologist relationship rather than any product attribute defends this position, and roughly 41% of outlets are manufacturer owned. European reimbursement tendering compresses pricing steadily.
Gross Margin: 58-68%

Sustainability / Regulatory / Next-Generation Tier

Premium custom, connected, and complex-loss devices where signal processing in noisy environments genuinely differentiates and wearers notice immediately. Best margin by a clear distance, and defended by research spending very few companies can fund.
Gross Margin: 70-80%
hearing-aids-market-portfolio-architecture-1787301082889

High-value Sub-segments and Strategic Watch-out

Direct And Over-The-Counter Channel

Fastest growth at 12.0%, exactly 1.50 times the market rate, reaching the roughly 76% of measurable loss that never entered a clinic. Abandonment near 23% is the unsolved half, and reach without retention is not yet a business. Guided remote fitting is the emerging answer.
Gross Margin: 38-48%

Premium Connected Prescription Devices

Best margin position, defended by signal processing in noise that cheaper devices cannot deliver and wearers immediately notice. Connected features are also shortening a six-year replacement cycle that acoustics alone never justified. Research spending here is beyond most competitors. Wearers judge devices in noise above all.
Gross Margin: 70-80%

Standard Prescription Fitting Volume

The volume core, defended by the audiologist relationship rather than by any product attribute at all. Reimbursement tendering in European systems compresses pricing steadily, and manufacturer-owned retail secures the channel around it. Fitting channel control decides which brand gets dispensed. Product comparison rarely happens at all.
Gross Margin: 58-68%

Consumer Electronics Encroachment

The strategic watch-out, since amplification features on earbuds people already own reach mild loss without any stigma or clinic visit. Hearing manufacturers hold no advantage whatever on the ground that competition is fought on. Stigma rather than price kept that population away. Processing in noise is the defensible response.
Gross Margin: 38-48%

Fittings, Follow-Up and Replacement

Revenue arrives as a fitting event followed by a long quiet period, since replacement averages around six years and the device generates nothing in between. That makes the initial fitting decision disproportionately valuable and explains why controlling the fitting channel matters more here than in almost any comparable device category. Connected features that pull replacement forward change that arithmetic more than any acoustic improvement has managed.
Stickiness runs through the audiologist rather than through the wearer. A patient fitted in a clinic returns to that clinic, accepts what is recommended, and rarely compares brands at all, which is why owning roughly 41% of outlets was worth the capital it consumed. Direct channel purchasers stick not at all, comparing on price and features at every purchase, and around 23% stop using the device entirely.

Buyer profiles shifted as the direct channel opened and consumer electronics arrived. The earlier buyer was an older patient referred by a physician into a clinical pathway. The current population increasingly includes younger people with mild loss buying amplification features on a device they already own for other reasons. Those buyers compare features and price at every purchase rather than accepting a recommendation.
hearing-aids-market-end-use-penetration-index-1787301083380

What We Would Tell a Board

These are among the four positions where our research anticipates prominent divergence between winners and laggards over the coming forecast period. Each is grounded in the demand model, the regulatory perimeter, and the announced capacity pipeline.
01 / DIRECT CHANNEL RETENTION

Reach is proven; retention is the unsolved half

Roughly 23% of direct channel purchasers abandon their device, and the cause is that self-fitting is genuinely difficult rather than that the hardware is inadequate for the loss it addresses. A first-time wearer cannot distinguish a badly configured device from the ordinary strangeness of amplified hearing, and in this channel nobody is present to correct it. Guided remote fitting and structured acclimatisation programmes cost far less than the returns, warranty claims, and reputational damage that abandonment at this rate produces.
02 / SERVICE COST ATTACK

Device price addresses the smaller part of the problem

The device itself carries roughly 28% of what a fitted patient pays, so competing on device price attacks only a minority of the affordability obstacle while leaving audiologist time, which dominates it, entirely untouched. Remote fitting, technician-delivered service under audiologist supervision, and tiered service packages all reduce the number that actually matters here. Around 76% of measurable loss goes untreated, and that population responds to the total cost of getting fitted rather than to the price printed on a device.
03 / CHANNEL POSITION CHOICE

Own retail properly or serve independents credibly

Manufacturers now own roughly 41% of all fitting outlets, which secures distribution while permanently compromising relationships with the independent audiologists who still fit most devices in several major markets. Independents increasingly favour suppliers who do not compete with them for the same patients, and that group of suppliers keeps shrinking every single year. Holding both positions halfway is the worst available outcome by some distance: too integrated for the independents to trust, and simultaneously too small in retail to control access.
04 / CONSUMER ELECTRONICS RESPONSE

Amplification on earbuds is not a hearing aid problem

Consumer electronics companies adding amplification to earbuds already owned reach people with mild loss who would never have visited a clinic at all, and stigma rather than price kept that population away from devices. Hearing manufacturers hold no advantage at all on industrial design, distribution, or brand in that contest, and competing there directly means fighting on deeply unfavourable ground. The defensible response is processing performance in noisy listening environments, where the technical gap against consumer devices remains genuine and immediately audible.

Engagement Snapshot From the Field

A live engagement with an industry participant carrying material or product regulatory and market exposure ahead of a defining policy shift, showing how our research translates into a defensible multi-year portfolio strategy.
MARKET MINDS ADVISORY · CLIENT ENGAGEMENT SUMMARY
Hearing Aids Producer Strategic Portfolio Review and Transition Roadmap 2026·Investment Scenario on Hearing Aids Exposure Evaluation 2025-26
CLIENT PROFILE
A hearing device manufacturer with approximately 640 million dollars in annual revenue (client-reported, unverified by MMA), selling prescription devices through independent audiologists across two regions and holding a small owned retail presence. A direct channel product had launched two years earlier, unit sales were growing, and returns and warranty claims on that line had risen faster than the revenue behind them.
STRATEGIC CHALLENGE
Management read the direct channel returns as a product quality problem and proposed a hardware revision with a new receiver assembly. The board wanted independent evidence on why devices were coming back before approving development spending that would consume most of the line's contribution for two years. Returns had never been analysed by fault.
MMA APPROACH
We analysed returned units against technical fault records, separating genuine hardware failures from devices returned in working condition. Purchasers who had stopped using devices were interviewed on their reasons and on their fitting experience. Outcomes were compared against the client's professionally fitted equivalents, and independent audiologist attitudes toward the client's retail presence were surveyed separately.
KEY FINDINGS
  1. The substantial majority of returned direct channel devices carried no detectable technical fault, and most had been returned within the initial acclimatisation window.
  2. Abandoning purchasers consistently described the sound as wrong rather than inadequate, and none had received guided assistance in configuring the device. Nobody had been available.
  3. Professionally fitted equivalents using the same acoustic platform showed abandonment rates a fraction of the direct channel line across the same period.
  4. Independent audiologists reported growing reluctance toward suppliers with owned retail, and the client's small presence was already affecting fitting preference. Supply preference had already shifted.
CLIENT PROFILE
A hearing device manufacturer with approximately 640 million dollars in annual revenue (client-reported, unverified by MMA), selling prescription devices through independent audiologists across two regions and holding a small owned retail presence. A direct channel product had launched two years earlier, unit sales were growing, and returns and warranty claims on that line had risen faster than the revenue behind them.
STRATEGIC CHALLENGE
Management read the direct channel returns as a product quality problem and proposed a hardware revision with a new receiver assembly. The board wanted independent evidence on why devices were coming back before approving development spending that would consume most of the line's contribution for two years. Returns had never been analysed by fault.
MMA APPROACH
We analysed returned units against technical fault records, separating genuine hardware failures from devices returned in working condition. Purchasers who had stopped using devices were interviewed on their reasons and on their fitting experience. Outcomes were compared against the client's professionally fitted equivalents, and independent audiologist attitudes toward the client's retail presence were surveyed separately.
KEY FINDINGS
  1. The substantial majority of returned direct channel devices carried no detectable technical fault, and most had been returned within the initial acclimatisation window.
  2. Abandoning purchasers consistently described the sound as wrong rather than inadequate, and none had received guided assistance in configuring the device. Nobody had been available.
  3. Professionally fitted equivalents using the same acoustic platform showed abandonment rates a fraction of the direct channel line across the same period.
  4. Independent audiologists reported growing reluctance toward suppliers with owned retail, and the client's small presence was already affecting fitting preference. Supply preference had already shifted.
RECOMMENDED STRATEGY
Phase 1: Phase 1 (months one to six): halt the hardware revision, introduce guided remote fitting sessions across the direct channel line immediately. Phase 2: Phase 2 (months six to eighteen): build structured acclimatisation programmes and measure abandonment against professionally fitted benchmarks continuously. across both regions. Phase 3: Phase 3 (months eighteen to thirty-six): resolve the retail position deliberately rather than holding a small presence that unsettles independents.
OUTCOME
The hardware revision was cancelled. Guided remote fitting was introduced within two quarters and direct channel returns fell materially against the prior year, while the retail question was taken to the board as an explicit strategic decision rather than left to drift (client-reported, unverified by MMA).

Frequently Asked Questions

Foundational context covering the market sizes, CAGR, scope, country, region and competition that inform every finding below. This section is provided to cover basics and most often pre-purchase conversations, answered from the MMA Primary Research Dataset.

What is the current size of the Hearing Aids Market?

The market is valued at USD 12.8 billion in 2025, rising to USD 13.83 billion in 2026. Scope covers wearable hearing amplification devices, not cochlear implants, diagnostic equipment, or clinic service fees billed separately.

How large will the Hearing Aids Market be by 2036?

MMA forecasts USD 29.86 billion by 2036, an increase of USD 16.03 billion over the 2026 base. That represents an expansion multiple of 2.16 times across the forecast period.

What is the CAGR for the Hearing Aids Market 2026 to 2036?

The base case CAGR is 8.0%, with a bull case of 9.2% and a bear case of 6.8%. The historical rate from 2020 to 2025 was 6.8%, held back by clinic access disruption.

Which segment is growing fastest?

Direct-to-consumer and over-the-counter devices at 12.0%, exactly 1.50 times the market rate. They reach mild and moderate losses among the roughly 76% of affected people who never entered a clinic.

Who are the major companies in the Hearing Aids Market?

Sonova, Demant, WS Audiology, GN Store Nord, and Starkey lead on units shipped. The top five hold 84%, resting on acoustic signal processing capability and ownership of the retail fitting network.

Which country is growing fastest?

India at 10.4%, where newborn and school screening programmes combine with expanding audiology capacity. Adoption starts from a very low base, so affordable and direct channel devices dominate.

Report Segmentation Architecture

The full report scope spans multiple orthogonal segmentation dimensions, with cross-tabulated demand data provided for each dimension pair. Coverage extends further to regional breakdowns, trend trajectories, and the competitive detail needed to support segment-level decision-making.

By Device Form And Fitting Route

  • Receiver-In-Canal Prescription Devices
  • Behind-The-Ear Prescription Devices
  • Custom In-The-Ear And Completely-In-Canal Devices
  • Direct-To-Consumer And Over-The-Counter Devices
  • Bone Conduction And Single-Sided Deafness Devices

By Care Setting

  • Independent Audiology Clinics
  • Manufacturer-Owned Retail Networks
  • Hospital And Ear Nose Throat Departments
  • Optical And Pharmacy Retail Chains
  • Online And Remote Fitting Services

By Payer Channel

  • Public Health System Reimbursement
  • Private Health Insurance Coverage
  • Patient Self-Pay Direct Purchase
  • Employer And Occupational Health Schemes
  • Charitable And Donor-Funded Programmes

By Region

  • East Asia
  • Western Europe
  • North America
  • South Asia and Pacific
  • Latin America
  • Middle East and Africa
  • Eastern Europe

Scope, Methodology, and Coverage

Every figure in this report is reproducible from documented input assumptions. The scope below maps the historical period, the forecast horizon, the segmentation dimensions, and the countries covered, alongside the underlying primary and qualitative methodology.
Historical Period
2020 to 2025
Forecast Period
2026 to 2036
Base Year
2025 (USD billions; MMA Primary Research Dataset, August 2026)
Market Definition
This market comprises wearable hearing amplification devices intended for the treatment of hearing loss, measured at manufacturer revenue across all fitting routes and payer channels. Coverage spans behind-the-ear prescription devices, receiver-in-canal prescription devices, custom in-the-ear and completely-in-canal devices, direct-to-consumer and over-the-counter devices, and bone conduction and single-sided deafness devices. Cochlear implants and other surgically implanted hearing systems, personal sound amplification products not intended for hearing loss, audiometric and diagnostic equipment, assistive listening systems installed in rooms or venues, hearing aid accessories sold separately, and audiology clinic service fees billed independently of a device fall outside scope.
Quantitative Units
USD billions (current prices); device units shipped annually; average selling price by form and channel; adoption and abandonment rates
Segmentation Dimensions
By Device Form And Fitting Route; By Care Setting; By Payer Channel; By Region
Regions Covered
East Asia, Western Europe, North America, South Asia and Pacific, Latin America, Middle East and Africa, Eastern Europe
Countries Covered
China, Japan, South Korea, Germany, France, Netherlands, Denmark, Switzerland, United Kingdom, Italy, United States, Canada, India, Australia, Brazil, Mexico, Argentina, Saudi Arabia, United Arab Emirates, South Africa, Poland, Czechia, Hungary, and additional markets relevant to this sector
Key Companies Profiled
Sonova, Demant, WS Audiology, GN Store Nord, Starkey, Amplifon, Eargo, Cochlear, MED-EL, Rion, Audina Hearing Instruments, IntriCon, Zounds Hearing, Sound World Solutions, Nuheara, Jinghao Medical, Austar Hearing, Horentek, Arphi Electronics, Microson
Quantitative Methodology
Primary survey, n=3,800 respondents, Q4 2025, six countries; demand-side model with trade association cross-validation
Qualitative Methodology
47 expert interviews, Q4 2025; applied to validate demand model assumptions, identify emerging dynamics, and assess competitive positioning
Report Format
PDF and XLSX data workbook (Word format preview document)
Publisher
Market Minds Advisory
Report Code
MMA-2026-MED-623
Published
August 2026
Contact
sales@marketmindsadvisory.com | www.marketmindsadvisory.com

Purchase the full Hearing Aids Market Report (2026 to 2036).

The full report sizes hearing aids across five device forms and fitting routes, five care settings, five payer channels, and seven regions, with device value separated from the delivered price a patient actually pays. Direct channel abandonment is quantified against professionally fitted benchmarks, since reach without retention does not build a category. Manufacturer retail ownership is mapped by market against independent audiologist supply preference. Competitive profiling covers twenty companies on units shipped, and consumer electronics encroachment is assessed against the specific populations it actually reaches rather than against the whole market.
Device value separated from delivered price patients actually pay
Direct channel abandonment quantified against professionally fitted benchmarks
Manufacturer retail ownership mapped against independent supply preference
Consumer electronics encroachment assessed by population actually reached
Replacement cycle modelled against connected feature adoption rates
Untreated loss population sized by severity and market

Built For The People Who Decide

From boardroom strategy to bench-side execution, this report is read cover-to-cover by leaders shaping the next decade of their industry, turning demand scenarios, market dynamics and valuation benchmarks into decisions.
CXOs/ Presidents/ VPs/ Managers
M&A and Corporate Development
Strategy Teams and R&D Heads
Procurement and Product Directors
Regulatory and Compliance Leaders
Investor Relations and Equity Analysts