Market Minds Advisory
Healthcare IT Outsourcing Market

Healthcare IT Outsourcing Market: The Work Moves, The Liability Stays

Health systems outsource the work and keep the liability, which is why a single vendor outage in 2024 stopped cash flow across thousands of American hospitals and repriced every contract signed since.

Lead Analyst

Published

September 2026

Make Smarter Decisions with Customized Research Insights

Request a free sample report and evaluate market opportunities, growth trends, and competitive dynamics relevant to your business needs.

2025 MARKET VALUE$62.4BMarket Size 2025
2036 FORECAST VALUE$161.0BBase Case , 2026 to 2036
CAGR 2026 TO 20369.0 %Bull 10.2% / Bear 7.8%
INCREMENTAL OPPORTUNITY$93.0BNet 10- year value creation
EXPANSION MULTIPLE2.37x2036 value over 2026 base
Strategic Levers
M&A Pipeline
Regional Outlook
Country Rankings
Competitive Intelligence
Segmental Deep-dive
Call-Us : 91 93563 13602

Executive Snapshot and Market Trajectory

Outsourcing moves the work and not the accountability. A breach at a vendor appears under the health system's name in the federal disclosure list, and that asymmetry now shapes every contract negotiation in the market more than price does. Nothing else comes close, and every general counsel knows it.
North America takes 38% of value because American healthcare carries administrative complexity that exists nowhere else, while South Asia supplies most of the delivery capacity that serves it. Cybersecurity managed services grow at 13.5%, half again the market rate of 9.0%, after ransomware demonstrated that a vendor outage can stop provider cash flow nationally. Certified consultant headcount, not technology, is what vendors actually sell. Epic itself controls how many of them exist.
Concentration is low at 27% and the five leaders came from three different industries, which tells you the market has no settled shape. Interoperability mandates and information blocking rules created compliance workload nobody's internal team could absorb. Offshore labour arbitrage is narrowing in exactly the work that grows fastest, because protected health information cannot travel where the cheap capacity sits. Nearshore delivery is filling that gap expensively.
Market Definition
The market covers information technology services delivered to healthcare providers, payers and life sciences organisations by external suppliers under contract, including application management, electronic health record support, infrastructure and cloud managed services, cybersecurity operations, clinical data and interoperability services, revenue cycle IT operations and system implementation consulting. Software licensing, medical device servicing, clinical staffing and pure business process work such as medical coding are excluded. Internal IT departments fall outside scope.
Base Year Value
$62.4B in 2025 (MMA Primary Research Dataset, August 2026)
Forecast Period
2026 to 2036, eleven discrete annual values
CAGR
9.0% base case. Bull 10.2%. Bear 7.8%.
Fastest Growth Segment
Cybersecurity Managed Services: 13.5% CAGR
Fastest Growth Country
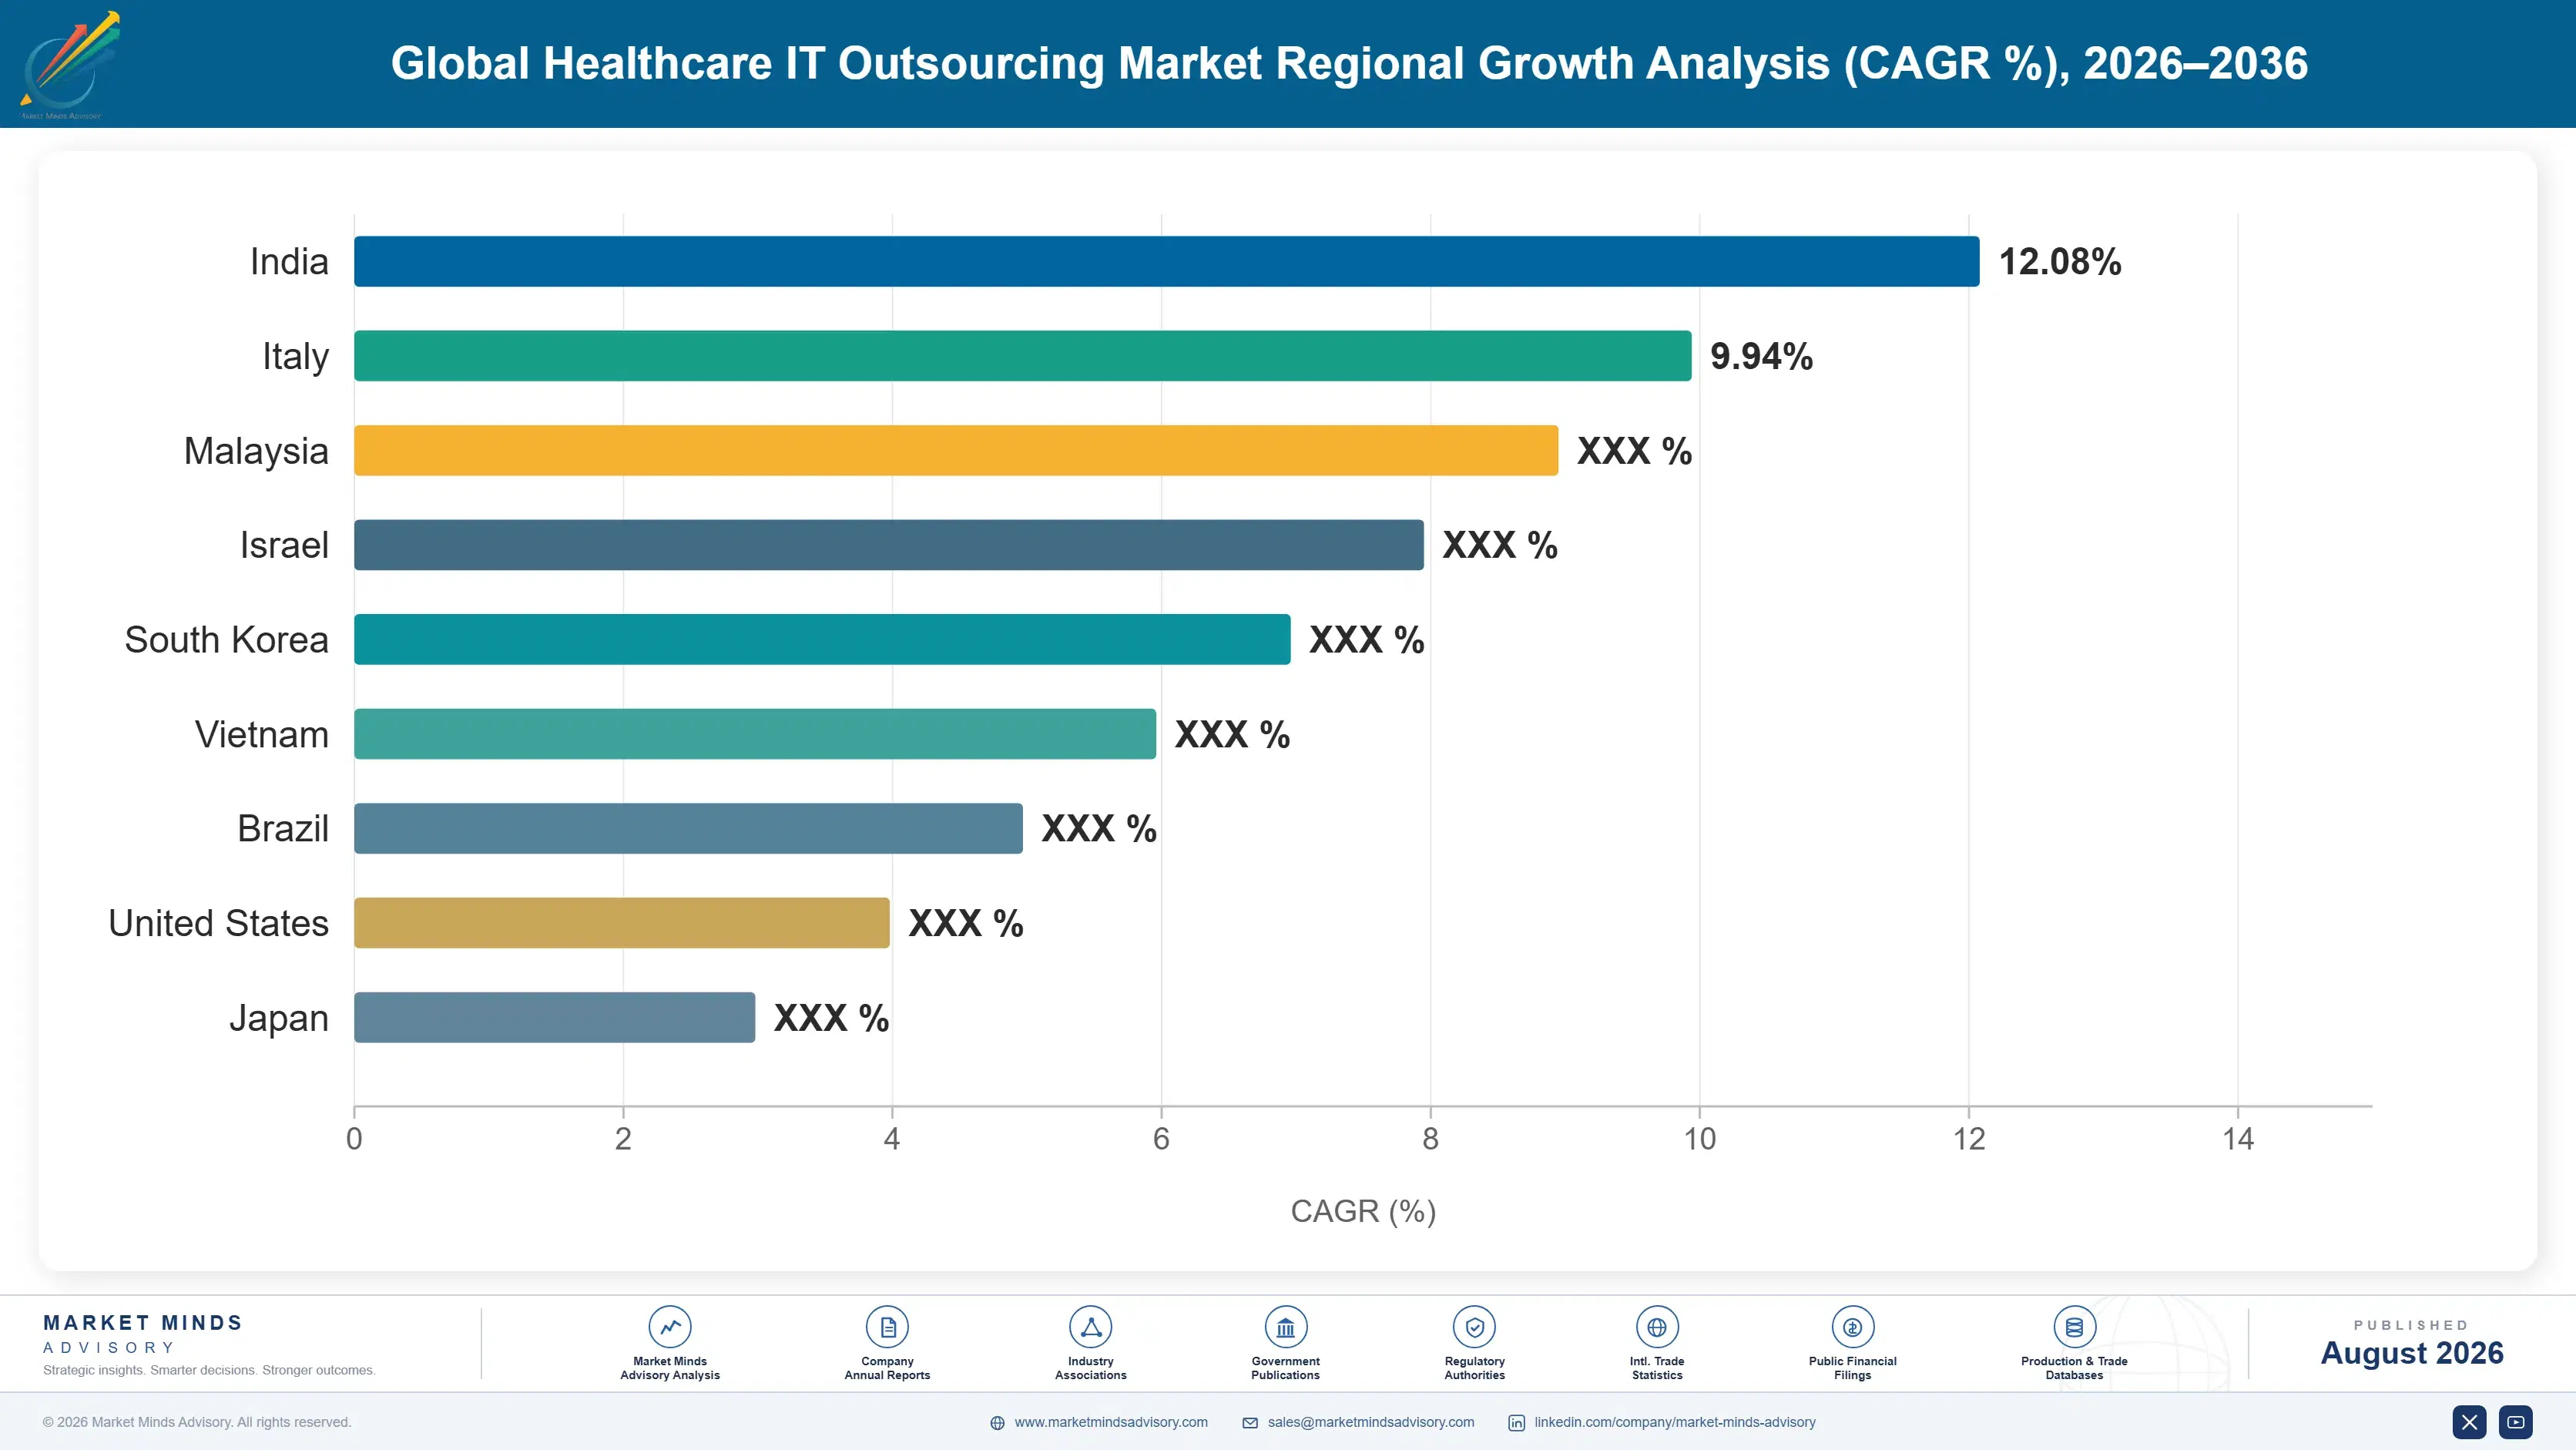
India: 12.4% CAGR
Fastest Growth Region
South Asia and Pacific: 11.2% CAGR
Largest Region
North America: 38% of 2025 global value
Market Leaders
Optum, Cognizant, Accenture, Infosys, Wipro. Source: MMA Analysis based on disclosed healthcare vertical services revenue, company annual reports 2025.
Primary Survey
n=3,800 procurement and R&D decision-makers, Q4 2025, six countries
Methodology
Demand-side build-up, cross-validated against public data, 47 expert interviews

Global Healthcare IT Outsourcing Market Forecast Scenarios

healthcare-it-outsourcing-market-size-forecast-scenario-1787676844298
Healthcare IT outsourcing grew at an estimated 9.2% historical rate from 2020 to 2025, accelerated by pandemic-driven telehealth infrastructure build-out and a subsequent wave of electronic health record modernization projects that hospital IT departments could not staff internally at the required pace. Revenue cycle management outsourcing also expanded meaningfully as payer claims complexity increased across most major markets.
The base case assumes 10.5% annual growth through 2036, anchored by three commercial mechanisms: continued clinical staffing shortages pushing routine IT work to external vendors, interoperability regulation requiring specialized compliance expertise most hospitals lack in-house, and rising adoption of AI-enabled clinical documentation and claims processing tools requiring vendor integration support across most care settings. Payer consolidation is expected to reinforce demand for standardized IT platforms across newly merged organizations nationwide.
The bull case, near 11.9%, assumes faster AI adoption across both provider and payer segments simultaneously, alongside accelerated interoperability compliance deadlines pulling forward vendor spending. The bear case, near 9.3%, reflects slower regulatory clarity on data sharing requirements delaying vendor contracts and hospital systems reversing course toward insourcing amid sustained budget pressure across public and private health systems.

What The Contract Actually Transfers

Healthcare IT outsourcing is priced like IT services and regulated like healthcare. A vendor bidding on price is competing in an industry where a single security failure ends the relationship and possibly the vendor. Health systems know this and increasingly buy on demonstrated controls rather than on rate cards, which is a change most procurement functions have not fully absorbed yet.
FIVE-FIRM CONCENTRATION27%Share of healthcare vertical services revenue held by leaders
AVERAGE CONTRACT VALUE$14.6 millionTypical annual value of a provider managed services agreement
TOP DELIVERY COUNTRYIndia 41%Indian share of global healthcare IT delivery headcount
CERTIFIED CONSULTANT PREMIUM2.4 timesBilling rate multiple for platform-certified staff over generalists
CONTRACT RENEWAL RATE88%Share of managed services agreements renewed at term end
ONSHORE DELIVERY SHARE46%Portion of clinical data work performed within the client country
Electronic health record consolidation reshaped the whole services market without anyone selling a service. When most large American health systems run one of two platforms, application management becomes platform expertise, and platform expertise is certified by the software vendor rather than earned in the market. A services firm's capacity to grow is therefore set by how many certifications it can obtain, which is a decision made by a company that is neither its customer nor its competitor.
Offshore delivery is hitting a limit specific to this vertical. Protected health information cannot be accessed from wherever labour is cheapest without contractual and regulatory arrangements many clients will not sign, so clinical data work is moving onshore and nearshore. Roughly 46% of it now sits in the client country, and that share is rising rather than falling.
"The vendors think they sell capability. They sell certifications issued by a software company that could double the supply tomorrow and has no reason to tell them first."
Director, Healthcare Technology Services Practice · MMA Technology Practice · August 2026

Market Trends

Vendor Concentration Risk Rewrites Health System Contracts

The 2024 Change Healthcare ransomware incident stopped claims processing across a large share of American providers for weeks, and hospitals discovered they had no alternative route for cash they had already earned. Boards responded by asking a question nobody had asked before: which single vendor failure would stop this organisation. The answers were uncomfortable. Contracts signed since carry concentration limits, mandatory failover arrangements and audit rights that would have been rejected outright in 2023. Vendors have absorbed the cost because the alternative was losing the account entirely, and none of them likes the precedent.
Market Impact: Cuts insurance premiums by 22%

Nearshore Delivery Replaces Offshore For Clinical Data

Protected health information carries access restrictions that make traditional offshore delivery difficult for anything touching identified patient records. Clients increasingly will not sign the arrangements that would permit it, regardless of what the regulations technically allow. The result is delivery capacity moving to Mexico, Costa Rica, Colombia and to domestic centres in secondary American cities, at rates well above Indian equivalents and well below onshore metropolitan costs. Vendors who built nearshore capacity before 2023 are winning work on delivery model rather than on price. Those who did not are subcontracting from competitors.
Market Impact: Moves 3,400 roles to vendors

Market Opportunities and Growth Drivers

Cyber Insurance Underwriting Makes Security Spending Compulsory

Health systems cannot obtain cyber cover without documented managed detection and response, segmented networks and tested incident procedures, and underwriters now audit rather than accept attestations. That converts a security purchase from a board debate into a condition of operating. Most provider organisations cannot staff a round-the-clock security operations centre internally at any credible standard, so the requirement lands directly on managed service vendors. Premium reductions for documented controls run large enough that the service partly funds itself, which is the argument that closes the sale in a finance committee.
Market Impact: Holds certified rates 2.4 times higher

Provider Margin Pressure Pushes Work Outside The Organisation

Hospital operating margins across the United States have run thin since 2022, and internal IT is one of the few cost centres a chief financial officer can move without touching clinical staffing. That makes this market countercyclical to provider finances in a way most technology services are not. The conversion is usually a rebadge: existing staff transfer to the vendor, cost moves from payroll to a service line, and headcount leaves the balance sheet. Health systems know exactly what they are doing, and the accounting benefit is often the point.
Market Impact: Compresses delivery margin by 8 points

Market Restraints and Challenges

Platform Certification Limits How Fast Vendors Can Grow

A services firm cannot bill more electronic health record work than it has certified consultants, and certification is issued by the software vendor rather than earned through experience. Root cause is deliberate: the platform owner controls quality by controlling supply, and has no interest in an oversupplied consulting market. The commercial impact is that certified staff command billing rates roughly 2.4 times generalist equivalents and get poached constantly. Vendors mitigate by running internal academies and by bidding on outcomes rather than on hours, which reduces the exposure without removing it.
Market Impact: Adds 14% to contract cost

Data Residency Rules Erode Offshore Cost Advantage

The economics that built healthcare IT outsourcing assumed work could be performed wherever labour was cheapest. Protected health information access restrictions and client contract terms have narrowed that considerably for anything touching identified records. Root cause is liability rather than regulation: clients could permit offshore access under existing law and decline to, because the breach lands on their name. Commercially this compresses margins on exactly the fastest-growing work. Vendors are mitigating through de-identification pipelines that let offshore teams work on stripped data, and through nearshore centres at intermediate cost. Neither fully restores the old economics.
Market Impact: Shifts 46% of work onshore
3 additional market trends, 4 additional growth drivers, and 2 additional restraints and challenges are covered in the full report. Contact sales@marketmindsadvisory.com to access the complete intelligence.

Segment CAGR and Growth Architecture

Segmentation follows service line: what work the vendor actually performs under the contract, rather than which client type buys it or where it gets delivered. Six lines cover the market without overlap, from application management through to implementation consulting. Client type and delivery geography are treated separately, because both cut across every service line differently.
healthcare-it-outsourcing-market-market-share-analysis-1787676844865

Cybersecurity Managed Services

Growth at 13.5%, half again the market rate of 9.0%, has almost nothing to do with technology and everything to do with insurance. Underwriters now require documented managed detection and response before writing cover, and health systems cannot staff a credible round-the-clock operation internally. That makes the purchase compulsory rather than discretionary, which changes how it survives a budget cycle. Provider demand dominates the segment today, though payer organisations are catching up as their own regulatory exposure grows. Margins here run well above application management because clients buy on demonstrated capability rather than on rate, and because very few vendors can prove the capability. Proof is the whole competitive question here.
CAGR 13.5%

Clinical Data and Interoperability Services

Information blocking rules and TEFCA participation created continuing work that no health system staffed for, because the requirement did not exist when the IT department was sized. Growth at 11.2% reflects that gap rather than any new technology. The work itself is unglamorous: mapping data elements, reconciling patient identity across systems that never agreed on it, and maintaining connections that break whenever either side upgrades. Vendors with clinical informatics capability rather than general integration skills win this work, and there are not many. The constraint is that most of it touches identified records, which forces delivery onshore or nearshore at higher cost. That cost is passed on and clients accept it.
CAGR 11.2%
Full segment breakdown across 6 segments available in the complete report.

Regional Architecture and Country Demand Map

Demand and delivery sit in different places, which is the defining feature of this market. North America generates most of the spending on administrative complexity found nowhere else. South Asia supplies the delivery capacity and grows fastest on its own domestic hospital systems as well.

North America

North America takes 38%, above the 22 to 32% default band, because American healthcare runs an administrative apparatus of payers, prior authorisation and claims adjudication that has no equivalent anywhere else, and IT outsourcing follows that complexity directly. No default band survives it. Provider demand splits between large integrated systems running multi-year managed services and community hospitals buying application support only. Payer organisations are the second engine and buy differently, weighted toward claims and analytics platforms. Canadian demand runs through provincial health authorities with procurement cycles measured in years. Mexican health IT is growing and increasingly serves as nearshore delivery capacity for American clients rather than as a market. That role keeps expanding.
Share: 38% | CAGR: 8.2% (2026 to 2036)

Western Europe

European health systems are mostly public, which makes procurement slower, contracts longer and pricing tighter than anything in North America. The National Health Service in Britain is the largest single buyer in the region and has moved repeatedly between centralised and trust-level purchasing, which vendors have learned to plan around rather than predict. German hospital digitisation funding under the Krankenhauszukunftsgesetz created a wave of implementation work with a defined end date. Nordic systems buy the most sophisticated interoperability work relative to their size. French and Italian demand runs slower, weighted toward infrastructure management rather than clinical applications, and data residency requirements keep almost all of it onshore. Offshore delivery barely operates here.
Share: 22% | CAGR: 7.4% (2026 to 2036)
Regional intelligence for 5 additional markets available in the complete report: East Asia, South Asia and Pacific, Latin America, Middle East and Africa, Eastern Europe. Contact sales@marketmindsadvisory.com.
healthcare-it-outsourcing-market-country-cagr-analysis-1787676845409

Selling Accountability, Not Just Capacity

Rate cards are comparable, and comparison is what turns a services business into a staffing business. Four levers move the contract onto ground where hourly rates stop deciding, and each requires the vendor to accept risk the client currently carries alone. That transfer is exactly what clients will pay for. Most vendors decline it anyway.

Underwrite Security Outcomes Instead Of Selling Monitoring Hours

Selling a security operations centre by the hour puts a vendor in a rate comparison against every other provider. Selling a documented control environment that reduces the client's cyber insurance premium by roughly 22% changes the conversation entirely, because the buyer can now show a finance committee that the service partly pays for itself. Vendors going further and accepting contractual liability for defined security outcomes command premiums no hourly model reaches. The requirement is insurance capacity and genuine confidence in the controls, which most vendors do not have and will not admit.
Market Impact: Cuts client cyber insurance premiums by roughly 22%

Build Certification Capacity Before The Demand Appears

Platform-certified consultants bill at roughly 2.4 times generalist rates and cannot be hired quickly, because the supply is controlled by the software vendor rather than by the labour market. Firms running internal academies that put generalists through certification create capacity competitors must buy at market. The cost is real: a consultant in training bills nothing for months and may leave afterward. Firms that accepted that cost through the last downturn emerged with certified benches when demand returned, and they priced accordingly while competitors were still recruiting. Timing that investment is the whole trick.
Market Impact: Secures staff billing at roughly 2.4 times generalist rates

Build Nearshore Capacity Where Offshore Cannot Reach

Clinical data work is moving onshore and nearshore because clients will not permit offshore access to identified records, and roughly 46% of it now sits in the client country. Nearshore centres in Mexico, Costa Rica and Colombia sit between the two on cost and satisfy the data arrangements clients will actually sign. Building one takes 18 months and a real estate commitment before any revenue appears. Vendors who built before 2023 are winning work on delivery model rather than on price, and subcontracting capacity to competitors who did not. That subcontract margin is embarrassing to disclose.
Market Impact: Serves the 46% of work now delivered onshore

Price Integration Work Against Merger Deal Value

Every payer or provider merger generates a multi-year systems integration programme, and the acquirer has just demonstrated it can find capital. Pricing that work against IT department budgets is a mistake most vendors make automatically. Pricing it against deal economics, where a delayed integration costs the acquirer far more than the programme does, supports fees roughly 3 times what a budget-anchored bid returns. The requirement is being in the conversation before the deal closes, which means relationships with corporate development rather than with the chief information officer. Very few services firms have built those.
Market Impact: Supports fees roughly 3 times a budget-anchored bid

Who Controls the Margin Pool

Measured on disclosed healthcare vertical services revenue, the five largest firms hold a CR5 of 27%. The interesting fact is where they came from: a payer subsidiary, two Indian services firms, a global consultancy and a hybrid. No settled industry structure produces that list. Optum and Cognizant lead the challenger group, one through owning a payer and the other through scale in application management.
Three contests are running. Certified platform capacity is the first and the least visible, since a firm cannot bid work it has no certified staff for and certifications are rationed by a third party. Security credibility is the second, contested through breach records and audit results rather than through capability claims. Delivery footprint is the third, where nearshore presence has become a qualification criterion rather than a cost advantage. Rate cards decide far less than any of these.

The pressure worth watching comes from the platform vendors themselves. Software companies that certify consultants can also sell managed services directly, and several have begun to. Rankings shift wherever a platform owner decides that services revenue is worth more than a partner network, which is a decision taken entirely outside this market.
healthcare-it-outsourcing-market-company-positioning-matrix-1787676845931

Competitive Moat and Risk Dimensions

OPTUM

Moat: Payer Ownership And Data

Optum sits inside the largest American health insurer, which gives it claims data, provider network relationships and an understanding of payer workflow that no independent services firm can assemble from outside. That position lets it sell services shaped by how reimbursement actually works rather than by how a client describes it. Competitors have to learn what Optum already knows operationally.
OPTUM

Risk: Provider Client Conflict Perception

Selling services to hospitals while owning an insurer that negotiates against them creates a conflict clients raise in every procurement. Some health systems decline to bid Optum on principle regardless of capability or price. That exclusion is not commercial, cannot be answered with better terms, and grows more acute as payer and provider interests diverge further on reimbursement.
COGNIZANT

Moat: Certified Delivery Bench Scale

Cognizant carries one of the largest certified electronic health record consulting benches anywhere, built over years when certifications were easier to obtain and cheaper to fund. That bench is the binding constraint on winning large application management work, and it cannot be assembled quickly by a competitor because the platform owner controls how many certifications issue each year.
COGNIZANT

Risk: Offshore Model Margin Compression

A delivery model built on offshore labour arbitrage faces exactly the work that is moving onshore fastest, since clinical data services cannot be performed where the cheap capacity sits. Building nearshore and onshore capacity replaces high-margin revenue with lower-margin revenue at the same price point. The transition is under way and the margin arithmetic does not improve.

Players Tracked

Prominent Players

Optum
Cognizant
Accenture
Infosys
Wipro

Other Key Players

Tata Consultancy Services
HCLTech
IBM
Deloitte
DXC Technology
NTT DATA
Capgemini
Tech Mahindra
Conduent
CitiusTech
Firstsource Solutions
Genpact
Atos
Kyndryl
R1 RCM

Recent Developments

JANUARY 2025

Cognizant opens healthcare delivery centre in Costa Rica

Cognizant opened a nearshore healthcare delivery centre in Costa Rica serving American clients, an organic capacity investment rather than an acquisition. The stated driver was client resistance to offshore access to identified patient records, with the facility positioned to handle clinical data work that cannot be performed from Indian centres.
Signal: Delivery geography has become a qualification requirement rather than a cost decision, which changes the whole margin model.
MAY 2025

Accenture acquires healthcare cybersecurity managed services provider

Accenture acquired a specialist provider of managed detection and response services for hospital networks. This was an acquisition rather than a partnership or minority investment. The stated rationale was demand created by cyber insurance underwriting requirements, which have made documented monitoring a condition of obtaining cover for most health systems.
Signal: Consultancies are buying security operations capability rather than building it, which says the demand arrived faster than capacity.
AUGUST 2025

Infosys signs multi-year managed services agreement with American health system

Infosys entered a multi-year managed services agreement covering application support and infrastructure for a large American integrated health system. This was a supply agreement, not a joint venture, and includes a staff transfer arrangement moving several hundred internal IT employees to the vendor under the contract terms.
Signal: Staff transfer deals move cost off the client balance sheet, which is frequently the actual reason for outsourcing.

What Delivery Actually Costs To Run

Labour is essentially the entire cost base. Salaries, benefits and recruitment together run 68 to 71% of delivery cost, sourced from India for infrastructure and application work, from nearshore centres for anything touching identified records, and from onshore staff for client-facing roles. Compliance overhead adds a further share that has grown steadily: audit preparation, certification maintenance and security tooling now carry real weight.
Indian wage inflation through 2022 and 2023 is the volatility event that mattered. Infosys and Wipro annual reports for those years document attrition rates above 20% and the compensation revisions required to hold delivery teams together. Contracts priced on multi-year fixed rates absorbed the increase directly. Firms with cost-plus or indexed structures passed it through, and their clients accepted it because switching a healthcare vendor mid-contract carries risks nobody wanted to take on.

Exposure divides by contract structure and delivery mix. Firms with indexed rate agreements carry almost no wage risk and say little about it. Those holding multi-year fixed-price managed services contracts carry all of it, and the exposure grows every year the contract runs. Vendors weighted toward nearshore and onshore delivery face lower attrition but a higher starting cost, which is a different problem.
healthcare-it-outsourcing-market-cost-volatility-analysis-1787676846131

Index long contracts to published wage benchmarks

Multi-year fixed-price managed services agreements were sold as client risk transfer and turned out to be vendor wage exposure. Indexed structures tied to published labour cost benchmarks share the movement instead of concentrating it. Clients resist them because fixed pricing is easier to budget, and they accept them when the alternative is a vendor asking to reopen terms mid-contract.

Build de-identification pipelines to preserve offshore delivery

Most clinical data work becomes performable offshore once identifiers are stripped, and the stripping itself can happen onshore under client supervision. Building that pipeline costs engineering time and produces a permanent cost advantage on work competitors must deliver at nearshore rates. The barrier is client trust in the de-identification, which takes an audit rather than an argument.

Run certification academies to reduce hiring cost exposure

Certified consultants cost roughly 2.4 times generalist rates in a market where the platform owner controls supply. Training generalists internally converts a purchase into a capital investment with a predictable cost, at the price of months of unbilled time and some attrition afterward. Firms that ran academies through the last downturn had benches ready when demand returned.

Portfolio Architecture for Margin Defence

Margin in this market follows scarcity of capability, not scale of contract. Infrastructure management sold by the seat earns commodity services margins because a hundred firms can do it. Cybersecurity managed services with a demonstrable control environment earn two to three times that, because very few vendors can prove the capability and clients cannot verify it any other way.
The tension is that clients buy the whole relationship in one procurement. A vendor discounting infrastructure management to win a health system then finds its security services benchmarked against that same rate expectation. Firms that quote security and clinical informatics separately hold pricing that bundled competitors cannot. The trade is smaller initial contracts and better realised margin, and most firms have chosen revenue instead because revenue is what analysts count.

High-value pools sit in three places. Security operations with contractual outcome commitments, where scarcity of provable capability supports pricing no hourly model reaches. Clinical informatics and interoperability, where the skill set is genuinely rare and the work is mandated. And merger integration programmes, where fees can be anchored against deal value rather than against an IT budget. None of the three carries the headcount that application management does.

Volume / Commodity-Adjacent

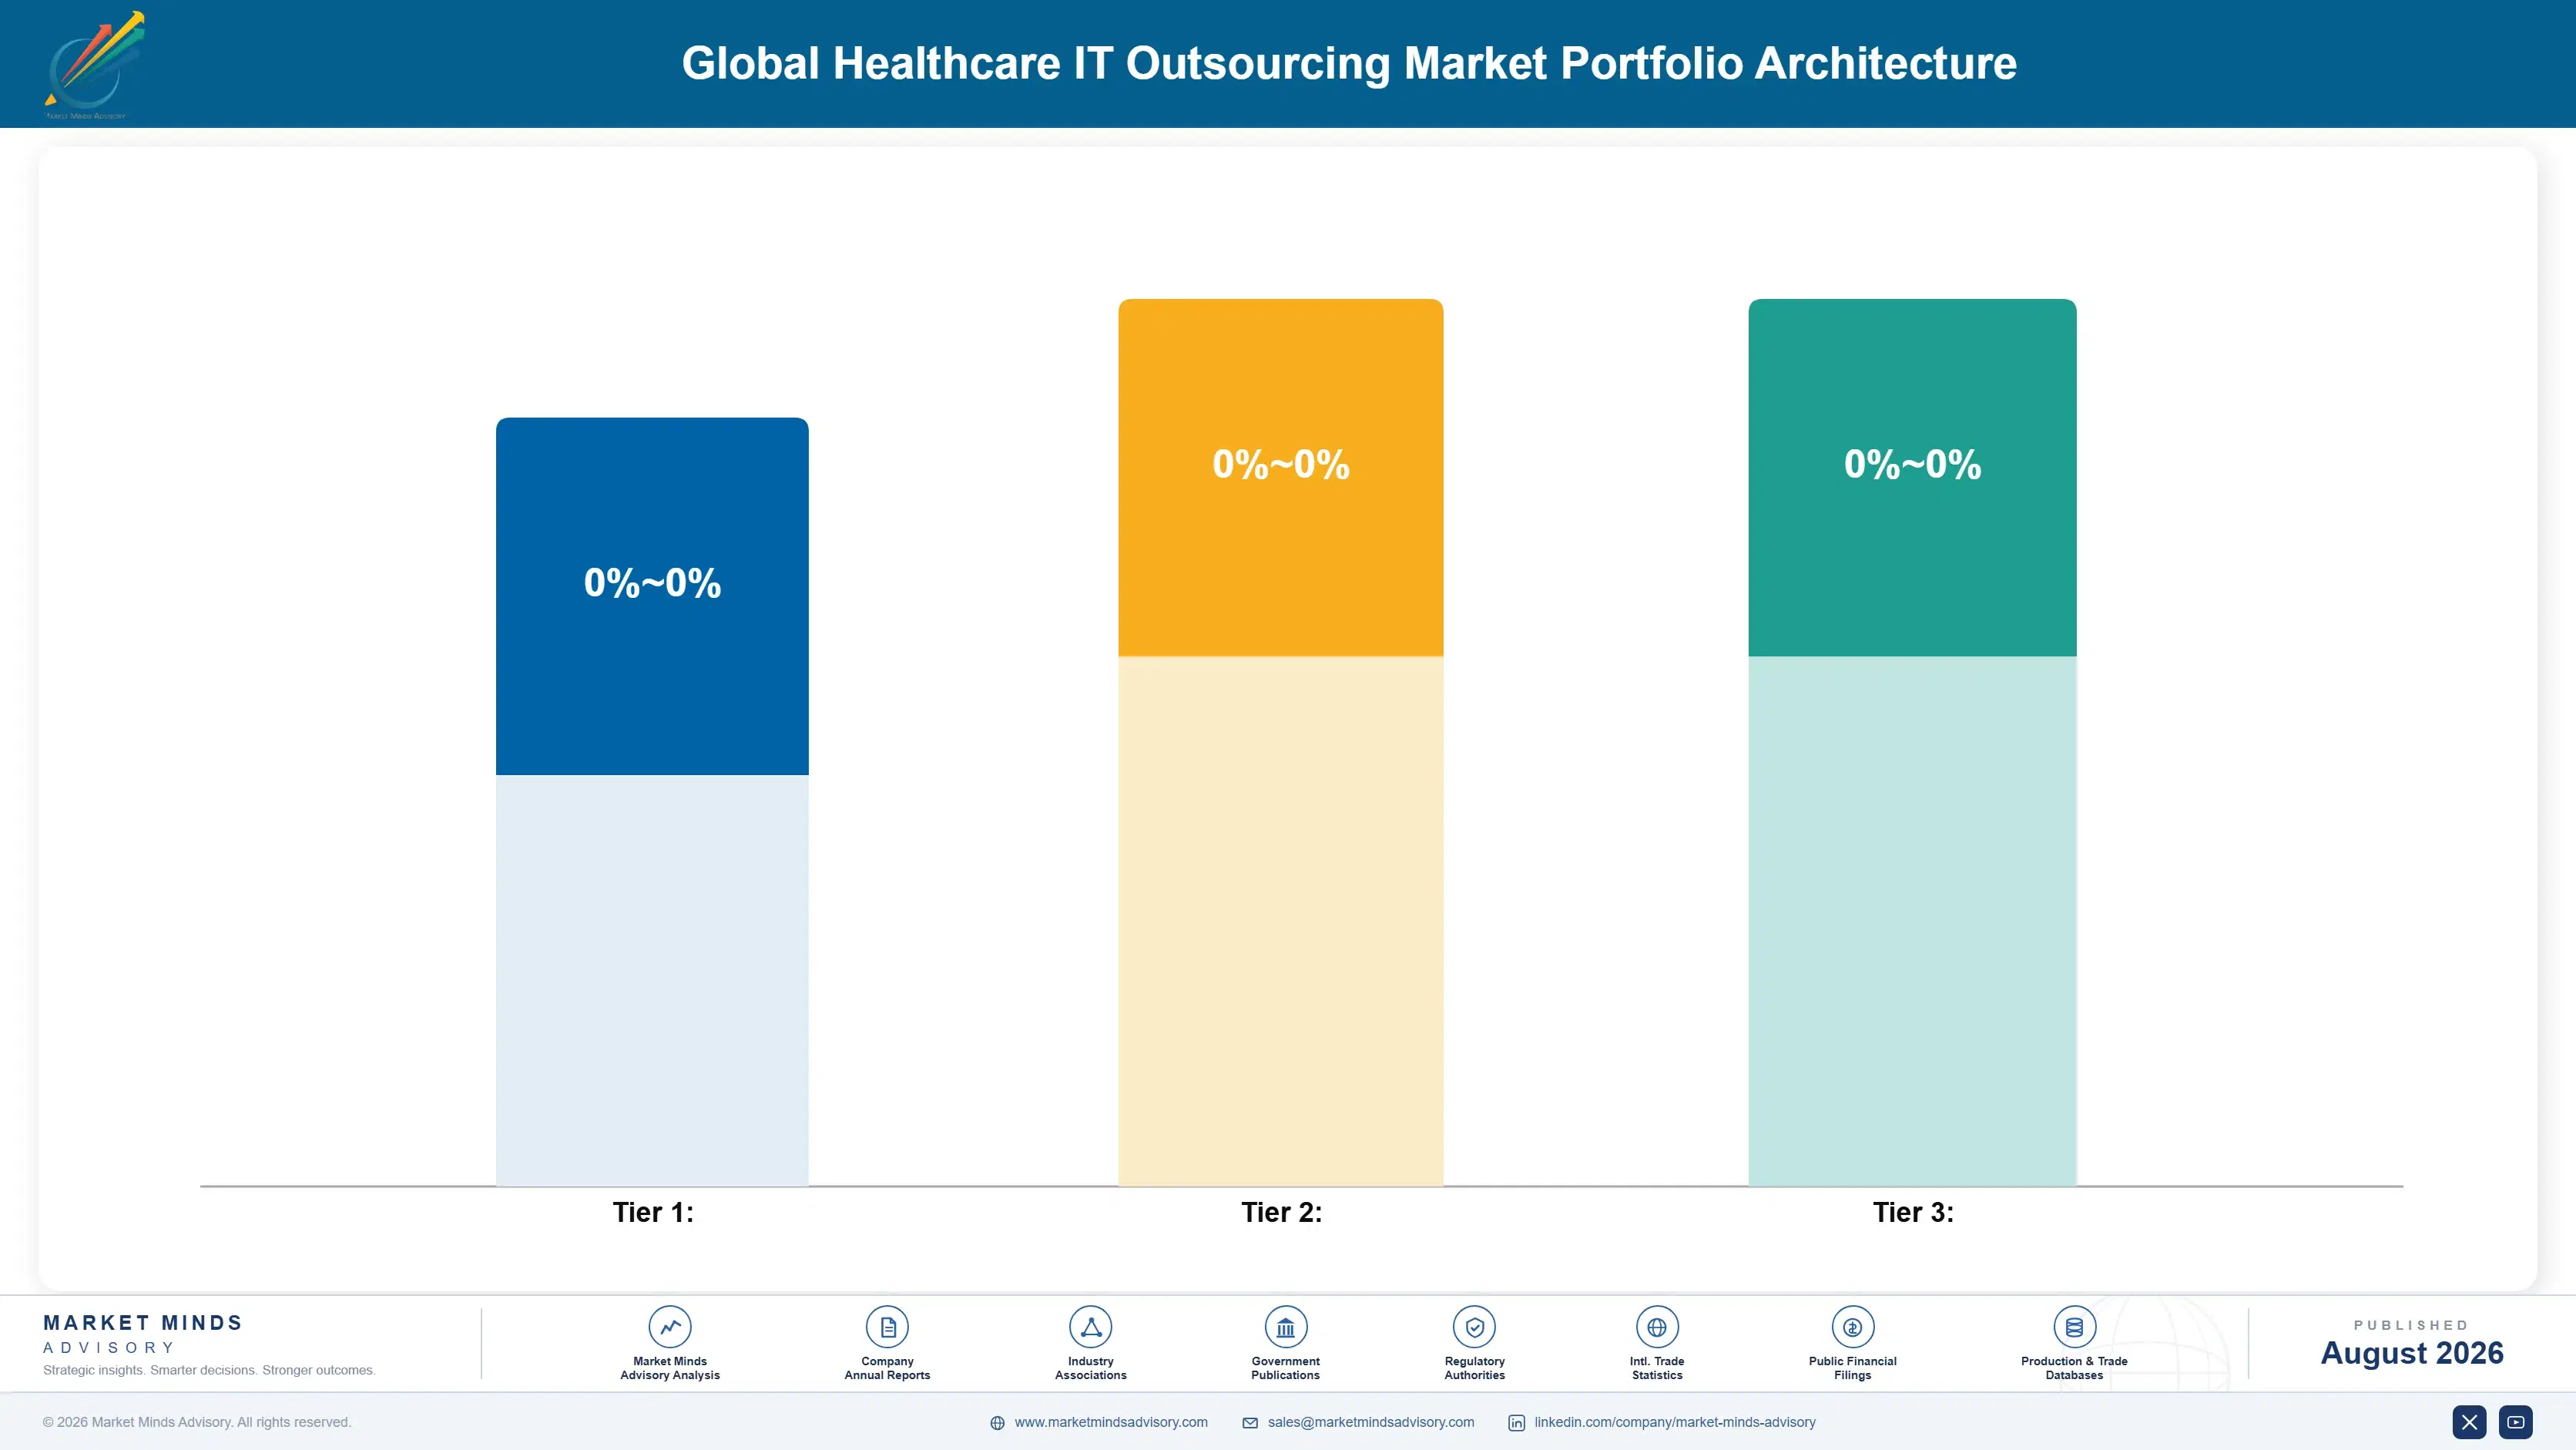
Infrastructure management, service desk and application support delivered largely offshore under rate card pricing. The 7-point range separates firms with mature offshore utilisation from those carrying underused benches. Client switching is easier here than anywhere else in the portfolio.
Gross Margin: 18-25%

Premium / Certified

Platform-certified electronic health record consulting, implementation programmes and revenue cycle IT operations. The 7-point spread separates firms with deep certified benches from those subcontracting capacity at market rates. Certification scarcity rather than delivery quality holds this pricing in place.
Gross Margin: 31-38%

Sustainability / Regulatory / Next-Generation

Cybersecurity managed services, clinical interoperability work and merger integration programmes. The 13-point range is unusually wide because security services with contractual outcome commitments price on risk transfer while interoperability work prices on scarce skills, and the two behave very differently through a procurement cycle.
Gross Margin: 42-55%
healthcare-it-outsourcing-market-portfolio-architecture-1787676846632

High-value Sub-segments and Strategic Watch-out

Outcome-Backed Security Operations

Highest value and fastest growth, driven by insurance underwriting rather than by any technology change. Very few vendors can prove the control environment clients need, which keeps the field narrow. The risk is liability: accepting contractual security outcomes means owning a failure that could exceed the contract value.
Gross Margin: 51-54%

Clinical Interoperability Engineering

High value with strong growth, mandated by information blocking rules rather than chosen by buyers. The skill set combines clinical informatics with integration engineering and is genuinely scarce. Data residency requirements force onshore or nearshore delivery, which raises cost and is passed through without much resistance.
Gross Margin: 44-47%

Offshore Application Support

The volume core, carrying most delivery headcount and the thinnest margin. Rate card comparison sets pricing and Indian wage inflation erodes it from underneath. Most firms run this line to hold client relationships that carry higher-value work alongside, which is a defensible reason and not a profitable one.
Gross Margin: 19-22%

Fixed-Price Multi-Year Managed Services

The strategic watch-out. These contracts carry substantial revenue and lock the vendor into rates set before Indian wage inflation and before delivery moved onshore. The risk is that a contract profitable at signature becomes loss-making in year four, and the client has no obligation to renegotiate anything.
Gross Margin: 24-27%

Why Contracts Renew Almost Automatically

Managed services agreements renew at 88%, which is unusually high for any services market and reflects switching cost rather than satisfaction. Moving a health system's application support to a new vendor means retraining on clinical workflow, re-establishing security clearance and accepting transition risk during a period when nothing can go wrong. Most clients renegotiate instead of moving.
Stickiness varies sharply by service line. Electronic health record application support essentially never changes hands mid-platform, because the certified staff who know the configuration are the asset. Security operations change more readily, since a breach or an audit failure ends the relationship immediately. Infrastructure management moves on price at every renewal. Consulting engagements end by design and generate nothing afterward unless the firm converts them into something managed, which most fail to do.

The buyer has moved up the organisation and changed profession. Ten years ago a chief information officer signed these contracts. Now the chief financial officer signs, the general counsel reviews the liability terms and the audit committee asks about vendor concentration, which means a technical pitch reaches nobody who decides. Vendors still fielding technical teams into commercial conversations lose slowly and blame price.
healthcare-it-outsourcing-market-end-use-penetration-index-1787676847116

Where The Contract Value Sits

These are among the four positions where our research anticipates prominent divergence between winners and laggards over the coming forecast period. Each is grounded in the demand model, the regulatory perimeter, and the announced capacity pipeline.
01 / SECURITY RISK TRANSFER

Sell outcomes and accept the liability that follows

Cyber insurance underwriting has converted security monitoring from a discretionary purchase into a condition of operating, and a documented control environment cuts client premiums by roughly 22%, which lets the buyer show a finance committee the service partly funds itself. Vendors willing to accept contractual liability for defined security outcomes command pricing no hourly monitoring model can reach, because the client is buying transferred risk rather than transferred work. The requirement is insurance capacity and genuine confidence in the controls, and most competitors possess neither.
02 / CERTIFICATION BENCH BUILDING

Train certified staff before the demand arrives

Platform-certified consultants bill at roughly 2.4 times generalist rates and cannot be hired at speed, because the software vendor rather than the labour market controls how many certifications issue each year. That makes bench capacity the binding constraint on winning application management work, and it cannot be relieved by paying more when demand is high. Firms that funded internal academies through the last downturn arrived at the recovery with certified staff already billing, while competitors were still recruiting against each other.
03 / DELIVERY FOOTPRINT REBUILD

Move capacity where the data is allowed to go

Roughly 46% of clinical data work now sits in the client country because health systems will not permit offshore access to identified records, whatever the regulations technically allow. That converts delivery geography from a cost decision into a qualification requirement, and vendors without nearshore or onshore capacity are subcontracting from competitors at margins they would rather not disclose. Building a nearshore centre takes 18 months and a real estate commitment ahead of any revenue, which is why the firms that started before 2023 are winning on delivery model.
04 / DEAL VALUE ANCHORING

Price merger integration against deal value, not IT budgets

Every payer or provider merger generates a multi-year integration programme from an acquirer who has just demonstrated access to capital, and pricing that work against an IT department budget leaves most of the value on the table. Anchored against deal economics, where delayed integration costs the acquirer far more than the programme does, the same work supports fees roughly 3 times a budget-anchored bid. Reaching that conversation requires relationships with corporate development rather than with the chief information officer, and very few services firms have built them.

Engagement Snapshot From the Field

A live engagement with an industry participant carrying material or product regulatory and market exposure ahead of a defining policy shift, showing how our research translates into a defensible multi-year portfolio strategy.
MARKET MINDS ADVISORY · CLIENT ENGAGEMENT SUMMARY
Healthcare IT Outsourcing Producer Strategic Portfolio Review and Transition Roadmap 2026·Investment Scenario on Healthcare IT Outsourcing Exposure Evaluation 2025-26
CLIENT PROFILE
An American integrated health system operating 14 hospitals and roughly 200 outpatient sites, with annual operating revenue reported at 6.8 billion dollars (client-reported, unverified by MMA). Its IT function ran 640 internal staff alongside seven external vendors under agreements signed at different times by different executives. No single view existed of what each vendor could stop if it failed.
STRATEGIC CHALLENGE
The board asked a question after the 2024 claims processing outage that management could not answer: which single vendor failure would halt operations. Two of the seven agreements were approaching renewal simultaneously, and the procurement team was preparing to run them as separate price-led tenders. Nobody had assessed concentration across the portfolio, because nobody owned the portfolio.
MMA APPROACH
MMA mapped every clinical and revenue process to the vendors and systems it depended on, then modelled failure scenarios by vendor rather than by application, which is how the exposure actually presents itself. Thirteen expert interviews with peer health systems established what contract terms had become obtainable since 2024. The analysis treated failure impact, not contract price, as the ranking criterion.
KEY FINDINGS
  1. One vendor touched 71% of revenue-generating clinical workflows through four separate agreements that nobody in the organisation had ever mapped against each other.
  2. Peer health systems had obtained failover obligations and audit rights since 2024 that the client's own agreements did not contain at all.
  3. Running the two renewals as a single combined tender rather than separately would increase concentration further, which the procurement team had not considered.
  4. Splitting the security operations contract to a separate specialist vendor added 9% to annual cost and removed the single largest failure exposure (client-reported, unverified by MMA).
CLIENT PROFILE
An American integrated health system operating 14 hospitals and roughly 200 outpatient sites, with annual operating revenue reported at 6.8 billion dollars (client-reported, unverified by MMA). Its IT function ran 640 internal staff alongside seven external vendors under agreements signed at different times by different executives. No single view existed of what each vendor could stop if it failed.
STRATEGIC CHALLENGE
The board asked a question after the 2024 claims processing outage that management could not answer: which single vendor failure would halt operations. Two of the seven agreements were approaching renewal simultaneously, and the procurement team was preparing to run them as separate price-led tenders. Nobody had assessed concentration across the portfolio, because nobody owned the portfolio.
MMA APPROACH
MMA mapped every clinical and revenue process to the vendors and systems it depended on, then modelled failure scenarios by vendor rather than by application, which is how the exposure actually presents itself. Thirteen expert interviews with peer health systems established what contract terms had become obtainable since 2024. The analysis treated failure impact, not contract price, as the ranking criterion.
KEY FINDINGS
  1. One vendor touched 71% of revenue-generating clinical workflows through four separate agreements that nobody in the organisation had ever mapped against each other.
  2. Peer health systems had obtained failover obligations and audit rights since 2024 that the client's own agreements did not contain at all.
  3. Running the two renewals as a single combined tender rather than separately would increase concentration further, which the procurement team had not considered.
  4. Splitting the security operations contract to a separate specialist vendor added 9% to annual cost and removed the single largest failure exposure (client-reported, unverified by MMA).
RECOMMENDED STRATEGY
Phase 1: Phase one: run the two renewals as separate tenders with explicit concentration limits, rejecting any bid that increases single-vendor dependency. Phase 2: Phase two: move security operations to a specialist vendor with contractual outcome commitments, accepting the cost increase as insurance rather than as overhead. Phase 3: Phase three: establish a single owner for the vendor portfolio reporting to the chief financial officer, with annual concentration reporting to the board.
OUTCOME
Both renewals completed with failover obligations and audit rights the previous agreements lacked, at a blended cost increase of 6% (client-reported, unverified by MMA). Security operations moved to a specialist vendor within eight months. Single-vendor exposure across revenue-generating workflows fell from 71% to 44%, and the board now receives concentration reporting annually.

Frequently Asked Questions

Foundational context covering the market sizes, CAGR, scope, country, region and competition that inform every finding below. This section is provided to cover basics and most often pre-purchase conversations, answered from the MMA Primary Research Dataset.

What is the current size of the Healthcare IT Outsourcing Market?

The market was worth 62.4 billion dollars in 2025, covering application management, infrastructure, security, interoperability and revenue cycle IT services. It reaches 68.0 billion dollars in 2026 on current forecasts.

How large will the Healthcare IT Outsourcing Market be by 2036?

MMA forecasts 161.0 billion dollars by 2036, an increase of 93.0 billion dollars over the 2026 base. That represents an expansion multiple of 2.37 times across the forecast period.

What is the CAGR for the Healthcare IT Outsourcing Market 2026 to 2036?

The base case compounds at 9.0% annually. MMA's bull case reaches 10.2% if payer and provider consolidation accelerates, while the bear case sits at 7.8% following any severe vendor security failure.

Which segment is growing fastest?

Cybersecurity managed services, at 13.5%, half again the market rate of 9.0%. Cyber insurance underwriters now require documented monitoring, which makes the purchase compulsory rather than discretionary.

Who are the major companies in the Healthcare IT Outsourcing Market?

Optum, Cognizant, Accenture, Infosys and Wipro lead on disclosed healthcare vertical services revenue. Tata Consultancy Services, HCLTech, IBM, CitiusTech and NTT DATA compete strongly within specific service lines.

Which country is growing fastest?

India at 12.4%, driven by domestic hospital digitisation under the Ayushman Bharat Digital Mission alongside its role as the market's main delivery base. Brazil follows on private hospital group spending.

Report Segmentation Architecture

The full report scope spans multiple orthogonal segmentation dimensions, with cross-tabulated demand data provided for each dimension pair. Coverage extends further to regional breakdowns, trend trajectories, and the competitive detail needed to support segment-level decision-making.

By Service Line

  • Application Management and EHR Support
  • Infrastructure and Cloud Managed Services
  • Cybersecurity Managed Services
  • Clinical Data and Interoperability Services
  • Revenue Cycle IT Operations
  • IT Consulting and System Implementation

By End-Use Industry

  • Integrated Health Systems
  • Community and Rural Hospitals
  • Health Insurance Payers
  • Physician Groups and Ambulatory
  • Life Sciences and Clinical Research
  • Public Health Agencies

By Commercial Dimension

  • Multi-Year Managed Services
  • Time and Materials Staffing
  • Fixed-Price Project Delivery
  • Outcome-Based Contracting
  • Staff Transfer Arrangement
  • Subcontracted Capacity Supply

By Region

  • North America
  • Western Europe
  • East Asia
  • South Asia and Pacific
  • Latin America
  • Middle East and Africa
  • Eastern Europe

Scope, Methodology, and Coverage

Every figure in this report is reproducible from documented input assumptions. The scope below maps the historical period, the forecast horizon, the segmentation dimensions, and the countries covered, alongside the underlying primary and qualitative methodology.
Historical Period
2020 to 2025
Forecast Period
2026 to 2036
Base Year
2025 (USD billions; MMA Primary Research Dataset, August 2026)
Market Definition
Scope covers information technology services delivered under contract to healthcare providers, payers and life sciences organisations by external suppliers, spanning application management and electronic health record support, infrastructure and cloud managed services, cybersecurity operations, clinical data and interoperability engineering, revenue cycle IT operations and system implementation consulting. Software licensing, medical device servicing, clinical staffing and pure business process work such as medical coding are excluded. Internal IT departments and shared service captives fall outside the boundary.
Quantitative Units
USD billions (current prices); contracted annual value; delivery headcount; certified consultant count; onshore delivery share
Segmentation Dimensions
By Service Line; By End-Use Industry; By Commercial Dimension; By Region
Regions Covered
North America, Western Europe, East Asia, South Asia and Pacific, Latin America, Middle East and Africa, Eastern Europe
Countries Covered
USA, China, Germany, France, UK, Japan, South Korea, India, Brazil, Mexico, Italy, Spain, Poland, Saudi Arabia, South Africa
Key Companies Profiled
Optum, Cognizant, Accenture, Infosys, Wipro, Tata Consultancy Services, HCLTech, IBM, Deloitte, DXC Technology, NTT DATA, Capgemini, Tech Mahindra, Conduent, CitiusTech, Firstsource Solutions, Genpact, Atos, Kyndryl, R1 RCM
Quantitative Methodology
Primary survey, n=3,800 respondents, Q4 2025, six countries; demand-side model with trade association cross-validation
Qualitative Methodology
47 expert interviews, Q4 2025; applied to validate demand model assumptions, identify emerging dynamics, and assess competitive positioning
Report Format
PDF and XLSX data workbook (Word format preview document)
Publisher
Market Minds Advisory
Report Code
MMA-2026-TEC-119
Published
August 2026
Contact
sales@marketmindsadvisory.com | www.marketmindsadvisory.com

Purchase the full Healthcare IT Outsourcing Market Report (2026 to 2036).

The full report runs to 205 pages and covers all six service line segments, seven regions and 20 profiled companies in detail. It includes the complete segment CAGR set, regional spending and delivery footprint data, and contract structure analysis across managed services and outcome-based models. Company profiles carry evaluation on disclosed healthcare vertical services revenue, with moat and risk assessment for the top five firms. The competitive section extends to 17 tracked corporate developments across 2024 and 2025, each with commercial interpretation. Primary research inputs include a quantitative survey of 3,800 respondents and 47 expert interviews conducted in Q4 2025.
Six service line segments with individual CAGR forecasts
Seven regional markets with spending and delivery data
Twenty company profiles on consistent revenue evaluation basis
Seventeen tracked corporate developments with commercial interpretation notes
Contract structure analysis across managed and outcome models
Delivery footprint mapping by onshore, nearshore and offshore

Built For The People Who Decide

From boardroom strategy to bench-side execution, this report is read cover-to-cover by leaders shaping the next decade of their industry, turning demand scenarios, market dynamics and valuation benchmarks into decisions.
CXOs/ Presidents/ VPs/ Managers
M&A and Corporate Development
Strategy Teams and R&D Heads
Procurement and Product Directors
Regulatory and Compliance Leaders
Investor Relations and Equity Analysts