Market Minds Advisory
Healthcare Business Intelligence Market

Healthcare Business Intelligence Market: Every System Now Buys Analytics With The Record

A commercial reading of healthcare analytics platforms, where value-based contracting forces providers to quantify outcomes they once reported narratively, and predictive and generative tooling is pulling budget away from static reporting dashboards fast.

Lead Analyst

Alice Ballenger

Published

September 2026

Make Smarter Decisions with Customized Research Insights

Request a free sample report and evaluate market opportunities, growth trends, and competitive dynamics relevant to your business needs.

2025 MARKET VALUE$9.6BMarket Size 2025
2036 FORECAST VALUE$32.7BBase Case , 2026 to 2036
CAGR 2026 TO 203611.8 %Bull 13.0% / Bear 10.5%
INCREMENTAL OPPORTUNITY$22.0BNet 10- year value creation
EXPANSION MULTIPLE3.05x2036 value over 2026 base
Strategic Levers
M&A Pipeline
Regional Outlook
Country Rankings
Competitive Intelligence
Segmental Deep-dive
Call-Us : 91 93563 13602

Executive Snapshot and Market Trajectory

Value-based contracts made analytics mandatory rather than optional. A hospital that cannot quantify its own outcomes cannot negotiate a risk-sharing agreement with any real leverage, and that single fact has pulled business intelligence out of the reporting department and into the contract room entirely.
The market stands at USD 9.6 billion in 2025 and reaches USD 32.74 billion by 2036 at an 11.8% CAGR. Predictive and AI-enabled analytics grow fastest at 16.9%, about 1.43 times the overall rate, as providers move from descriptive dashboards toward tools that forecast readmission and staffing risk well before it actually happens on the floor. India posts the quickest national growth at 15.4% on hospital digitisation funding and a deep domestic software talent pool.
Concentration sits at a moderate 42% for the top five, split between electronic health record incumbents bundling analytics into their core platform and specialist vendors selling depth those bundles cannot match at all. Two forces are reshaping the field right now. Payer risk-adjustment reporting requirements keep expanding in scope every year, and generative interfaces are letting clinical staff query data directly instead of waiting on a report request queue for days.
Market Definition
The healthcare business intelligence market covers software platforms and associated services that aggregate, analyse, and visualise clinical, operational, and financial healthcare data to support provider, payer, and life sciences decision-making. Electronic health record systems, medical imaging software, clinical trial management systems, and pure data storage or interoperability infrastructure sold separately from analytics are excluded.
Base Year Value
$9.6B in 2025 (MMA Primary Research Dataset, August 2026)
Forecast Period
2026 to 2036, eleven discrete annual values
CAGR
11.8% base case. Bull 13.0%. Bear 10.5%.
Fastest Growth Segment
Predictive and AI-Enabled Analytics: 16.9% CAGR
Fastest Growth Country
India: 15.4% CAGR
Fastest Growth Region
South Asia and Pacific: 13.8% CAGR
Largest Region
North America: 31% of 2025 global value
Market Leaders
Oracle Health, Epic Systems, IBM, Optum, SAS Institute. Source: MMA Analysis based on company disclosures.
Primary Survey
n=3,800 procurement and R&D decision-makers, Q4 2025, six countries
Methodology
Demand-side build-up, cross-validated against public data, 47 expert interviews

Healthcare Business Intelligence Market Forecast Scenarios

healthcare-business-intelligence-market-size-forecast-scenario-1787332149563
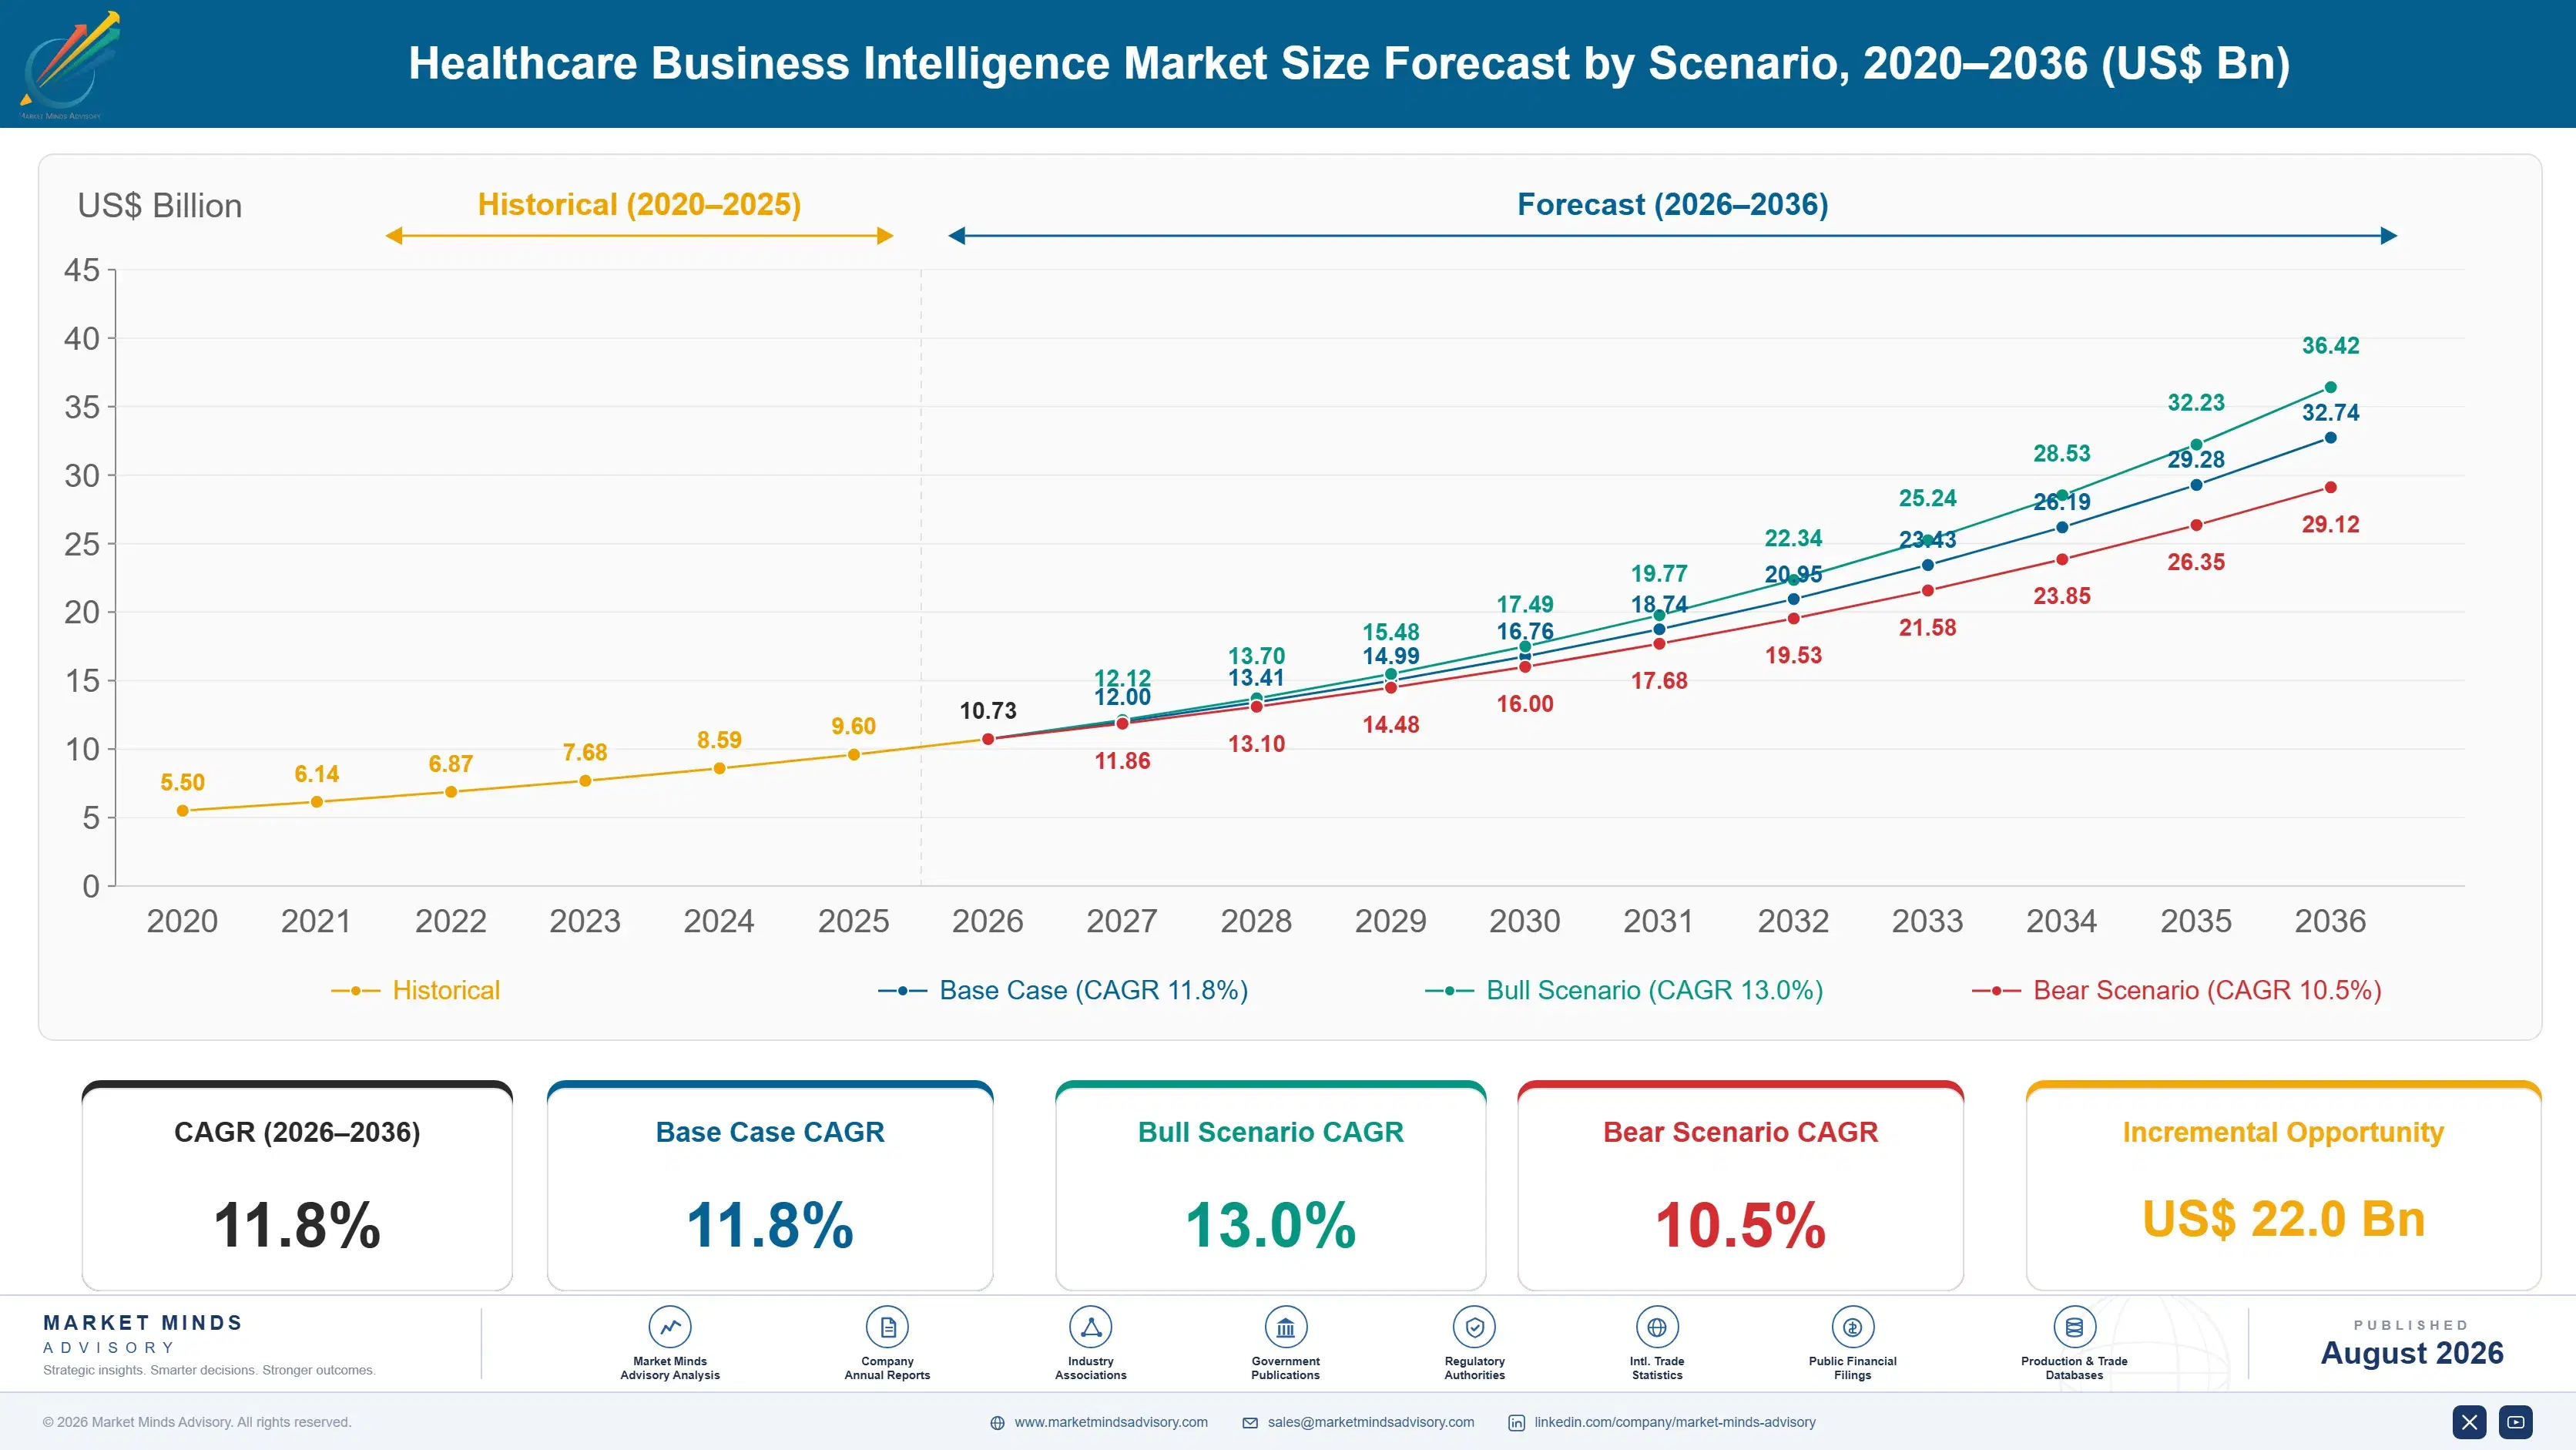
Growth from 2020 to 2025 compounded near 10.4%, accelerated sharply by pandemic-era reporting mandates that forced providers to stand up dashboards on short notice with whatever budget was already approved. Much of that early spending went toward compliance reporting rather than genuine decision support, and vendors spent the following years building the analytical depth that first wave skipped entirely.
Three mechanisms carry the base case to 11.8%. First, value-based contracting expansion, since every new risk-sharing arrangement requires outcome quantification no spreadsheet can credibly support at scale. Second, predictive analytics adoption, as providers move from reporting what happened toward forecasting readmission, staffing, and capacity risk before it materialises. Third, payer and life sciences demand, both of which run real-world evidence and risk-adjustment programmes that depend on the same underlying data infrastructure.
The bull case at 13.0% assumes value-based contracting expands faster than current payer roadmaps suggest and generative query interfaces drive faster clinical adoption across smaller hospital systems nationally. The bear case at 10.5% assumes hospital capital budgets tighten under margin pressure and payers slow risk-adjustment programme expansion during a period of political scrutiny over their underlying design.

Why The Contract Room Now Runs On Analytics

Three forces set demand. Value-based contracting provides the mandate, since a provider entering a risk-sharing arrangement needs defensible outcome measurement or the negotiation simply does not happen. Predictive capability provides the differentiation, as buyers increasingly favour platforms that forecast risk over ones that merely report history. And payer and life sciences demand adds a third, steadily growing revenue stream running parallel to the provider market.
MARKET CONCENTRATIONCR5: 42%Moderately concentrated between EHR incumbents and specialist analytics vendors
AVERAGE CONTRACT VALUEUSD 180,000 to 2.4 millionAnnual platform spend spanning community hospitals to large systems
TOP PRODUCING COUNTRY SHAREUnited States: about 46%Share of global healthcare analytics software revenue generated
DATA INTEGRATION COST SHAREAbout 34% of implementationPortion of deployment budget spent connecting source systems
HOSPITAL ADOPTION RATEAbout 68%Large hospital systems running a dedicated analytics platform today
CONTRACT RENEWAL CYCLE3 to 5 yearsTypical enterprise agreement length before formal reprocurement begins again
The commercial character is set by integration difficulty more than by analytical sophistication. Roughly 34% of implementation budget goes toward connecting fragmented source systems, electronic health records, billing platforms, and laboratory information systems that were never designed to share data cleanly. That is why Epic Systems and Oracle Health, both already embedded inside the hospital's core systems, hold an advantage no standalone analytics vendor can fully replicate through integration work alone.
The next decade turns on two things. Whether generative query interfaces genuinely reduce the specialist analyst dependency that has bottlenecked healthcare reporting for years, since that dependency is what analytics teams complain about most. And whether payers continue expanding risk-adjustment programme scope under the political scrutiny some of those programmes now face, since scope contraction would remove a meaningful share of forecast demand.
"Everyone bought a dashboard during the pandemic and called it business intelligence. What's happening now is different, hospitals are discovering that a dashboard nobody trusts is worse than no dashboard, and trust turns out to be an integration problem, not a visualisation one."
Director, Healthcare Analytics and Digital Health Practice · MMA Healthcare / An

Market Trends

Generative Query Interfaces Replace The Report Request Queue

Clinical and operational staff have historically had to submit a request to an analytics team and wait days for a custom report, and generative natural-language query interfaces are collapsing that wait into a direct conversation with the underlying data itself. Microsoft and several specialist vendors have shipped healthcare-tuned generative interfaces through 2024 and 2025 that translate plain-language questions into governed queries against clinical and financial data. Platforms offering this capability are winning renewal negotiations against incumbents still requiring analyst-built reports for every new question. Query latency, not dashboard aesthetics, is the differentiator buyers care about.
Market Impact: Value-based volume now exceeds 40%
Risk-Adjustment Reporting Scope Keeps Expanding Under CMS Rules

United States Centers for Medicare and Medicaid Services risk-adjustment and quality reporting requirements have broadened steadily, adding new measurement categories that providers must capture accurately or lose reimbursement adjustment eligibility entirely. Each expansion forces providers to extend their analytics platform's data model rather than treat compliance reporting as a one-time build, converting a project purchase into a standing subscription relationship. Vendors with pre-built regulatory content libraries, including Optum and SAS Institute, capture disproportionate share of this expansion because rebuilding reporting logic in-house is slower and riskier than buying it. Regulatory scope is the more reliable growth driver here.
Market Impact: Avoidance can offset 100% of cost

Market Opportunities and Growth Drivers

Value-Based Contracts Make Outcome Measurement Non-Negotiable

A provider entering a risk-sharing arrangement with a payer must demonstrate outcomes with data both sides trust, and spreadsheet-based reporting simply cannot support that credibly once real money moves against the numbers. Each new value-based contract signed effectively mandates an analytics platform purchase somewhere in the provider organisation, whether the contract itself specifies it or not. Major payers including UnitedHealth's Optum division have expanded risk-sharing arrangements steadily across primary care and specialty networks alike. That expansion is the single most reliable demand signal in the category, more predictable than technology adoption curves that analysts model separately.
Market Impact: Integration absorbs about 34% of bu

Predictive Models Now Justify Their Own Cost In Avoided Readmissions

Readmission prediction models have matured enough that health systems can measure avoided penalty cost directly against subscription price, turning a previously soft business case into a hard financial one finance committees actually approve. Hospitals face substantial Medicare readmission penalties under existing federal rules, and even a modest percentage reduction in preventable readmissions can offset a platform's entire annual cost. IBM and several specialist predictive analytics vendors have built case studies around exactly this calculation. That financial clarity is pulling budget away from purely descriptive reporting tools toward predictive ones specifically.
Market Impact: Usage often trails licenses by 40%

Market Restraints and Challenges

Fragmented Source Systems Inflate Integration Cost And Delay

Electronic health record, billing, laboratory, and departmental systems inside a typical hospital were procured across different decades from different vendors, and that history is the root cause of integration work absorbing roughly 34% of implementation budget before any analytical value is delivered. Commercially this means smaller hospital systems with limited information technology staff often abandon deployments partway through, having spent budget on connectivity with nothing yet to show a board. Vendors respond with pre-built connectors for the largest EHR platforms and phased rollouts delivering an early, narrower win before the full scope. Phased delivery is now standard practice.
Market Impact: Query wait time drops over 90%

Clinical Staff Distrust Analytics They Cannot Audit Directly

Physicians and nurses have been burned by dashboards built on data quality issues nobody flagged before the numbers reached a clinical meeting, and that history is the root cause of persistent scepticism toward any new analytics deployment regardless of the vendor's technical credentials. Commercially this shows up as low active usage well below what license counts would suggest, since a purchased seat nobody opens generates no renewal justification whatsoever. Vendors increasingly build data lineage and explainability features letting a clinician trace a number to its source record. Transparency is becoming a genuine purchasing criterion rather than a nice addition.
Market Impact: CMS expanded reporting scope in 202
3 additional market trends, 4 additional growth drivers, and 2 additional restraints and challenges are covered in the full report. Contact sales@marketmindsadvisory.com to access the complete intelligence.

Segment CAGR and Growth Architecture

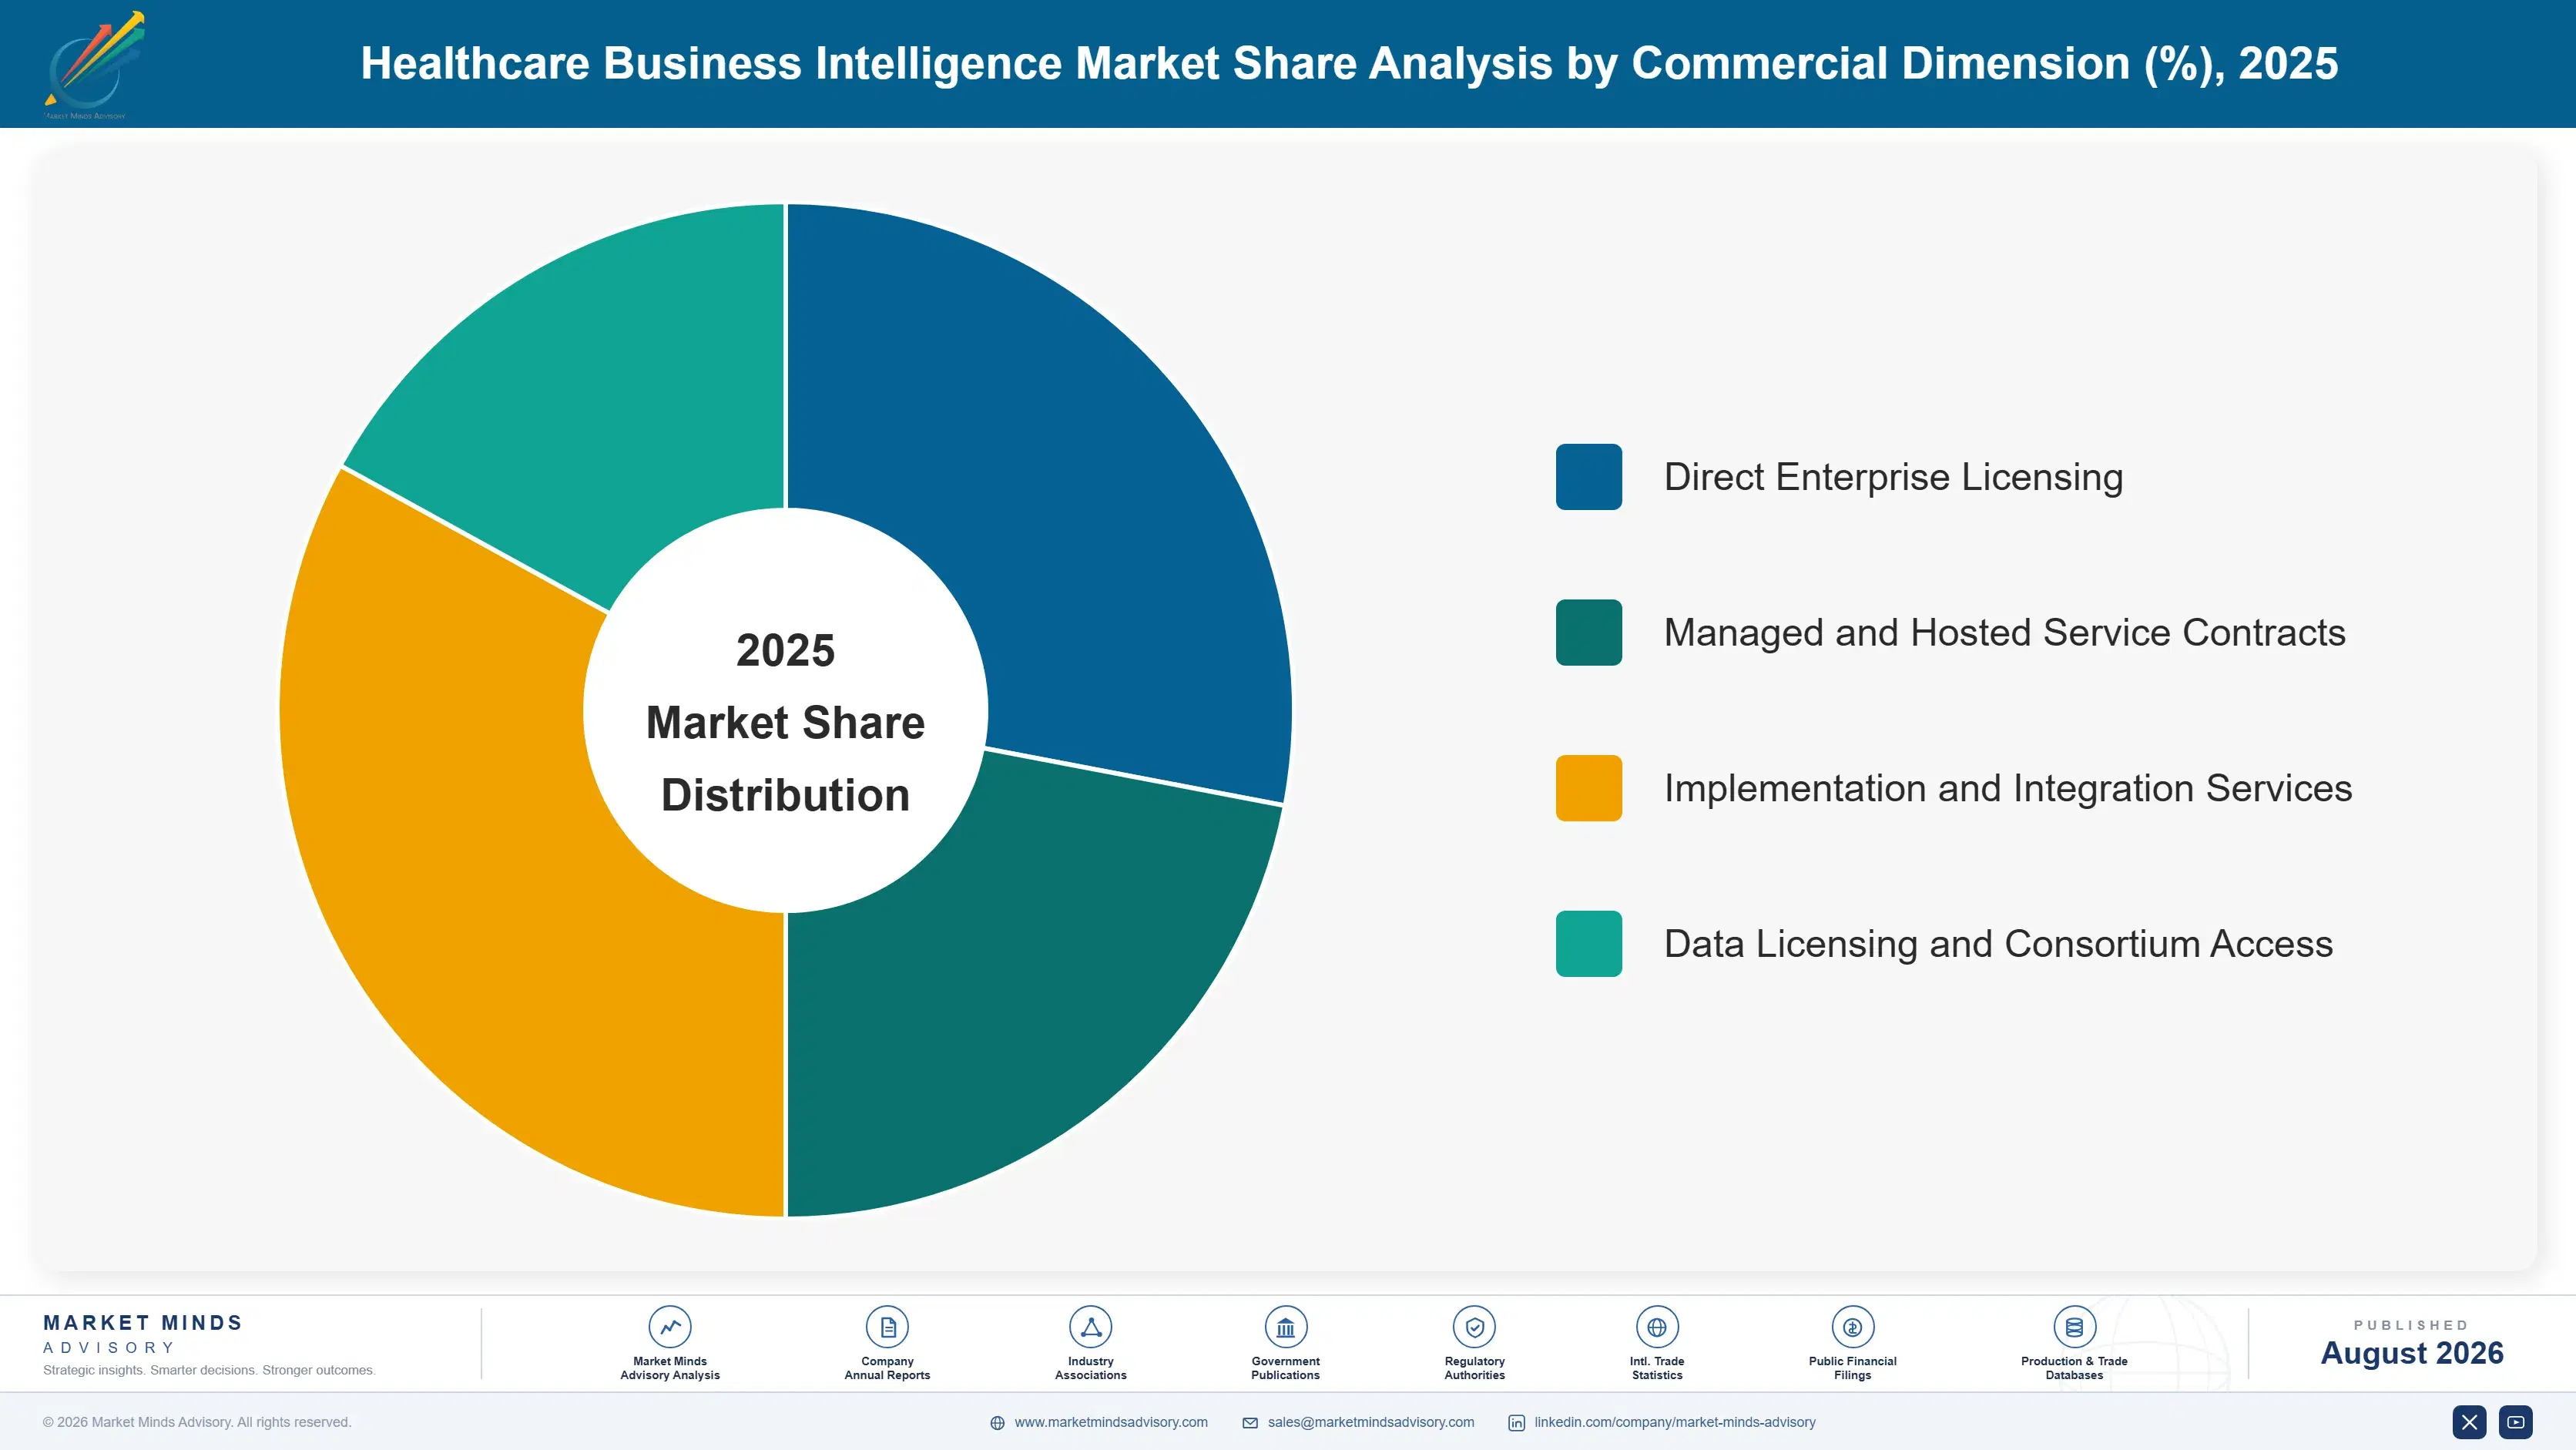
Segmentation follows software function, a single logic describing what the platform actually does with healthcare data rather than who buys it or which department uses it. Each function carries its own buyer, pricing model, and competitive set, so commercial position tracks capability rather than the end customer segment served. End-use industry and commercial channel appear separately within the framework.
healthcare-business-intelligence-market-market-share-analysis-1787332150103

Predictive and AI-Enabled Analytics

Predictive and AI-enabled analytics grow fastest at 16.9%, about 1.43 times the overall 11.8% rate, covering readmission risk models, staffing and capacity forecasting, and generative natural-language query interfaces layered on top of clinical and operational data. Financial justification has matured considerably, since avoided readmission penalties now offset subscription cost directly in a way finance committees find credible rather than speculative. IBM, Health Catalyst, and several specialist vendors compete here alongside generative interface entrants including Microsoft's healthcare cloud division. Adoption still concentrates among larger systems with the data science capacity to validate model outputs before trusting them clinically, which limits near-term penetration among smaller community hospitals despite genuine demand across the segment broadly.
CAGR 16.9%

Descriptive and Operational Reporting

Descriptive and operational reporting grows at 8.4%, the largest segment by installed base though no longer the fastest, covering standard dashboards for financial performance, patient flow, staffing, and regulatory compliance reporting that most hospitals adopted first. Growth has slowed as the segment matures and buyers increasingly treat baseline reporting as table stakes bundled with a broader platform rather than a standalone purchase decision. Oracle Health and Epic Systems both bundle strong descriptive reporting directly into their core electronic health record platforms, which pressures standalone reporting vendors toward the predictive segment where differentiation still commands premium pricing. This segment remains the revenue floor underneath the category even as growth concentrates elsewhere across the newer functions.
CAGR 8.4%
Full segment breakdown across 6 segments available in the complete report.

Regional Architecture and Country Demand Map

Regulatory reporting mandates and health system digital maturity together set this distribution more than raw healthcare spending does. North America leads on value-based contracting depth and CMS reporting scope, while share elsewhere tracks how far each system has moved past paper and spreadsheet-based reporting toward genuine platform adoption.

North America

Value-based contracting depth makes North America the largest market at 31% share, since United States providers negotiating risk-sharing arrangements with Medicare Advantage and commercial payers need outcome measurement infrastructure the rest of the world has not yet mandated at comparable scale. CMS risk-adjustment and quality reporting requirements expand almost every year, converting compliance obligation directly into platform demand across thousands of participating hospitals nationally. Canadian provincial health systems adopt more cautiously, prioritising operational reporting over predictive analytics given more centralised, single-payer funding structures. Epic Systems and Oracle Health both maintain deep domestic implementation networks that smaller vendors struggle to match at scale. Growth of 12.8% tracks value-based contracting expansion closely across the payer landscape.
Share: 31% | CAGR: 12.8% (2026 to 2036)

Western Europe

National health systems rather than competitive contracting shape adoption across Western Europe's 22% share, with the National Health Service and German statutory insurers funding analytics primarily for population health management and capacity planning rather than risk-contract negotiation as in America. Nordic countries lead on data infrastructure maturity, having invested early in national health data registries that analytics vendors now build directly on top of. French and Italian adoption lags behind on fragmented regional procurement processes that slow platform standardisation considerably across each country. SAP and homegrown European vendors compete alongside American entrants for public tender contracts specifically. Growth of 10.3%, the slowest of the seven, reflects centralised budget cycles that move more slowly than commercial contracting timelines allow elsewhere.
Share: 22% | CAGR: 10.3% (2026 to 2036)
Regional intelligence for 5 additional markets available in the complete report: East Asia, South Asia and Pacific, Latin America, Middle East and Africa, Eastern Europe. Contact sales@marketmindsadvisory.com.
healthcare-business-intelligence-market-country-cagr-analysis-1787332150614

Where Healthcare Analytics Vendors Actually Win Renewals

Winning the first sale on dashboard aesthetics does not survive a renewal cycle once clinical staff stop trusting the numbers on screen in front of them. The four moves below shift revenue toward positions a competitor's better-looking demo cannot easily displace: integration depth, predictive financial justification, data trust features, and regulatory content libraries maintained continuously over time.

Build Pre-Built Connectors For Major EHR Platforms

Roughly 34% of implementation budget goes toward connecting fragmented source systems, and vendors offering pre-built, validated connectors for Epic, Oracle Health, and other major electronic health record platforms cut that cost and timeline substantially compared with custom integration work built from nothing. That reduction directly shortens sales cycles, since a hospital chief information officer can budget deployment with real confidence rather than the wide contingency a custom project demands. Health Catalyst has built meaningful competitive position specifically around this integration depth. Connector breadth is becoming as important competitively as analytical depth itself in most buyer evaluations now.
Market Impact: Pre-built connectors cut roughly 34

Quantify Predictive Value In Avoided Penalty Terms

Readmission prediction models justify their cost far more easily once a vendor can show a hospital finance committee the penalty a 10% reduction in preventable readmissions would avoid under existing Medicare rules. That reframes procurement from a soft clinical quality argument into a hard financial return calculation finance leadership actually signs off on quickly. Vendors building this calculation directly into their sales materials close faster than competitors relying on generic quality improvement claims that finance committees discount heavily. IBM has structured its predictive case studies explicitly around this exact framing.
Market Impact: Avoided penalties can exceed 100% o

Ship Data Lineage Features Clinical Staff Can Audit

Active usage often trails purchased license counts by roughly 40%, and low usage is the single strongest predictor of a lost renewal regardless of how sophisticated the underlying analytics actually are technically. Data lineage features that let a clinician trace any number back to its source record directly address the trust deficit driving that low usage more effectively than additional dashboard polish ever could. Vendors building explainability into the core product, rather than treating it as an add-on module, are winning renewal negotiations against competitors still selling on visual design alone. Trust, once lost, is expensive to rebuild.
Market Impact: Usage gaps run near 40% below purch

Maintain Regulatory Content Libraries As A Standing Service

CMS risk-adjustment and quality reporting requirements expanded in 4 of the last 5 years, and providers rebuilding compliance reporting logic internally after each change fall behind vendors who maintain pre-built regulatory content libraries as a continuously updated service rather than a one-time delivery. That maintenance work converts what could be a project-based purchase into a standing subscription relationship with genuine switching cost attached to it directly. Optum and SAS Institute both capture disproportionate share of regulatory expansion specifically because rebuilding this logic in-house is slower and riskier than buying it outright.
Market Impact: CMS added new measures in 4 of 5 ye

Who Controls the Margin Pool

Concentration is moderate: the top five hold roughly 42% of revenue, split between electronic health record incumbents bundling analytics into their core platform and specialist vendors selling depth those bundles cannot match. The gap between leaders and challengers is integration depth and regulatory content breadth rather than raw analytical sophistication, which is comparatively widely distributed. All participants are assessed on one basis, annual recurring software revenue from healthcare
Competition runs along three lines. First, integration depth, since pre-built connectors for major EHR platforms cut deployment cost and timeline substantially against custom work. Second, predictive financial justification, as buyers increasingly demand a hard return calculation rather than a soft quality argument before signing. Third, data trust and explainability features, since low active usage against purchased licenses is the strongest predictor of a lost renewal.

Pressure is building from two directions. EHR incumbents including Epic Systems and Oracle Health keep expanding bundled analytics capability, squeezing standalone reporting vendors toward the predictive segment where differentiation still commands premium pricing. Meanwhile generative interface entrants, including Microsoft, are attacking the analyst-dependency bottleneck directly. Rankings should favour vendors combining deep integration with genuine predictive capability.
healthcare-business-intelligence-market-company-positioning-matrix-1787332151135

Competitive Moat and Risk Dimensions

EPIC SYSTEMS

Moat: Embedded EHR data advantage

Epic Systems already holds clinical data for a large share of American hospital admissions inside its own electronic health record, giving bundled analytics a data access advantage standalone vendors must build through integration instead. Its Cosmos research network aggregates de-identified data at a scale few competitors match. Deep workflow integration also drives higher active usage than bolt-on tools typically achieve.
EPIC SYSTEMS

Risk: Depth trails specialist platforms

Epic's bundled analytics prioritise breadth across its client base over the predictive depth specialist vendors including IBM and Health Catalyst offer to sophisticated buyers. Hospitals running non-Epic electronic health records cannot access these tools at all, which caps addressable market regardless of product quality. Its pricing power also draws regulatory and customer scrutiny that smaller vendors mostly avoid.
ORACLE HEALTH

Moat: Cloud infrastructure and EHR combination

Oracle Health combines its acquired electronic health record base with Oracle's broader cloud infrastructure and database capability, giving it technical depth for large-scale predictive workloads pure-play analytics vendors cannot easily replicate. Existing enterprise relationships across hospital IT departments provide distribution new entrants must build from nothing. Continued investment in generative healthcare interfaces extends this advantage further.
ORACLE HEALTH

Risk: Post-acquisition integration friction

Integrating the acquired electronic health record platform with Oracle's existing cloud and analytics stack has taken longer than initially communicated, and some clients have expressed frustration over roadmap delays publicly. Specialist vendors move faster on point solutions while Oracle manages a broader integration agenda. Client trust rebuilding after the acquisition remains an ongoing task the company has not fully completed.

Players Tracked

Prominent Players

Oracle Health
Epic Systems
IBM
Optum
SAS Institute

Other Key Players

Health Catalyst
Cerner
Microsoft
SAP
MedeAnalytics
Innovaccer
Qlik
Tableau
Arcadia
Wolters Kluwer
Change Healthcare
Clarify Health Solutions
Syntellis Performance Solutions
Premier Inc
Dimensional Insight

Recent Developments

MARCH 2025

Innovaccer launches generative healthcare query assistant

Innovaccer launched a generative artificial intelligence assistant enabling clinical and operational staff to query its healthcare data platform using natural language rather than submitting requests to an analytics team. This was a product launch rather than an acquisition or partnership, targeting the analyst-dependency bottleneck slowing self-service reporting for years.
Signal: Generative interfaces are moving quickly f
SEPTEMBER 2024

Optum expands risk-adjustment analytics for Medicare Advantage plans

Optum expanded its risk-adjustment analytics capability specifically for Medicare Advantage health plan customers, adding new predictive risk scoring models ahead of updated federal reporting requirements. This was an organic product expansion rather than an acquisition, strengthening its position among payers navigating an increasingly complex regulatory reporting landscape.
Signal: Payer-side analytics expansion often prece
JANUARY 2025

Oracle Health acquires clinical predictive analytics startup

Oracle Health completed an acquisition of a smaller clinical predictive analytics startup, integrating its readmission and deterioration risk models into the broader Oracle Health platform directly. This was a confirmed acquisition rather than a licensing or partnership arrangement, adding predictive depth Oracle's bundled analytics had lacked relative to specialist competitors.
Signal: Large platform vendors are increasingly bu

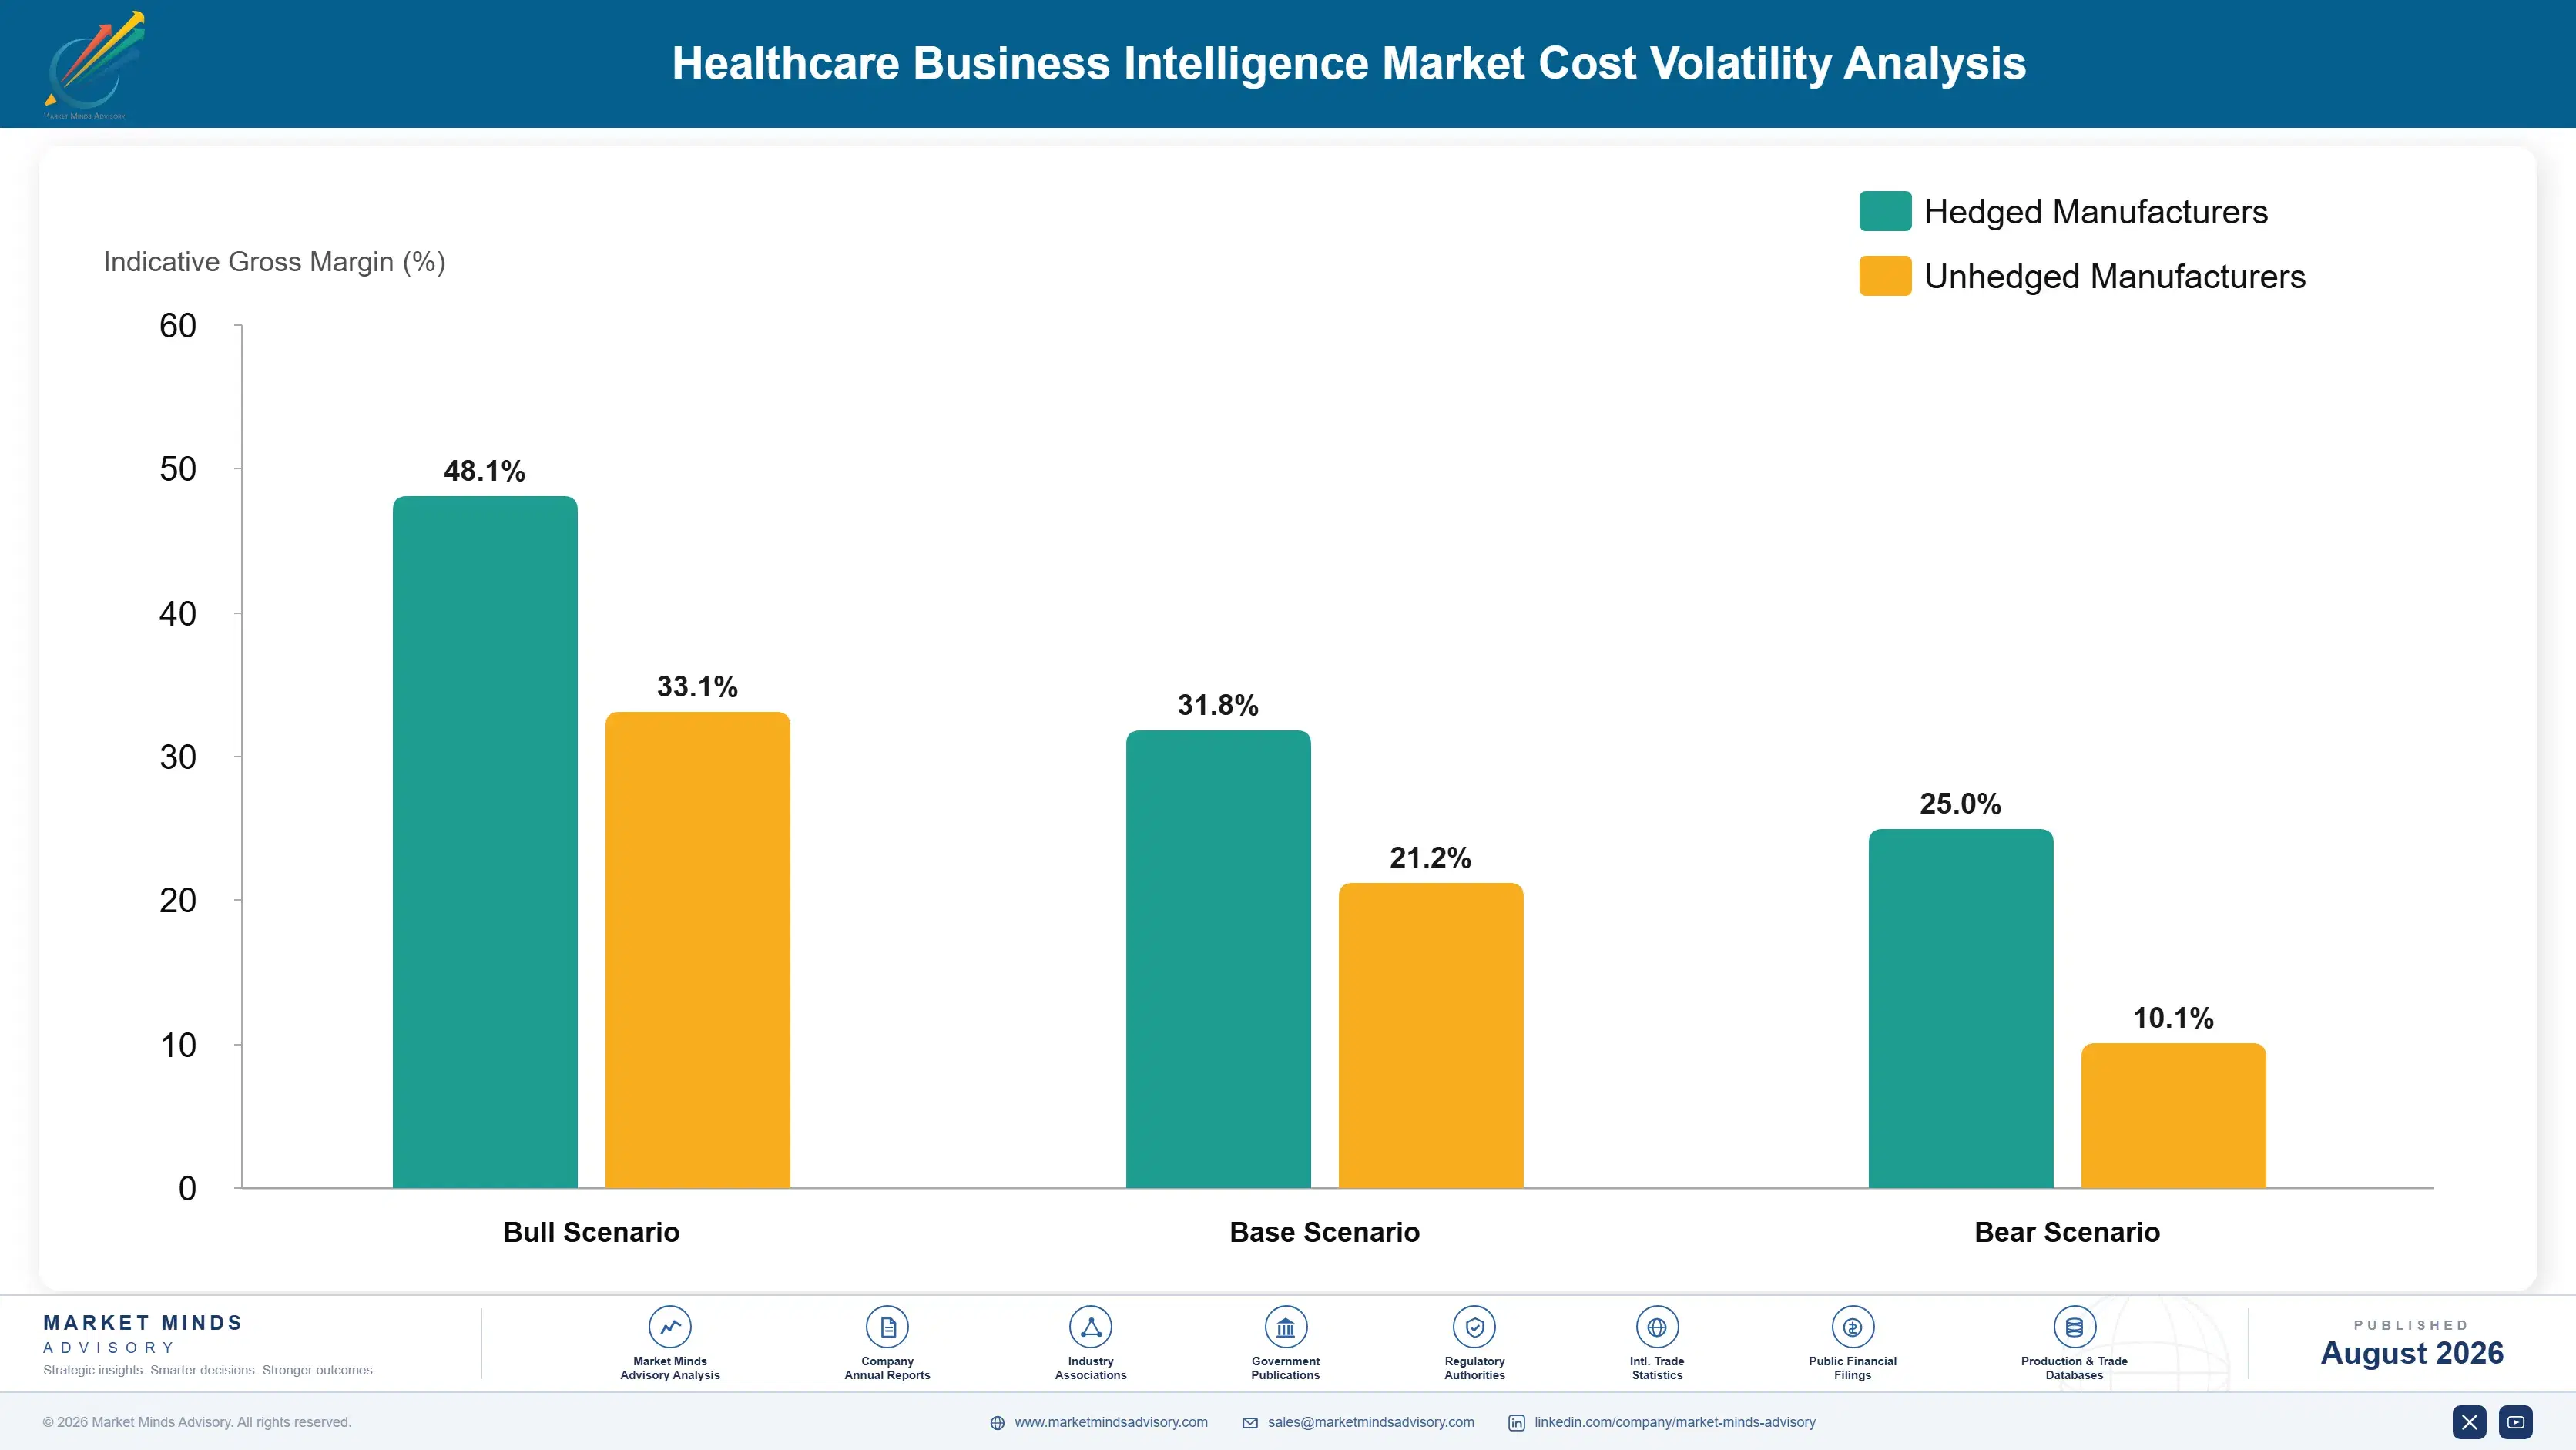
Cloud Compute, Integration Labour, Data Licensing

Cloud compute and storage infrastructure accounts for roughly 22% to 28% of cost of goods sold, scaling with the volume of clinical data a platform ingests continuously. Integration and implementation labour takes a further 30% to 38%, reflecting the specialist engineering time fragmented hospital source systems require. Third-party data licensing, including claims and social determinants datasets, contributes 10% to 16%, with the remainder covering compliance and customer support.
Cloud compute pricing rose materially through 2022 and 2023 as generative AI workloads across every industry competed for the same graphics processing capacity, and healthcare analytics vendors running large predictive models absorbed higher infrastructure bills. Microsoft's annual report disclosed capacity constraints affecting cloud customers broadly across that window, and several vendors publicly delayed generative feature rollouts citing compute availability as the limiting factor rather than model readiness.

Exposure varies by deployment architecture and client mix. Vendors running multi-tenant cloud infrastructure absorb compute volatility across their full client base and smooth pricing more easily than those running dedicated single-tenant deployments for large systems with strict data residency requirements. Vendors serving smaller community hospitals face tighter margin pressure, since those clients cannot absorb price increases as readily as large systems with more negotiating leverage.
healthcare-business-intelligence-market-cost-volatility-analysis-1787332151330

Negotiate multi-year committed-use cloud agreements

Locking in committed-use discounts with major cloud providers ahead of demand spikes protects margin against the kind of compute price volatility that affected the industry through 2022 and 2023, though it requires accurate multi-year capacity forecasting that smaller vendors often lack the scale or confidence to commit to properly without overcommitting budget in a downturn.

Build reusable integration accelerators across common EHR platforms

Standardising connector logic for Epic, Oracle Health, and other widely deployed electronic health record platforms reduces the specialist engineering labour each new implementation requires, converting a largely custom cost into a mostly repeatable one that scales more efficiently across a growing client base over successive deployments and renewal cycles alike, without adding proportional headcount each time.

License data through consortium arrangements rather than individually

Several vendors have begun pooling data licensing costs through healthcare consortium arrangements that spread third-party dataset expense across multiple participants, reducing the per-vendor licensing burden that smaller specialist analytics companies otherwise struggle to absorb profitably at their current client scale without raising subscription prices sharply enough to protect their existing margin position meaningfully year over year.

Portfolio Architecture for Margin Defence

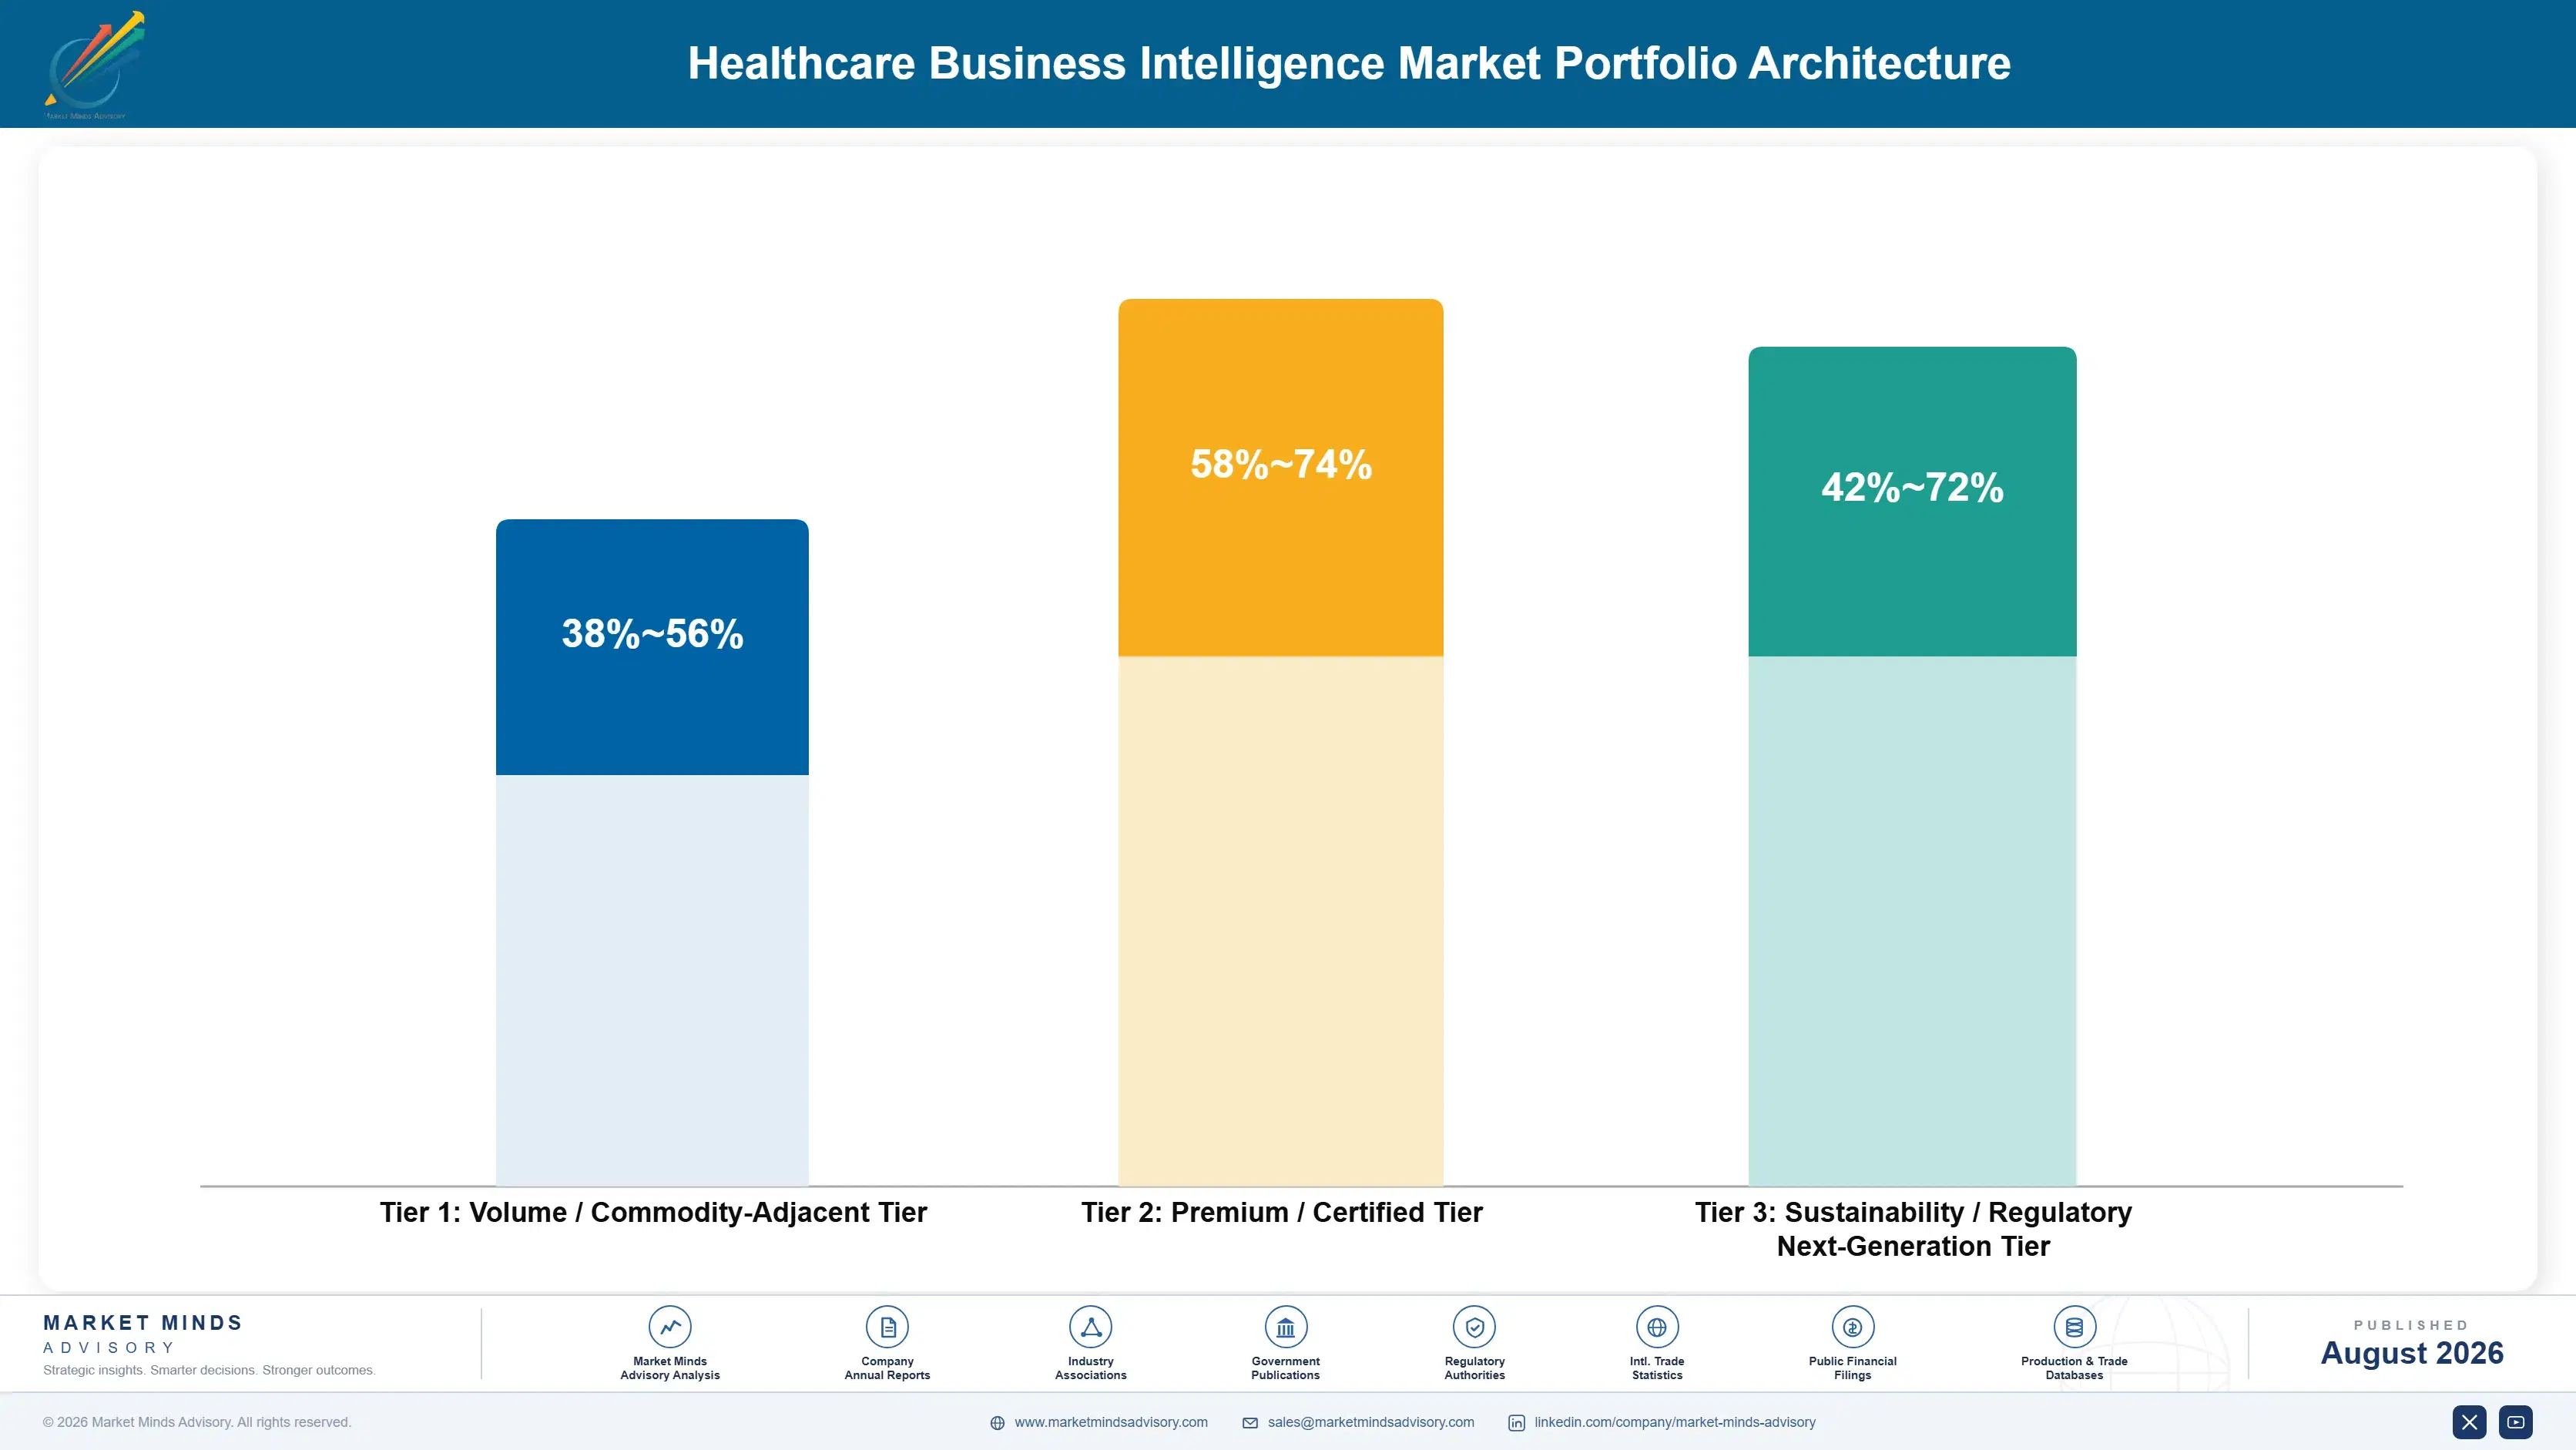
The portfolio splits into three tiers with sharply different economics. Descriptive and operational reporting forms the volume tier, increasingly bundled and priced as table stakes rather than a standalone differentiator. Predictive and regulatory-compliant platforms earn more because financial justification and switching cost both resist the commoditisation pressure hitting basic reporting. Generative query capability sits differently again, priced against analyst labour displaced rather than d
The tension runs between defending the reporting relationship that got a vendor in the door and building the predictive capability that keeps them there at renewal. A vendor that never moves past descriptive reporting eventually loses to a bundled EHR incumbent offering the same thing for less, yet building predictive capability requires investment a pure reporting business rarely funds adequately. Vendors handling this well treat descriptive reporting as the acquisition product and predictive analytics as the expansion revenue.

High-value pools concentrate where switching cost, regulatory content, or predictive accuracy limit competition: risk-adjustment reporting with maintained content libraries, predictive models with demonstrated financial return, and generative interfaces genuinely reducing analyst dependency. Basic descriptive dashboards sit at the other end, competing almost entirely on price against bundled EHR offerings that arrive at effectively no marginal cost.

Volume / Commodity-Adjacent Tier

Descriptive and operational reporting dashboards increasingly bundled into core EHR platforms at no separate charge to the buying hospital. Margin compresses steadily as bundling spreads across the largest hospital systems nationally.
Gross Margin: 38-56%

Premium / Certified Tier

Predictive analytics and risk-adjustment reporting platforms with maintained regulatory content libraries and demonstrated financial return calculations for finance committees. Margin reflects genuine switching cost once embedded into live compliance workflows.
Gross Margin: 58-74%

Sustainability / Regulatory / Next-Generation Tier

Generative query interfaces and next-generation predictive models still proving their return against analyst labour cost directly to buyers. The wide range reflects early-stage pricing uncertainty across most vendors currently in market.
Gross Margin: 42-72%
healthcare-business-intelligence-market-portfolio-architecture-1787332151833

High-value Sub-segments and Strategic Watch-out

Predictive and AI-Enabled Analytics

High value and high growth at 16.9%, the fastest function, as avoided readmission penalties give buyers a hard financial justification finance committees actually approve quickly and without much internal debate. Adoption still concentrates among larger systems with data science capacity to validate model outputs properly.
Gross Margin: 58-76%

Risk-Adjustment and Regulatory Reporting

High value with strong growth at 13.2%, driven by CMS reporting scope expansion converting compliance obligation directly into standing subscription revenue for vendors maintaining current content libraries continuously across the calendar year. Maintained content libraries create switching cost few competitors can quickly replicate at comparable quality or price.
Gross Margin: 58-74%

Descriptive and Operational Reporting

The volume core by installed base, growing at 8.4% as baseline dashboards for financial and operational performance become table stakes bundled with broader EHR platforms at no separate charge to the buyer. Standalone vendors face steady pressure from incumbents bundling this capability for free across most contracts signed.
Gross Margin: 38-56%

Generative Query and Self-Service Analytics

The strategic watch-out, growing at 9.6% today but with uncertain long-term pricing as natural-language interfaces still prove their value against analyst labour cost directly to finance leadership evaluating the case. Early results are promising but the business case remains unsettled across most buyer segments still evaluating it.
Gross Margin: 42-70%

How Healthcare Analytics Revenue Actually Compounds

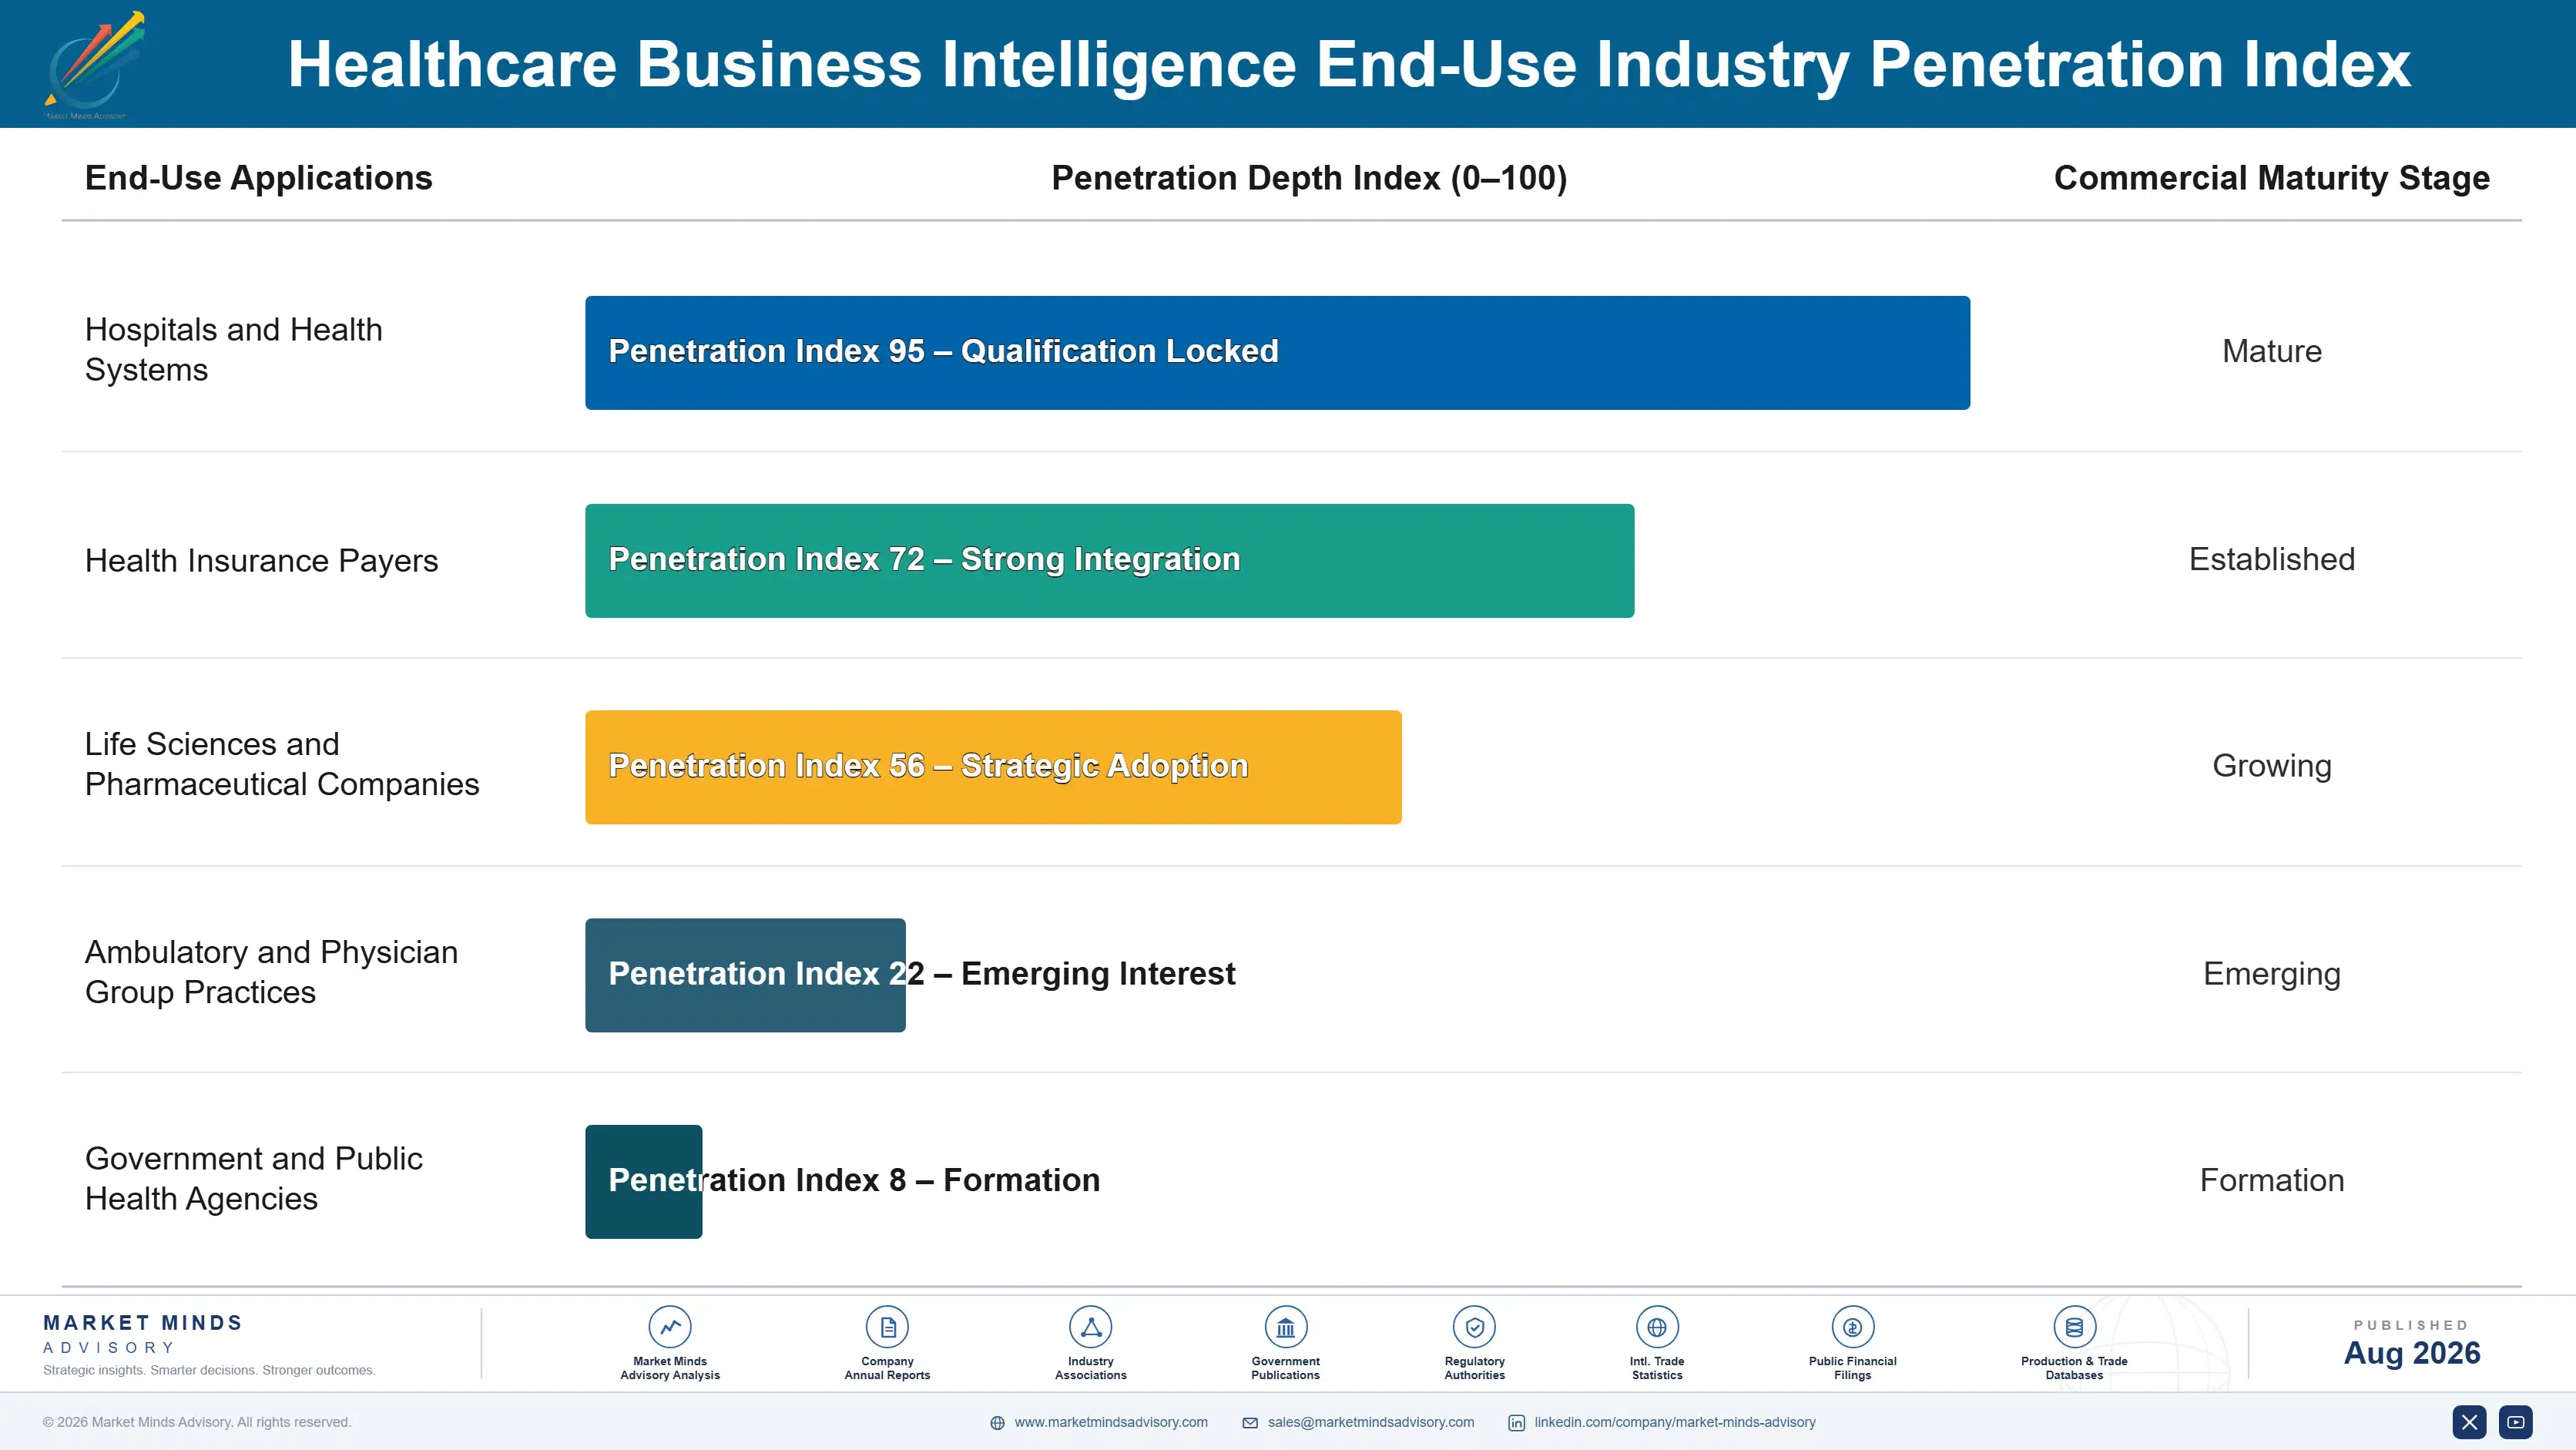
Revenue depends on a platform becoming embedded in workflows that are expensive to unwind, not on winning the initial evaluation. A risk-adjustment reporting platform a compliance team relies on for a live payer contract cannot be swapped out mid-cycle without genuine regulatory risk, so annuity value sits in that dependency rather than the original purchase decision. Predictive models compound similarly, since retraining a replacement model on a new vendor's platform takes months a health syste
Adoption stickiness varies sharply by end-use vertical. Regulatory and risk-adjustment reporting sticks hardest, since switching mid-contract-cycle genuinely risks reimbursement continuity no finance leader will approve lightly. Predictive clinical models stick nearly as hard once validated, because clinicians who trust a model's output resist retraining that trust from scratch. Descriptive reporting switches most readily, since baseline dashboards carry little embedded workflow dependency to defend.

Buyer profiles have shifted generationally. Chief information officers who once drove procurement on technical criteria increasingly share that decision with chief financial officers focused on contract performance and chief medical officers demanding clinical explainability before trusting any model. Younger clinical staff also expect natural-language query capability by default, reshaping evaluation criteria well beyond what procurement teams specify formally today.
healthcare-business-intelligence-market-end-use-penetration-index-1787332152322

Our Call On Healthcare Business Intelligence

These are among the four positions where our research anticipates prominent divergence between winners and laggards over the coming forecast period. Each is grounded in the demand model, the regulatory perimeter, and the announced capacity pipeline.
01 / INTEGRATION DEPTH WINS

Pre-built connectors decide the sales cycle

Roughly 34% of implementation budget goes toward connecting fragmented hospital source systems, and vendors offering validated, pre-built connectors for Epic, Oracle Health, and other major platforms cut that cost and timeline substantially against custom integration work. That reduction shortens sales cycles directly, since a hospital chief information officer can budget deployment with genuine confidence rather than wide contingency. Vendors should treat connector breadth as a core product investment rather than a services afterthought, because it now decides competitive evaluations as much as analytical sophistication does.
02 / FINANCIAL PROOF CLOSES DEALS

Avoided penalties turn quality into finance language

Readmission prediction models justify cost far more easily once a vendor shows a finance committee the specific penalty amount a percentage reduction in preventable readmissions would avoid under existing Medicare rules, reframing procurement from a soft clinical quality argument into a hard return calculation finance leadership signs off on quickly rather than deferring indefinitely. Vendors building this calculation directly into sales materials close faster than competitors relying on generic quality claims. Financial framing, not clinical framing, is what actually moves budget committees.
03 / TRUST DETERMINES RENEWAL

Unused licenses are the clearest churn signal

Active usage often trails purchased licenses by roughly 40%, and low usage is the single strongest predictor of a lost renewal regardless of how sophisticated the underlying analytics actually are technically speaking. Data lineage features letting clinicians trace any number back to its source record address the trust deficit driving that low usage more directly than additional dashboard polish ever could achieve alone. Vendors building explainability into the core product, not as an add-on module, are winning renewals against competitors selling on design alone.
04 / REGULATORY CONTENT COMPOUNDS

Maintained libraries convert projects into annuities

CMS risk-adjustment and quality reporting requirements expand most years, and providers rebuilding compliance logic internally after each change fall behind vendors maintaining regulatory content libraries as a continuously updated service rather than a one-time delivery. That maintenance work converts what could be a project-based purchase into a standing subscription relationship carrying genuine switching cost. Vendors should invest in regulatory tracking capability as seriously as they invest in core analytics, since it is what actually protects the renewal base against determined competitive pressure.

Engagement Snapshot From the Field

A live engagement with an industry participant carrying material or product regulatory and market exposure ahead of a defining policy shift, showing how our research translates into a defensible multi-year portfolio strategy.
MARKET MINDS ADVISORY · CLIENT ENGAGEMENT SUMMARY
Healthcare Business Intelligence Producer Strategic Portfolio Review and Transition Roadmap 2026·Investment Scenario on Healthcare Business Intelligence Exposure Evaluation 2025-26
CLIENT PROFILE
A regional hospital network operating twelve facilities across three states engaged MMA while evaluating analytics platforms to support newly signed Medicare Advantage risk-sharing contracts. The client reported annual net patient revenue near USD 2.8 billion, with existing reporting infrastructure built almost entirely on internal spreadsheets and a legacy business intelligence tool nearing end of vendor support (client-reported, unverified by MMA).
STRATEGIC CHALLENGE
Leadership needed outcome measurement infrastructure credible enough to support active risk-sharing negotiation within eighteen months, but internal information technology staff lacked the integration bandwidth to evaluate more than a handful of vendors properly. Board pressure to avoid another failed platform deployment after a previous vendor relationship ended poorly added further urgency to the selection process.
MMA APPROACH
MMA benchmarked five shortlisted vendors against the network's specific EHR environment, weighting integration timeline and pre-built connector availability heavily given the client's limited internal staffing capacity. We modelled avoided readmission penalty value against each vendor's proposed pricing to build the finance committee business case directly. We then assessed data lineage and explainability features against the clinical trust concerns leadership raised repeatedly.
KEY FINDINGS
  1. Two of five shortlisted vendors lacked validated connectors for the client's specific EHR version, adding an estimated seven months to deployment timelines.
  2. Modelled avoided readmission penalty value exceeded the leading vendor's annual subscription cost by roughly 60% within two years (client-reported, unverified by MMA).
  3. The previous failed deployment had achieved active usage rates below 30% of purchased licenses, driven almost entirely by data trust concerns among clinical staff.
  4. A vendor with strong data lineage features scored highest on projected clinical adoption despite carrying a moderately higher subscription price than competitors.
CLIENT PROFILE
A regional hospital network operating twelve facilities across three states engaged MMA while evaluating analytics platforms to support newly signed Medicare Advantage risk-sharing contracts. The client reported annual net patient revenue near USD 2.8 billion, with existing reporting infrastructure built almost entirely on internal spreadsheets and a legacy business intelligence tool nearing end of vendor support (client-reported, unverified by MMA).
STRATEGIC CHALLENGE
Leadership needed outcome measurement infrastructure credible enough to support active risk-sharing negotiation within eighteen months, but internal information technology staff lacked the integration bandwidth to evaluate more than a handful of vendors properly. Board pressure to avoid another failed platform deployment after a previous vendor relationship ended poorly added further urgency to the selection process.
MMA APPROACH
MMA benchmarked five shortlisted vendors against the network's specific EHR environment, weighting integration timeline and pre-built connector availability heavily given the client's limited internal staffing capacity. We modelled avoided readmission penalty value against each vendor's proposed pricing to build the finance committee business case directly. We then assessed data lineage and explainability features against the clinical trust concerns leadership raised repeatedly.
KEY FINDINGS
  1. Two of five shortlisted vendors lacked validated connectors for the client's specific EHR version, adding an estimated seven months to deployment timelines.
  2. Modelled avoided readmission penalty value exceeded the leading vendor's annual subscription cost by roughly 60% within two years (client-reported, unverified by MMA).
  3. The previous failed deployment had achieved active usage rates below 30% of purchased licenses, driven almost entirely by data trust concerns among clinical staff.
  4. A vendor with strong data lineage features scored highest on projected clinical adoption despite carrying a moderately higher subscription price than competitors.
RECOMMENDED STRATEGY
Phase 1: Phase 1 (0 to 4 months): Narrow the shortlist to vendors with validated connectors for the client's exact EHR version and configuration. Phase 2: Phase 2 (4 to 14 months): Deploy in phases, starting with risk-adjustment reporting tied directly to the signed Medicare Advantage contract. Phase 3: Phase 3 (14 to 24 months): Expand into predictive readmission modelling once clinical staff trust in the platform's core reporting is established.
OUTCOME
The client selected the vendor with the strongest data lineage features and signed within the recommended fourteen-month deployment window for phase one. Early clinical adoption data showed usage rates well above the previous platform's historical performance, validating the trust-first selection criteria (client-reported, unverified by MMA).

Frequently Asked Questions

Foundational context covering the market sizes, CAGR, scope, country, region and competition that inform every finding below. This section is provided to cover basics and most often pre-purchase conversations, answered from the MMA Primary Research Dataset.

What is the current size of the Healthcare Business Intelligence Market?

The global healthcare business intelligence market is valued at USD 9.6 billion in 2025, covering analytics platforms for provider, payer, and life sciences decision-making. Electronic health record licensing and pure data infrastructure are excluded.

How large will the Healthcare Business Intelligence Market be by 2036?

The market is forecast to reach USD 32.74 billion by 2036 in the base case, about 3.05 times the 2026 level. That represents incremental value of roughly USD 22.01 billion across the decade.

What is the CAGR for the Healthcare Business Intelligence Market 2026 to 2036?

The market grows at an 11.8% CAGR in the base case, with bull and bear scenarios at 13.0% and 10.5%. The spread turns mainly on value-based contracting expansion and hospital capital budgets.

Which segment is growing fastest?

Predictive and AI-enabled analytics grow fastest at 16.9%, about 1.43 times the overall rate, as providers move from descriptive dashboards toward readmission and staffing risk forecasting. Risk-adjustment reporting follows at 13.2%.

Who are the major companies in the Healthcare Business Intelligence Market?

Leading companies include Oracle Health, Epic Systems, IBM, Optum, and SAS Institute. Concentration is moderate, with the top five holding roughly 42% of category revenue combined.

Which country is growing fastest?

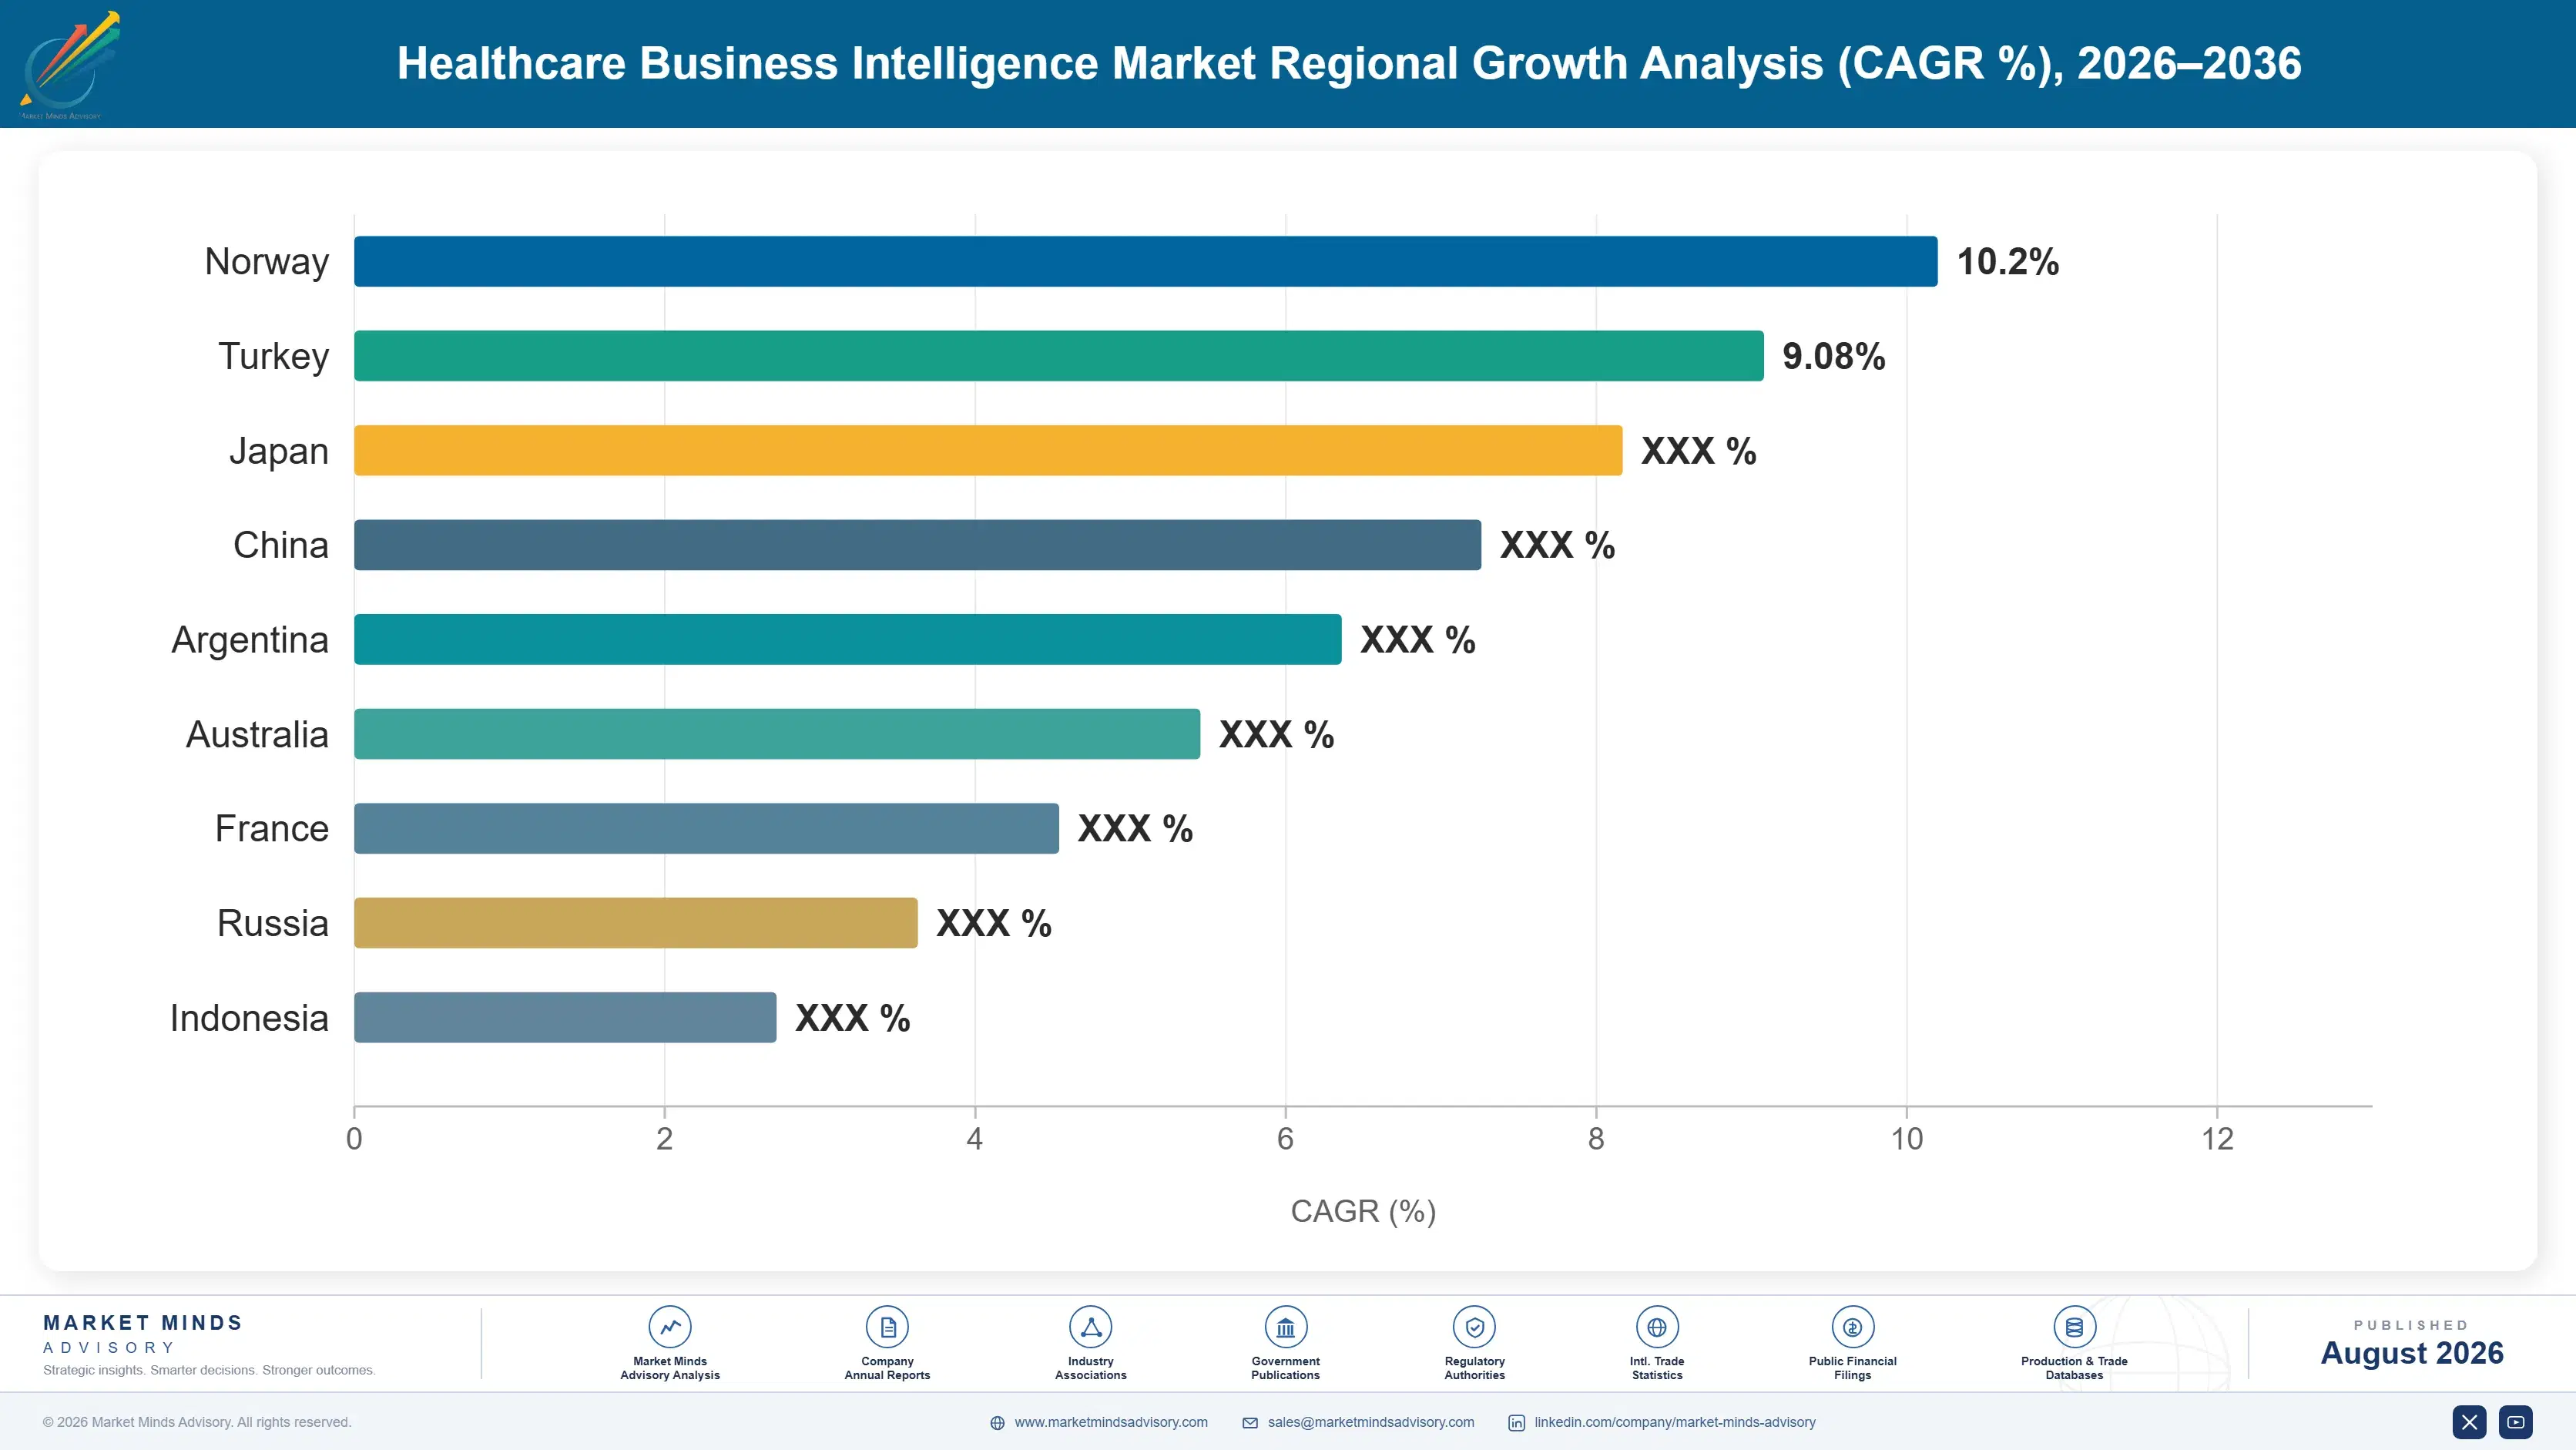
India grows fastest at a 15.4% CAGR, on hospital digitisation funding under national health mission programmes and a deep domestic software talent pool. China follows closely on hospital grading mandates.

Report Segmentation Architecture

The full report scope spans multiple orthogonal segmentation dimensions, with cross-tabulated demand data provided for each dimension pair. Coverage extends further to regional breakdowns, trend trajectories, and the competitive detail needed to support segment-level decision-making.

By Software Function

  • Predictive and AI-Enabled Analytics
  • Risk-Adjustment and Regulatory Reporting
  • Descriptive and Operational Reporting
  • Generative Query and Self-Service Analytics
  • Clinical Quality and Outcomes Analytics

By End-Use Industry

  • Hospitals and Health Systems
  • Health Insurance Payers
  • Life Sciences and Pharmaceutical Companies
  • Ambulatory and Physician Group Practices
  • Government and Public Health Agencies

By Commercial Dimension

  • Direct Enterprise Licensing
  • Managed and Hosted Service Contracts
  • Implementation and Integration Services
  • Data Licensing and Consortium Access

By Region

  • North America
  • Western Europe
  • East Asia
  • South Asia and Pacific
  • Latin America
  • Middle East and Africa
  • Eastern Europe

Scope, Methodology, and Coverage

Every figure in this report is reproducible from documented input assumptions. The scope below maps the historical period, the forecast horizon, the segmentation dimensions, and the countries covered, alongside the underlying primary and qualitative methodology.
Historical Period
2020 to 2025
Forecast Period
2026 to 2036
Base Year
2025 (USD billions; MMA Primary Research Dataset, August 2026)
Market Definition
The healthcare business intelligence market comprises software platforms and associated implementation services that aggregate, analyse, and visualise clinical, operational, and financial healthcare data, valued at annual recurring software and service revenue. It spans predictive and AI-enabled analytics, risk-adjustment and regulatory reporting, descriptive and operational reporting, generative query and self-service analytics, and clinical quality and outcomes analytics sold to hospitals, payers, life sciences companies, and government agencies. Electronic health record core licensing, medical imaging software, clinical trial management systems, and pure data storage or interoperability infrastructure sold separately from analytics are excluded.
Quantitative Units
USD billions (current prices); enterprise contract counts where applicable
Segmentation Dimensions
By Software Function; By End-Use Industry; By Commercial Dimension; By Region
Regions Covered
North America, Western Europe, East Asia, South Asia and Pacific, Latin America, Middle East and Africa, Eastern Europe
Countries Covered
USA, China, Germany, UK, France, Japan, South Korea, India, Canada, Australia, Israel, UAE, Saudi Arabia, Brazil, Mexico, Poland, Czech Republic, Hungary, Sweden, Netherlands, Italy, Spain, Singapore, Thailand, and additional markets relevant to this sector
Key Companies Profiled
Oracle Health, Epic Systems, IBM, Optum, SAS Institute, Health Catalyst, Cerner, Microsoft, SAP, MedeAnalytics, Innovaccer, Qlik, Tableau, Arcadia, Wolters Kluwer, Change Healthcare, Clarify Health Solutions, Syntellis Performance Solutions, Premier Inc, Dimensional Insight
Quantitative Methodology
Primary survey, n=3,800 respondents, Q4 2025, six countries; demand-side model with trade association cross-validation
Qualitative Methodology
47 expert interviews, Q4 2025; applied to validate demand model assumptions, identify emerging dynamics, and assess competitive positioning
Report Format
PDF and XLSX data workbook (Word format preview document)
Publisher
Market Minds Advisory
Report Code
MMA-2026-HLT-112
Published
August 2026
Contact
sales@marketmindsadvisory.com | www.marketmindsadvisory.com

Purchase the full Healthcare Business Intelligence Market Report (2026 to 2036).

The full MMA Healthcare Business Intelligence report sizes the market across five software functions, five end-use industries, four commercial dimensions, and seven regions through 2036. It profiles 20 companies on a consistent annual recurring revenue basis, scoring each on integration depth, predictive financial justification, and regulatory content breadth. Scenario models quantify how value-based contracting expansion, generative query adoption, and cloud infrastructure cost move both revenue and margin by function. The report also includes integration cost benchmarking, readmission penalty avoidance modelling, and payer risk-adjustment reporting scope tracking for commercial and technology leadership teams.
Five-function and four-dimension market sizing to 2036
Twenty-company benchmark on recurring revenue basis
Integration cost and connector availability benchmarking by EHR
Readmission penalty avoidance and financial return modelling
Payer risk-adjustment reporting scope tracking by regulator
Data trust and active usage benchmarking across deployments

Built For The People Who Decide

From boardroom strategy to bench-side execution, this report is read cover-to-cover by leaders shaping the next decade of their industry, turning demand scenarios, market dynamics and valuation benchmarks into decisions.
CXOs/ Presidents/ VPs/ Managers
M&A and Corporate Development
Strategy Teams and R&D Heads
Procurement and Product Directors
Regulatory and Compliance Leaders
Investor Relations and Equity Analysts