Market Minds Advisory
Hardware Asset Management Market

Hardware Asset Management Market: Hardware Asset Management Market. Hybrid Fleet Complexity Drives Lifecycle Automation Adoption

IT leaders juggling remote-issued laptops, data center servers, and edge devices across a single inventory are colliding with auditors demanding proof of asset location fast enough to make spreadsheet-based tracking a genuine compliance liability.

Lead Analyst

Published

September 2026

Make Smarter Decisions with Customized Research Insights

Request a free sample report and evaluate market opportunities, growth trends, and competitive dynamics relevant to your business needs.

2025 MARKET VALUE$5.4BMarket Size 2025
2036 FORECAST VALUE$15.1BBase Case , 2026 to 2036
CAGR 2026 TO 20369.8 %Bull 11.1% / Bear 8.5%
INCREMENTAL OPPORTUNITY$9.2BNet 10- year value creation
EXPANSION MULTIPLE2.55x2036 value over 2026 base
Strategic Levers
M&A Pipeline
Regional Outlook
Country Rankings
Competitive Intelligence
Segmental Deep-dive
Call-Us : 91 93563 13602

Executive Snapshot and Market Trajectory.

IT departments managing thousands of laptops, servers, and edge devices across hybrid work arrangements are abandoning spreadsheet tracking for automated discovery platforms as software audit exposure and lease compliance risk become too costly to track manually. This shift is reshaping procurement criteria across nearly every enterprise IT department.
Automated discovery platforms that continuously scan networks for connected devices are pulling budget away from manual inventory tools as enterprises with distributed remote workforces struggle to track equipment that never touches a corporate office, and North American financial services firms are adopting these platforms fastest given strict regulatory audit requirements around data-bearing device disposal. Software license compliance tied to actual hardware inventory counts is separately driving purchases as vendors tighten audit enforcement against under-reported deployment.
A fragmented vendor landscape still includes legacy IT service management suites bundling basic asset tracking as an add-on module, but dedicated asset lifecycle platforms focused purely on discovery and disposition are winning contracts from enterprises with genuinely complex hybrid fleets. Sustainability reporting requirements tied to electronic waste disposal are forcing IT departments to document device end-of-life handling with a rigor that barely existed five years ago.
Market Definition
This report covers software platforms used to track, manage, and optimize the lifecycle of physical IT hardware assets, including discovery, inventory, and disposition tools, measured on a global software revenue basis across enterprise and government deployments. It excludes software asset management tools tracking license entitlements and general IT service management ticketing platforms not specifically focused on physical hardware.
Base Year Value
$5.4B in 2025 (MMA Primary Research Dataset, September 2026)
Forecast Period
2026 to 2036, eleven discrete annual values
CAGR
9.8% base case. Bull 11.1%. Bear 8.5%.
Fastest Growth Segment
Automated Discovery and Lifecycle Platforms: 14.5% CAGR
Fastest Growth Country
India: 15.0% CAGR
Fastest Growth Region
South Asia and Pacific: 12.0% CAGR
Largest Region
North America: 32% of 2025 global value
Market Leaders
ServiceNow, Ivanti, Flexera, Lansweeper, Asset Panda
Primary Survey
n=3,800 procurement and R&D decision-makers, Q4 2025, six countries
Methodology
Demand-side build-up, cross-validated against public data, 47 expert interviews

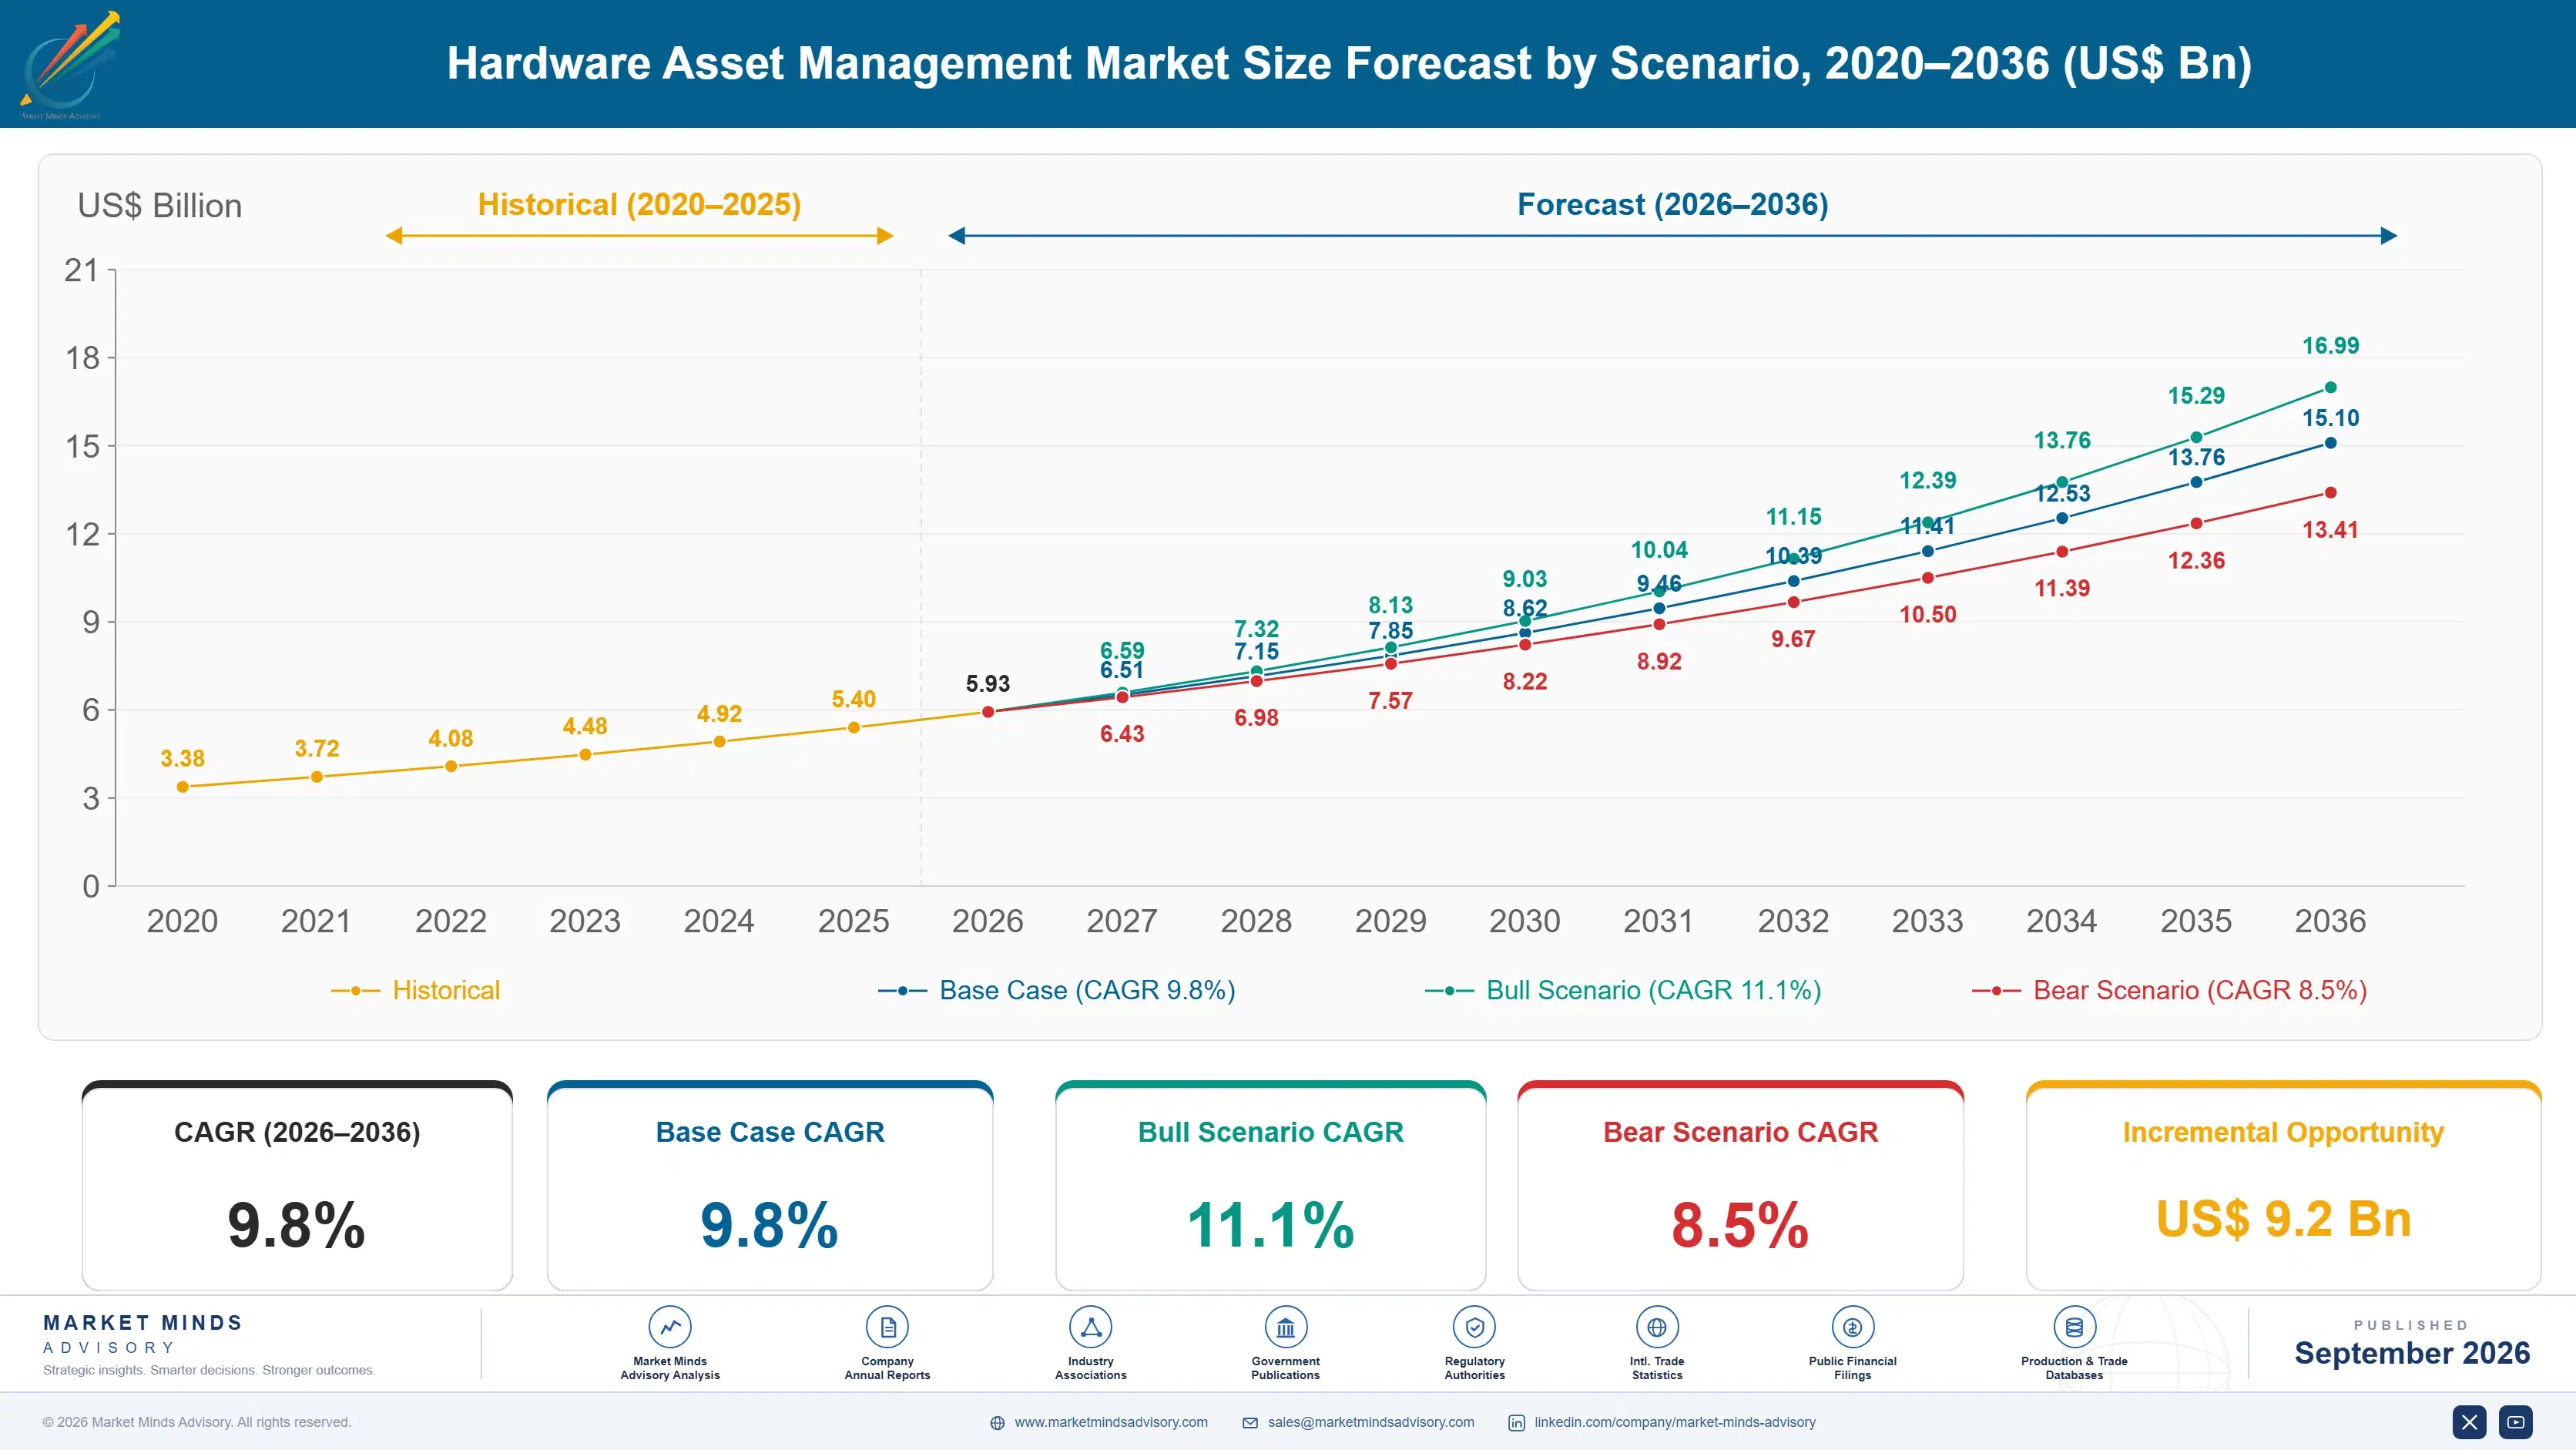
Hardware Asset Management Market Forecast Scenarios

hardware-asset-management-market-size-forecast-scenario-1788417114780
Between 2020 and 2025 the hardware asset management market grew at roughly 8.6 percent annually as pandemic-era remote work suddenly scattered corporate laptops across employee homes, exposing how little visibility most IT departments had into distributed equipment. Growth accelerated further once hybrid work arrangements proved permanent rather than temporary, forcing sustained investment in remote asset tracking capability.
The base case assumes continued strong expansion as three commercial mechanisms compound: enterprises formalize hybrid work policies that require permanent remote asset tracking capability rather than a pandemic-era stopgap, software audit enforcement tightens enough that hardware inventory accuracy becomes a genuine financial risk, and electronic waste disposal regulations force documented device disposition tracking. Vendors respond by bundling discovery, lifecycle, and disposition modules into a single platform rather than selling point solutions separately.
The bull case centers on artificial intelligence-driven IT infrastructure expansion forcing enterprises to track a much larger and more heterogeneous device fleet than before, accelerating platform adoption. The bear case centers on IT budget constraints during a broader economic slowdown delaying platform upgrades, pushing enterprises to extend the life of existing manual tracking processes despite their known limitations.

Asset Tracking Becomes Continuous Discovery, Not a Ledger

Asset management vendors are no longer selling a static inventory database, they are selling continuous network discovery, and that shift is rewriting who counts as a credible supplier to a large enterprise IT department. A vendor without real-time network scanning capability cannot win a contract that now requires accounting for devices the moment they connect anywhere on the corporate network.
MARKET CONCENTRATION38% CR5Top five vendors hold a modest share of platform revenue
AVERAGE DISCOVERY ACCURACY94% of connected devices identifiedShare of network-connected hardware automatically detected without manual entry
TOP DEPLOYMENT COUNTRY SHAREUnited States, 32% of platform revenueSingle country accounts for largest share of platform subscription spending
CLOUD-BASED DEPLOYMENT SHARE68% of new platform salesPortion of new deployments delivered as cloud-hosted rather than on-premises
AVERAGE CONTRACT LENGTHTwo years per enterprise dealTypical duration of a hardware asset management platform service agreement
IT ASSET REFRESH CYCLEFour years per device generationTypical interval between major enterprise hardware fleet replacement cycles
Vendors that historically sold simple spreadsheet-replacement tools are being squeezed out unless they build or acquire automated network discovery capability, since enterprises increasingly demand real-time visibility rather than periodic manual audits that quickly go stale. Several smaller vendors have already exited direct enterprise sales entirely, choosing instead to sell their inventory database technology wholesale to larger platforms that already own the customer relationship.
IT service management platform vendors are bundling basic asset tracking as a feature within broader ticketing suites, competing directly with dedicated lifecycle platforms that never built ticketing capability, creating a market where neither pure asset tracking nor pure workflow positioning is defensible alone anymore. Enterprise buyers increasingly evaluate vendors on discovery accuracy and disposition compliance almost as closely as workflow automation, a criterion that barely mattered in procurement decisions a decade ago when a simple database sufficed.
"A spreadsheet updated quarterly isn't an asset inventory, it's a historical document. By the time anyone reads it, half the devices have already moved."
Practice Lead, Enterprise IT Infrastructure · MMA Enterprise IT Infrastructure and Asset Lifecycle Management Software Practice · September 2026

Market Trends

Hybrid Work Permanence Drives Remote Asset Tracking Demand

Enterprises that treated remote work asset tracking as a temporary pandemic accommodation are now formalizing permanent policies requiring continuous visibility into laptops and peripherals that never touch a corporate office. Over 60 percent of large enterprises now maintain some form of permanent hybrid work arrangement, creating a durable requirement for asset tracking capability that extends well beyond the traditional office network perimeter. This shift is forcing IT departments to adopt discovery tools capable of tracking devices connecting from home networks and public Wi-Fi rather than relying solely on corporate network scanning that misses distributed equipment entirely.
Market Impact: 75 percent run multi-cloud environments
Software Audit Enforcement Ties Compliance to Hardware Inventory

Software vendors are tightening license compliance audit enforcement, and accurate audit defense increasingly depends on precise hardware inventory data showing exactly which devices run which licensed software. Enterprises that fail an audit due to inaccurate hardware records face penalty payments that can run into the millions of dollars for large organizations with thousands of endpoints. This linkage is pulling software asset management budget toward hardware asset management platforms that can provide the underlying device-level accuracy that audit defense increasingly requires. Vendors offering integrated software and hardware asset visibility are increasingly winning budget previously allocated to standalone software audit tools.
Market Impact: Penalties exceed 50,000 dollars per violation

Market Opportunities and Growth Drivers

Cloud Migration Complicates Hybrid IT Asset Visibility

Enterprises running workloads across on-premises data centers, multiple public cloud providers, and edge locations simultaneously face a genuinely more complex asset visibility challenge than the single-data-center model that dominated a decade ago. Roughly 75 percent of large enterprises now operate a multi-cloud environment, each requiring its own discovery integration to maintain a unified hardware inventory view across fundamentally different infrastructure types. This complexity is pushing enterprises toward platforms that can unify physical and virtual asset tracking within a single pane of glass rather than maintaining separate tools for each environment.
Market Impact: Adds 6 to 9 months

Electronic Waste Regulations Mandate Documented Device Disposition

Governments across the European Union and several United States states have enacted electronic waste regulations requiring documented proof of proper device disposal, including data destruction certification for any device that held sensitive information. Non-compliance penalties in several jurisdictions now exceed 50,000 dollars per violation for organizations that cannot produce adequate disposition records. This regulatory pressure is forcing enterprises to track hardware assets through their complete lifecycle, from initial procurement through final certified disposal, rather than losing visibility once equipment leaves active service. Vendors offering built-in chain-of-custody documentation are winning contracts over point solutions that lack compliance-grade reporting.
Market Impact: Blind spots persist across 15 percent

Market Restraints and Challenges

Legacy System Integration Complicates Platform Migration

Enterprises with deeply embedded legacy IT service management systems often find migrating to a modern asset management platform disruptive, since years of custom workflow configuration and integration with adjacent systems do not transfer cleanly to a new vendor. The root cause is that many legacy platforms were customized far beyond their original design intent, creating dependencies a standard migration playbook cannot fully anticipate. This forces enterprises to budget significant professional services time on top of licensing cost, delaying return on investment. Vendors mitigate this by offering migration tooling and phased rollout plans that preserve critical legacy workflows during transition.
Market Impact: Over 60 percent maintain hybrid policies

Device Type Diversity Strains Discovery Accuracy

The growing variety of connected device types, from traditional laptops to IoT sensors and specialized edge computing hardware, strains discovery engines built primarily around conventional endpoint detection methods. The underlying cause is that many newer device categories communicate using protocols that traditional network scanning tools were never designed to recognize, creating detection blind spots. This forces enterprises to maintain manual processes for device categories that automated discovery cannot yet reliably identify. Vendors are mitigating this by expanding protocol support and partnering with device manufacturers to build native reporting integrations directly into hardware firmware.
Market Impact: Penalties exceed 1 million dollars
3 additional market trends, 4 additional growth drivers, and 3 additional restraints and challenges are covered in the full report. Contact sales@marketmindsadvisory.com to access the complete intelligence.

Segment CAGR and Growth Architecture

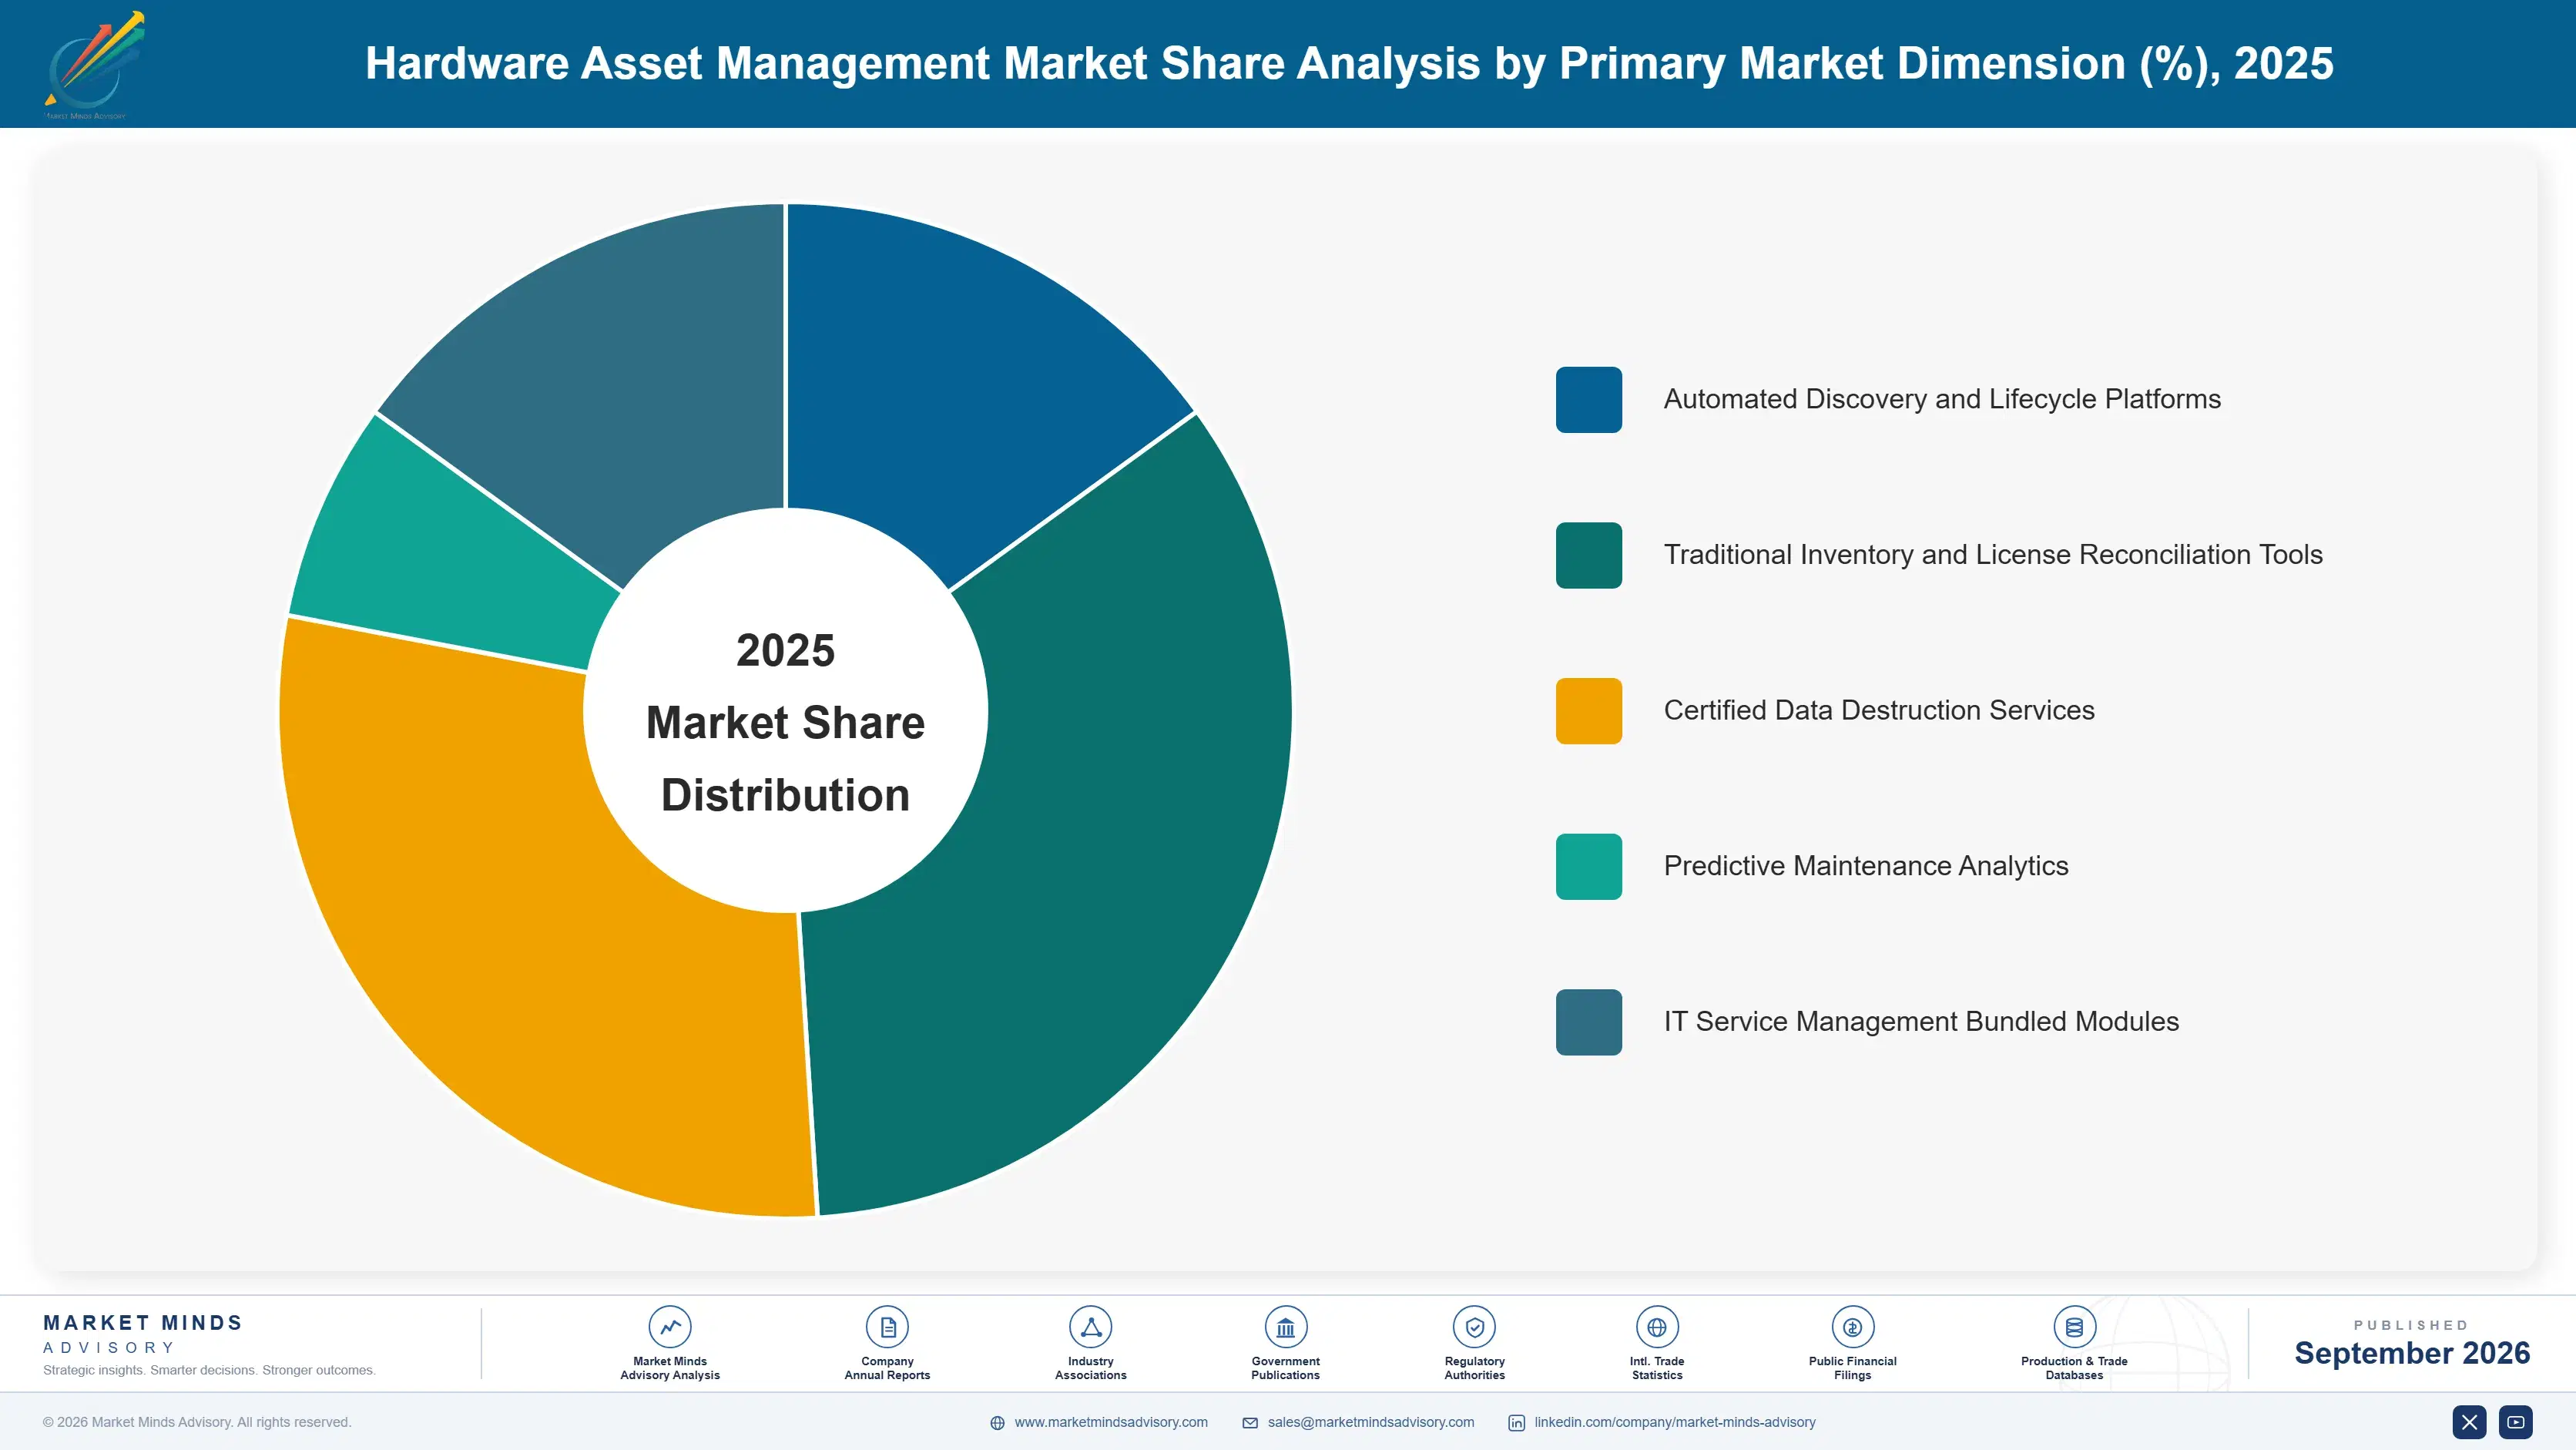
The hardware asset management market splits across five technology-defined segments spanning discovery, lifecycle, and disposition software layers used broadly across enterprise IT. Automated discovery and lifecycle platforms lead growth as hybrid fleet complexity spreads, while traditional inventory and license reconciliation tools still represent the largest installed base by seat count across smaller enterprises worldwide.
hardware-asset-management-market-market-share-analysis-1788417115335

Automated Discovery and Lifecycle Platforms

Automated discovery and lifecycle platforms continuously scan corporate networks, cloud environments, and remote endpoints to maintain a real-time inventory without requiring manual entry, then track each asset through procurement, deployment, maintenance, and disposition stages automatically. This approach eliminates the periodic manual audit cycle that older tools relied upon, catching newly connected or disconnected devices within minutes rather than discovering gaps only during a quarterly review. Growth here outpaces every other segment because every enterprise managing a distributed hybrid workforce faces the same underlying visibility problem that only continuous automated discovery can genuinely solve. Vendors offering this automated capability are increasingly displacing incumbents that never modernized past periodic manual inventory scans.
CAGR 14.5%

Traditional Inventory and License Reconciliation Tools

Traditional inventory and license reconciliation tools remain the largest segment by installed seat count, covering the spreadsheet-replacement database applications that many smaller enterprises have used for years to track asset ownership and depreciation schedules. This tooling predates the current automated discovery boom and continues serving organizations with simpler, largely static IT environments that do not face significant hybrid workforce complexity. Growth here is comparatively modest since these tools serve a customer base less exposed to the compliance and visibility pressures driving the broader market forward, with most new spending going toward incremental feature additions rather than platform replacement. Vendors serving this segment compete primarily on price and ease of use rather than the automated discovery sophistication that differentiates newer platforms.
CAGR 5.0%
Full segment breakdown across 6 segments available in the complete report.

Regional Architecture and Country Demand Map

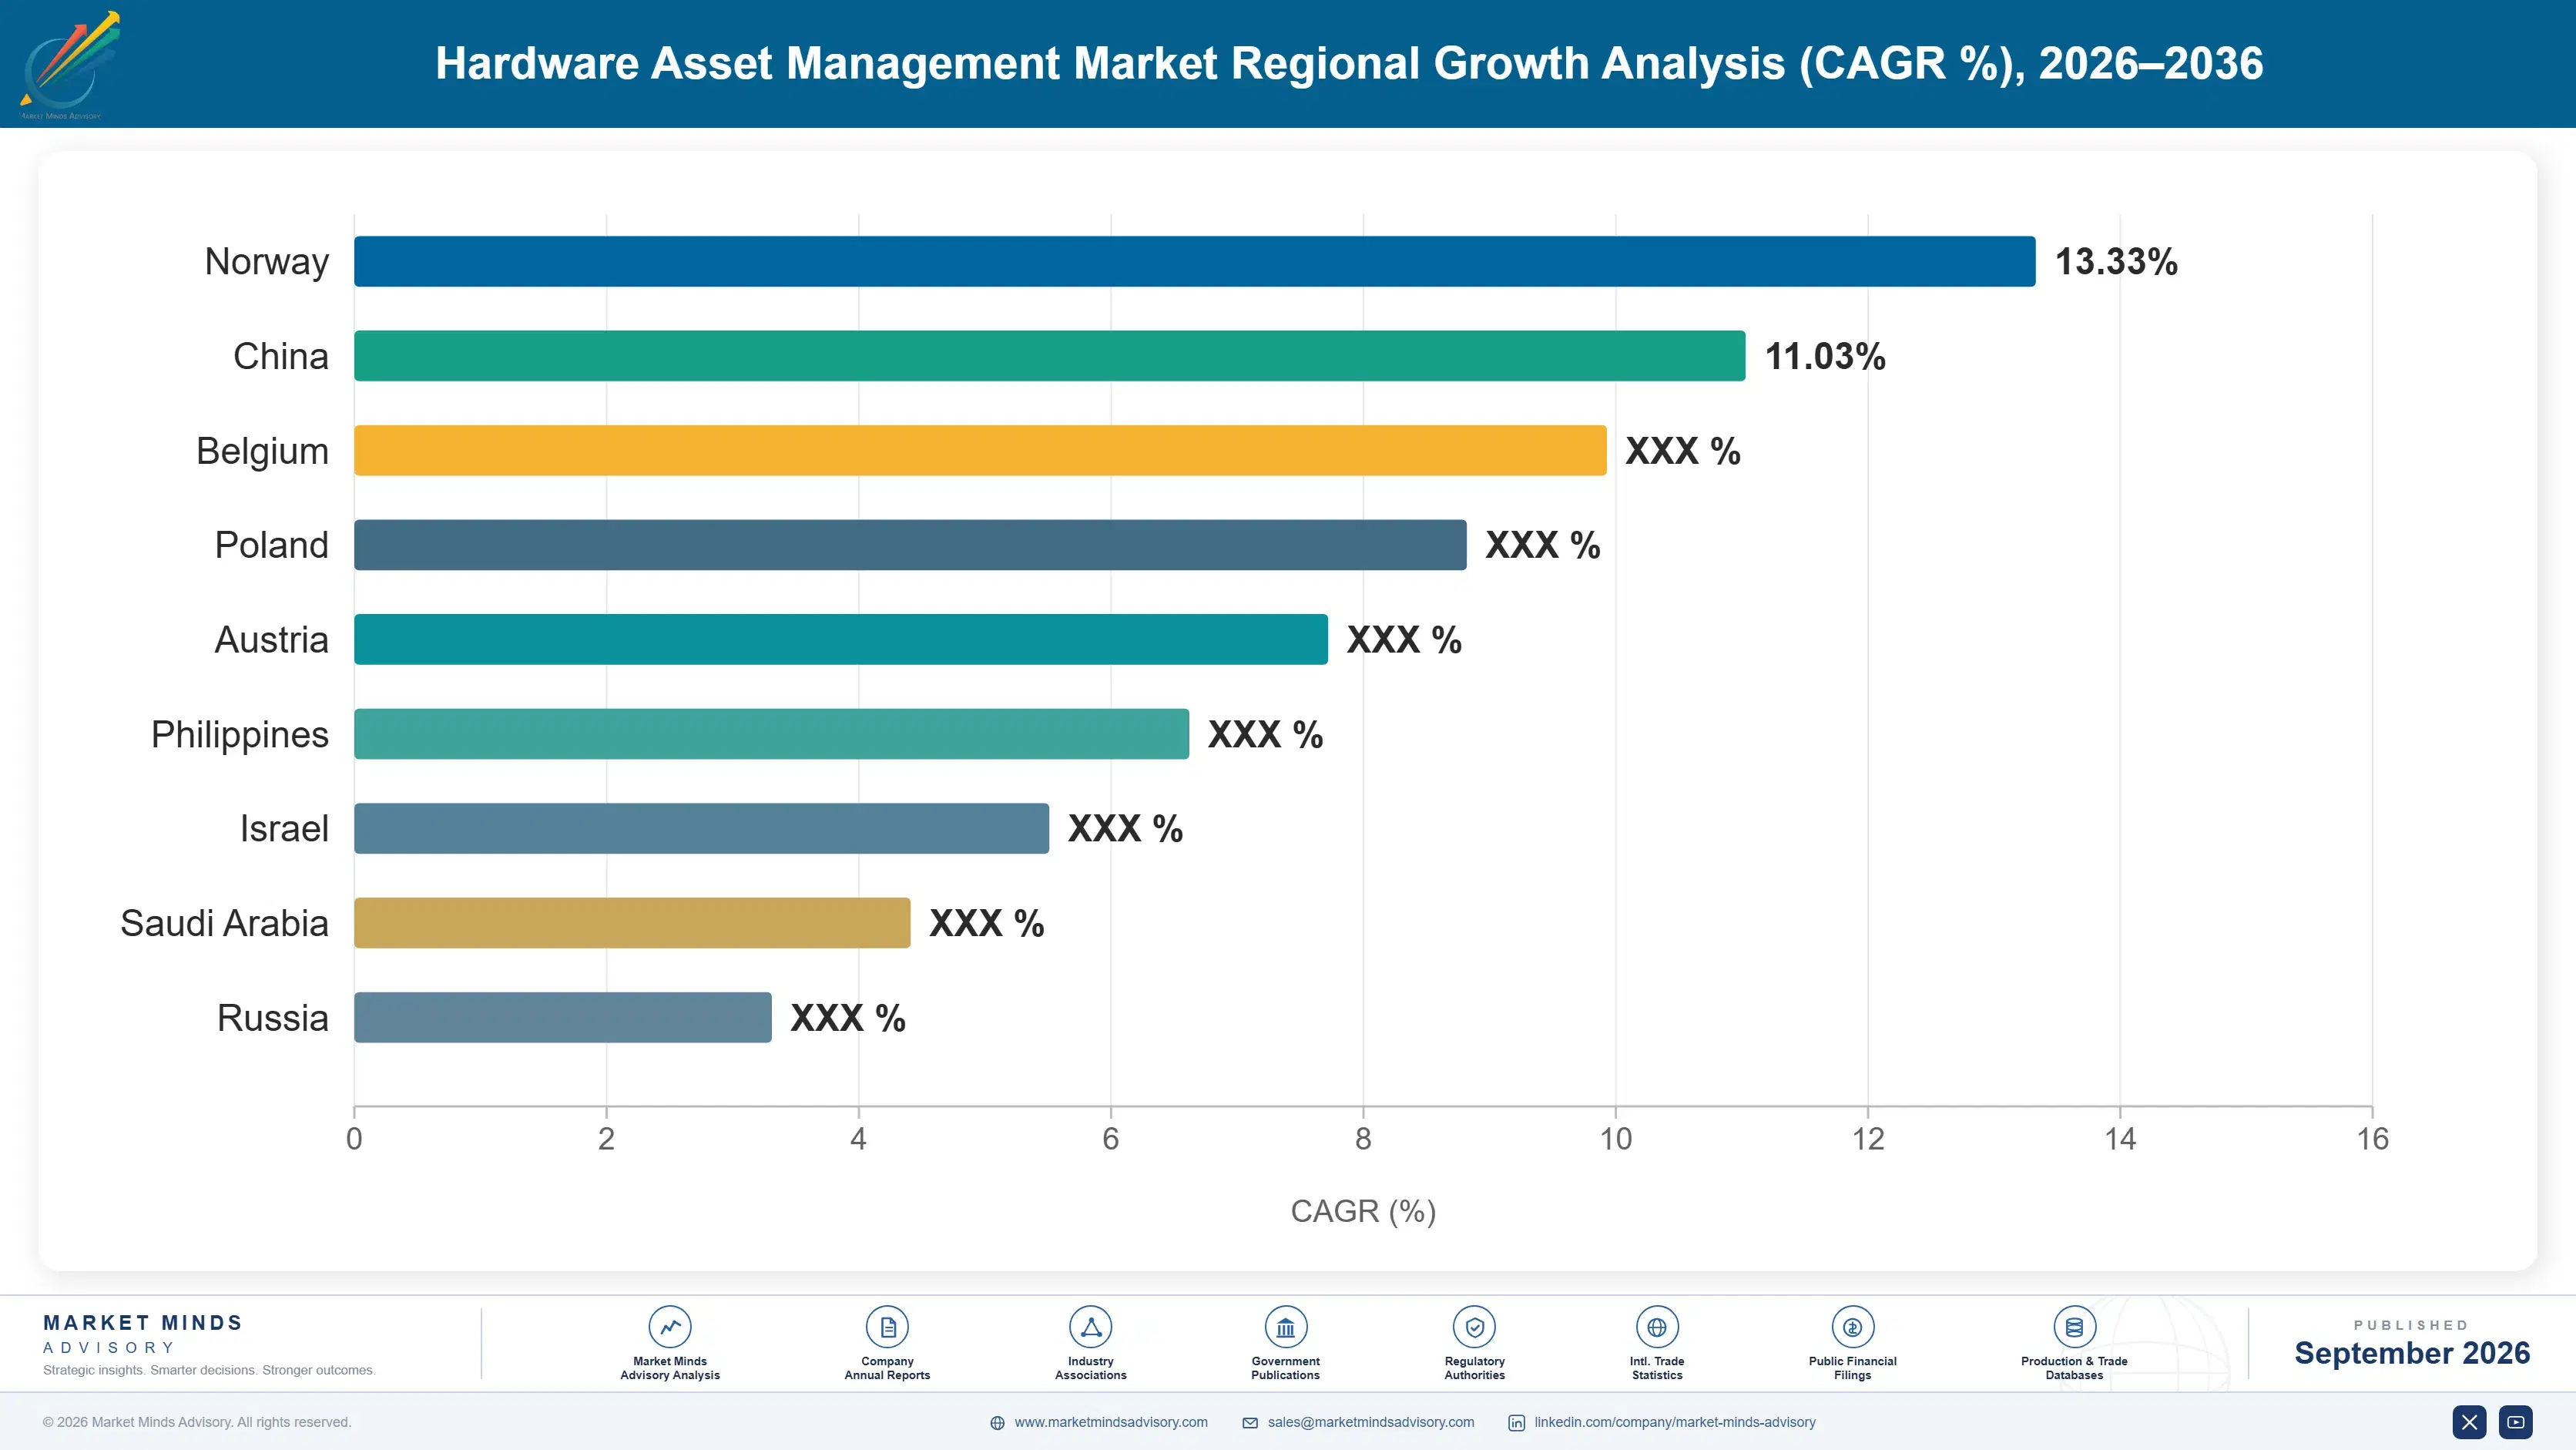
North America leads global platform revenue on the strength of enterprise IT software vendor concentration and early hybrid work adoption, while East Asia holds a strong secondary share tied to regional enterprise digitization. South Asia and Pacific grows fastest as India expands its IT services sector.

North America

Enterprise IT software vendor headquarters concentration defines North America's share more than raw deployment count alone. ServiceNow, Ivanti, and Flexera all book the majority of their global platform revenue through United States entities, even as an increasing share of underlying device inventory sits overseas within multinational enterprise networks. Financial services and healthcare organizations in this region face particularly strict audit and data destruction requirements, driving above-average platform adoption intensity relative to less regulated industries. Canada's enterprise sector follows a similar adoption pattern, though on a smaller scale given its more modest overall enterprise IT spending base. Enterprises here increasingly bundle hardware asset management procurement decisions together with broader security and endpoint management platform selection.
Share: 32% | CAGR: 10.5% (2026 to 2036)

Western Europe

Western Europe's growth trails the global rate mainly because the General Data Protection Regulation already forced many enterprises to build rigorous device tracking discipline years before hybrid work asset visibility became a broader industry concern elsewhere. Germany's manufacturing sector, running extensive operational technology alongside traditional IT infrastructure, has driven some of the region's most sophisticated hybrid asset tracking deployments spanning both domains. The United Kingdom's financial services sector continues investing heavily in audit-grade asset tracking tied to strict regulatory examination requirements from national banking supervisors. France and the Nordic countries have moved more slowly on cloud-native discovery specifically, favoring established on-premises tooling relationships. Spain and Italy follow at a modestly slower pace, tied to their smaller enterprise software spending base.
Share: 20% | CAGR: 8.3% (2026 to 2036)
Regional intelligence for 5 additional markets available in the complete report: East Asia, South Asia and Pacific, Latin America, Middle East and Africa, Eastern Europe. Contact sales@marketmindsadvisory.com.
hardware-asset-management-market-country-cagr-analysis-1788417115847

Where Platform Vendors Can Still Add Margin

Commoditizing basic discovery features and thinning per-seat licensing margins are pushing vendors toward adjacent revenue lines that ride on top of the same enterprise relationship rather than the platform subscription itself. Four levers stand out as genuinely additive to core platform revenue rather than cannibalistic of it, each drawing on data the vendor already collects.

Selling Certified Data Destruction and Disposition Services

Platforms with full lifecycle visibility into which devices held sensitive data can offer certified data destruction and disposition services directly, capturing revenue from a compliance requirement enterprises must satisfy regardless of which platform they use. This service converts a regulatory obligation into an integrated revenue line rather than leaving enterprises to manage a separate vendor relationship for disposal. Vendors offering this capability command service fees running roughly 8 to 12 percent of the original platform contract value annually, a durable margin layer largely uncorrelated with new seat sales. Certification credibility matters, since enterprises need documentation satisfying their own auditors.
Market Impact: Service fees add 8 to 12 percent yearly

Offering Compliance Audit Defense Consulting Services

Vendors with deep expertise in software and hardware audit defense can sell consulting services to enterprises facing an active vendor audit, monetizing platform data and compliance knowledge separately from the underlying subscription. This model captures value from enterprises willing to pay a premium for expert guidance during a high-stakes audit event rather than navigating it internally. Early providers of this service report consulting revenue reaching 5 to 9 percent of total company revenue within two years of launching the offering commercially. Regulatory complexity varies significantly by jurisdiction, adding overhead most standalone consulting-only firms never encounter in this specific niche.
Market Impact: Consulting revenue reaches 5 to 9 percent share

Providing IT Asset Financing and Leasing Programs

Platforms with granular visibility into device age and depreciation schedules can partner with financing providers to offer hardware leasing directly through the same interface enterprises already use for asset tracking, capturing referral revenue on every new device financed. This service has proven especially valuable to enterprises managing large device refresh cycles who prefer a single vendor relationship over separate financing and tracking providers. Vendors offering this report referral fees adding roughly 2 to 4 percent of total financed equipment value. Building this partnership network requires financing expertise most software-only vendors have historically lacked internally.
Market Impact: Adds 2 to 4 percent in referral fees

Selling Predictive Hardware Failure Analytics Subscriptions

Device telemetry data collected through the discovery process can feed predictive failure models that flag hardware likely to fail before it disrupts an employee's work, a capability vendors increasingly package as a paid subscription layered on top of the core platform. Enterprises value this because proactive replacement reduces employee downtime and emergency procurement costs. Subscription attach rates above 20 percent among enterprises managing large device fleets are now achievable for vendors with sufficient installed base density to build reliable failure prediction models. Building an accurate model requires years of telemetry data across a large base, a barrier favoring established vendors.
Market Impact: Attach rates now exceed a 20 percent mark

Who Controls the Margin Pool

Global platform revenue concentrates modestly, with the top five vendors holding roughly 38 percent share on a platform revenue basis, the consistent yardstick applied throughout this assessment. ServiceNow and Ivanti lead the enterprise category, though Lansweeper's discovery-first scale gives it a distinct position built on technical depth rather than broad IT service management platform breadth. The gap between leaders and mid-tier challengers remains narrow enough that near-term ranking changes look plausible.
Current activity centers on automated discovery expansion and disposition service bundling rather than price competition on basic inventory tracking. Vendors are racing to extend discovery coverage across cloud, edge, and IoT device categories simultaneously, since enterprises increasingly refuse to work with a platform covering only traditional laptops and servers. Several mid-tier players have pursued disposition service acquisitions to capture the compliance revenue layer.

Emerging pressure comes from IT service management suite vendors that bundle basic asset tracking as a feature rather than selling it standalone, competing directly with dedicated lifecycle platforms that never built ticketing capability. Ranking shifts are most likely in the mid-tier, where vendors lacking broad discovery coverage risk losing enterprise contracts to faster-moving rivals. The top of the market remains comparatively unsettled.
hardware-asset-management-market-company-positioning-matrix-1788417116378

Competitive Moat and Risk Dimensions

SERVICENOW

Moat: Broad IT Workflow Platform Integration

ServiceNow's asset management module benefits from deep integration with its dominant IT service management and workflow automation platform, letting enterprises manage tickets, changes, and assets within a single system. This breadth makes displacement difficult once an enterprise standardizes on the platform. Displacement would require migrating not just asset data but the surrounding workflow processes built around the platform.
SERVICENOW

Risk: Higher Cost for Small Firms

ServiceNow's broad platform pricing often exceeds what smaller enterprises need for asset management alone, creating an opening for focused point solutions offering comparable discovery capability at meaningfully lower cost for organizations that do not need the full workflow suite. This gap has already cost ServiceNow contracts among mid-sized enterprises with straightforward asset tracking needs.
IVANTI

Moat: Deep Endpoint Security Integration

Ivanti combines asset discovery with endpoint security and patch management in a single platform, appealing to IT security teams who want unified visibility across both compliance and security functions. This combination reduces vendor sprawl for enterprises managing both concerns simultaneously. Enterprises consolidating vendor relationships increasingly favor this combined approach over separate point solutions.
IVANTI

Risk: Past Security Vulnerability Disclosures

Ivanti has faced public security vulnerability disclosures in its own products in recent years, creating reputational risk that competitors are actively using in competitive sales situations to win contracts from security-conscious enterprise buyers evaluating vendor risk. Rebuilding trust after a disclosed vulnerability takes years, longer than the sales cycle of any single lost contract.

Players Tracked

Prominent Players

ServiceNow
Ivanti
Flexera
Lansweeper
Asset Panda

Other Key Players

Freshworks
Zylo
Snipe-IT
Device42
Oomnitza
AssetSonar
GoCodes
InvGate
ManageEngine
Atlassian Jira Service Management
Cherwell Software
EZOfficeInventory
Sunview Software
Alloy Software
Samanage

Recent Developments

JANUARY 2026

ServiceNow Launches AI-Powered Asset Discovery Module

ServiceNow launched an AI-powered asset discovery module capable of automatically classifying newly detected devices without manual configuration, targeting enterprises struggling with the growing diversity of connected hardware types across increasingly hybrid and multi-cloud IT environments. The module uses machine learning trained on existing customer data to improve accuracy over time.
Signal: AI-driven classification is becoming a baseline expectation rather than a premium differentiator across the platform category.
SEPTEMBER 2025

Flexera Acquires Data Destruction Compliance Startup

Flexera completed the acquisition of a smaller data destruction compliance startup, adding certified disposition tracking capability to its existing software and hardware asset management portfolio rather than partnering with a third-party disposition vendor for this capability. Financial terms of the acquisition were not disclosed by either company involved.
Signal: Vertical integration into disposition services is becoming a competitive necessity rather than an optional add-on feature.
APRIL 2025

Lansweeper Raises Growth Funding for Cloud Expansion

Lansweeper raised a growth funding round to accelerate its cloud-native platform expansion and broaden device discovery coverage beyond its traditional on-premises network scanning strength, aiming to compete more directly with larger enterprise platform vendors. The round was led by a growth equity investor with prior enterprise software portfolio experience.
Signal: Discovery-focused specialists are raising capital to compete on platform breadth rather than remaining pure niche players.

Cloud Infrastructure and Talent Cost Exposure

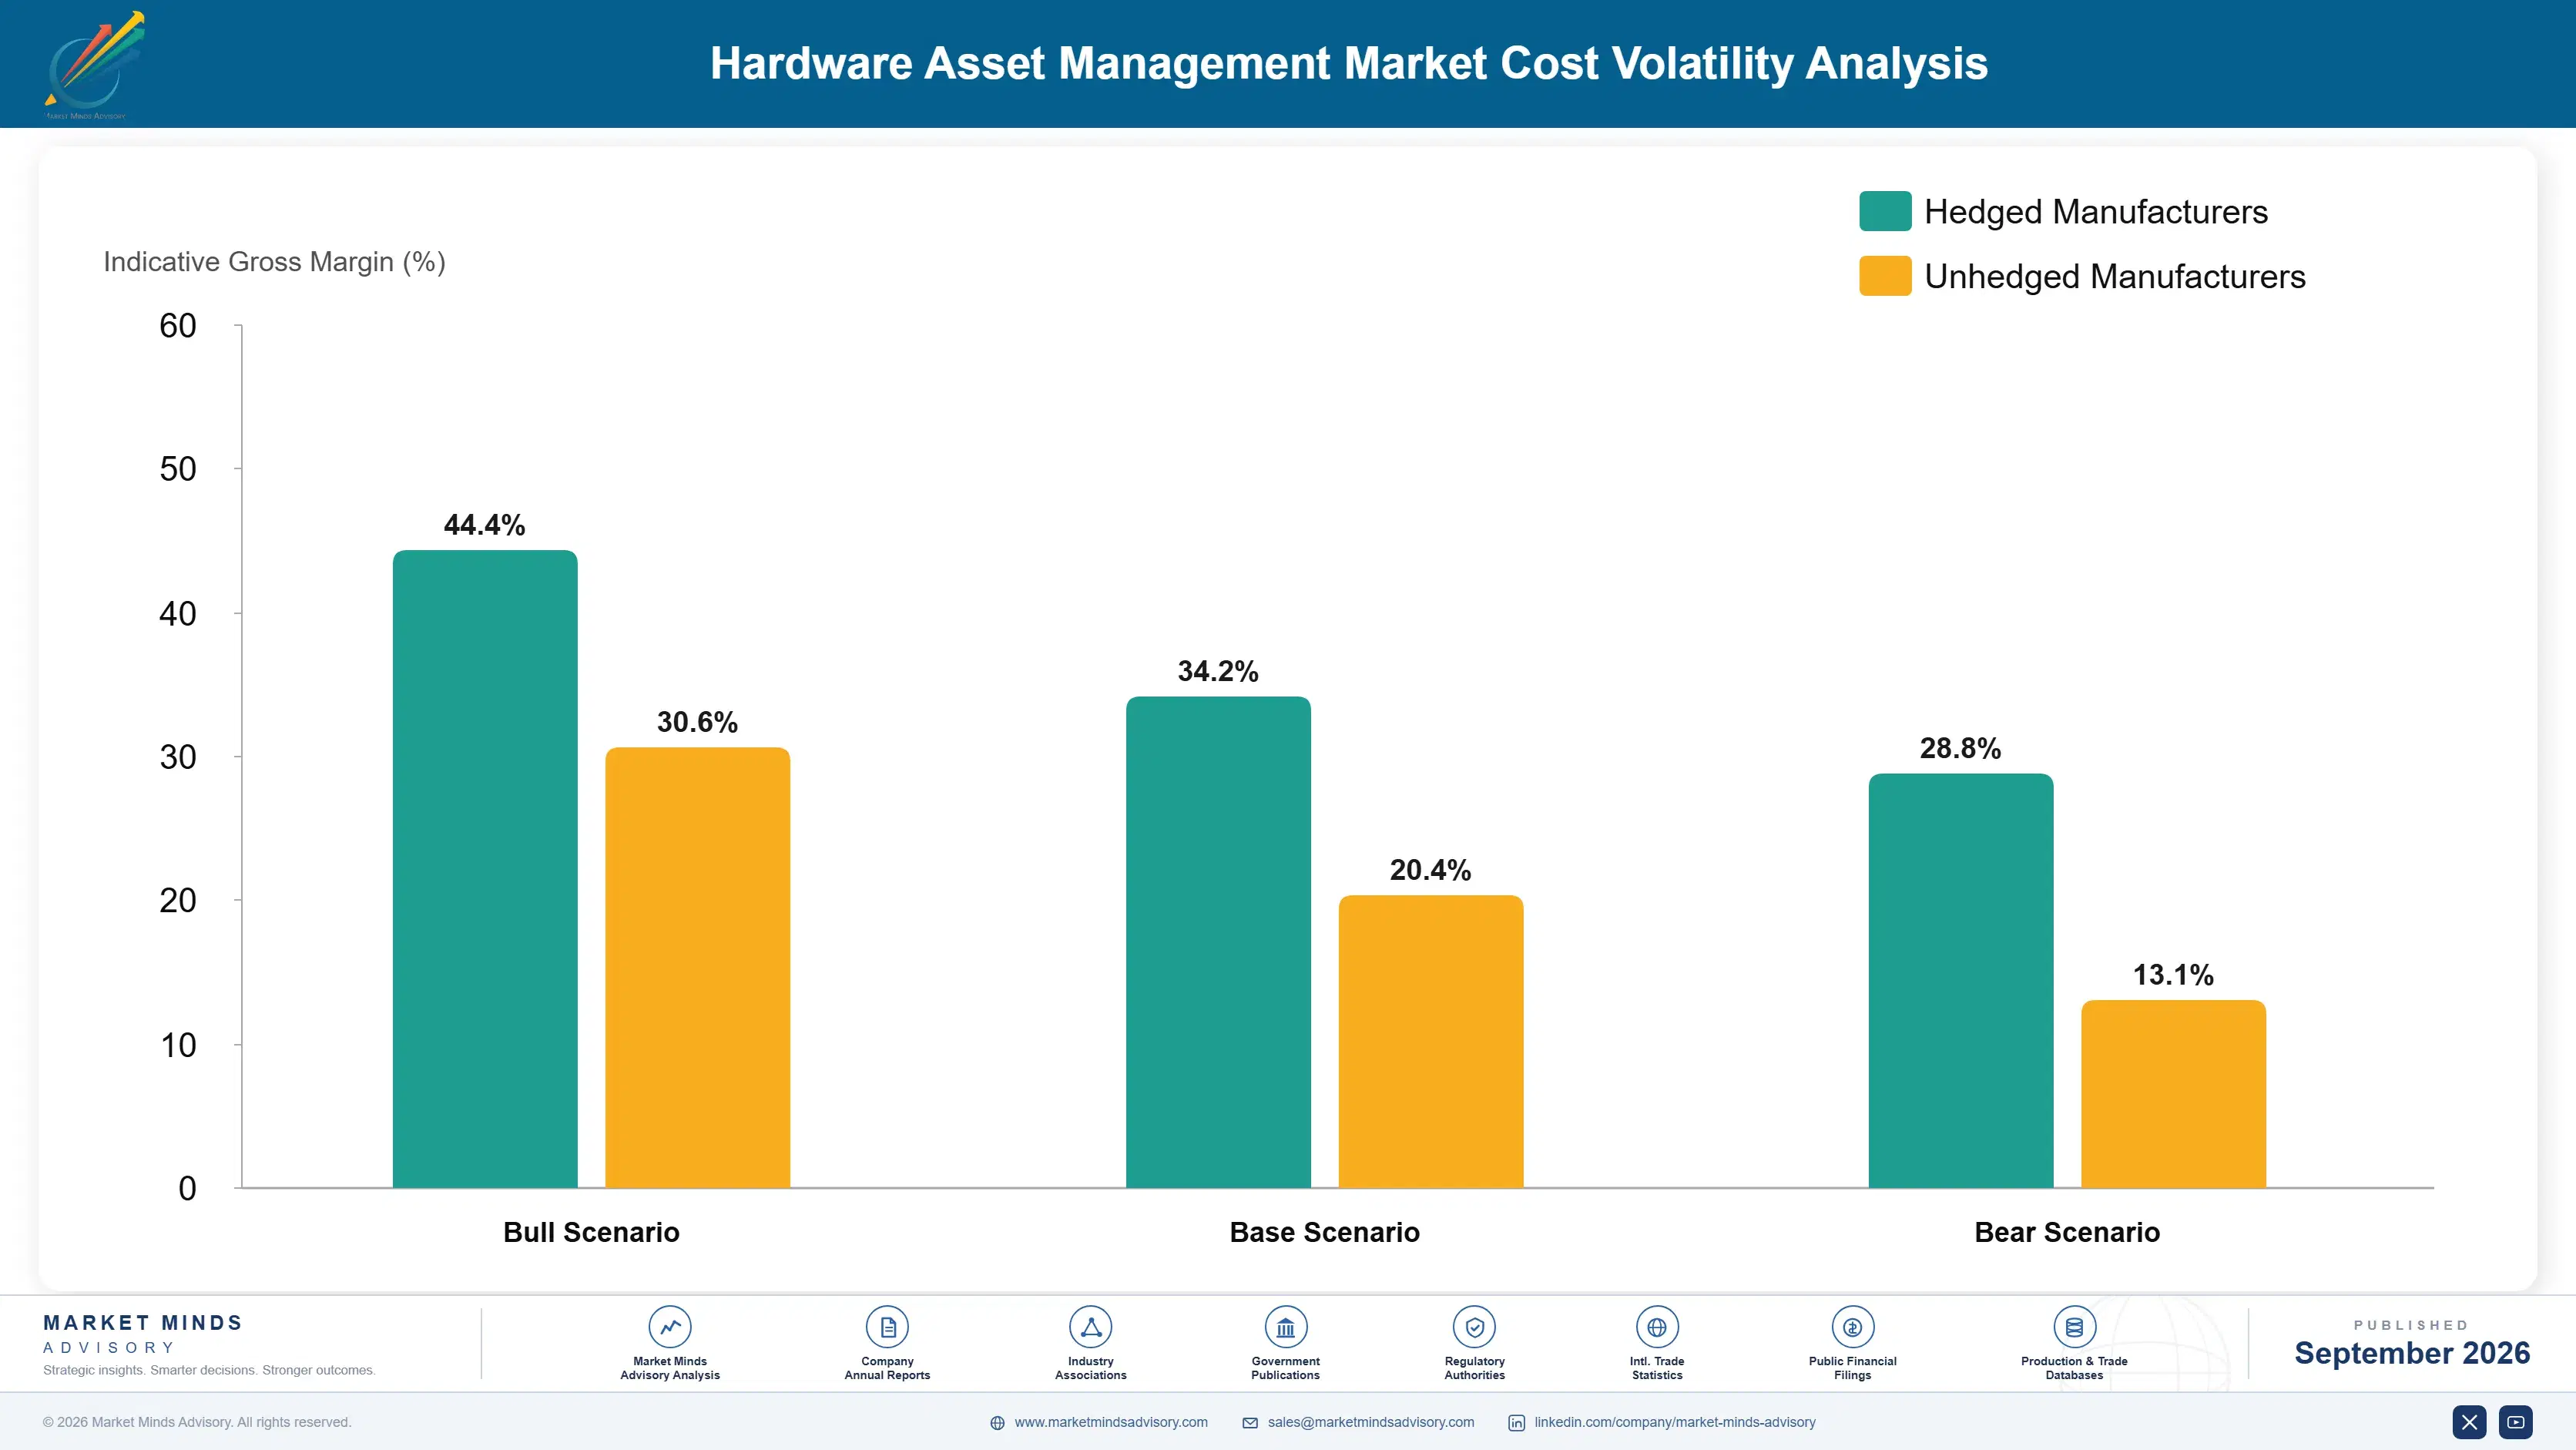
Cloud hosting and data processing infrastructure account for roughly 22 to 28 percent of a typical hardware asset management vendor's cost of goods sold, sourced primarily from the major hyperscale cloud providers operating data centers across North America, Europe, and Asia. Engineering and customer success talent costs add a further 35 to 42 percent, reflecting the labor-intensive nature of software development and enterprise onboarding.
A 2023 cloud pricing restructuring by a major hyperscale provider, documented in that provider's own investor disclosures, increased hosting costs for several software-as-a-service vendors in this category by a meaningful margin. Flexera's 2023 annual report cited rising cloud infrastructure cost as a factor in its pricing strategy review, prompting several vendors across the category to renegotiate hosting contracts or migrate workloads between providers. These renegotiations became a recurring annual budgeting exercise industry-wide.

Smaller vendors face a genuine disadvantage here because they lack the negotiating leverage to secure favorable enterprise cloud pricing agreements that larger competitors with greater committed spend can access. Vendors based in regions with a smaller domestic software engineering talent pool face additional exposure, since they must compete globally for scarce technical talent against better-funded competitors headquartered in larger markets.
hardware-asset-management-market-cost-volatility-analysis-1788417116574

Multi-Cloud Cost Arbitrage Strategies

Vendors are increasingly distributing workloads across multiple cloud providers to negotiate better pricing and avoid single-vendor lock-in, adding operational complexity but reducing exposure to any single provider's pricing decisions over time. Vendors serving large enterprise contracts increasingly treat multi-cloud flexibility as a resilience requirement rather than a purely cost-driven decision. scenarios. Legal review of data residency clauses adds time.

Remote-First Engineering Talent Sourcing

Hiring engineering talent from lower-cost regions through fully remote arrangements reduces overall talent cost without sacrificing quality, a strategy several vendors have adopted aggressively to offset rising cloud infrastructure expense. This approach requires mature remote collaboration processes and management practices that not every organization has successfully built. to succeed at scale. Time zone coordination remains a genuine ongoing management challenge.

Long-Term Committed Use Cloud Discounts

Locking in multi-year committed use discount agreements with cloud providers secures meaningfully lower unit pricing than on-demand rates, trading some flexibility for cost predictability that helps vendors plan margin more reliably. Vendors combine this with usage forecasting models to avoid over-committing spend beyond actual projected customer growth trajectories. each year. Renewal negotiations require careful advance planning to avoid gaps.

Portfolio Architecture for Margin Defence

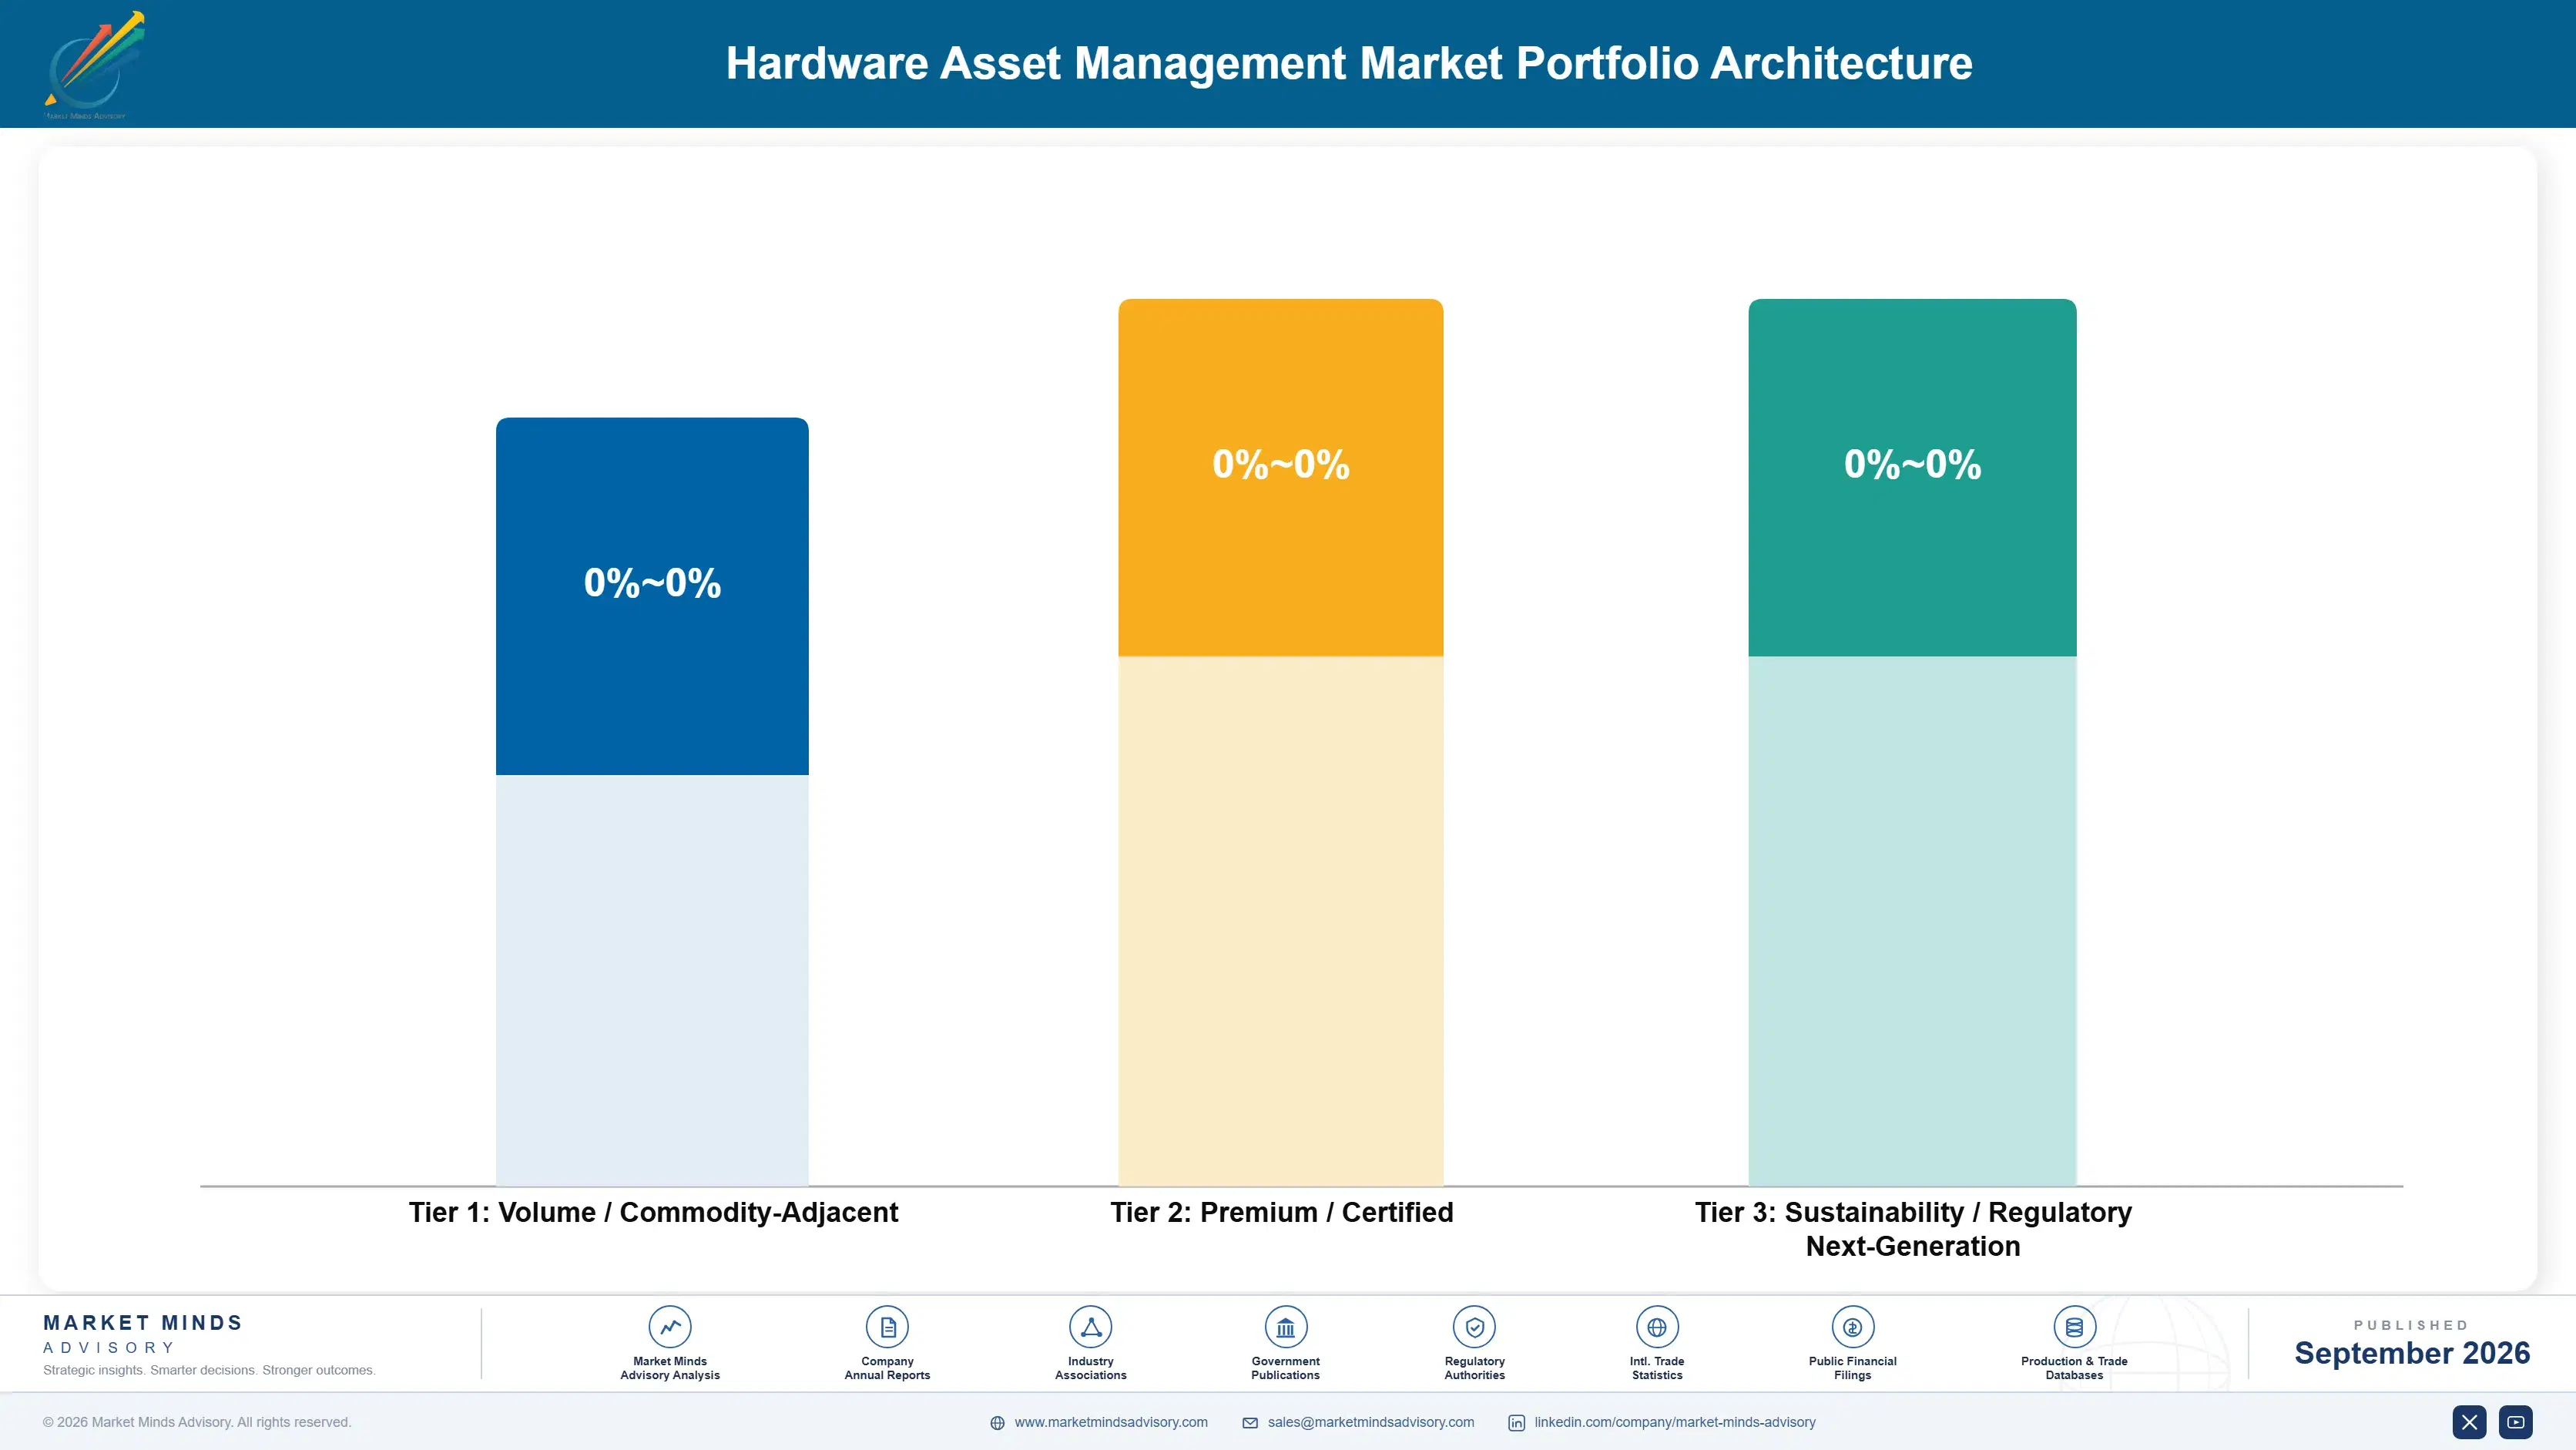
Asset management vendors operate across a widening tier structure as basic discovery commoditizes and higher-margin compliance and analytics services concentrate pricing power elsewhere in the stack. Volume-tier per-seat licensing now carries gross margins compressed by increasing competition, while premium platforms bundled with compliance and disposition services retain meaningfully stronger pricing. Portfolio strategy increasingly determines profitability more than raw seat growth.
The tension between chasing seat count and defending premium service positioning defines strategic choice across the industry. Vendors competing purely on per-seat price find margin eroding faster than their cost base can adjust, while vendors segmenting customers by compliance service uptake are protecting margin even as basic licensing fees compress across the broader market. This divergence is reshaping how vendors allocate engineering investment across their enterprise base.

High-value margin pools concentrate in certified disposition services, audit defense consulting, and predictive failure analytics sold as standalone offerings rather than bundled features. These pools grow faster than core licensing revenue because they scale with data and expertise a vendor already owns rather than requiring incremental seat sales, making them the most defensible source of margin expansion available today. Vendors without such a plan risk the commodity tier over time.

Volume / Commodity-Adjacent

Basic discovery and inventory tracking software sold to price-sensitive small and mid-sized enterprises where per-seat pricing is the primary purchase driver and switching cost remains modest. Enterprises in this tier churn readily toward whichever vendor offers the lowest visible per-seat price.
Gross Margin: 10 to 16%

Premium / Certified

Full lifecycle platforms bundled with certified disposition services and dedicated account management for large enterprises that value audit defensibility and integration depth over marginal savings. These enterprises typically sign multi-year contracts, reducing acquisition cost per dollar of recurring revenue.
Gross Margin: 24 to 34%

Sustainability / Regulatory / Next-Generation

Electronic waste compliance tooling, audit defense consulting, and predictive failure analytics built to meet emerging regulatory mandates ahead of competitors, commanding premium pricing while scarce. Vendors here often price on a subscription basis tied to compliance scope rather than pure seat count.
Gross Margin: 28 to 40%
hardware-asset-management-market-portfolio-architecture-1788417117096

High-value Sub-segments and Strategic Watch-out

Certified Data Destruction and Disposition Services

High-value, high-growth pool as enterprises pay premium pricing for compliance-grade disposal documentation, rewarding vendors who build accurate audit trails earliest with durable multi-year contracts locked in ahead of rivals. Vendors absent from this capability risk losing the largest enterprise contracts entirely to faster-moving specialists. early.

Compliance Audit Defense Consulting

High-value, moderate-growth pool constrained by the limited number of consultants with genuine audit defense expertise, but delivering strong margin once a vendor has built a credible consulting practice and track record. Expansion here depends heavily on how quickly a vendor can build a credible reputation in a competitive field.

Legacy Inventory and Reconciliation Tools

Volume core segment carrying the bulk of installed seats but facing steady margin compression as automated discovery platforms and commoditized pricing erode differentiation across most basic offerings. Consolidation among smaller legacy tool makers is likely as scale becomes the primary way to defend margin. thins.

IoT and Edge Device Discovery Coverage

Strategic watch-out segment where shifting device diversity and protocol fragmentation could rapidly change the competitive map, rewarding vendors with flexible multi-protocol discovery infrastructure already built. A sudden shift in enterprise device mix in any single major industry could reroute meaningful demand quickly. suddenly and without warning.

Recurring Revenue Across the Device Fleet

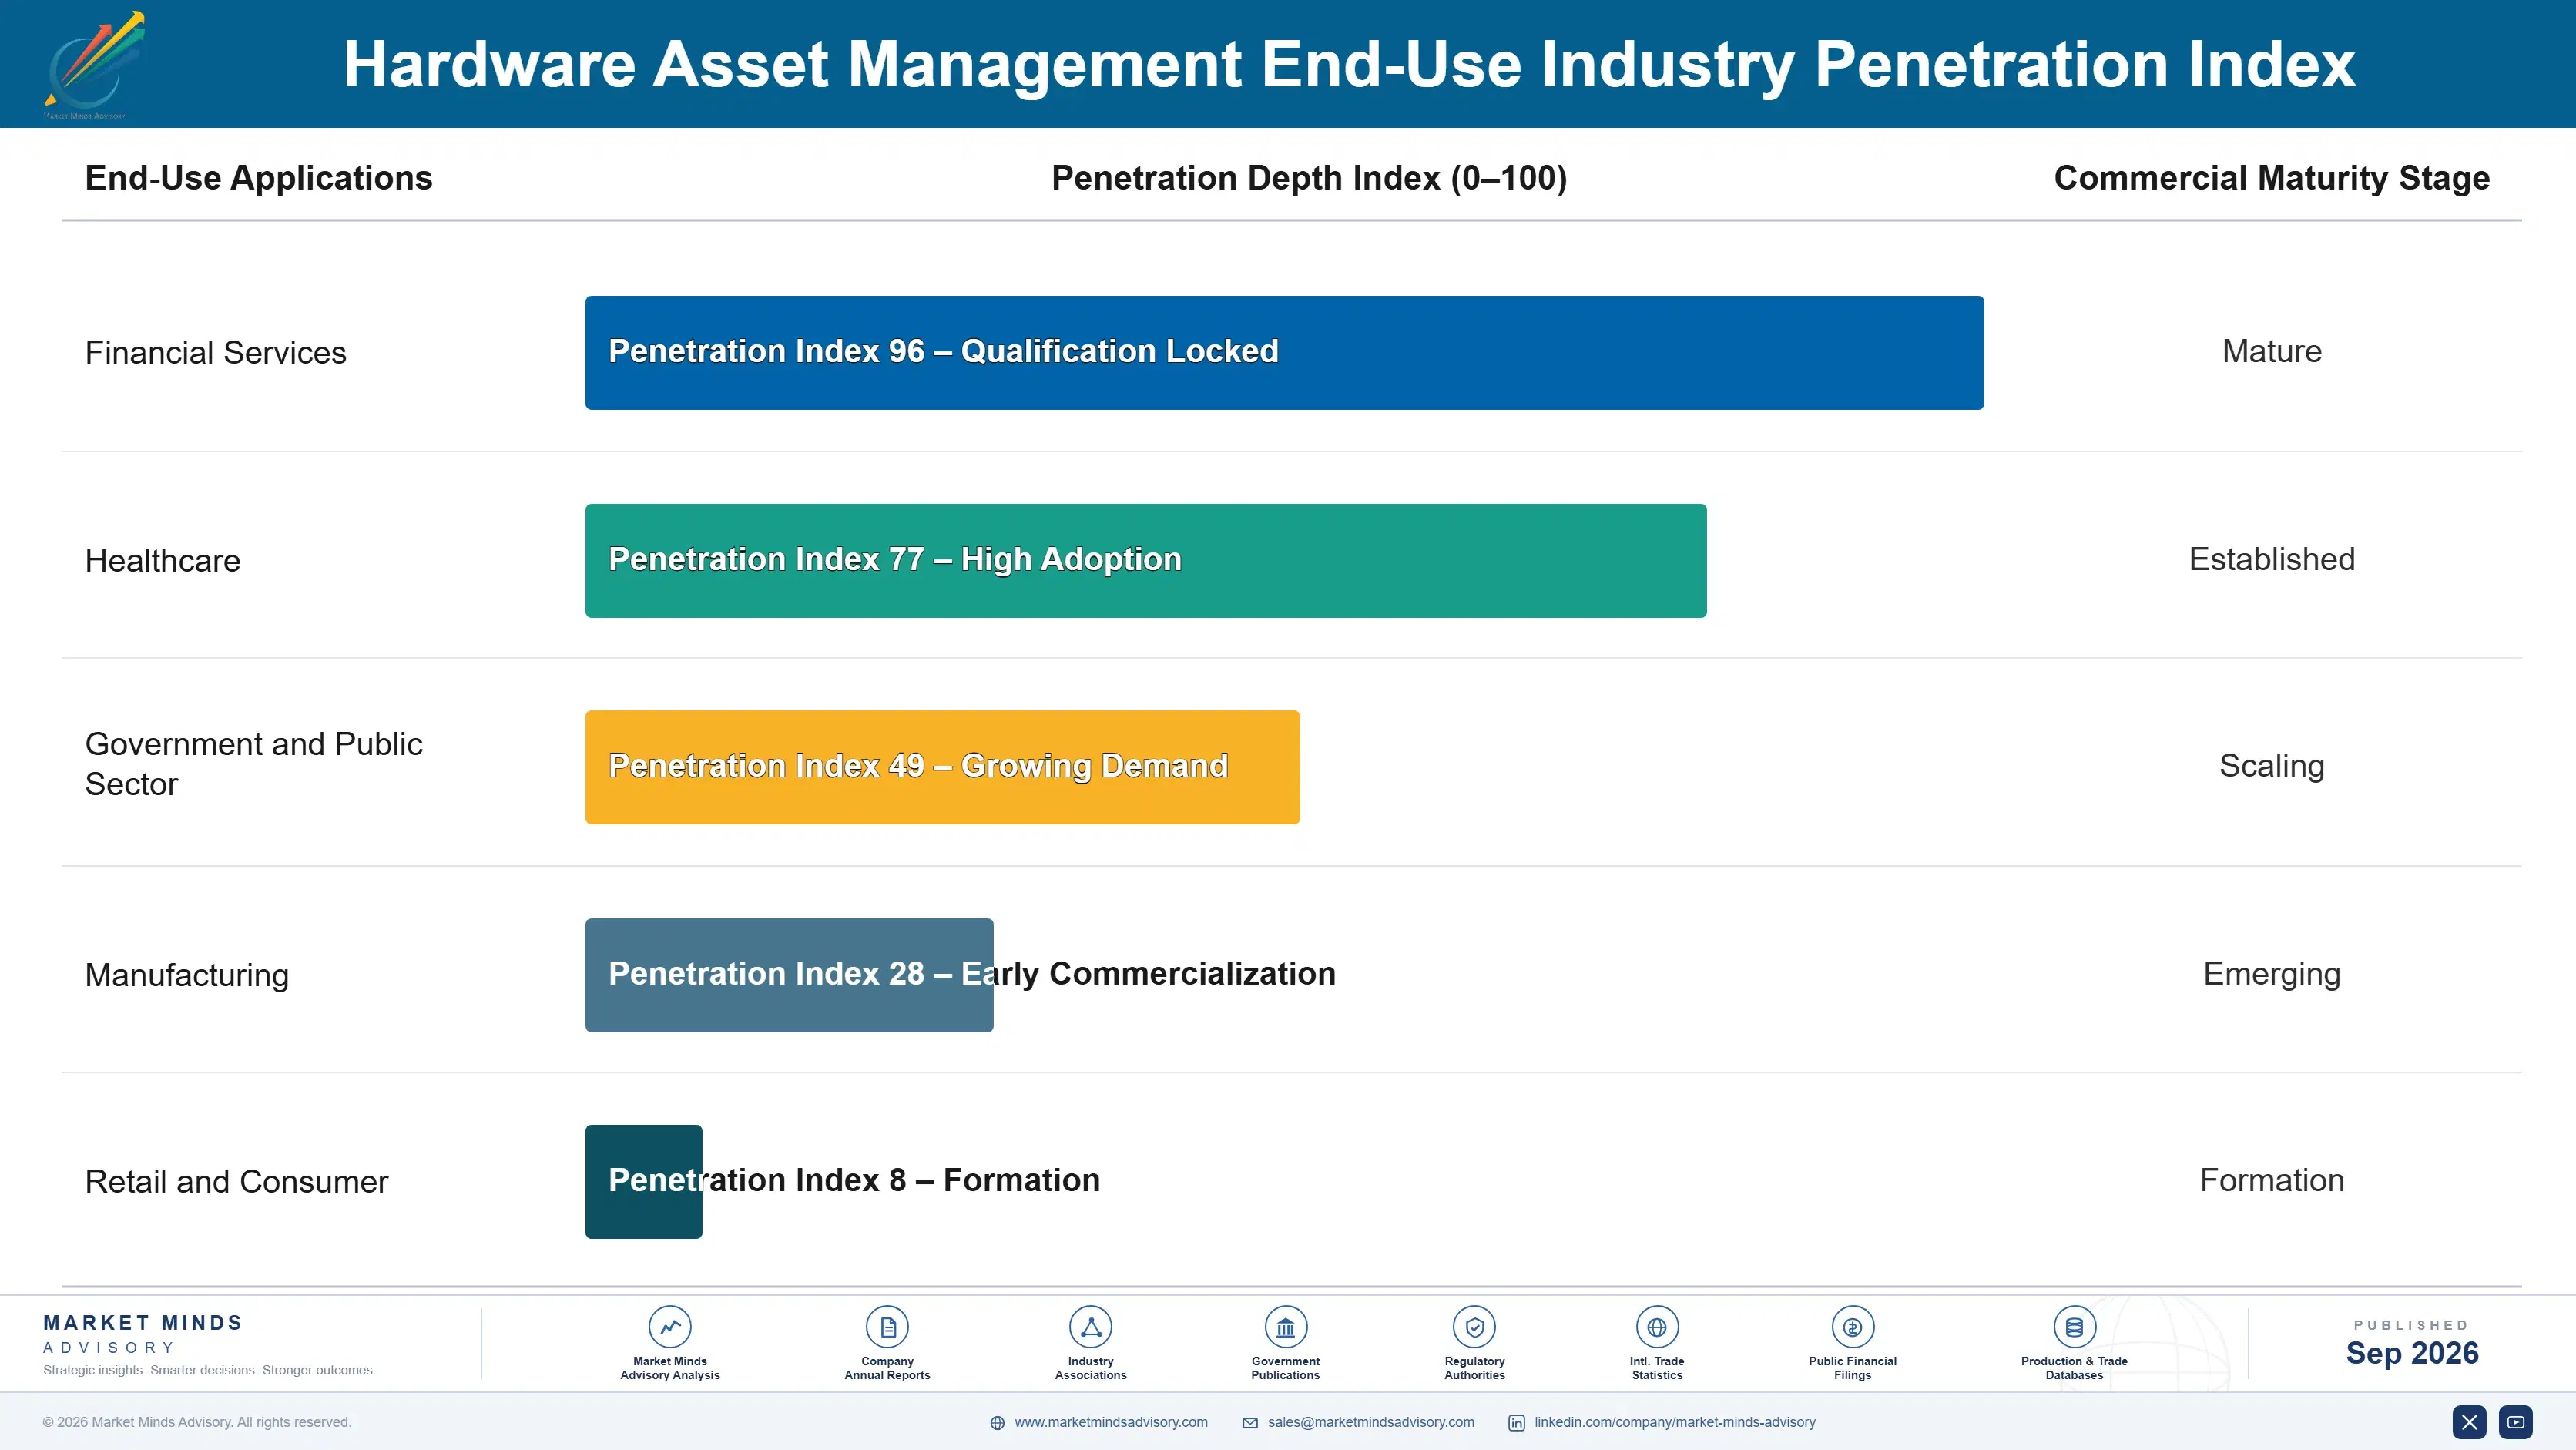
Platform revenue behaves like an annuity once an enterprise integrates a vendor's discovery agent across its network, since switching vendors requires re-deploying agents and retraining IT staff, a cost most enterprises avoid unless service quality deteriorates. This stickiness means vendors earn recurring revenue across every device an enterprise manages for years after initial deployment, with almost no incremental sales cost.
Adoption depth varies sharply by end-use vertical. Financial services and healthcare enterprises adopt full lifecycle platforms quickly since regulatory audit exposure directly affects compliance risk, while manufacturing and retail enterprises integrate more slowly due to legacy operational technology systems that resist standard discovery methods. Small and mid-sized businesses sit furthest behind, since limited IT staff still rely heavily on manual tracking rather than automated platforms.

Buyer profiles are shifting generationally as newer IT leaders, trained on cloud-native and automation-first principles, replace an older generation comfortable with periodic manual audits and static spreadsheets. Younger IT directors expect asset visibility to integrate directly with security and procurement software from day one, treating a standalone inventory database as an outdated concept. This generational turnover is accelerating adoption of continuous, API-first discovery tools faster than pricing alone would predict.
hardware-asset-management-market-end-use-penetration-index-1788417117594

Where MMA Sees the Real Bets

These are among the four positions where our research anticipates prominent divergence between winners and laggards over the coming forecast period. Each is grounded in the demand model, the regulatory perimeter, and the announced capacity pipeline.
01 / AUTOMATED DISCOVERY PRIORITY

Build continuous discovery capability before enterprises standardize elsewhere

Vendors relying only on periodic manual scans are already losing enterprise contracts to platforms that can detect a new device the moment it connects to any network. This gap widens every quarter a vendor delays investment, since enterprise IT buyers increasingly treat continuous discovery as a baseline procurement requirement rather than a premium feature. MMA views discovery capability breadth as the clearest predictor of which platforms defend market share over the next five years, more so than raw workflow automation depth alone.
02 / DISPOSITION SERVICE EXPANSION

Package certified disposition and destruction as a standard add-on

Enterprises increasingly need clear, documented proof of proper device disposal to satisfy both electronic waste regulations and data security audits, and vendors that can provide this directly are capturing revenue that would otherwise flow entirely to a separate specialized disposition provider. Building this capability requires operational infrastructure and logistics expertise that most software-only vendors currently lack entirely today. MMA expects vendors who move first on this front to post materially stronger margin expansion than pure software peers relying on licensing alone.
03 / COMPLIANCE CONSULTING BUILD

Layer audit defense consulting onto existing platform data

Software and hardware audit exposure is rising steadily as license and compliance vendors tighten enforcement across most major markets, creating a genuine near-term revenue opportunity for platforms with the underlying compliance data already collected through normal operation. Vendors with credible consulting expertise can charge a meaningful premium for this guidance before the capability becomes commoditized across the broader market. MMA advises treating this as a standing product priority rather than a reactive feature bolted on once competitors already offer something similar.
04 / LEGACY MIGRATION STRATEGY

Build dedicated migration tooling for legacy system displacement

Legacy system integration complexity remains the single largest friction point preventing enterprises from switching away from incumbent platforms entirely, even when the modern alternative clearly offers superior underlying capability. Vendors that invest early in dedicated migration tooling and phased rollout support can convert this friction into a genuine competitive advantage rather than treating it as an unavoidable sales obstacle. MMA firmly regards migration tooling investment as a meaningfully lower-risk approach than competing purely on feature breadth alone against larger incumbents.

Engagement Snapshot From the Field

A live engagement with an industry participant carrying material or product regulatory and market exposure ahead of a defining policy shift, showing how our research translates into a defensible multi-year portfolio strategy.
MARKET MINDS ADVISORY · CLIENT ENGAGEMENT SUMMARY
Hardware Asset Management Producer Strategic Portfolio Review and Transition Roadmap 2026·Investment Scenario on Hardware Asset Management Exposure Evaluation 2025-26
CLIENT PROFILE
The client is a mid-sized regional financial services firm operating across twelve branch offices and a growing remote workforce, managing roughly 8,000 laptops, servers, and network devices without a centralized automated discovery platform. Its existing tracking relied on a combination of spreadsheets and departmental purchase records that no longer reflected which devices were actually deployed where.
STRATEGIC CHALLENGE
The firm faced a looming regulatory examination that would require demonstrating accurate hardware inventory and documented data destruction records for retired devices, exposure its existing manual process could not credibly support. Leadership needed a deployable discovery and lifecycle platform within one fiscal quarter, without disrupting ongoing branch operations during rollout.
MMA APPROACH
MMA conducted a rapid audit of the firm's existing device population alongside interviews with IT and compliance leadership, then benchmarked three platform vendors against deployment speed and audit reporting capability. The engagement produced a phased rollout plan prioritizing headquarters and the highest-risk branch offices first, sequenced to demonstrate compliance readiness before the regulatory examination window opened.
KEY FINDINGS
  1. Nearly 30 percent of the firm's device inventory could not be located using existing spreadsheet records, a critical near-term compliance exposure gap.
  2. A cloud-based discovery agent could be deployed across all twelve branch offices within three weeks, far faster than an equivalent on-premises alternative.
  3. Two of three vendors evaluated already offered certified data destruction documentation that would fully satisfy the anticipated regulatory examination requirements ahead of time.
  4. Retired devices sitting in storage without documented disposition represented the firm's single largest compliance gap identified during the entire audit review process.
CLIENT PROFILE
The client is a mid-sized regional financial services firm operating across twelve branch offices and a growing remote workforce, managing roughly 8,000 laptops, servers, and network devices without a centralized automated discovery platform. Its existing tracking relied on a combination of spreadsheets and departmental purchase records that no longer reflected which devices were actually deployed where.
STRATEGIC CHALLENGE
The firm faced a looming regulatory examination that would require demonstrating accurate hardware inventory and documented data destruction records for retired devices, exposure its existing manual process could not credibly support. Leadership needed a deployable discovery and lifecycle platform within one fiscal quarter, without disrupting ongoing branch operations during rollout.
MMA APPROACH
MMA conducted a rapid audit of the firm's existing device population alongside interviews with IT and compliance leadership, then benchmarked three platform vendors against deployment speed and audit reporting capability. The engagement produced a phased rollout plan prioritizing headquarters and the highest-risk branch offices first, sequenced to demonstrate compliance readiness before the regulatory examination window opened.
KEY FINDINGS
  1. Nearly 30 percent of the firm's device inventory could not be located using existing spreadsheet records, a critical near-term compliance exposure gap.
  2. A cloud-based discovery agent could be deployed across all twelve branch offices within three weeks, far faster than an equivalent on-premises alternative.
  3. Two of three vendors evaluated already offered certified data destruction documentation that would fully satisfy the anticipated regulatory examination requirements ahead of time.
  4. Retired devices sitting in storage without documented disposition represented the firm's single largest compliance gap identified during the entire audit review process.
RECOMMENDED STRATEGY
Phase 1: Phase 1 (Months 1-2): deploy discovery agents across headquarters and the two highest-risk branch offices first, immediately and without delay. Phase 2: Phase 2 (Months 2-3): extend deployment to the remaining ten branch offices and complete all retired device disposition fully across the network. Phase 3: Phase 3 (Month 3): compile complete audit-ready documentation ahead of the scheduled regulatory examination window opening formally the following month.
OUTCOME
The firm achieved full inventory visibility and completed retired device disposition documentation within ten weeks, ahead of the regulatory examination (client-reported, unverified by MMA). The examination proceeded without any hardware-related compliance findings for the first time in the firm's recent examination history (client-reported, unverified by MMA).

Frequently Asked Questions

Foundational context covering the market sizes, CAGR, scope, country, region and competition that inform every finding below. This section is provided to cover basics and most often pre-purchase conversations, answered from the MMA Primary Research Dataset.

What is the current size of the Hardware Asset Management Market?

The Hardware Asset Management Market reached 5.4 billion dollars in 2025, the report's base year for all forecast calculations. This figure covers discovery, inventory, and disposition software globally.

How large will the Hardware Asset Management Market be by 2036?

The market is projected to reach 15.1 billion dollars by 2036, roughly 2.55 times its 2026 starting value. That growth reflects hybrid work permanence and tightening compliance enforcement.

What is the CAGR for the Hardware Asset Management Market 2026 to 2036?

The market is forecast to grow at a 9.8 percent compound annual rate between 2026 and 2036. Bull and bear scenarios range from 11.1 percent to 8.5 percent respectively.

Which segment is growing fastest?

Automated discovery and lifecycle platforms lead growth at 14.5 percent CAGR, roughly 1.48 times the overall market rate. Hybrid fleet complexity spreading across enterprises is driving this expansion.

Who are the major companies in the Hardware Asset Management Market?

ServiceNow, Ivanti, Flexera, Lansweeper, and Asset Panda lead the market on a platform revenue basis. Together these five vendors hold roughly 38 percent combined share.

Which country is growing fastest?

India leads country-level growth at 15.0 percent CAGR, driven by its expanding IT services and business process outsourcing sector. Domestic firms are adopting platforms internally before offering managed services to clients.

Report Segmentation Architecture

The full report scope spans multiple orthogonal segmentation dimensions, with cross-tabulated demand data provided for each dimension pair. Coverage extends further to regional breakdowns, trend trajectories, and the competitive detail needed to support segment-level decision-making.

By Primary Market Dimension

  • Automated Discovery and Lifecycle Platforms
  • Traditional Inventory and License Reconciliation Tools
  • Certified Data Destruction Services
  • Predictive Maintenance Analytics
  • IT Service Management Bundled Modules

By End-Use Industry

  • Financial Services
  • Healthcare
  • Government and Public Sector
  • Manufacturing
  • Retail and Consumer

By Commercial Dimension

  • Large Enterprise
  • Small and Medium Business
  • Government Agency
  • Managed Service Provider

By Region

  • North America
  • Western Europe
  • East Asia
  • South Asia and Pacific
  • Latin America
  • Middle East and Africa
  • Eastern Europe

Scope, Methodology, and Coverage

Every figure in this report is reproducible from documented input assumptions. The scope below maps the historical period, the forecast horizon, the segmentation dimensions, and the countries covered, alongside the underlying primary and qualitative methodology.
Historical Period
2020 to 2025
Forecast Period
2026 to 2036
Base Year
2025 (USD billions; MMA Primary Research Dataset, September 2026)
Market Definition
This report covers software platforms used to track, manage, and optimize the lifecycle of physical IT hardware assets, including discovery, inventory, and disposition tools, measured on a global software revenue basis across enterprise and government deployments. It excludes software asset management tools tracking license entitlements and general IT service management ticketing platforms not specifically focused on physical hardware.
Quantitative Units
USD billions, global market size and forecast
Segmentation Dimensions
Product/technology type, end-use industry, commercial/customer dimension, region
Regions Covered
North America, Western Europe, East Asia, South Asia and Pacific, Latin America, Middle East and Africa, Eastern Europe
Countries Covered
United States, China, Germany, France, United Kingdom, Japan, South Korea, India, Canada, Brazil, Mexico, Indonesia, Vietnam, Thailand, Malaysia, United Arab Emirates, Saudi Arabia, South Africa, Nigeria, Turkey, Poland, Netherlands, Italy, Spain, Sweden, Switzerland, Argentina, Colombia, Australia, Singapore, and additional markets relevant to this sector
Key Companies Profiled
ServiceNow, Ivanti, Flexera, Lansweeper, Asset Panda, Freshworks, Zylo, Snipe-IT, Device42, Oomnitza, AssetSonar, GoCodes, InvGate, ManageEngine, Atlassian Jira Service Management, Cherwell Software, EZOfficeInventory, Sunview Software, Alloy Software, Samanage
Quantitative Methodology
Primary survey, n=3,800 respondents, Q4 2025, six countries; demand-side model with trade association cross-validation
Qualitative Methodology
47 expert interviews, Q4 2025; applied to validate demand model assumptions, identify emerging dynamics, and assess competitive positioning
Report Format
PDF and XLSX data workbook (Word format preview document)
Publisher
Market Minds Advisory
Report Code
MMA-2026-TEC-132
Published
September 2026
Contact
sales@marketmindsadvisory.com | www.marketmindsadvisory.com

Purchase the full Hardware Asset Management Market Report (2026 to 2036).

This report delivers a comprehensive analysis of the global Hardware Asset Management Market, covering market sizing, segmentation, and regional dynamics through 2036. It profiles the competitive landscape across twenty leading vendors, benchmarked on a consistent platform revenue basis. Regional analysis spans all seven major world regions, quantifying share and growth rate differences driven by regulatory, workforce, and enterprise digitization factors. The report also examines revenue diversification strategies, input cost exposure, and portfolio economics shaping vendor profitability. A dedicated case study illustrates practical implementation lessons for enterprises pursuing platform rollouts.
Ten-year market size and CAGR forecast through 2036
Five-segment MECE market breakdown with growth rates
Seven-region share and growth rate analysis
Twenty-company competitive benchmarking on platform revenue basis
Revenue diversification strategy analysis across four commercial levers
Anonymized client implementation case study with outcomes

Built For The People Who Decide

From boardroom strategy to bench-side execution, this report is read cover-to-cover by leaders shaping the next decade of their industry, turning demand scenarios, market dynamics and valuation benchmarks into decisions.
CXOs/ Presidents/ VPs/ Managers
M&A and Corporate Development
Strategy Teams and R&D Heads
Procurement and Product Directors
Regulatory and Compliance Leaders
Investor Relations and Equity Analysts