Market Minds Advisory
Green Transformer Market

Green Transformer Market: Nobody Actually Buys Them for the Environment

The environmental argument sells almost nothing here, while a fire point twice that of mineral oil removes a firewall, a containment pit, and clearance distance that cost more than the fluid ever will.

Lead Analyst

David Horsley

Published

September 2026

Make Smarter Decisions with Customized Research Insights

Request a free sample report and evaluate market opportunities, growth trends, and competitive dynamics relevant to your business needs.

2025 MARKET VALUE$3.2BMarket Size 2025
2036 FORECAST VALUE$9.3BBase Case , 2026 to 2036
CAGR 2026 TO 203610.2 %Bull 11.4% / Bear 9.0%
INCREMENTAL OPPORTUNITY$5.8BNet 10- year value creation
EXPANSION MULTIPLE2.64x2036 value over 2026 base
Strategic Levers
M&A Pipeline
Regional Outlook
Country Rankings
Competitive Intelligence
Segmental Deep-dive
Call-Us : 91 93563 13602

Executive Snapshot and Market Trajectory

Ester-filled transformers get specified for fire safety, not for biodegradability. A fire point near 316 degrees against roughly 170 for mineral oil removes the firewall, the containment pit, and the clearance distance, and those civil works cost far more than the fluid premium ever does.
Growth runs at 10.2% and the distribution end leads it. Natural ester filled distribution transformers grow at 15.3%, exactly 1.50 times the market rate, because that is where urban siting constraints bite hardest. East Asia holds the largest share at 30%, on Chinese and Indian manufacturing scale plus the highest amorphous core adoption anywhere. Synthetic esters follow at 12.6% in transmission and offshore applications where thermal stability matters.
Concentration is high at 58% across the top five measured on annual megavolt-amperes shipped with alternative insulating or low-loss systems. Fluid qualification is the barrier: a utility that has approved one ester will not requalify casually, and the approval process runs years rather than months in most systems. Chinese manufacturers supply both core types at costs Western producers cannot approach. Dry-type cast resin transformers compete for exactly the same indoor and basement positions.
Market Definition
This market covers transformers using alternative insulating systems or low-loss core designs that reduce fire risk, environmental exposure, or energy loss, spanning natural ester filled distribution transformers, synthetic ester filled power transformers, amorphous and low-loss core transformers, dry-type cast resin transformers, and silicone and alternative fluid transformers. Conventional mineral oil transformers, switchgear and protection equipment, transformer monitoring supplied separately, and installation and civil works fall outside scope.
Base Year Value
$3.2B in 2025 (MMA Primary Research Dataset, August 2026)
Forecast Period
2026 to 2036, eleven discrete annual values
CAGR
10.2% base case. Bull 11.4%. Bear 9.0%.
Fastest Growth Segment
Natural Ester Filled Distribution Transformers: 15.3% CAGR
Fastest Growth Country
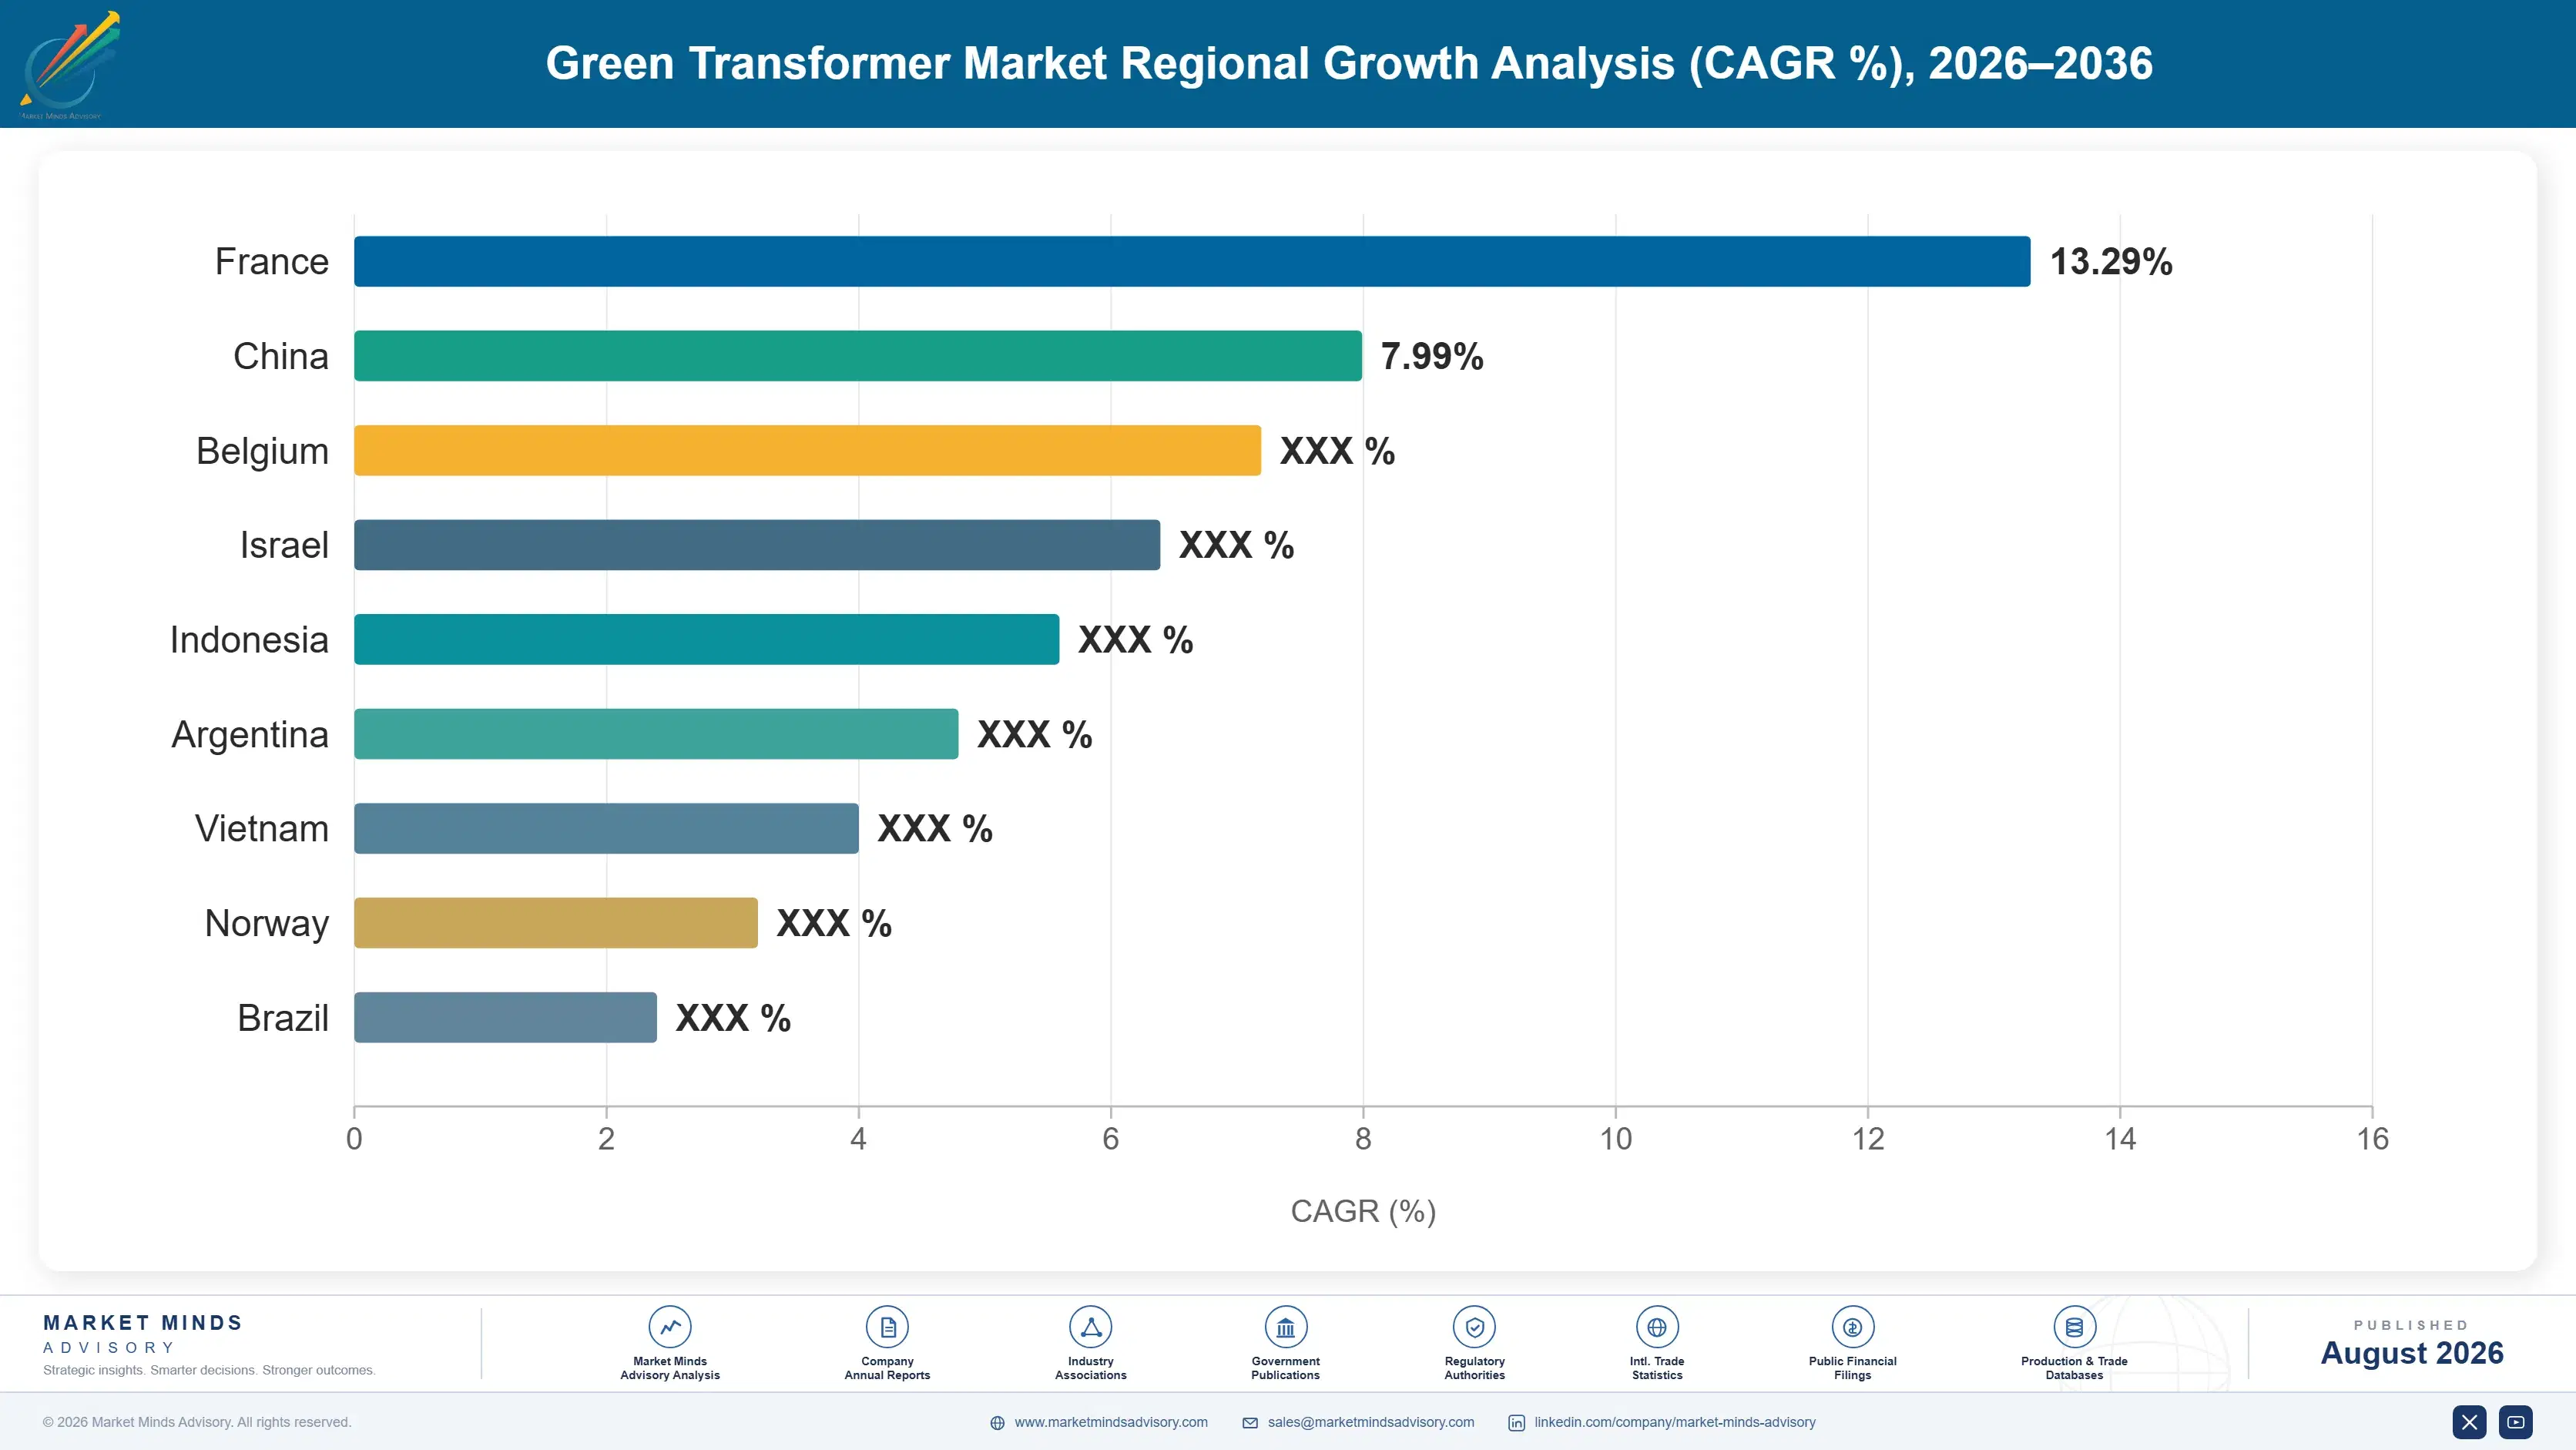
India: 13.0% CAGR
Fastest Growth Region
South Asia and Pacific: 12.2% CAGR
Largest Region
East Asia: 30% of 2025 global value
Market Leaders
Hitachi Energy, Siemens Energy, Eaton, Schneider Electric, TBEA. Source: MMA Analysis based on company annual reports.
Primary Survey
n=3,800 procurement and R&D decision-makers, Q4 2025, six countries
Methodology
Demand-side build-up, cross-validated against public data, 47 expert interviews

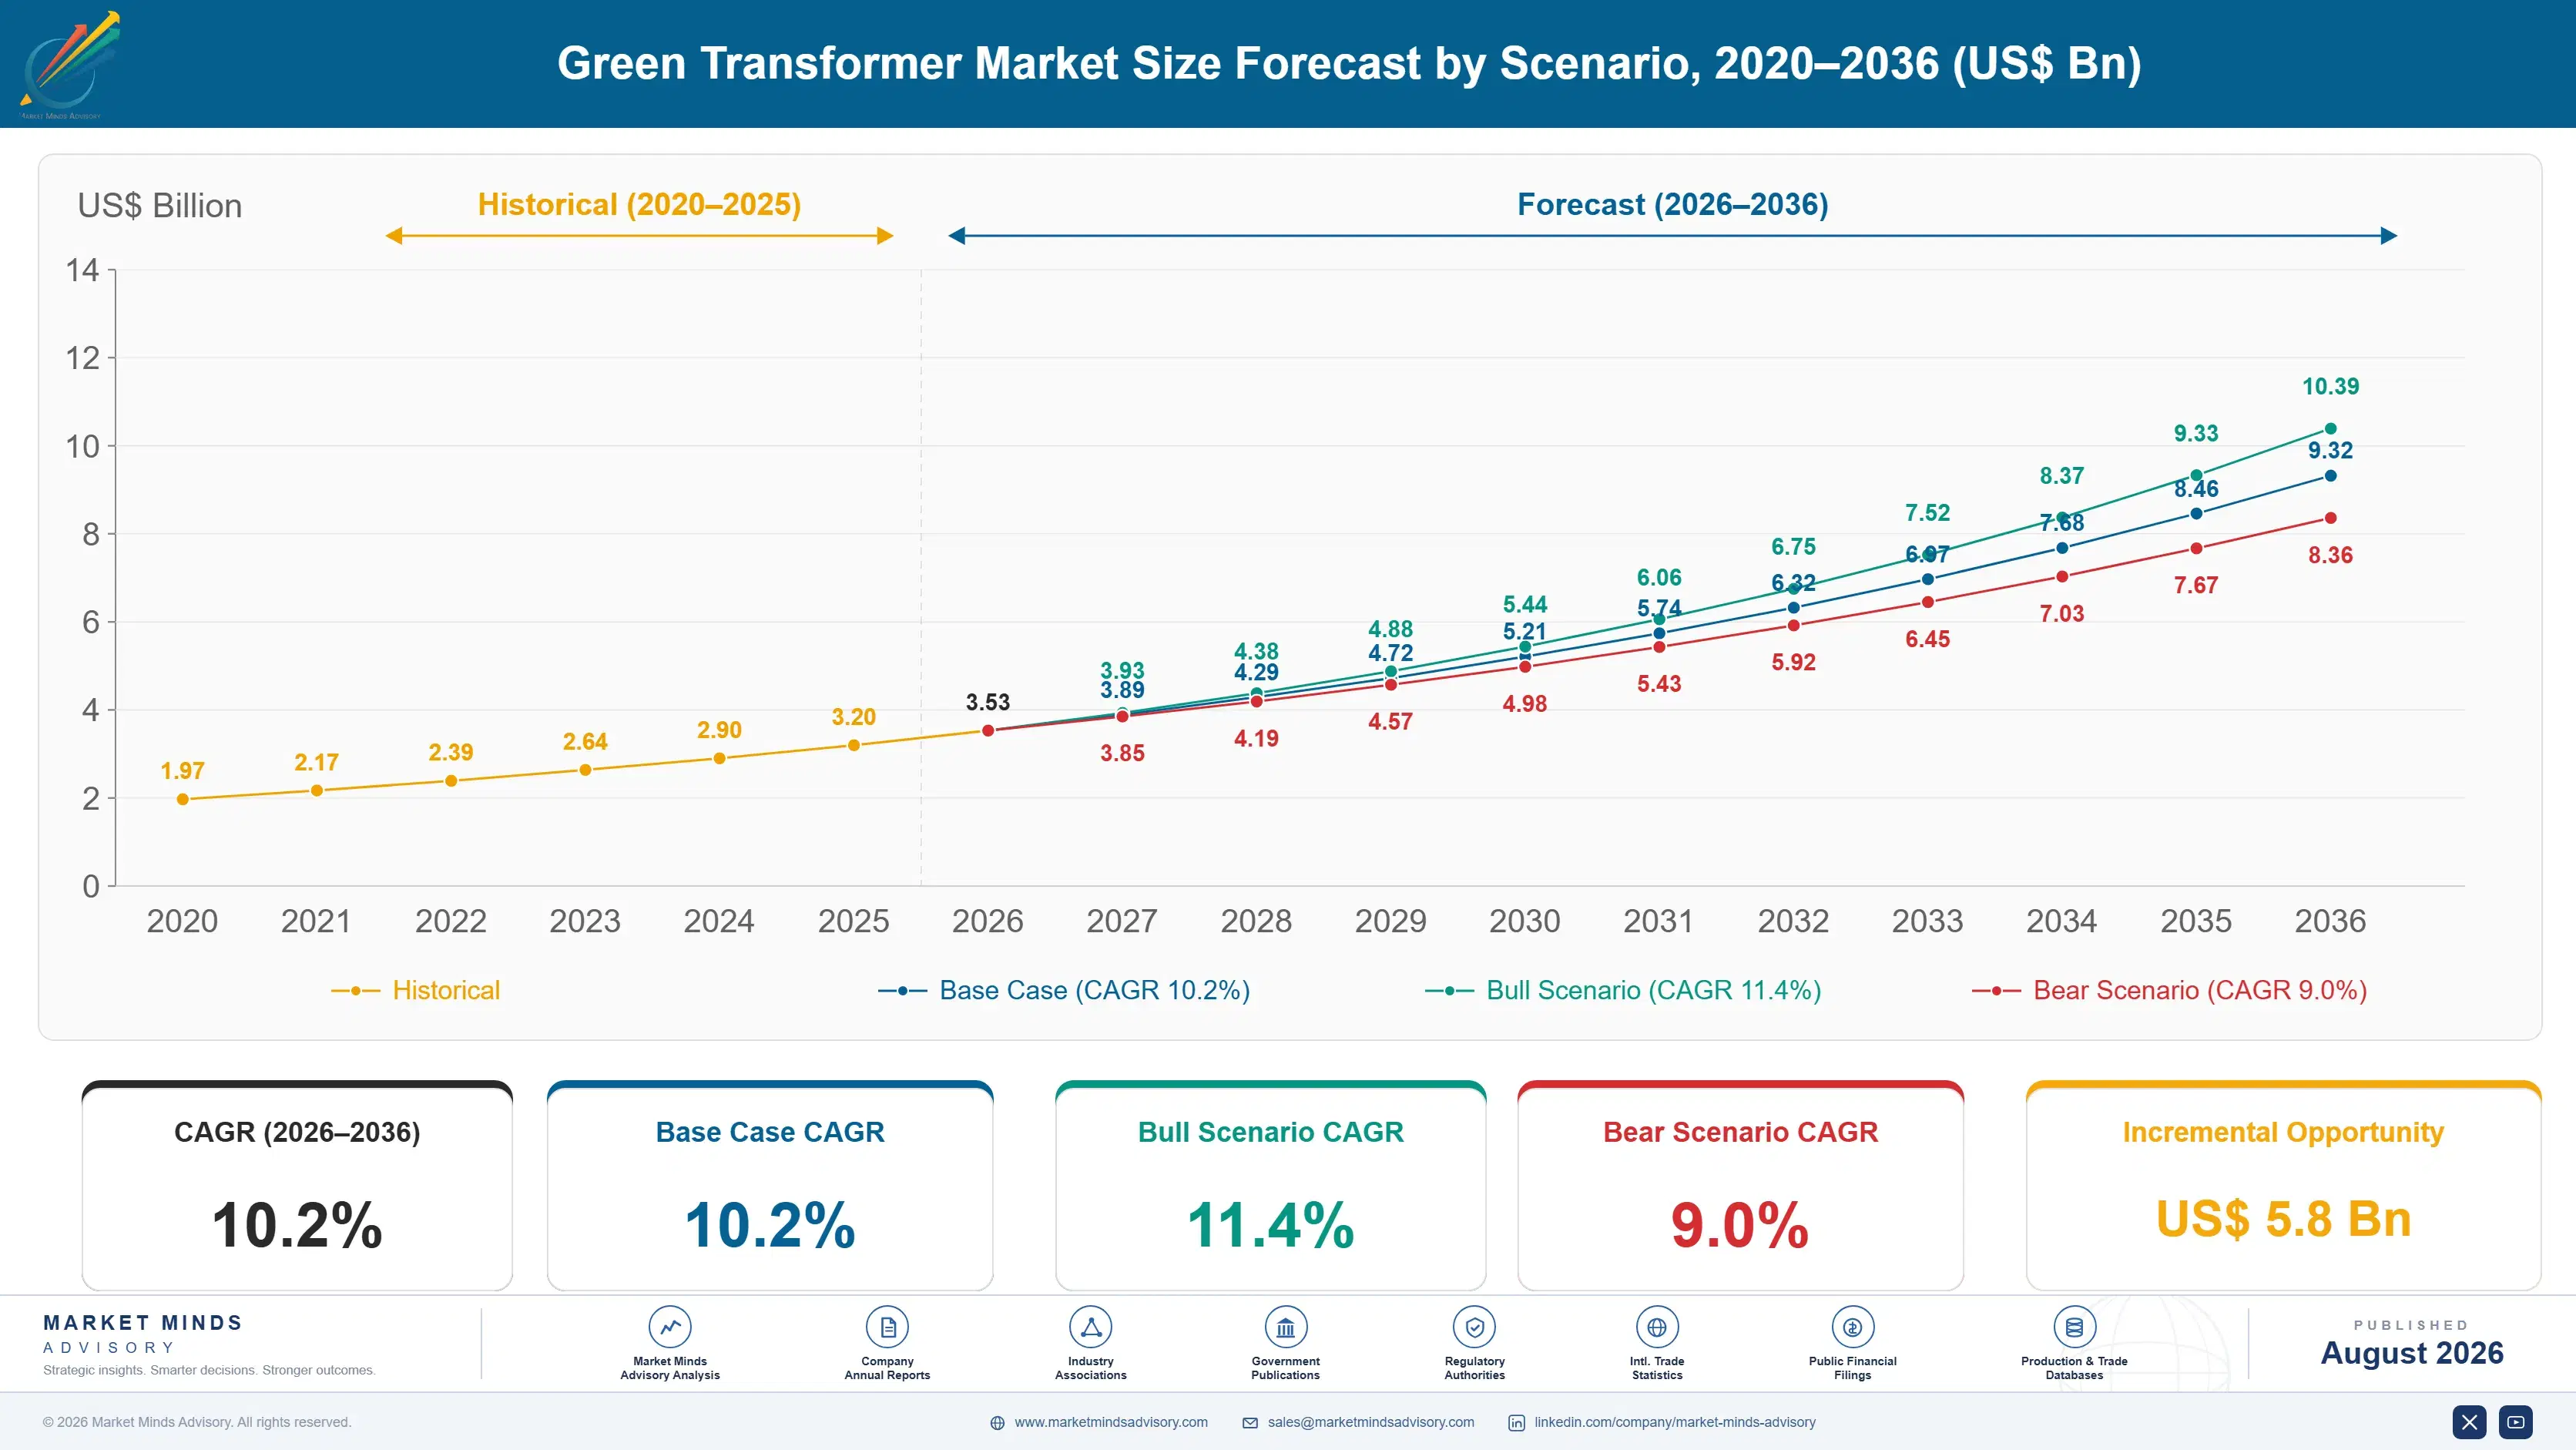
Green Transformer Market Forecast Scenarios

green-transformer-market-size-forecast-scenario-1787301892843
The 2020 to 2025 period ran at 8.8% and grid investment rather than environmental policy carried it. Distribution transformer demand rose sharply from 2022 as connection queues lengthened and utilities rebuilt ageing networks, and lead times stretched across the whole sector. Ester adoption grew steadily on urban siting rather than on any specification mandate, which is roughly where it had been growing beforehand.
Three mechanisms carry the 10.2% base case. Urban and indoor substation siting is the largest, since removing fire separation saves civil works that exceed the fluid premium several times over. Efficiency regulation on distribution transformers is the second, which pulls low-loss and amorphous cores independently of fluid choice. And offshore wind and data centre construction is the third, where fire risk is not negotiable. None of the three depends on environmental policy tightening at all.
The 11.4% bull case rests on efficiency regulation tightening across Asian distribution networks, which would pull amorphous core volume far faster than fluid substitution ever has. The 9.0% bear case is ester fluid supply constraint combined with utility procurement continuing to award on capital cost, where a 3.4 times fluid premium loses to a mineral oil quotation every time.

The Fire Point Does the Selling

The name is misleading and the industry knows it. Ester fluids do biodegrade, and that fact appears in every brochure and closes almost no sales. What actually moves a specification is a fire point near 316 degrees against roughly 170 for mineral oil, which changes how and where a transformer can be installed rather than what happens if it leaks into soil.
ESTER FIRE POINT316 degreesAgainst roughly half that for conventional mineral insulating oil
FLUID PRICE PREMIUM3.4 timesPer litre against the mineral oil it directly replaces
CIVIL WORKS SAVING180,000 dollarsPer urban substation position from removed fire separation requirements
RETROFILL RESIDUAL LIMIT7%Of mineral oil above which the fire classification is lost
ALTERNATIVE FLUID SHARE14%Of new distribution transformers specified with alternative insulating fluids
TOP FIVE CONCENTRATION58%High, on manufacturing scale and fluid qualification barriers
That difference is worth real money. A transformer that cannot ignite readily can sit inside a building, next to an occupied structure, or in a compact urban substation without a firewall, a containment pit, or the clearance distance a mineral oil unit demands. The civil works removed run around 180,000 dollars per urban substation position, against a fluid premium of roughly 3.4 times per litre on a comparatively small volume.
Retrofilling an existing mineral oil transformer looks like a cheap route to the same benefit and frequently is not. Residual mineral oil above roughly 7% pulls the fire point back down and the fire classification is lost, so the civil works cannot be relaxed and the entire commercial case collapses. Achieving that residual requires multiple flushes and hot oil circulation that most conversions do not budget for.
"A utility told me they'd gone ester for sustainability reasons. Their own business case was three pages of avoided firewall and one paragraph about biodegradability, and the paragraph was written last."
Director, Grid Equipment and Electrical Infrastructure Practice · MMA Energy Inf

Market Trends

Urban Siting Constraints Rather Than Policy Drive Adoption

Substations are being pushed into buildings, basements, and compact urban positions where fire separation is either impossible or extremely expensive to provide. An ester fire point near 316 degrees removes the firewall, containment pit, and clearance distance, saving around 180,000 dollars per urban position against a fluid premium of roughly 3.4 times per litre. Natural ester distribution transformers grow at 15.3% against 10.2% for the market on that argument alone. Procurement functions measured on equipment capital cost never see the construction budget that saving sits in. Suppliers quoting installed cost reverse the comparison entirely.
Market Impact: Fire point reaches 316 degrees
Efficiency Regulation Pulls Cores Independently Of Fluids

Distribution transformer efficiency standards tightening across Asian and European networks drive amorphous and low-loss core adoption on a completely separate track from insulating fluid choice, since no-load loss is a core material question rather than a dielectric one. Chinese and Indian utilities specify amorphous cores at rates well above Western equivalents. Manufacturers treating these as one green transformer story are misreading two different buying decisions taken by different people. No-load loss and fire classification reach different buyers holding different budgets and different obligations. Sales teams organised around a product category rather than a buying decision confuse both audiences.
Market Impact: Alternative fluids at 14% share

Market Opportunities and Growth Drivers

Data Centre And Offshore Construction Removes Fire Negotiation

Data centre operators and offshore wind developers both site transformers where a fire would be catastrophic and where firefighting access is limited or absent entirely. Neither buyer treats fire risk as a cost trade to be optimised, so an ester specification arrives at design rather than through a business case. These segments also pay for continuous monitoring alongside, and they specify at a level that commercial building projects rarely approach. Campus construction volume across Virginia, Texas, and the Midwest is substantial and continuing. Offshore substation platforms carry the same reasoning with even less firefighting access available.
Market Impact: Premium reaches 3.4 times

Grid Replacement Cycles Open A Specification Window

Utilities replacing distribution transformers installed through the nineteen seventies and eighties reconsider specification at that point and almost never in between, since a working transformer is left alone for decades. Connection queue pressure has accelerated those programmes considerably since 2022. A supplier engaging during standards revision rather than during a tender captures the specification, and the alternative is competing on price against mineral oil quotations. Connection queue pressure has accelerated those replacement programmes considerably since 2022. Standards revision is the other window, and it recurs far less often than most suppliers assume. Engagement timing decides these outcomes.
Market Impact: Residual limit sits at 7%

Market Restraints and Challenges

Procurement Awards On Capital Cost Not Installed Cost

Utility procurement functions are measured on equipment capital cost while the civil works saving of around 180,000 dollars per urban position sits in a construction budget held elsewhere. The root cause is organisational rather than technical. Commercial impact is a 3.4 times fluid premium losing to a mineral oil quotation whenever the two budgets are separate. Mitigation runs through installed cost tendering, design-stage engagement ahead of procurement, and standards revision that removes the choice entirely. Network operators writing alternative fluids into standard specifications removed the conflict permanently rather than arguing it.
Market Impact: Distribution esters growing at 15.3

Retrofill Fails Above Seven Percent Residual Oil

Converting an existing transformer to ester requires residual mineral oil below roughly 7%, above which the fire point falls and the classification that justified the conversion is lost. The root cause is that mineral oil clings to paper insulation and windings and does not drain out. Commercial impact is conversions that deliver nothing while costing a great deal. Mitigation runs through multiple flushes, hot oil circulation, residual testing before recommissioning, and honest quotation of what proper conversion actually requires. Suppliers quoting the cheap version win the job and lose the account afterward.
Market Impact: Alternative fluids reach 14%
3 additional market trends, 4 additional growth drivers, and 2 additional restraints and challenges are covered in the full report. Contact sales@marketmindsadvisory.com to access the complete intelligence.

Segment CAGR and Growth Architecture

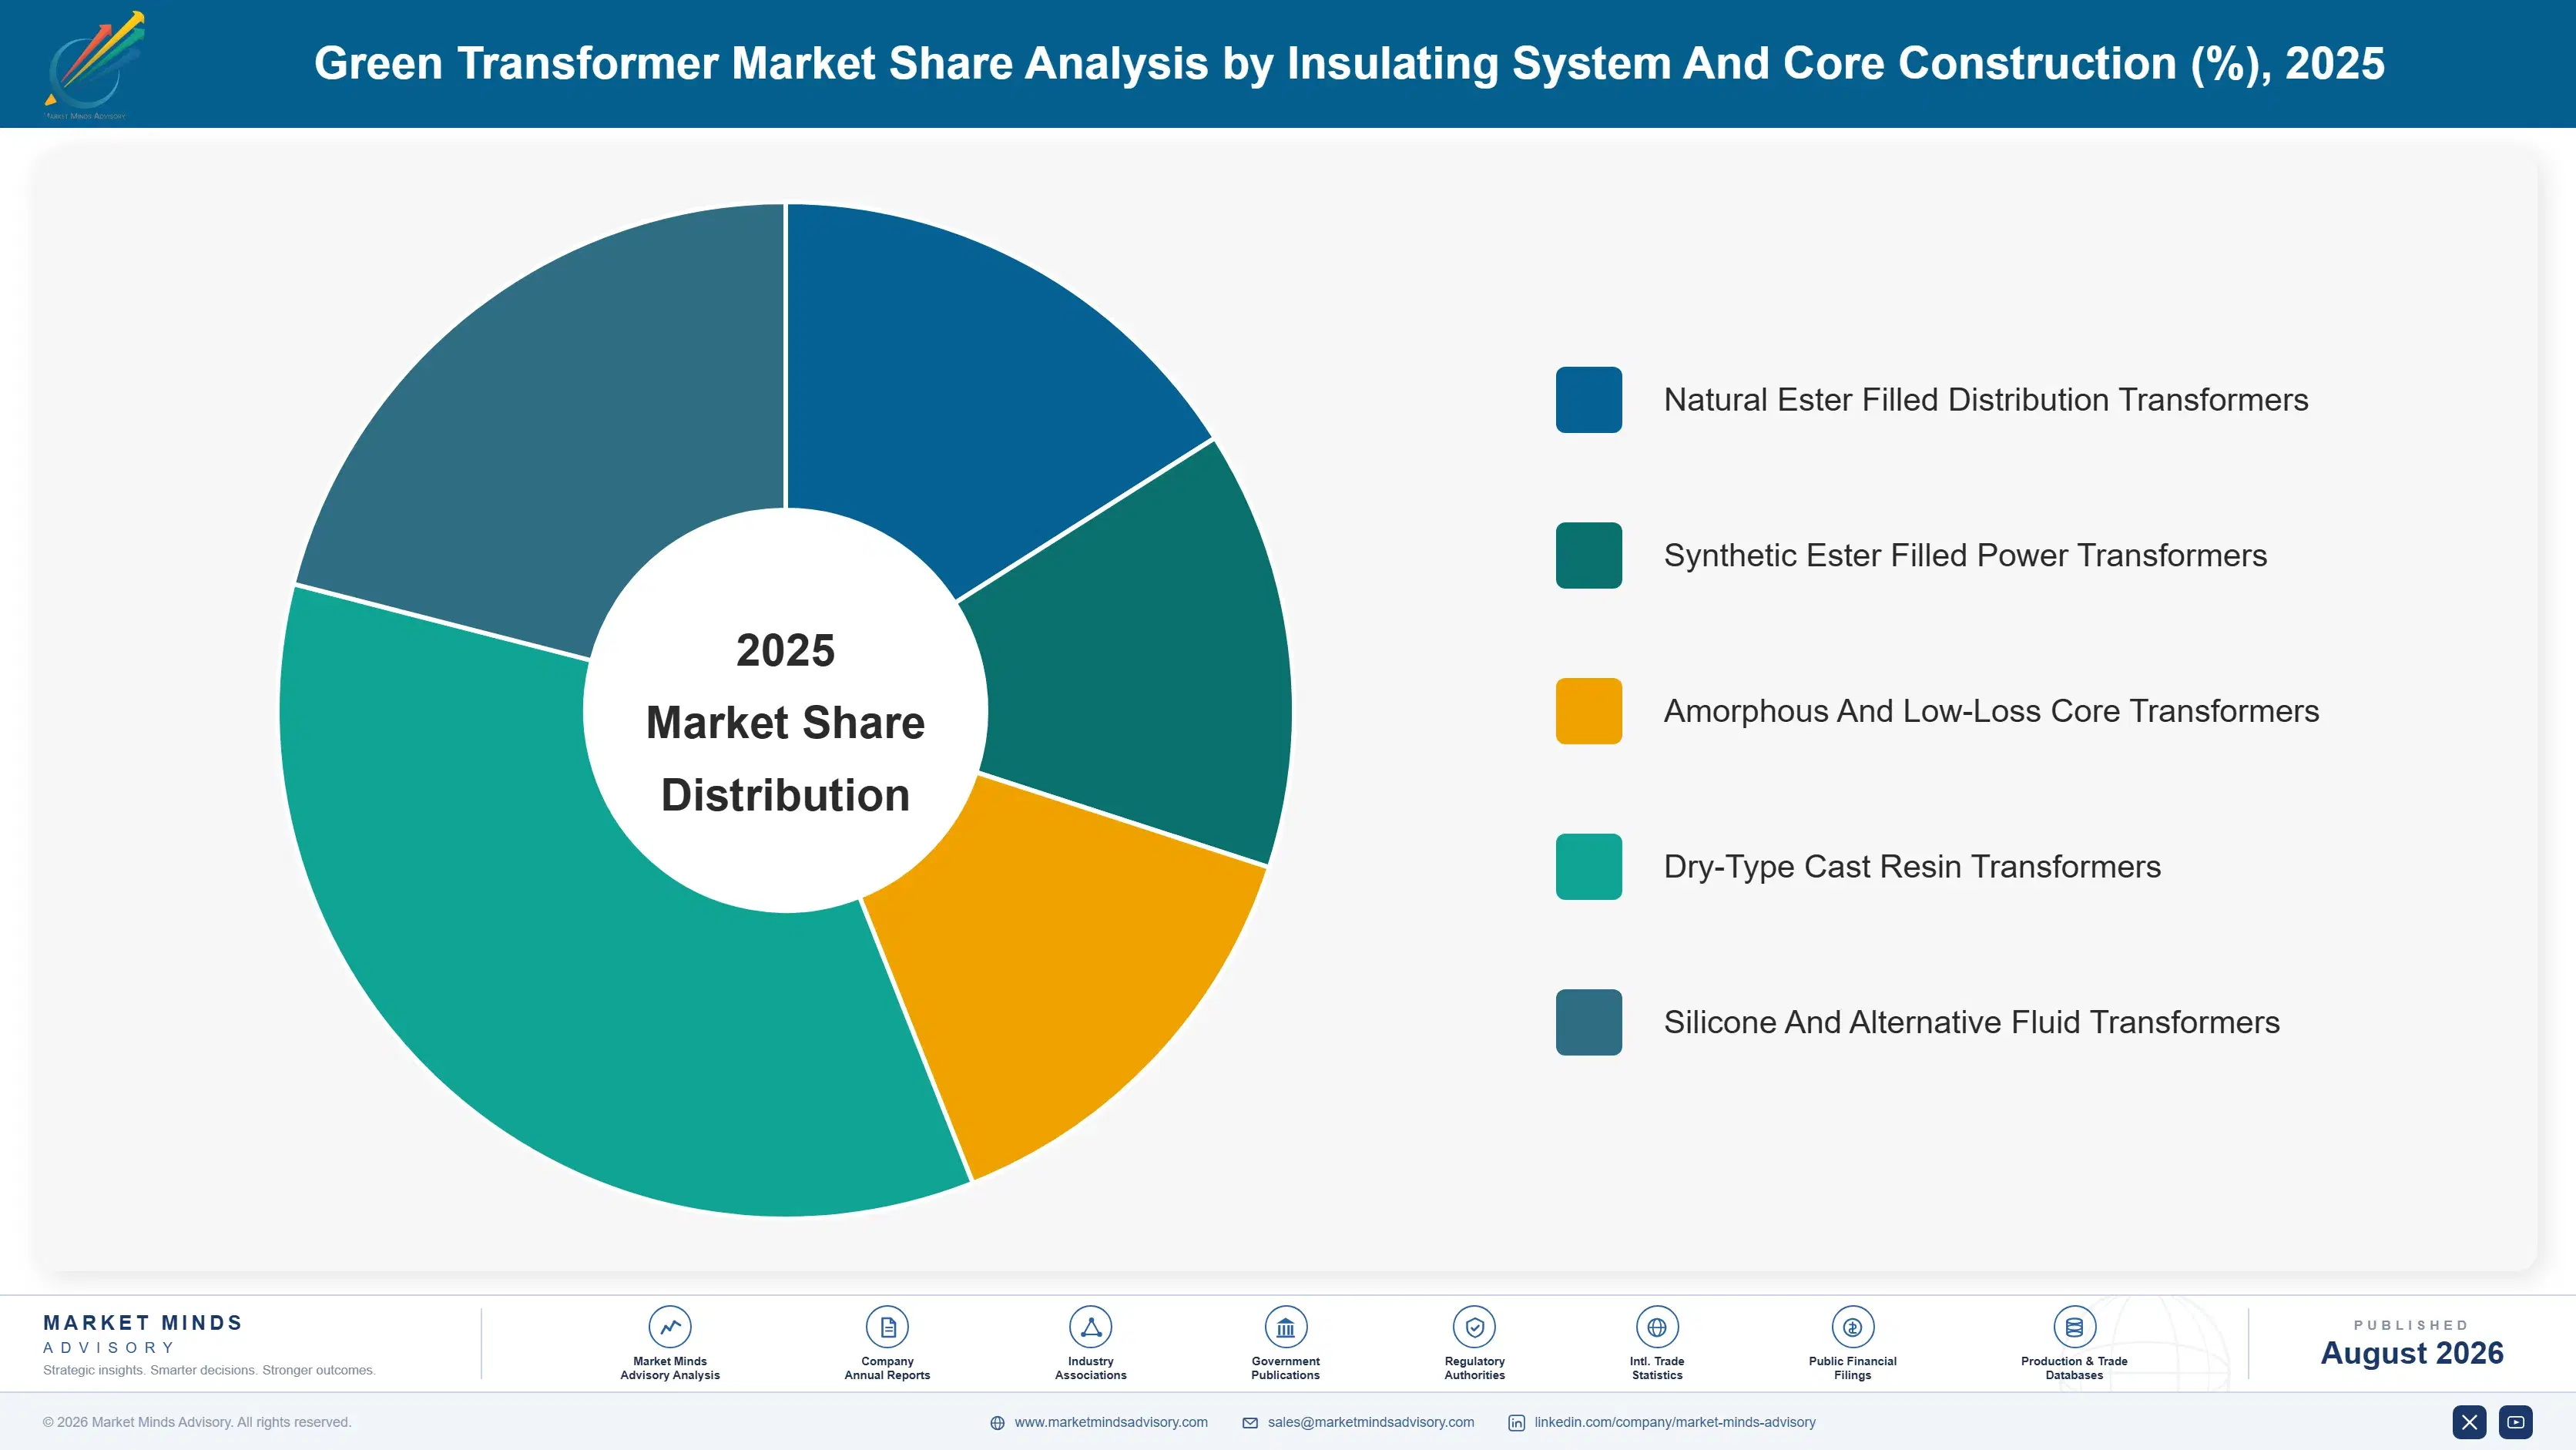
Segmentation follows insulating system and core construction, because those determine fire classification, siting freedom, loss performance, and which regulation or constraint actually drives the purchase. Voltage class and end-use application both cut across every construction type rather than separating them, which makes either a weaker primary dimension here. Construction type decides which constraint the purchase actually answers.
green-transformer-market-market-share-analysis-1787301893376

Natural Ester Filled Distribution Transformers

The fastest category at 15.3%, exactly 1.50 times the market rate, and the one where the siting argument bites hardest. Distribution transformers sit in urban positions, inside buildings, and beside occupied structures, so a fire point near 316 degrees removes civil works worth around 180,000 dollars per position against a modest fluid volume. Natural esters derived from vegetable oils also carry the strongest environmental credentials, which closes very few sales and satisfies procurement policies that increasingly require an answer on the question. Utility approval for a specific fluid runs years rather than months, which makes qualification a genuine switching cost. Networks that have written esters into standard specifications buy them without further argument.
CAGR 15.3%

Synthetic Ester Filled Power Transformers

Second fastest at 12.6%, used where thermal stability and moisture tolerance matter more than feedstock origin, which describes most transmission-level and offshore applications. Synthetic esters hold performance across wider temperature ranges and manage water uptake better than natural esters, and the fluid volumes involved are far larger so the premium is felt more sharply. Offshore wind and data centre substations specify these at design rather than through any business case, since fire risk in those positions is not treated as negotiable at all. Tank design matters more here too, since fluid volumes are large and the premium is felt on every litre. Manufacturers reusing mineral oil tank designs pay that difference on every unit shipped.
CAGR 12.6%
Full segment breakdown across 5 segments available in the complete report.

Regional Architecture and Country Demand Map

East Asia leads at 30% on Chinese and Indian transformer manufacturing scale combined with the highest amorphous core adoption anywhere. Western Europe follows on fire regulation and urban siting, ahead of North America. South Asia and Pacific grows fastest. Core standards and fire codes drive different regions differently.

East Asia

Thirty percent, the largest share, and manufacturing scale combined with core material adoption explains it rather than fluid substitution. Chinese producers build more distribution transformers than the rest of the world combined, and Chinese and Korean utilities specify amorphous cores at rates Western networks have never approached, driven by no-load loss standards applied across enormous installed populations. Ester adoption is growing from a lower base, concentrated in dense urban substations across Chinese and Japanese cities. Growth at 11.2% runs above the market rate on core standards rather than on fluids. Fluid qualification with Chinese utilities has proceeded far more slowly than core material adoption did. Manufacturing cost positions here shape pricing in every other region too.
Share: 30% | CAGR: 11.2% (2026 to 2036)

Western Europe

Fire regulation and urban siting rather than manufacturing volume explain this 23%. German, French, Nordic, and British codes make indoor and basement substations difficult with mineral oil, so ester specification follows the building rather than any environmental policy. Distribution network operators here have also written alternative fluids into standard specifications, which removes the procurement conflict rather than arguing through it each time. Growth at 8.6% is the slowest of any region, reflecting high existing penetration rather than weak demand for the technology. Standard specifications rather than project-by-project argument are what carried adoption to this level. Suppliers reaching those specification revisions early sold into whole networks afterward. Dry-type competes for the same indoor positions.
Share: 23% | CAGR: 8.6% (2026 to 2036)
Regional intelligence for 5 additional markets available in the complete report: North America, South Asia and Pacific, Latin America, Middle East and Africa, Eastern Europe. Contact sales@marketmindsadvisory.com.
green-transformer-market-country-cagr-analysis-1787301893896

Selling the Avoided Civil Works

The fire point reaches 316 degrees against roughly 170 for mineral oil, civil savings run near 180,000 dollars per urban position, the fluid premium is 3.4 times, and retrofill fails above 7% residual. Value comes from selling installed cost, reaching standards writers, and quoting conversion honestly. Two different buyers hold the two different arguments here.

Quote Installed Cost Including The Civil Works

A 3.4 times fluid premium loses to a mineral oil quotation every single time procurement compares equipment prices in isolation. Include the firewall, the containment pit, and the clearance distance that a 316 degree fire point removes, worth around 180,000 dollars per urban substation position, and the comparison reverses completely. Those lines sit in a construction budget held by a different function, so the commercial work is organisational rather than technical and it is entirely winnable. Building and data centre projects already evaluate this way, which is why the same product wins there.
Market Impact: Civil savings reach 180,000 dollars

Reach The Standards Writer Not The Tender

Distribution network operators who have written alternative fluids into standard specifications have removed the procurement conflict rather than arguing it on every project, and suppliers reaching those specifications early sell into the whole network afterward. Utilities reconsider specification at standards revision and at replacement programme design, almost never during a tender. Alternative fluids currently sit at 14% of new distribution transformers, and specification adoption rather than persuasion is what moves that figure. Approval for a specific fluid runs years rather than months to obtain, so the position then defends itself afterward.
Market Impact: Alternative fluids hold 14% of all

Quote Retrofill Conversion At What It Actually Costs

Residual mineral oil above roughly 7% pulls the fire point down and the classification that justified the conversion disappears, so an underquoted retrofill delivers nothing while consuming real money. Proper conversion needs multiple flushes, hot oil circulation, and residual testing carried out before recommissioning. Suppliers quoting the cheap version win the job and lose the customer, since the utility discovers afterward that the civil works still cannot be relaxed and the whole exercise was wasted. Residual testing before recommissioning is the only way anybody ever knows whether the conversion actually worked.
Market Impact: Residual must stay below 7% mineral

Separate The Core Argument From The Fluid Argument

Amorphous and low-loss cores address no-load loss under efficiency regulation, while ester fluids address fire classification and siting, and those are two entirely different purchases decided by different people against different budgets. Suppliers presenting one combined green transformer story simply confuse both audiences at once. Chinese and Indian utilities specify amorphous cores at rates Western networks never approached, driven purely by loss standards, and the fluid conversation is separate wherever that adoption has happened. Alternative fluids sit at 14% of new distribution units while amorphous core adoption runs on an entirely separate track.
Market Impact: Fire point reaches 316 degrees agai

Who Controls the Margin Pool

Concentration is high at 58% across the top five measured on annual megavolt-amperes shipped with alternative insulating or low-loss systems, with fluid suppliers assessed on the capacity their fluids fill so the basis stays consistent. Two barriers hold it there: transformer manufacturing scale, and fluid qualification with utilities that runs years rather than months. The leader to challenger gap is wide, and challengers arrive through utility approval rather than through product improvement.
Competitive activity runs on three fronts. Utility specification approval is the first and by far the most decisive, since an approved fluid sells into a whole network for years afterward. Thermal performance in high ambient conditions is the second, where synthetic and natural esters genuinely differ. And core loss performance is the third, which is a separate contest decided by different buyers against efficiency standards.

Pressure arrives from two directions. Chinese manufacturers supply both amorphous core and ester-filled units at costs Western producers cannot match. And dry-type cast resin transformers compete for exactly the indoor positions esters were winning. Both pressures attack positions that manufacturing scale and approval status historically defended well.

Rankings shift on utility approvals rather than on product launches.
green-transformer-market-company-positioning-matrix-1787301894421

Competitive Moat and Risk Dimensions

HITACHI ENERGY

Moat: Utility approvals and manufacturing breadth

Holding qualified positions across distribution and transmission transformers at utilities worldwide gives access that a fluid or a product improvement cannot buy, because approval processes run years and networks do not requalify casually. Manufacturing breadth across ester, dry-type, and amorphous core construction also lets one supplier answer any specification rather than advocating a single technology. Neither position assembles quickly.
HITACHI ENERGY

Risk: Cost exposure against Asian manufacturing

Chinese and Indian manufacturers supply both amorphous core and ester-filled units at costs Western production cannot approach, and utility procurement awarding on capital cost has no mechanism for valuing an approval that already exists. Approval barriers slow that competition rather than preventing it. Cost position erodes faster than qualification position defends.
EATON

Moat: Building and data centre channels

Distribution reach into commercial construction and data centre projects reaches the buyers who specify on fire classification rather than on capital cost, which is exactly where the ester argument wins without needing to be argued. Those customers also decide at design rather than through utility procurement, so the organisational obstacle that blocks network sales simply does not apply.
EATON

Risk: Dry-type competes for same positions

Cast resin dry-type transformers eliminate liquid entirely and compete for precisely the indoor and basement positions where ester fluids win, without any fluid premium, containment, or conversion question at all. Their loss and noise performance is worse and buyers frequently accept that trade. Winning the fire argument does not settle which fire-safe technology gets specified.

Players Tracked

Prominent Players

Hitachi Energy
Siemens Energy
Eaton
Schneider Electric
TBEA

Other Key Players

Hyundai Electric
Toshiba Energy Systems
Mitsubishi Electric
Cargill
M&I Materials
Nynas
Wilson Transformer
Ormazabal
CG Power and Industrial Solutions
Bharat Heavy Electricals
Hyosung Heavy Industries
WEG
Sunten Electric
Shandong Taikai Transformer
Celme

Recent Developments

FEBRUARY 2025

Network operator writes alternative fluids into standard specification

A distribution network operator added ester fluids to its standard distribution transformer specification rather than treating them as a project-by-project exception, removing the capital cost comparison from every subsequent tender. The change was a specification revision rather than any joint venture, acquisition, or supply agreement with a manufacturer.
Signal: Specification adoption sells into a whole
MAY 2025

Data centre operator specifies ester fill across campus substations

A hyperscale data centre operator specified ester-filled transformers across new campus substations at design stage, citing fire risk adjacent to critical load rather than any environmental commitment. The specification was an engineering design decision rather than any joint venture, acquisition, or partnership with a transformer supplier.
Signal: Buyers who cannot negotiate fire risk spec
SEPTEMBER 2025

Utility abandons retrofill programme on residual oil testing

A utility halted a transformer retrofill conversion programme after residual mineral oil testing showed units exceeding the threshold at which fire classification is retained, leaving civil works requirements unchanged. The decision was an internal engineering review rather than any dispute, contract termination, or regulatory intervention.
Signal: Underquoted conversions deliver no classif

Ester Fluid, Core Steel and Copper

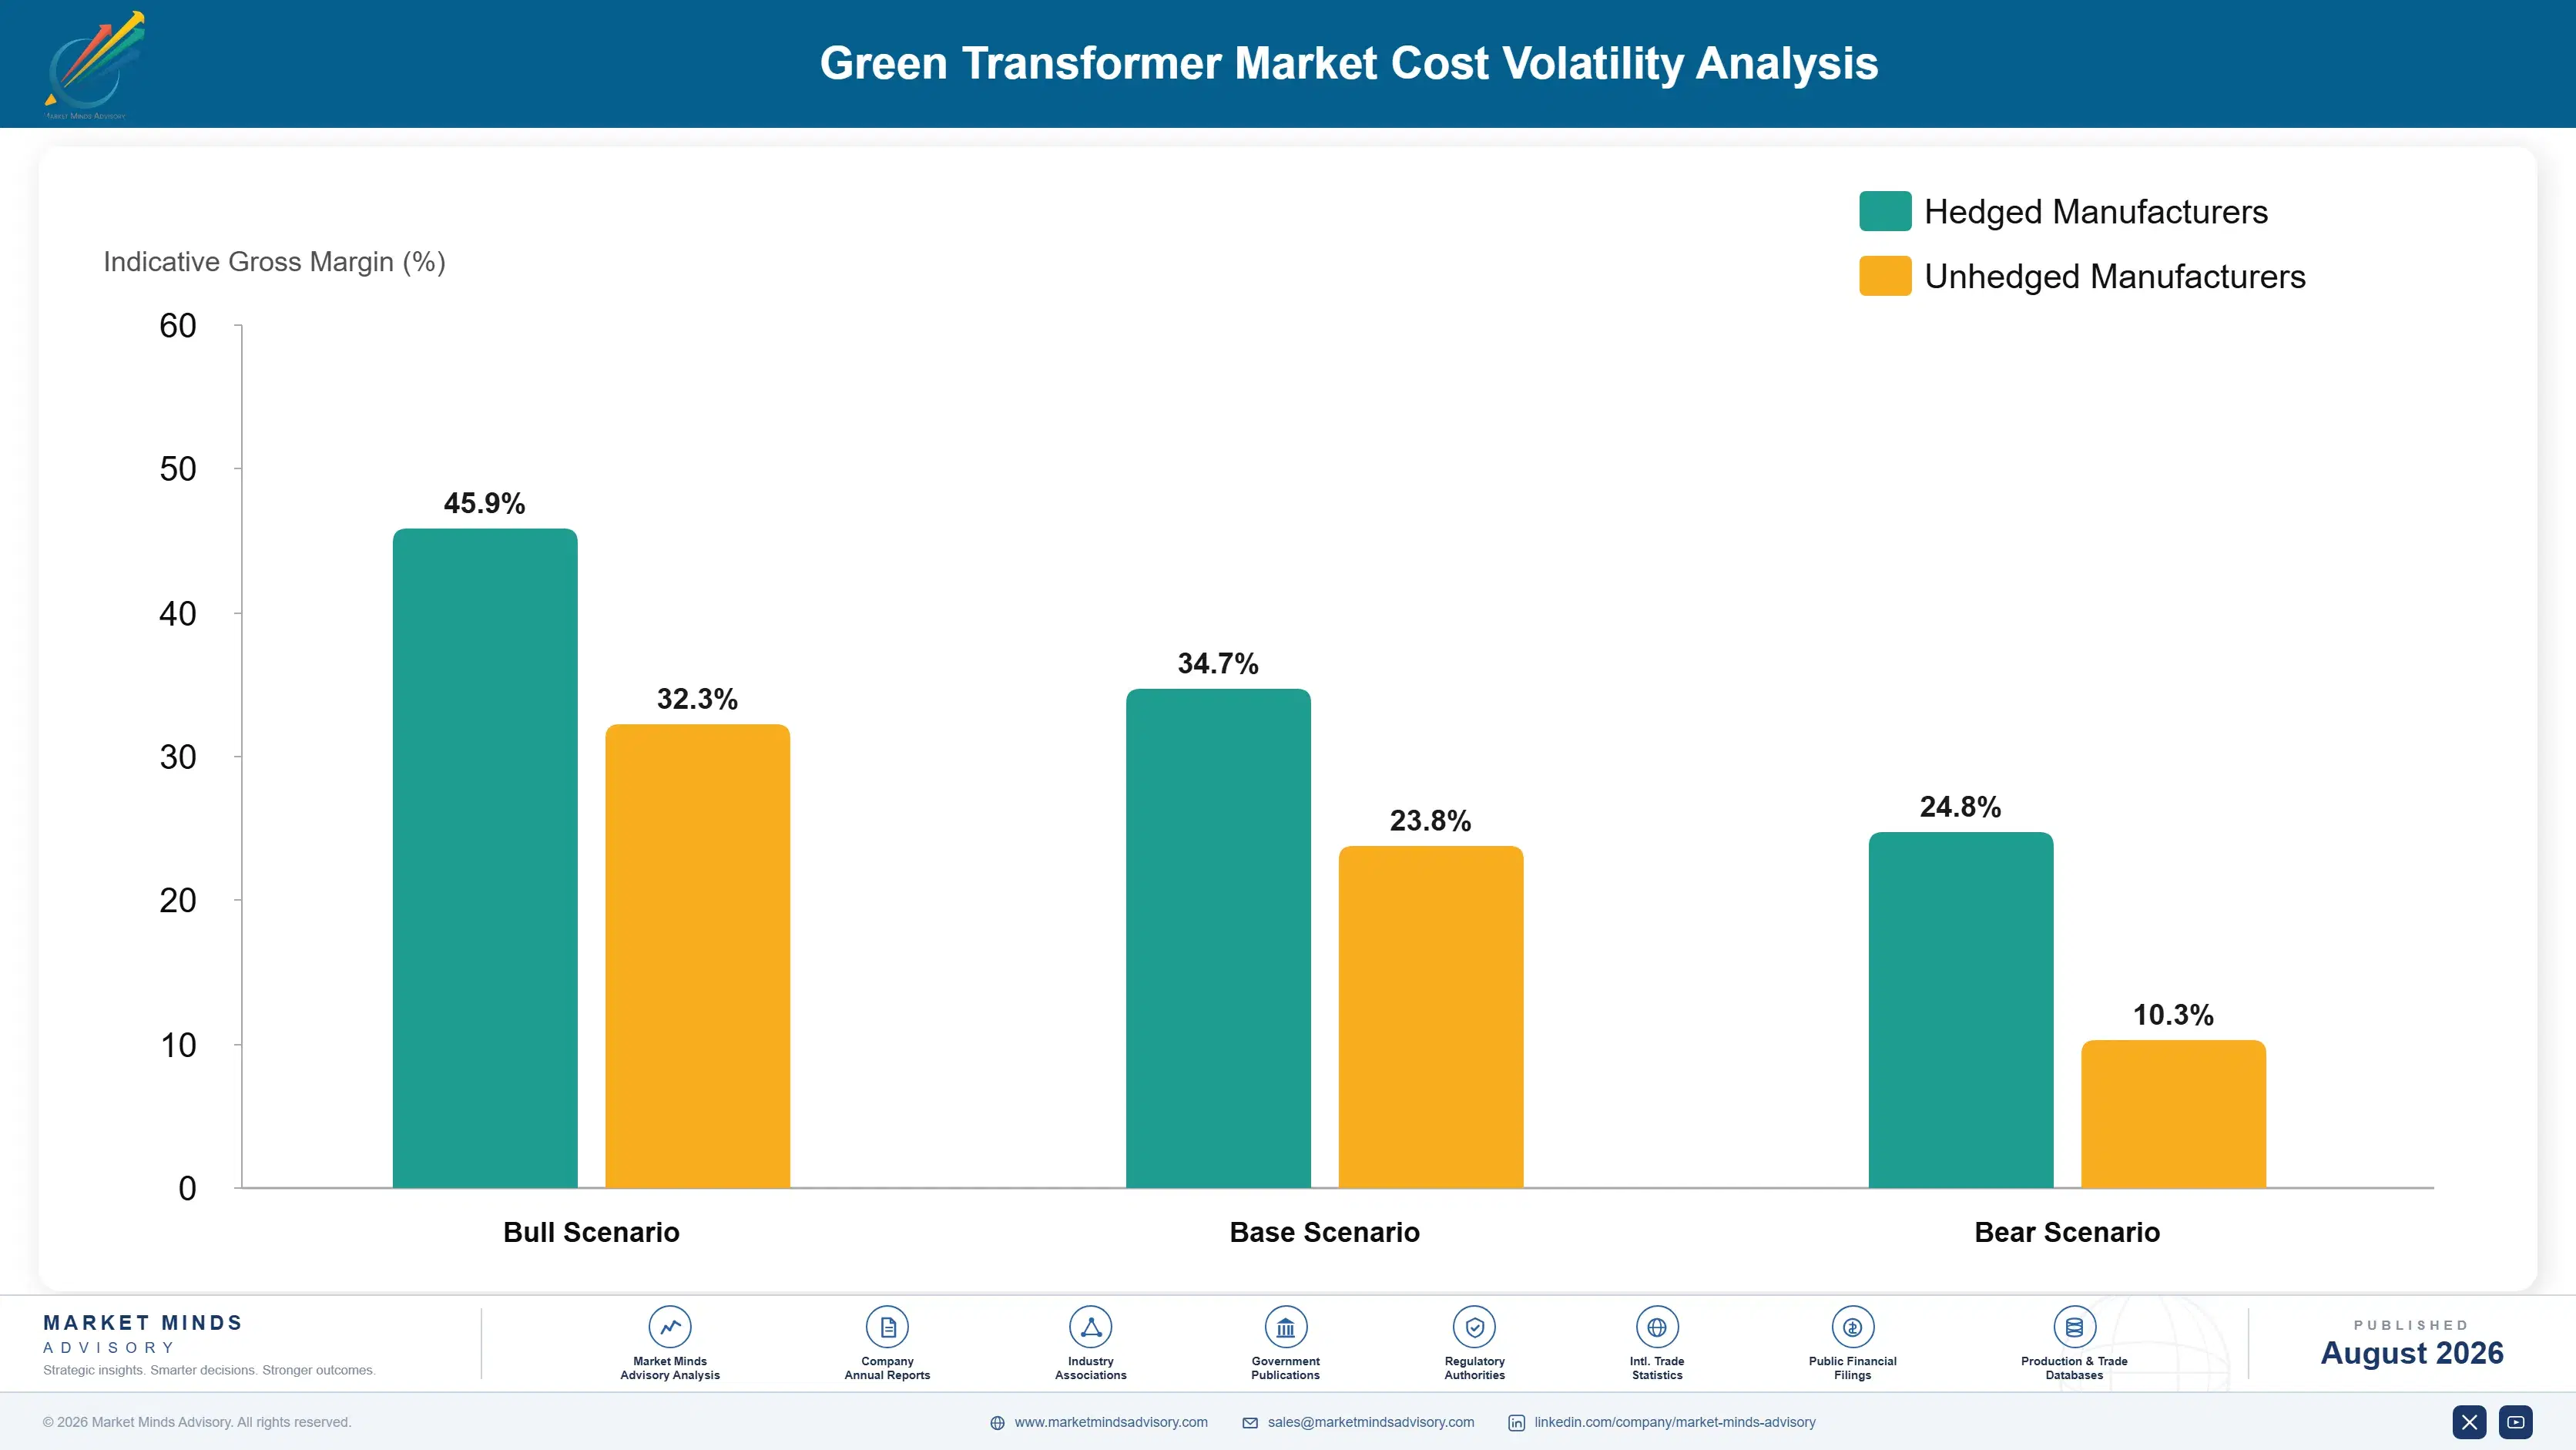
Core material carries roughly 27% of manufactured cost, spanning grain-oriented electrical steel and amorphous ribbon, copper and aluminium windings about 24%, insulating fluid near 14% for ester-filled units against considerably less for mineral oil, tank and fittings around 12%, and assembly, testing, and overhead the balance. Ester fluid pricing at roughly 3.4 times mineral oil makes that line unusually visible.
Grain-oriented electrical steel and copper both moved sharply through 2021 and 2022, and several transformer manufacturers disclosed material cost pressure and extended lead times in annual filings covering those years. Amorphous ribbon supply also tightened, since production concentrates among very few producers globally. Vegetable oil feedstock pricing for natural esters moved independently and remains the input most exposed to agricultural rather than industrial conditions. Allocation favoured established supply relationships.

The competitive disadvantage mechanism runs through core material access rather than through fluid purchasing. Amorphous ribbon is produced by a small number of suppliers and allocated accordingly, so a manufacturer without a supply position cannot serve efficiency-driven demand at all regardless of assembly capability. Grain-oriented steel is more widely available and priced regionally, and European manufacturers pay persistently more than Asian competitors do.
green-transformer-market-cost-volatility-analysis-1787301894619

Secure amorphous ribbon allocation before efficiency standards tighten

Amorphous ribbon production concentrates among very few suppliers globally and is allocated rather than freely traded during periods of strong demand. A manufacturer without a supply agreement cannot serve efficiency-driven demand at all, regardless of assembly capability or customer relationships. Securing allocation ahead of a standards change costs commitment against uncertain volume and is the only route available.

Qualify both natural and synthetic esters with each utility

Natural esters carry better environmental credentials while synthetic esters handle high ambient temperature and moisture considerably better, and utility approval processes run years rather than months for each fluid separately. A manufacturer qualified on only one cannot answer half the specifications it encounters. Running both qualifications in parallel costs duplicate testing and removes a recurring commercial obstacle.

Design tanks for fluid volume rather than reusing mineral oil designs

Ester fluids carry different thermal expansion, viscosity, and cooling behaviour from mineral oil, and a tank designed around mineral oil assumptions requires more fluid than necessary at roughly 3.4 times the price per litre. Designing specifically for ester reduces that volume meaningfully. Manufacturers reusing existing designs to avoid engineering cost pay the difference on every unit shipped.

Portfolio Architecture for Margin Defence

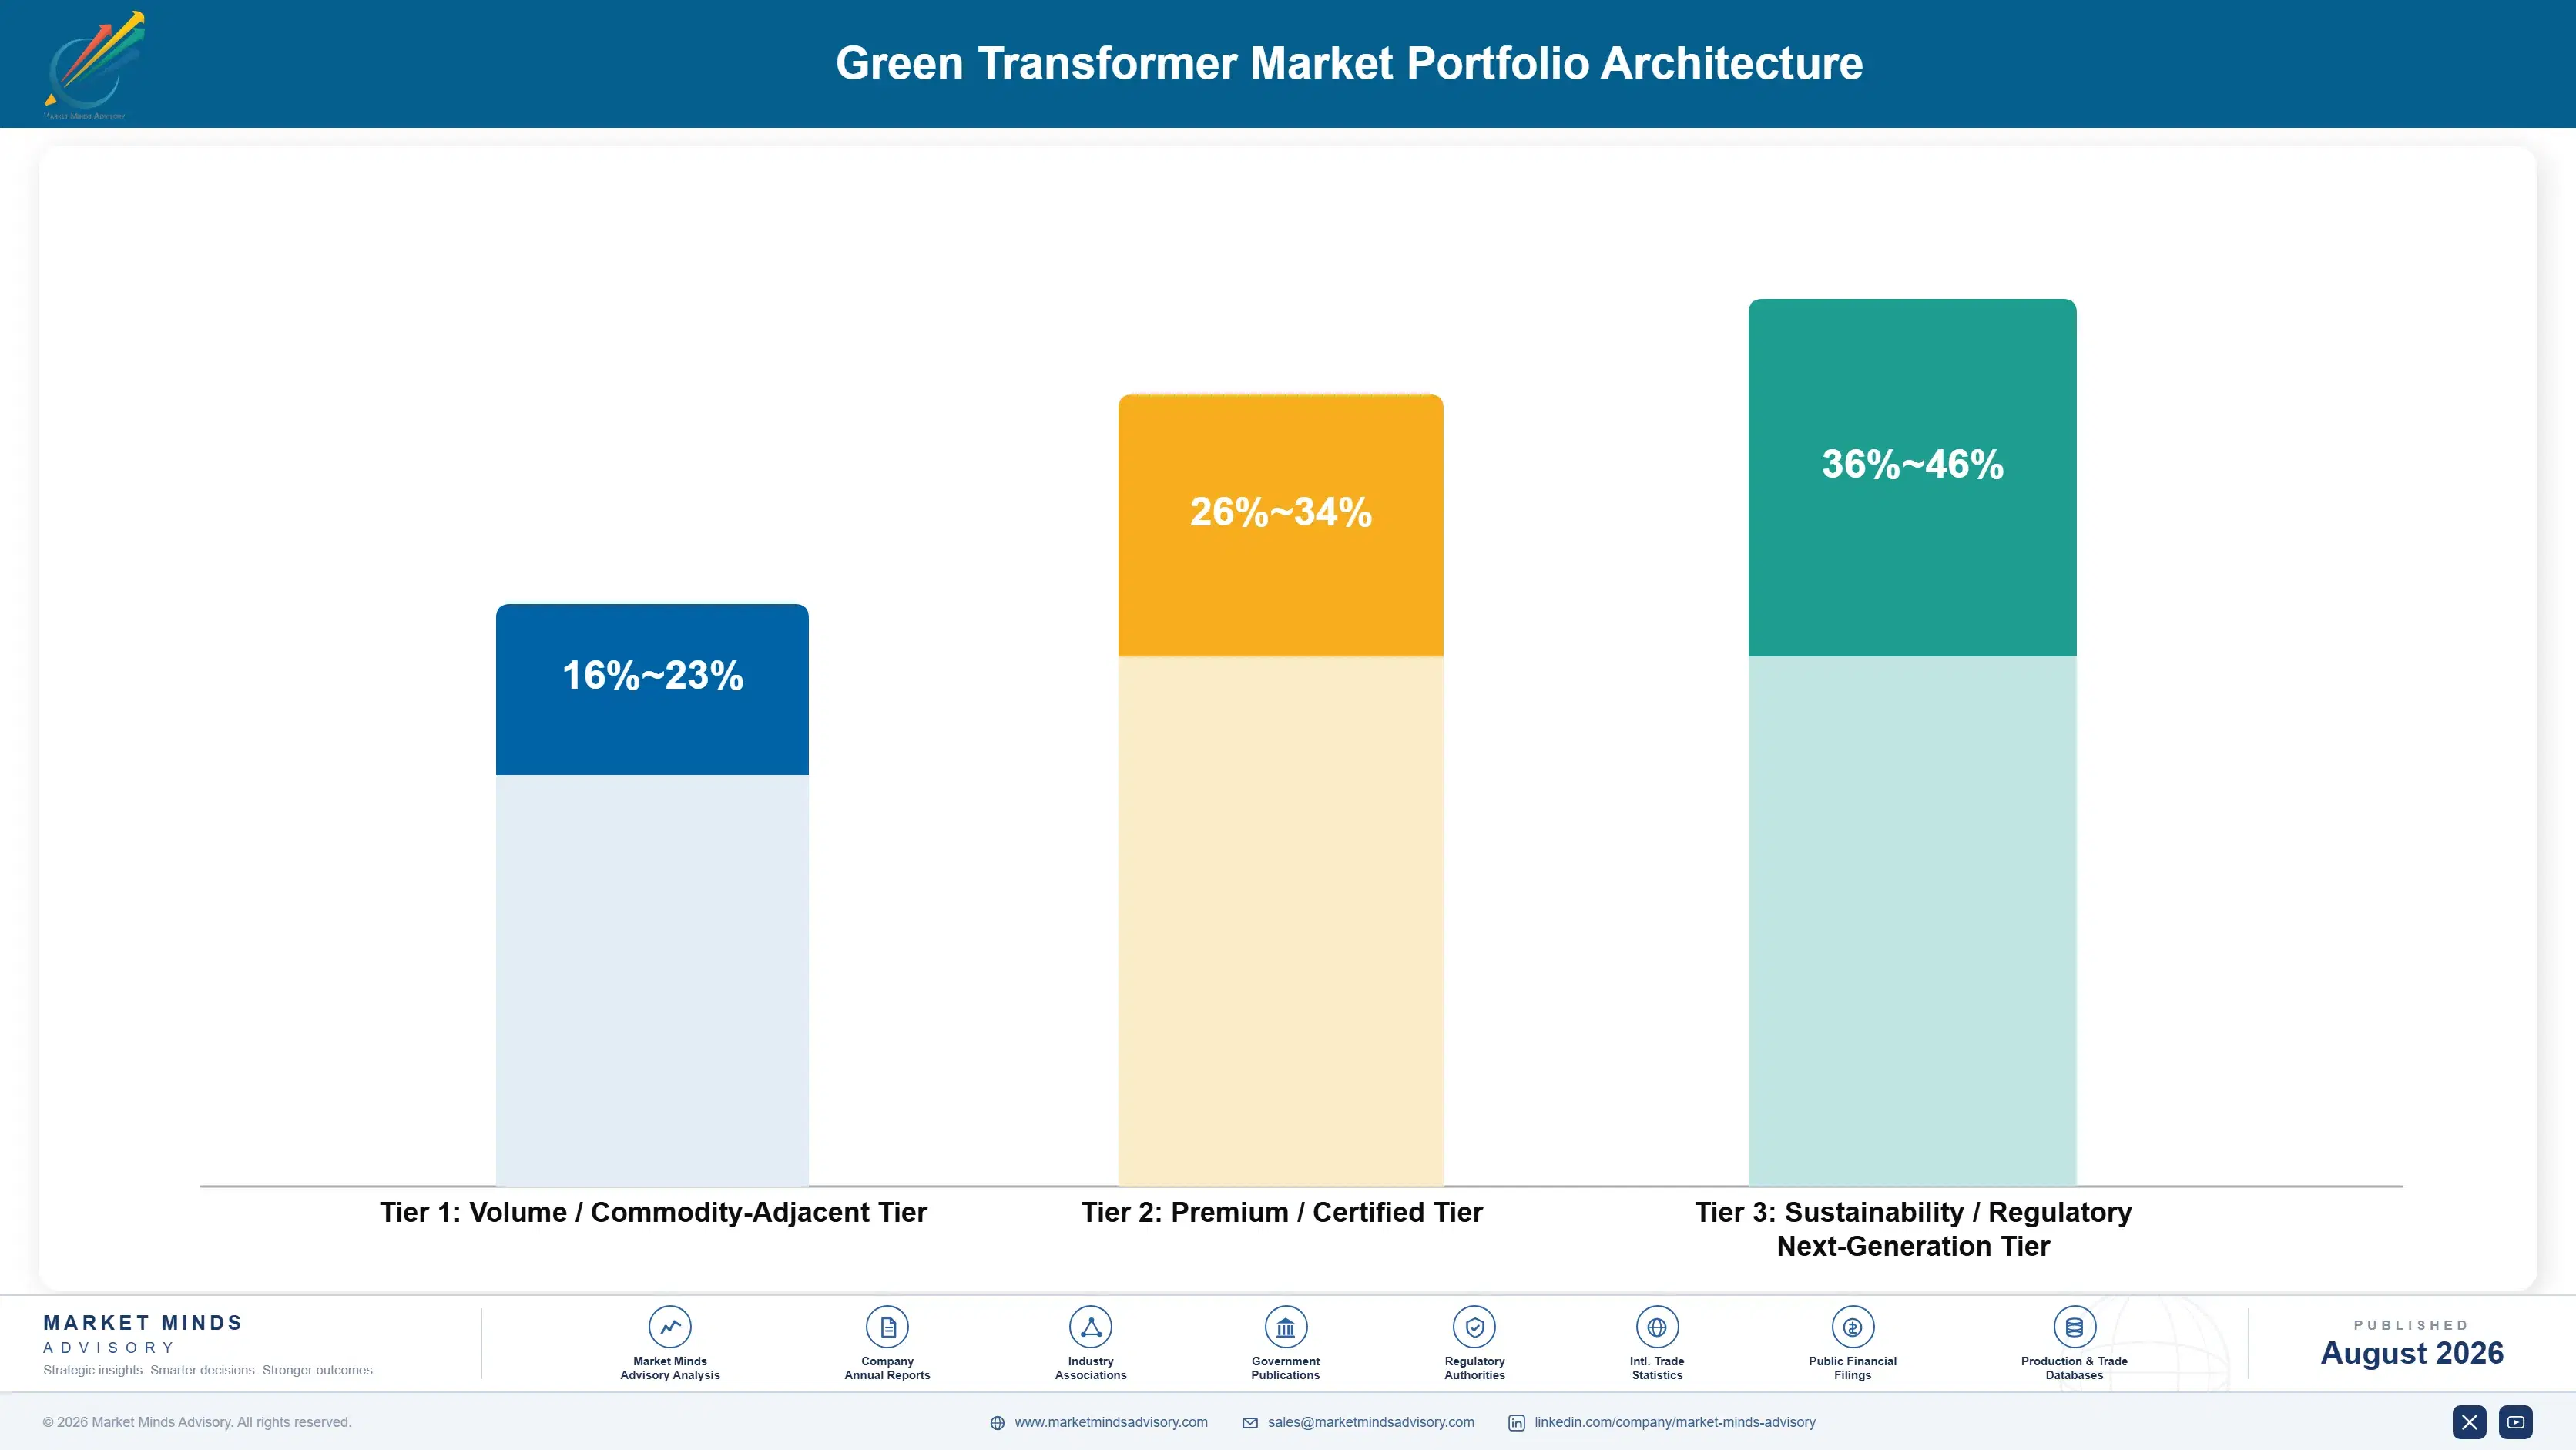
Three tiers describe this business and the spread follows which constraint each product answers. Amorphous and low-loss core distribution transformers sit at the bottom, competing against efficiency standards on cost where Asian manufacturing sets the price. Dry-type cast resin occupies the middle, answering indoor siting without any fluid at all. Ester-filled units sit at the top, where fire classification and siting freedom both apply and buyers pay accordingly.
The tension is that the two arguments reach different buyers and require different commercial organisations. Core efficiency sells to utility standards engineers against a regulation, while fire classification sells to building designers and data centre operators against a civil works budget. Manufacturers presenting one combined green story confuse both audiences, and several have organised sales teams around a product category rather than around the buying decision.

High-value pools concentrate where fire risk cannot be negotiated at all. Data centre and offshore substations are the clearest case, since the buyer specifies at design and never constructs a comparative business case. Urban distribution positions pool value similarly, because avoided civil works exceed the fluid premium several times over. Both pools reward suppliers who quote installed cost.

Volume / Commodity-Adjacent Tier

Amorphous and low-loss core distribution transformers sold against efficiency standards where Asian manufacturing sets pricing. Core material access rather than assembly capability determines who can serve this demand at all, and margin is thin throughout.
Gross Margin: 16-23%

Premium / Certified Tier

Dry-type cast resin transformers answering indoor and basement siting without any liquid, containment, or conversion question. Loss and noise performance is worse than liquid-filled equivalents and buyers frequently accept that trade for simplicity.
Gross Margin: 26-34%

Sustainability / Regulatory / Next-Generation Tier

Natural and synthetic ester filled transformers where a 316 degree fire point removes civil works worth around 180,000 dollars per urban position. Best margin by a clear distance, and defended by utility approvals that take years to obtain.
Gross Margin: 36-46%
green-transformer-market-portfolio-architecture-1787301895123

Specifications, Programmes and Approvals

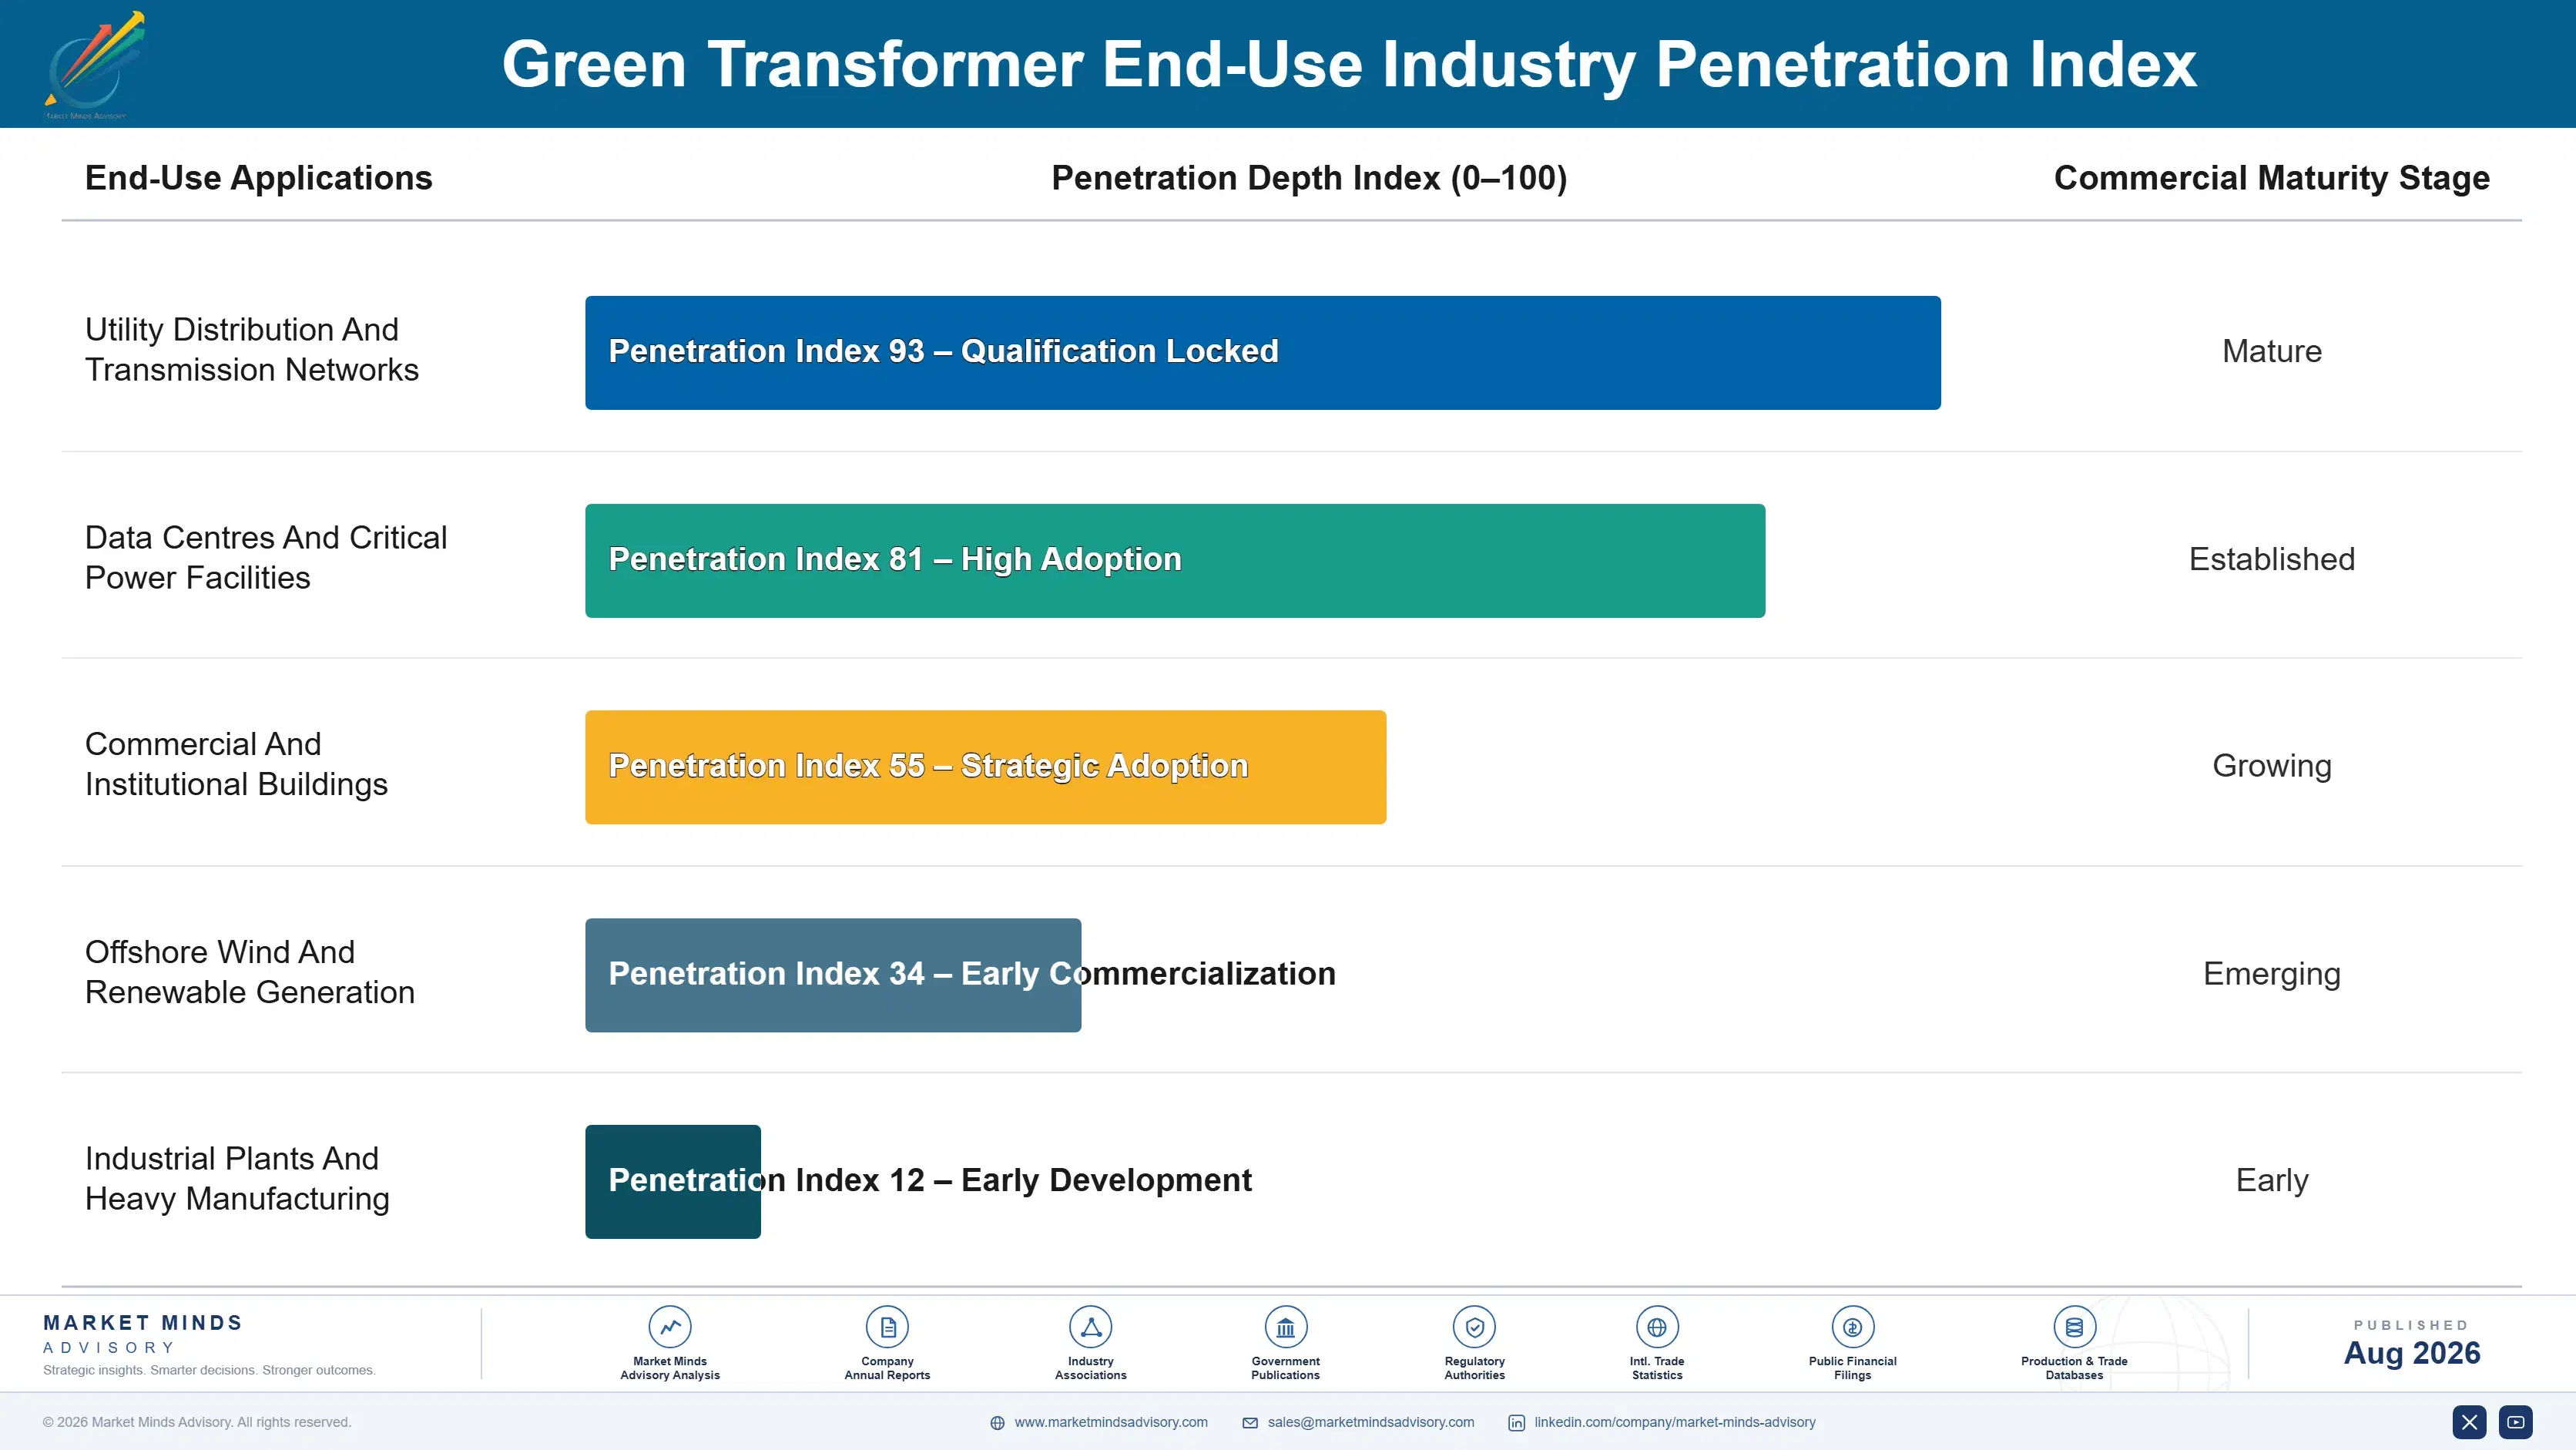
Revenue follows utility replacement programmes and construction projects rather than any annual purchasing cycle, which makes demand lumpy and unusually predictable at the same time. A transformer installed today runs for decades and generates nothing further, so the specification decision is where all the value sits. Utilities reconsider that specification at standards revision and at programme design, and almost never at any point in between.
Stickiness runs through fluid and product approval rather than through commercial relationship. A utility that has qualified a specific ester and a specific manufacturer will not repeat multi-year approval work for a modest price difference, and that qualification behaves like a switching cost no competitor can shorten. Building and data centre projects stick considerably less, since each project is specified afresh by whichever consultant holds the design.

Buyer profiles shifted as siting constraints tightened and data centre construction scaled. The earlier buyer was a utility standards engineer weighing loss performance against capital cost. The current population increasingly includes building services designers and data centre engineers who evaluate fire classification first and never look at a loss figure. Those designers evaluate fire classification against a construction budget rather than loss against a capital one.
green-transformer-market-end-use-penetration-index-1787301895614

What We Would Tell a Board

These are among the four positions where our research anticipates prominent divergence between winners and laggards over the coming forecast period. Each is grounded in the demand model, the regulatory perimeter, and the announced capacity pipeline.
01 / INSTALLED COST FRAMING

Equipment price loses; installed cost wins comfortably

A fluid premium of roughly 3.4 times loses to a mineral oil quotation every single time a procurement function compares equipment prices in isolation from everything else. Include the firewall, containment pit, and clearance distance that a 316 degree fire point removes, worth around 180,000 dollars per urban substation position, and that comparison reverses completely. Those lines sit inside a construction budget held by an entirely different function, so the commercial work required is organisational rather than technical and it is winnable.
02 / STANDARDS ACCESS STRATEGY

Win the specification, not the individual tender

Distribution network operators who have written alternative fluids into their standard specifications removed the capital cost conflict permanently rather than arguing it project by project, and suppliers reaching those specifications sell into a whole network for years. Utilities reconsider that specification at standards revision and at replacement programme design, and almost never during a tender process itself. Alternative fluids currently sit at only 14% of new distribution transformers, and specification adoption rather than project persuasion is what actually moves that number.
03 / CONVERSION QUOTATION HONESTY

Cheap retrofills win the job and lose the customer

Residual mineral oil above roughly 7% pulls the fire point down and removes the classification that justified converting the transformer in the first place, so an underquoted retrofill programme delivers nothing whatsoever to the customer. Proper conversion requires multiple flushes, hot oil circulation, and residual testing before recommissioning, and none of that work is cheap to perform. Suppliers quoting the inadequate version win the work and then lose the account entirely, once the customer discovers civil works still cannot be relaxed afterward.
04 / BUYER SEPARATION DISCIPLINE

Core loss and fire safety are different sales entirely

Amorphous and low-loss cores answer no-load loss under efficiency regulation while ester fluids answer fire classification and siting freedom, and those are two separate purchases decided by different people against completely different budgets. Suppliers presenting a single combined green transformer story confuse both of those audiences at once and end up winning neither argument properly. Chinese and Indian utilities specify amorphous cores heavily on loss standards alone, entirely independently of any insulating fluid conversation taking place elsewhere in the same organisation.

Engagement Snapshot From the Field

A live engagement with an industry participant carrying material or product regulatory and market exposure ahead of a defining policy shift, showing how our research translates into a defensible multi-year portfolio strategy.
MARKET MINDS ADVISORY · CLIENT ENGAGEMENT SUMMARY
Green Transformer Producer Strategic Portfolio Review and Transition Roadmap 2026·Investment Scenario on Green Transformer Exposure Evaluation 2025-26
CLIENT PROFILE
A transformer manufacturer with approximately 390 million dollars in annual revenue (client-reported, unverified by MMA), producing distribution and small power transformers across two regions with an ester-filled product range launched four years earlier. Ester volumes had grown slowly against internal projections, utility tenders were consistently lost on price, and management had proposed reducing the ester price to match mineral oil quotations.
STRATEGIC CHALLENGE
The board questioned whether price was the actual obstacle, since ester units were reportedly winning readily in commercial building and data centre projects at full margin. They wanted an independent view on why the same product performed so differently between two customer types before approving a price reduction across the whole range.
MMA APPROACH
We analysed win and loss outcomes separately across utility tenders, commercial building projects, and data centre work, examining who made the specification decision and against what budget in each case. Tender documents were reviewed for whether civil works appeared anywhere in the evaluation. Utility approval status was mapped, and standards revision timing was identified across the client's principal network customers.
KEY FINDINGS
  1. Utility tenders evaluated equipment capital cost with no reference to civil works anywhere in the documentation, while building and data centre projects evaluated installed cost including fire separation.
  2. Every ester win in the client's record came from a project where one party held both the equipment and the construction budget together.
  3. The client held fluid approval at a minority of its utility customers, and approval processes at the remainder ran between two and four years.
  4. Two principal network customers had standards revisions scheduled within eighteen months, and the client had no engagement planned with either. Timing had not been tracked.
CLIENT PROFILE
A transformer manufacturer with approximately 390 million dollars in annual revenue (client-reported, unverified by MMA), producing distribution and small power transformers across two regions with an ester-filled product range launched four years earlier. Ester volumes had grown slowly against internal projections, utility tenders were consistently lost on price, and management had proposed reducing the ester price to match mineral oil quotations.
STRATEGIC CHALLENGE
The board questioned whether price was the actual obstacle, since ester units were reportedly winning readily in commercial building and data centre projects at full margin. They wanted an independent view on why the same product performed so differently between two customer types before approving a price reduction across the whole range.
MMA APPROACH
We analysed win and loss outcomes separately across utility tenders, commercial building projects, and data centre work, examining who made the specification decision and against what budget in each case. Tender documents were reviewed for whether civil works appeared anywhere in the evaluation. Utility approval status was mapped, and standards revision timing was identified across the client's principal network customers.
KEY FINDINGS
  1. Utility tenders evaluated equipment capital cost with no reference to civil works anywhere in the documentation, while building and data centre projects evaluated installed cost including fire separation.
  2. Every ester win in the client's record came from a project where one party held both the equipment and the construction budget together.
  3. The client held fluid approval at a minority of its utility customers, and approval processes at the remainder ran between two and four years.
  4. Two principal network customers had standards revisions scheduled within eighteen months, and the client had no engagement planned with either. Timing had not been tracked.
RECOMMENDED STRATEGY
Phase 1: Phase 1 (months one to nine): cancel the price reduction, engage both network customers with standards revisions scheduled inside eighteen months. Phase 2: Phase 2 (months nine to twenty-four): weight commercial effort toward building and data centre projects where installed cost is evaluated together. Phase 3: Phase 3 (months twenty-four to forty-two): run parallel natural and synthetic ester approvals across remaining utility customers. across both regions served.
OUTCOME
The price reduction was cancelled. Both standards revision engagements were secured within two quarters, ester volumes in building and data centre projects grew materially at unchanged margin, and parallel fluid approvals began at three further utility customers (client-reported, unverified by MMA). Margin across the ester range held unchanged throughout.

Frequently Asked Questions

Foundational context covering the market sizes, CAGR, scope, country, region and competition that inform every finding below. This section is provided to cover basics and most often pre-purchase conversations, answered from the MMA Primary Research Dataset.

What is the current size of the Green Transformer Market?

The market is valued at USD 3.2 billion in 2025, rising to USD 3.53 billion in 2026. Scope covers alternative insulating fluid and low-loss core transformers, not conventional mineral oil units, switchgear, or installation works.

How large will the Green Transformer Market be by 2036?

MMA forecasts USD 9.32 billion by 2036, an increase of USD 5.79 billion over the 2026 base. That represents an expansion multiple of 2.64 times across the forecast period.

What is the CAGR for the Green Transformer Market 2026 to 2036?

The base case CAGR is 10.2%, with a bull case of 11.4% and a bear case of 9.0%. The historical rate from 2020 to 2025 was 8.8%, driven by grid investment rather than environmental policy.

Which segment is growing fastest?

Natural ester filled distribution transformers at 15.3%, exactly 1.50 times the market rate. Urban siting drives it, since a 316 degree fire point removes civil works worth around 180,000 dollars per position.

Who are the major companies in the Green Transformer Market?

Hitachi Energy, Siemens Energy, Eaton, Schneider Electric, and TBEA lead on annual megavolt-amperes shipped with alternative systems. The top five hold 58%, on manufacturing scale and utility fluid approvals.

Which country is growing fastest?

India at 13.0%, where rural electrification and urban network reinforcement proceed together, and where efficiency standards have pulled amorphous core adoption strongly across distribution networks.

Report Segmentation Architecture

The full report scope spans multiple orthogonal segmentation dimensions, with cross-tabulated demand data provided for each dimension pair. Coverage extends further to regional breakdowns, trend trajectories, and the competitive detail needed to support segment-level decision-making.

By Insulating System And Core Construction

  • Natural Ester Filled Distribution Transformers
  • Synthetic Ester Filled Power Transformers
  • Amorphous And Low-Loss Core Transformers
  • Dry-Type Cast Resin Transformers
  • Silicone And Alternative Fluid Transformers

By End-Use Industry

  • Utility Distribution And Transmission Networks
  • Data Centres And Critical Power Facilities
  • Commercial And Institutional Buildings
  • Offshore Wind And Renewable Generation
  • Industrial Plants And Heavy Manufacturing

By Commercial Model

  • Utility Framework Supply Agreements
  • Project Specified Through Consulting Engineers
  • Direct Supply To Industrial End Users
  • Retrofill Conversion And Service Contracts
  • Distributor And Panel Builder Channels

By Region

  • East Asia
  • Western Europe
  • North America
  • South Asia and Pacific
  • Latin America
  • Middle East and Africa
  • Eastern Europe

Scope, Methodology, and Coverage

Every figure in this report is reproducible from documented input assumptions. The scope below maps the historical period, the forecast horizon, the segmentation dimensions, and the countries covered, alongside the underlying primary and qualitative methodology.
Historical Period
2020 to 2025
Forecast Period
2026 to 2036
Base Year
2025 (USD billions; MMA Primary Research Dataset, August 2026)
Market Definition
This market comprises transformers employing alternative insulating systems or low-loss core designs intended to reduce fire risk, environmental exposure, or energy loss relative to conventional mineral oil units, measured at manufacturer revenue across all voltage classes. Coverage spans natural ester filled distribution transformers, synthetic ester filled power transformers, amorphous and low-loss core transformers, dry-type cast resin transformers, silicone and alternative fluid transformers, and the insulating fluids supplied into them. Conventional mineral oil filled transformers, switchgear, protection relays and substation control equipment, transformer condition monitoring supplied independently, bushings and tap changers sold separately, and substation civil works and installation labour fall outside scope.
Quantitative Units
USD billions (current prices); megavolt-amperes shipped annually; alternative fluid share of new units; fire point and loss performance by construction
Segmentation Dimensions
By Insulating System And Core Construction; By End-Use Industry; By Commercial Model; By Region
Regions Covered
East Asia, Western Europe, North America, South Asia and Pacific, Latin America, Middle East and Africa, Eastern Europe
Countries Covered
China, Japan, South Korea, India, United States, Canada, Mexico, Germany, France, United Kingdom, Netherlands, Sweden, Spain, Italy, Australia, Thailand, Brazil, Argentina, Saudi Arabia, United Arab Emirates, South Africa, Poland, Czechia, Romania, and additional markets relevant to this sector
Key Companies Profiled
Hitachi Energy, Siemens Energy, Eaton, Schneider Electric, TBEA, Hyundai Electric, Toshiba Energy Systems, Mitsubishi Electric, Cargill, M&I Materials, Nynas, Wilson Transformer, Ormazabal, CG Power and Industrial Solutions, Bharat Heavy Electricals, Hyosung Heavy Industries, WEG, Sunten Electric, Shandong Taikai Transformer, Celme
Quantitative Methodology
Primary survey, n=3,800 respondents, Q4 2025, six countries; demand-side model with trade association cross-validation
Qualitative Methodology
47 expert interviews, Q4 2025; applied to validate demand model assumptions, identify emerging dynamics, and assess competitive positioning
Report Format
PDF and XLSX data workbook (Word format preview document)
Publisher
Market Minds Advisory
Report Code
MMA-2026-ENE-658
Published
August 2026
Contact
sales@marketmindsadvisory.com | www.marketmindsadvisory.com

Purchase the full Green Transformer Market Report (2026 to 2036).

The full report sizes green transformers across five insulating and core constructions, five end-use industries, five commercial models, and seven regions, with fire classification driven demand separated from efficiency driven demand throughout. Installed cost is modelled including civil works, since equipment price comparison alone reverses the answer for every urban position. Utility fluid approval status is mapped against standards revision timing by network. Competitive profiling covers twenty companies on megavolt-amperes shipped, retrofill conversion economics are assessed against residual oil thresholds, and amorphous ribbon supply constraints are analysed against efficiency standard tightening.
Fire classification demand separated from efficiency driven demand
Installed cost modelled including avoided civil works requirements
Utility fluid approval status mapped against standards revision timing
Retrofill conversion economics assessed against residual oil thresholds
Amorphous ribbon supply constraints analysed against efficiency standard tightening
Natural and synthetic ester performance compared across ambient conditions

Built For The People Who Decide

From boardroom strategy to bench-side execution, this report is read cover-to-cover by leaders shaping the next decade of their industry, turning demand scenarios, market dynamics and valuation benchmarks into decisions.
CXOs/ Presidents/ VPs/ Managers
M&A and Corporate Development
Strategy Teams and R&D Heads
Procurement and Product Directors
Regulatory and Compliance Leaders
Investor Relations and Equity Analysts