Market Minds Advisory
Green Power Market

Green Power Market: Green Power Market. Corporate Net-Zero Commitments Reshape Renewable Procurement Investment

Corporate net-zero commitments are pulling procurement volume toward large-scale power purchase agreements faster than utility green tariff programs ever attracted, forcing renewable developers to prove additionality credentials as buyers scrutinize certificates carefully.

Lead Analyst

Published

September 2026

Make Smarter Decisions with Customized Research Insights

Request a free sample report and evaluate market opportunities, growth trends, and competitive dynamics relevant to your business needs.

2025 MARKET VALUE$45.0BMarket Size 2025
2036 FORECAST VALUE$147.6BBase Case , 2026 to 2036
CAGR 2026 TO 203611.4 %Bull 12.7% / Bear 10.1%
INCREMENTAL OPPORTUNITY$97.4BNet 10- year value creation
EXPANSION MULTIPLE2.94x2036 value over 2026 base
Strategic Levers
M&A Pipeline
Regional Outlook
Country Rankings
Competitive Intelligence
Segmental Deep-dive
Call-Us : 91 93563 13602

Executive Snapshot and Market Trajectory.

Corporate net-zero commitments are reshaping green power procurement faster than any prior renewable energy investment cycle, as large technology and manufacturing companies push power purchase agreement volume toward levels utility green tariff programs never approached across most industries, sectors, and geographic markets.
Buyers and developers face simultaneous pressure from tightening additionality and certification standards, expanding corporate procurement volume across virtual and physical power purchase agreements, and rising competition from community solar subscription programs that reduce reliance on utility-administered green tariff programs. India's expanding renewable capacity buildout and corporate open-access procurement market are pulling green power demand into domestic buyers faster than incumbents anticipated, while North American developers continue funding the highest-value large-scale procurement contracts across most segments.
Competitive intensity concentrates among five developers controlling roughly thirty-eight percent of global revenue, though independent procurement platforms are winning corporate contracts faster than utility incumbents expected just two years ago and continue gaining ground steadily across most segments, geographic markets, and customer categories. Regulatory pressure around certification and additionality verification adds validation cost that smaller developers increasingly struggle to absorb without dedicated compliance engineering teams and legal counsel.
Market Definition
The Green Power Market covers power purchase agreements, renewable energy certificates, green tariffs, community solar subscriptions, and on-site generation procurement instruments that let buyers source verified renewable electricity. It excludes raw electricity generation and transmission infrastructure sold independently of green power procurement and certification mechanisms.
Base Year Value
$45.0B in 2025 (MMA Primary Research Dataset, September 2026)
Forecast Period
2026 to 2036, eleven discrete annual values
CAGR
11.4% base case. Bull 12.7%. Bear 10.1%.
Fastest Growth Segment
Virtual and Physical Power Purchase Agreements: 15.2% CAGR
Fastest Growth Country
India: 14.2% CAGR
Fastest Growth Region
South Asia and Pacific: 13.4% CAGR
Largest Region
North America: 31% of 2025 global value
Market Leaders
NextEra Energy, Ørsted, Iberdrola, EDP Renováveis, and ENGIE lead the field. Source: MMA Analysis, July 2026.
Primary Survey
n=3,800 procurement and R&D decision-makers, Q4 2025, six countries
Methodology
Demand-side build-up, cross-validated against public data, 47 expert interviews

Green Power Market Forecast Scenarios

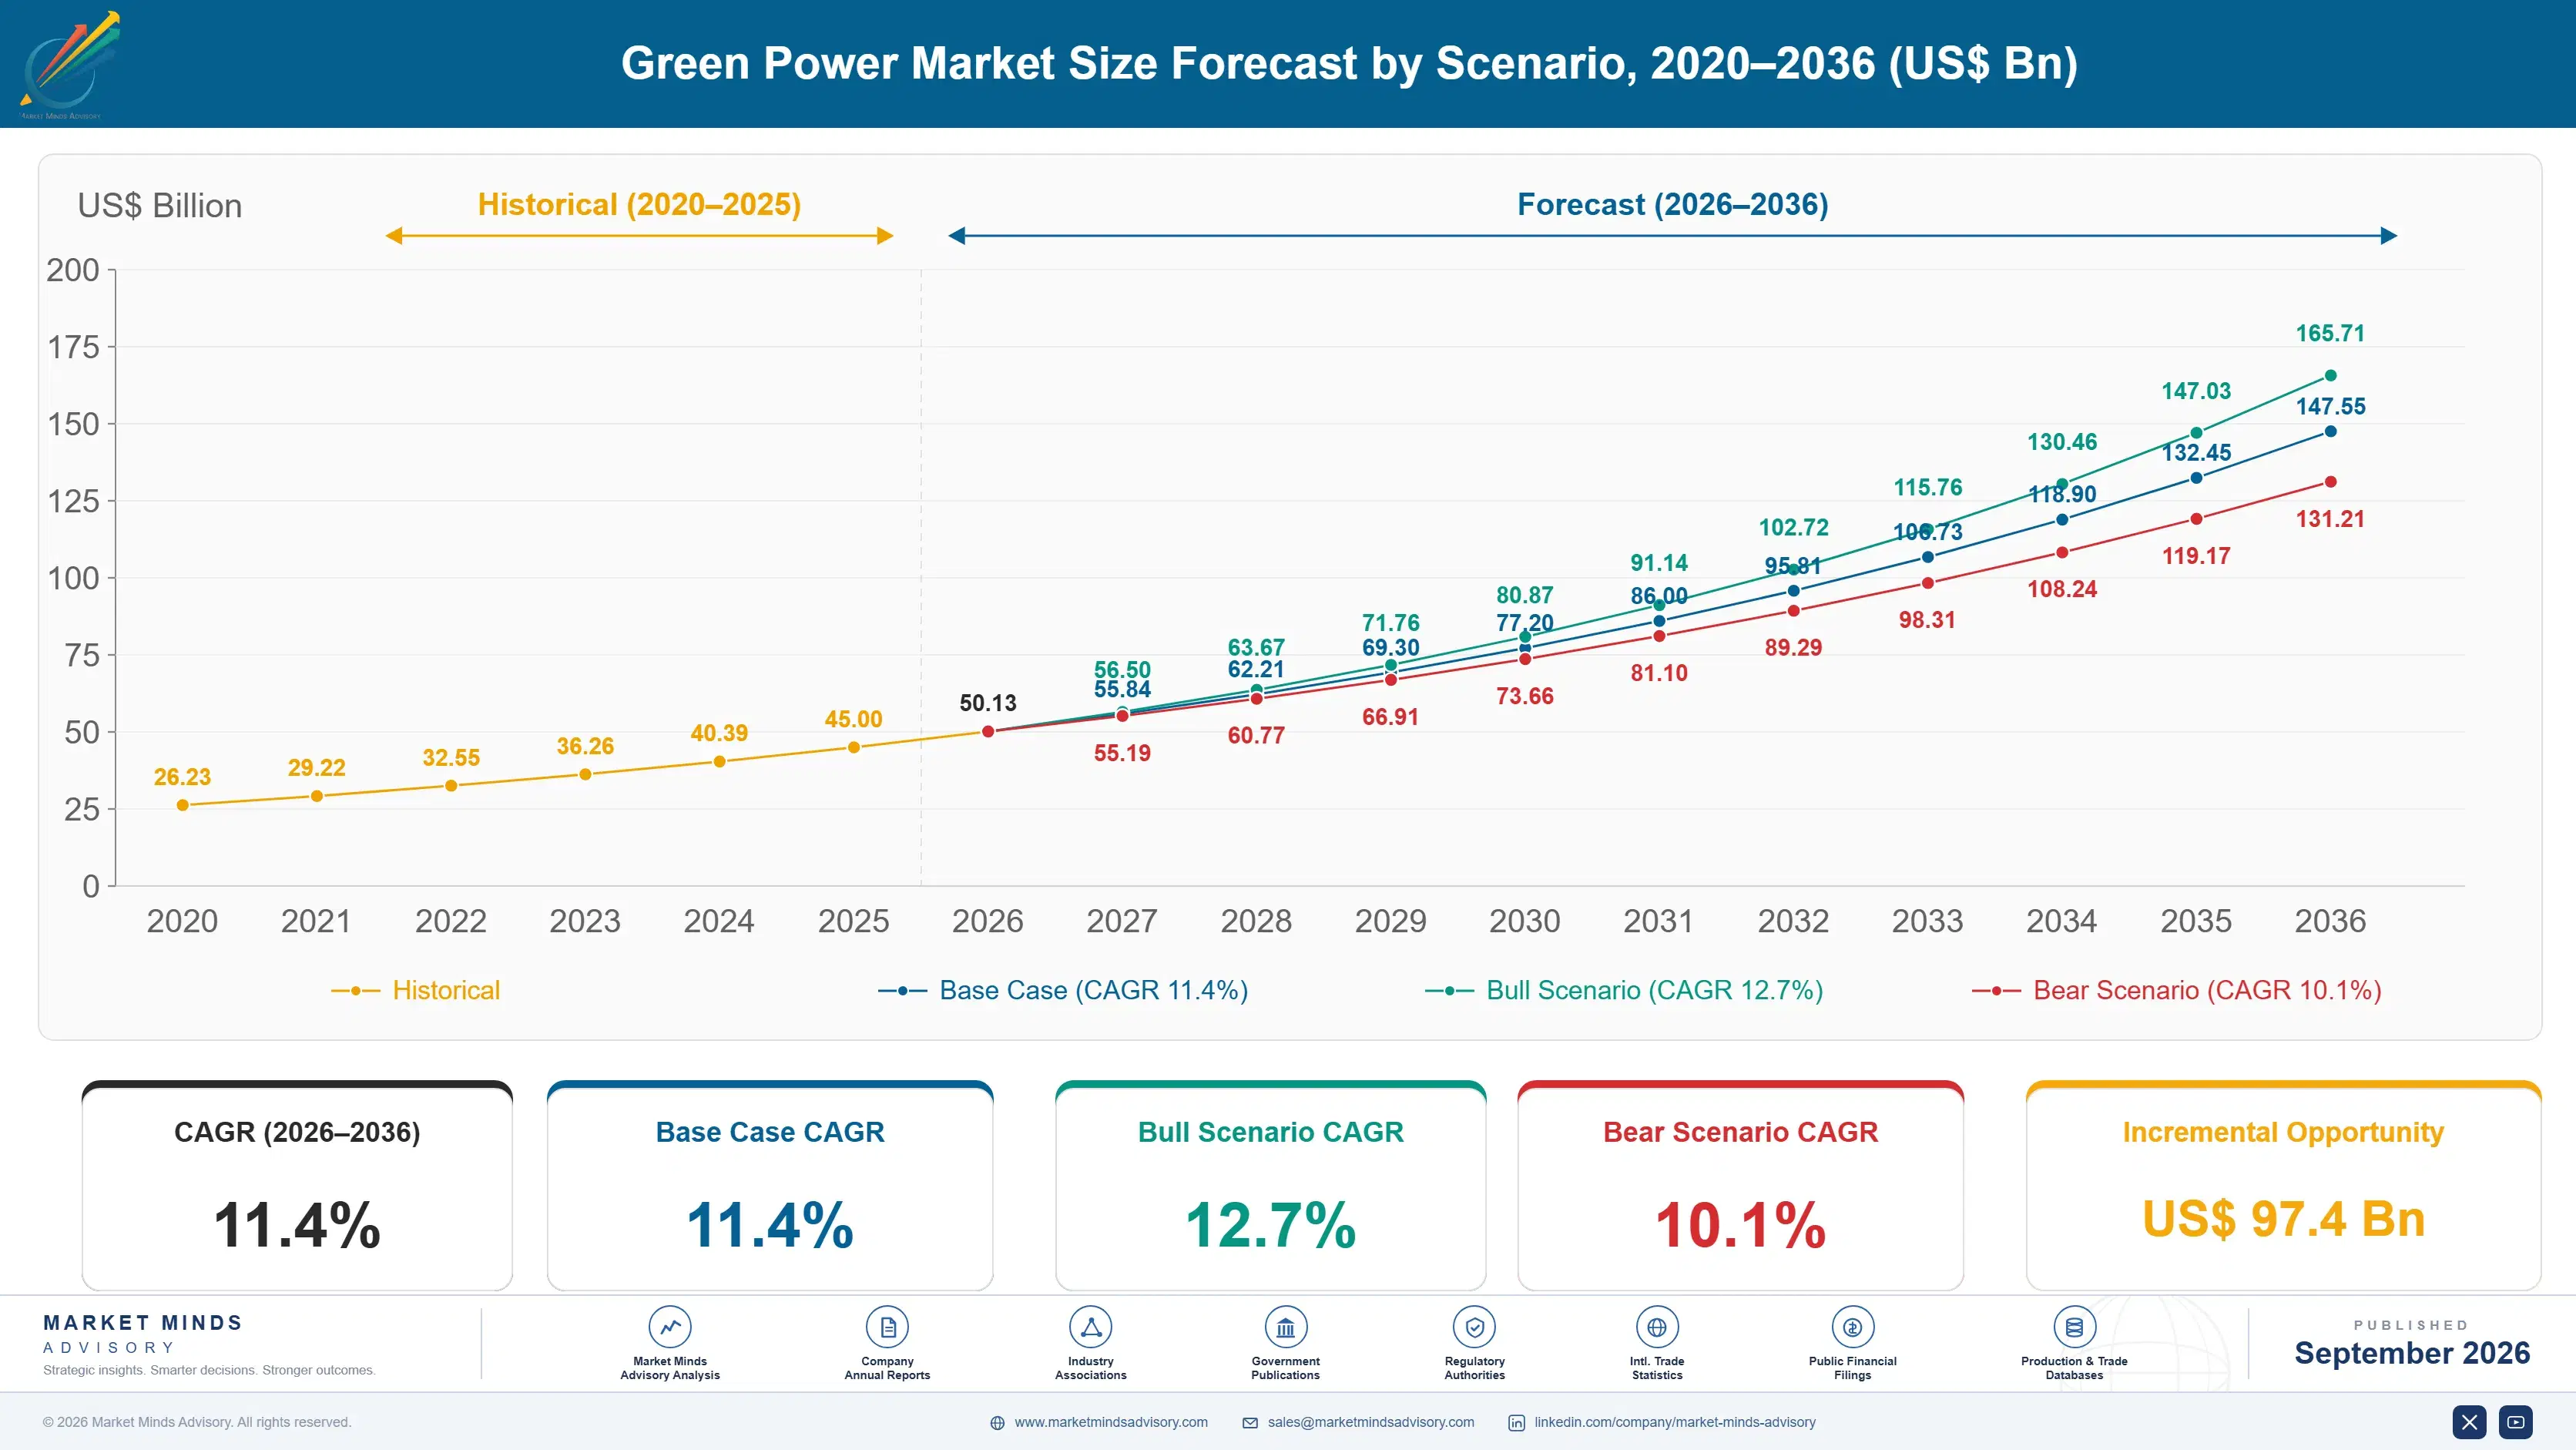
green-power-market-size-forecast-scenario-1789980786187
The 2020 to 2025 period saw green power procurement demand track corporate sustainability commitment growth closely, growing at a 10.2 percent compound annual rate as technology companies expanded renewable procurement to support data center energy needs. Early utility green tariff programs dominated this period before large-scale corporate power purchase agreements emerged as the dominant procurement instrument.
Base case forecasts assume continued corporate net-zero commitment expansion driving power purchase agreement volume, rising community solar subscription adoption reducing reliance on utility green tariff programs, and growing certification standard rigor favoring verified additionality over legacy renewable energy certificates. These three mechanisms combine to sustain an 11.4 percent compound annual growth rate through 2036, with India and North America contributing the largest incremental volume gains as domestic renewable capacity expands and corporate procurement budgets continue funding large-scale contracts.
A bull scenario reaching 12.7 percent growth depends on faster-than-expected corporate net-zero commitment adoption across mid-market companies not yet engaging in large-scale renewable procurement programs. A bear scenario falling to 10.1 percent would likely follow a broader corporate sustainability budget slowdown reducing willingness to fund new power purchase agreement categories across most industry segments and regions.

Additionality Standards Reshape Certificate Value

Corporate buyers increasingly demand documented additionality proof before signing power purchase agreements, pushing developers to demonstrate that contracted projects represent genuinely new generation capacity rather than existing output redirected through paperwork alone across most contract categories, jurisdictions, and buyer types.
MARKET CONCENTRATIONCR5 38%Top five developers hold under half of a fragmented market
AVERAGE PPA PRICE$42 per MWhTypical contracted price varies meaningfully by project type and location
TOP PRODUCING COUNTRYUnited States 27%Leading corporate procurement volume concentration drives contract development activity
CORPORATE PPA VOLUME GROWTH24%Annual increase in signed corporate power purchase agreement capacity
ADDITIONALITY VERIFICATION RATE56%Share of contracts requiring documented proof of genuinely new generation
DEVELOPMENT COST SHARE44%Project origination and certification compliance dominate ongoing developer cost base
Certification standard rigor continues tightening across major voluntary and compliance markets, as buyers increasingly scrutinize whether renewable energy certificates represent verifiable new generation rather than legacy output from projects built years before current contracts existed and were signed. This shift pressures certificate-only sellers to build credible additionality documentation rapidly or risk losing corporate contracts to developers offering verified new-build projects, favoring developers with strong project origination pipelines over sellers competing purely on certificate price and volume availability.
Community solar subscription programs increasingly displace traditional utility green tariff enrollment, since subscription models let households and small businesses access renewable electricity without utility program administration delays or geographic availability constraints that previously limited participation across most regions. Developers increasingly bundle transparent additionality documentation directly into standard contract terms, letting corporate buyers satisfy sustainability disclosure requirements without commissioning separate third-party verification studies across every reporting cycle and jurisdiction.
"A renewable energy certificate from a decade-old wind farm and one from a brand-new solar project are not the same thing anymore. Buyers who cannot tell the difference will overpay for nothing."
Senior Analyst, Renewable Energy Procurement and Certification Practice · MMA Energy Practice · September 2026

Market Trends

Additionality Verification Standards Reshape Certificate Value

Corporate buyers increasingly demand documented proof that contracted renewable projects represent genuinely new generation capacity added specifically because of the buyer's contract, rather than existing output from projects that would have been built regardless of any specific purchase agreement. This shift requires developers to invest heavily in project-specific additionality documentation and third-party verification rather than relying on generic renewable energy certificates that satisfied buyers in prior procurement cycles focused purely on volume and price. Developers that delay building credible additionality verification risk losing corporate contracts to competitors already certified under stricter emerging procurement standards across most major markets.
Market Impact: India adds 50 gigawatts renewable capacity

Corporate Power Purchase Agreements Displace Green Tariffs

Large corporate buyers increasingly negotiate direct virtual and physical power purchase agreements rather than enrolling in utility-administered green tariff programs, since direct contracts offer more favorable pricing terms and greater control over project selection and additionality verification across most contract categories, jurisdictions, and regulatory frameworks. This consolidation trend pulls procurement decisions toward developers capable of structuring large-scale, customized contracts rather than standardized utility program enrollment that smaller buyers historically relied upon. Developers offering flexible contract structuring increasingly win renewal agreements over competitors providing only standardized utility program participation lacking customization options.
Market Impact: Adds 35 percent corporate PPA volume

Market Opportunities and Growth Drivers

India Expands Corporate Renewable Procurement Access

India's aggressive renewable capacity buildout, combined with an expanding corporate open-access electricity market, continues driving domestic power purchase agreement volume as large manufacturing and technology companies seek verified renewable electricity to meet sustainability commitments. This regulatory and infrastructure development pulls procurement volume directly into Indian corporate buyers rather than solely relying on utility green tariff programs, favoring developers with established local project origination and grid interconnection expertise over global vendors serving India remotely through distributors lacking dedicated technical presence. Domestic corporate buyers increasingly bundle renewable procurement into broader sustainability reporting initiatives, accelerating adoption timelines considerably.
Market Impact: Extends project timelines by 3 years

Corporate Net-Zero Commitments Expand Rapidly Worldwide

Large technology and manufacturing companies continue announcing corporate net-zero commitments requiring verified renewable electricity procurement at scale, and this commitment expansion pulls power purchase agreement demand directly into corporate sustainability budgets rather than solely relying on utility program enrollment that satisfied less ambitious prior commitments. This trend pulls procurement decisions toward large-scale, long-term contracts rather than smaller certificate purchases, expanding the addressable commercial market meaningfully beyond historical utility green tariff program demand patterns. Developers serving these large corporate commitments increasingly prioritize additionality verification over legacy certificate volume specifications that mattered more previously.
Market Impact: Adds 6 to 9 months delay

Market Restraints and Challenges

Grid Interconnection Delays Constrain Project Development

New renewable generation projects increasingly face multi-year grid interconnection queue delays across most major markets, since transmission infrastructure expansion has not kept pace with the surging volume of renewable project applications submitted to grid operators in recent years. The root cause traces to aging transmission infrastructure requiring substantial upgrade investment before it can accommodate additional generation capacity, a problem regulators have been slow to address through faster, simplified permitting reform. Developers are increasingly pursuing co-located storage and grid-enhancing technologies to reduce interconnection complexity and accelerate project timelines despite persistent transmission capacity constraints across most regional grid operators.
Market Impact: Adds 30 percent additionality premium

Additionality Verification Costs Burden Smaller Developers

Rising additionality verification and certification requirements have pushed compliance costs meaningfully higher, and smaller developers without dedicated environmental and legal compliance teams increasingly cannot absorb this cost across a limited project portfolio and revenue scale compared to larger integrated competitors. The root cause lies in expanding voluntary and compliance market standards that require increasingly detailed project-specific documentation rather than generic certificate issuance that satisfied buyers in earlier procurement cycles. Some smaller developers are pursuing shared verification consortium arrangements and third-party certification partnerships to access compliant documentation infrastructure without bearing full certification cost independently.
Market Impact: Cuts procurement cost 25 percent
3 additional market trends, 4 additional growth drivers, and 2 additional restraints and challenges are covered in the full report. Contact sales@marketmindsadvisory.com to access the complete intelligence.

Segment CAGR and Growth Architecture

The Green Power Market segments by procurement instrument type across six categories spanning virtual and physical power purchase agreements, unbundled renewable energy certificates, utility green tariff programs, community solar subscription programs, on-site renewable generation procurement, and green power certification and verification services used across most buyer segments. Power purchase agreements and community solar lead growth across most markets.
Section default visual

Virtual and Physical Power Purchase Agreements

Virtual and physical power purchase agreements let large corporate buyers contract directly with renewable project developers for long-term electricity delivery or financial settlement, addressing corporate net-zero commitments that require verified additionality documentation beyond generic certificate purchases across most industries, sectors, and geographic markets. Demand for this category grows fastest among all six segments, propelled by large technology and manufacturing companies pursuing large-scale, long-term contracts that provide pricing certainty and project-specific verification rather than relying on standardized utility program enrollment. Developers offering mature contract structuring capture disproportionate new agreements versus competitors still relying primarily on generic certificate sales lacking project-specific additionality verification across most corporate customer segments, industries, and geographic markets.
CAGR 15.2%

Community Solar Subscription Programs

Community solar subscription programs let households and small businesses access renewable electricity generated at shared solar installations without installing on-site panels themselves, addressing growing demand from customers unable to pursue direct power purchase agreements at large corporate scale, budget, contract complexity, negotiating capacity, and internal legal or procurement expertise. Growth in this category tracks rising enterprise and household recognition that subscription models avoid utility program administration delays and geographic availability constraints that historically limited renewable electricity access for smaller customers. Developers increasingly bundle transparent additionality documentation directly into subscription agreements, letting customers satisfy sustainability preferences without commissioning separate standalone verification studies across their entire renewable electricity procurement relationship and account lifecycle.
CAGR 13.0%
Full segment breakdown across 6 segments available in the complete report.

Regional Architecture and Country Demand Map

Regional green power demand concentrates where major corporate procurement volume and developer headquarters intersect most heavily, with North America leading on installed base scale today and consistently across most segments, while South Asia and Pacific grows fastest on renewable capacity buildout and corporate open-access market expansion programs.

North America

United States corporate power purchase agreement volume drives the region's leading share, since major technology companies pursuing net-zero commitments continue signing the largest corporate renewable contracts globally, concentrated among data center operators, cloud providers, manufacturing firms, retail chains, financial institutions, and major airlines today. NextEra Energy and other major developers base core project origination and contract structuring operations domestically, capturing revenue recognition even where physical generation occurs across multiple states and regions nationwide. Canadian corporate buyers contribute meaningful additional demand through parallel renewable procurement modernization programs and initiatives. Mature renewable energy certificate trading infrastructure and established grid interconnection processes continue supporting installed base growth across most major markets and industries.
Share: 31% | CAGR: 12.0% (2026 to 2036)

East Asia

China's massive renewable capacity buildout drives substantial regional demand, as domestic manufacturers and technology companies pursue green power procurement to meet expanding sustainability disclosure requirements across most major industrial sectors, export markets, manufacturing zones, coastal provinces, inland regions, free trade areas, and special economic zones today. Japan and South Korea contribute additional demand through advanced corporate sustainability commitments and government renewable energy targets requiring verified procurement documentation. Regional developers increasingly compete on price for standard certificate products while premium international developers retain share in large-scale corporate power purchase agreement segments seeking additionality verification. Regional corporate buyers increasingly adopt hybrid procurement combining domestic renewable capacity with international certification standards and frameworks.
Share: 24% | CAGR: 12.4% (2026 to 2036)
Regional intelligence for 5 additional markets available in the complete report: Western Europe, South Asia and Pacific, Latin America, Middle East and Africa, Eastern Europe. Contact sales@marketmindsadvisory.com.
green-power-market-market-share-analysis-1789980786757

Capturing Value From Additionality Verification

Green power developers can expand margin capture beyond raw electricity sales by pursuing four distinct commercial paths tied to additionality verification depth, large-scale contract structuring, community solar subscription models, and regional support infrastructure built across multiple corporate customer relationships spanning several years, contract renewal cycles, expanding service categories, evolving certification standards, and geographic markets worldwide.

Premium Pricing for Verified Additionality Projects

Developers offering mature, verified additionality documentation can charge premium pricing, typically 20 to 30 percent above generic certificate pricing, since corporate buyers facing sustainability disclosure scrutiny will pay for proven new-generation credentials that legacy certificates cannot guarantee reliably or consistently across most jurisdictions and reporting frameworks. This premium persists until enough competitors achieve comparable verification maturity, typically a two-to-three-year window across most corporate customer segments and market categories. Developers that invest early in verification infrastructure capture outsized margin during this window before broader industry adoption compresses pricing back toward standard levels.
Market Impact: Adds a 20 to 30 percent price premium

Large-Scale Contract Structuring Revenue Growth Model

Developers offering customized, large-scale power purchase agreement structuring capture more predictable, higher-lifetime-value revenue streams that typically lift total contract value by 25 to 35 percent compared to selling standardized certificate volumes without dedicated structuring services included at any point or contract stage, negotiation phase, or renewal cycle whatsoever. This structuring approach also deepens customer dependency on continuous developer contract management and reporting support, reducing churn risk versus customers free to switch developers at each contract renewal without meaningful transition cost or reporting disruption across their sustainability program and disclosure obligations.
Market Impact: Lifts contract value by 25 to 35 percent

Community Solar Subscription Expansion Program Model

Developers offering community solar subscription programs targeting households and small businesses can access a broader customer base exceeding 30 percent above what large-scale corporate contracts alone could reach, since subscription models require far lower minimum commitment than corporate power purchase agreements and structured multi-year contracts negotiated separately by internal legal teams, procurement departments, and outside counsel. This service captures added value from customers unable to pursue direct corporate-scale contracts, while strengthening developer relationships as subscribers become dependent on continued renewable generation access across multiple billing cycles, renewal periods, and referral programs.
Market Impact: Adds over 30 percent subscriber base growth overall

Regional Verification Service Partnership Program Model

Developers increasingly support regional third-party verification partnerships that let smaller corporate buyers access certified additionality documentation through shared cost arrangements rather than commissioning independent studies, generating recurring verification fee revenue exceeding 25 percent above what any single smaller buyer could justify commissioning independently on its own limited annual budget alone without partnerships, shared resources, external funding, or formal consortium support entirely. This shared verification model lets budget-constrained buyers access enterprise-grade certification capability without full independent study investment, while developers capture broader customer relationships and support revenue across multiple regional partners.
Market Impact: Adds over 25 percent verification fee revenue overall

Who Controls the Margin Pool

Market concentration sits at 38 percent among the top five developers measured by contracted capacity and procurement revenue, and NextEra Energy holds a meaningful lead over its closest challenger, Ørsted, in large-scale corporate power purchase agreement volume. The gap between the leader and the next challenger remains moderate given how fragmented project development activity remains across dozens of regional utilities and independent developers. Below the top five, dozens of specialized developers compete on additionality verification depth rather than raw project scale.
Current competitive activity centers on additionality verification quality, large-scale contract structuring depth, and community solar subscription offerings that increasingly determine corporate buyer selection more than raw certificate price alone. Iberdrola and EDP Renováveis have both announced expanded verification capability this year to compete against independent procurement platforms, while ENGIE continues deepening its community solar subscription program offerings aimed at smaller commercial and residential customers.

Emerging pressure comes from independent procurement platforms winning corporate contracts faster than utility-affiliated incumbents expected, threatening to compress margins across standard certificate categories first. Rankings could shift meaningfully if a procurement platform secures broad adoption across multiple hyperscale corporate customers simultaneously, validating a verification-first model that reduces buyer dependency on any single developer's project portfolio.
green-power-market-country-cagr-analysis-1789980787296

Competitive Moat and Risk Dimensions

NEXTERA ENERGY INC

Moat: Largest United States project pipeline

NextEra Energy operates the largest renewable project development pipeline in the United States, letting it offer corporate buyers access to a wide selection of project sites and technology types that smaller developers with limited pipelines cannot match. This scale advantage lets NextEra structure large, complex multi-project contracts that satisfy sophisticated corporate sustainability requirements.
NEXTERA ENERGY INC

Risk: Interconnection queue delays constrain growth

NextEra faces mounting grid interconnection queue delays across several key development regions that could slow project delivery timelines and delay revenue recognition on signed corporate contracts. Continued transmission infrastructure constraints could pressure NextEra to renegotiate delivery timelines with corporate buyers expecting contracted capacity within specific commitment windows.
ØRSTED A/S

Moat: Deep offshore wind development expertise

Ørsted brings specialized offshore wind development expertise accumulated over decades that few competitors can replicate quickly, letting it win large-scale European corporate contracts requiring offshore project capacity unavailable from onshore-focused developers. This technical expertise commands premium pricing for corporate buyers seeking offshore project diversification and long-term supply reliability.
ØRSTED A/S

Risk: Offshore cost overruns pressure margins

Ørsted has faced significant cost overruns and project delays on several major offshore wind developments in recent years, pressuring overall margins and raising questions among corporate buyers about delivery reliability. Continued execution challenges could push cautious buyers toward competitors offering more predictable onshore project timelines.

Players Tracked

Prominent Players

NextEra Energy Inc
Ørsted A/S
Iberdrola SA
EDP Renováveis SA
ENGIE SA

Other Key Players

Enel Green Power SpA
RWE Renewables GmbH
AES Corporation
Invenergy LLC
Pattern Energy Group Inc
Clearway Energy Inc
ACCIONA Energía SA
Vattenfall AB
EDF Renewables
CleanChoice Energy Inc
Arcadia Power Inc
3Degrees Group Inc
LevelTen Energy Inc
EnergyHub Inc
Renewable Choice Energy LLC

Recent Developments

JANUARY 2026

NextEra Energy announced expanded additionality verification capabilities integrated directly into its corporate power purchase agreement contracting process, targeting improved sustainability disclosure documentation for large technology and manufacturing customers worldwide. The update includes new third-party audit partnerships and standardized reporting templates for corporate buyers and stakeholders.
Signal: Confirms additionality verification as the primary competitive differentiator among leading developers today, consistently, reliably, and predictably.
OCTOBER 2025

Iberdrola completed a multi-year power purchase agreement with a major European technology company to supply verified renewable electricity across several countries supporting expanding data center operations and growing cloud infrastructure demand. The agreement includes ongoing sustainability reporting and additionality certification maintenance services across multiple regions.
Signal: Reflects continued developer expansion into large technology sector corporate procurement contracts and long-term strategic global partnerships.
MAY 2025

ENGIE launched an expanded version of its community solar subscription platform supporting simplified enrollment for households and small businesses across multiple regulatory jurisdictions simultaneously and continuously worldwide. The launch targets customers seeking reduced administrative burden ahead of expanding subscription program availability across several major markets.
Signal: Signals accelerating developer investment in subscription models targeting previously underserved smaller customer segments and regional markets.

Project Development and Interconnection Cost Exposure

Project development labor and grid interconnection infrastructure together represent roughly 46 percent of developer cost of goods sold, sourced primarily from specialized engineering firms based across North America and Europe, alongside solar panel and wind turbine components purchased from manufacturers concentrated in East Asia. Legal and certification services for additionality verification add further meaningful cost exposure for compliance-focused project categories.
Solar panel and wind turbine component costs spiked sharply during 2021 and 2022 as global supply chain disruption and rising raw material prices affected renewable equipment manufacturers simultaneously, according to IEA reporting on clean energy technology costs published during that period. Several developers reported delayed project timelines and compressed margins as they absorbed higher equipment costs rather than passing them fully through to corporate buyers under existing fixed-price power purchase agreements negotiated earlier.

Smaller developers without long-term equipment supply agreements face proportionally larger cost exposure than vertically integrated majors like NextEra Energy and Ørsted, which negotiate volume-based pricing directly with panel and turbine manufacturers. Developers operating primarily in regions with weaker currencies also face amplified dollar-denominated equipment costs, widening the competitive cost gap against developers with diversified global manufacturing and procurement footprints.
green-power-market-company-positioning-matrix-1789980787493

Negotiate Multi-Year Equipment Supply Contracts

Locking multi-year solar panel and wind turbine supply contracts at fixed or partially hedged pricing protects developers against spot market volatility that has repeatedly compressed margins during recent supply chain disruptions. This pricing certainty lets finance teams plan project development budgets several years ahead with materially reduced exposure to sudden equipment cost swings tied to broader clean energy technology demand.

Diversify Component Manufacturing Sourcing Regionally

Sourcing solar panels and wind turbine components from multiple regional manufacturers rather than a single concentrated source reduces exposure to localized supply disruption or regional pricing spikes tied to trade policy shifts and export restrictions. This diversification strategy adds modest logistics complexity but meaningfully reduces single-supplier dependency risk across the renewable project development supply chain overall.

Build Shared Verification Infrastructure Across Projects

Developers increasingly build shared additionality verification frameworks and documentation templates that serve multiple project categories simultaneously, reducing per-project certification cost by amortizing verification investment across a broader project portfolio and customer base overall today. This design shift lowers marginal cost for each additional certified project while accelerating time to market for new corporate contracts.

Portfolio Architecture for Margin Defence

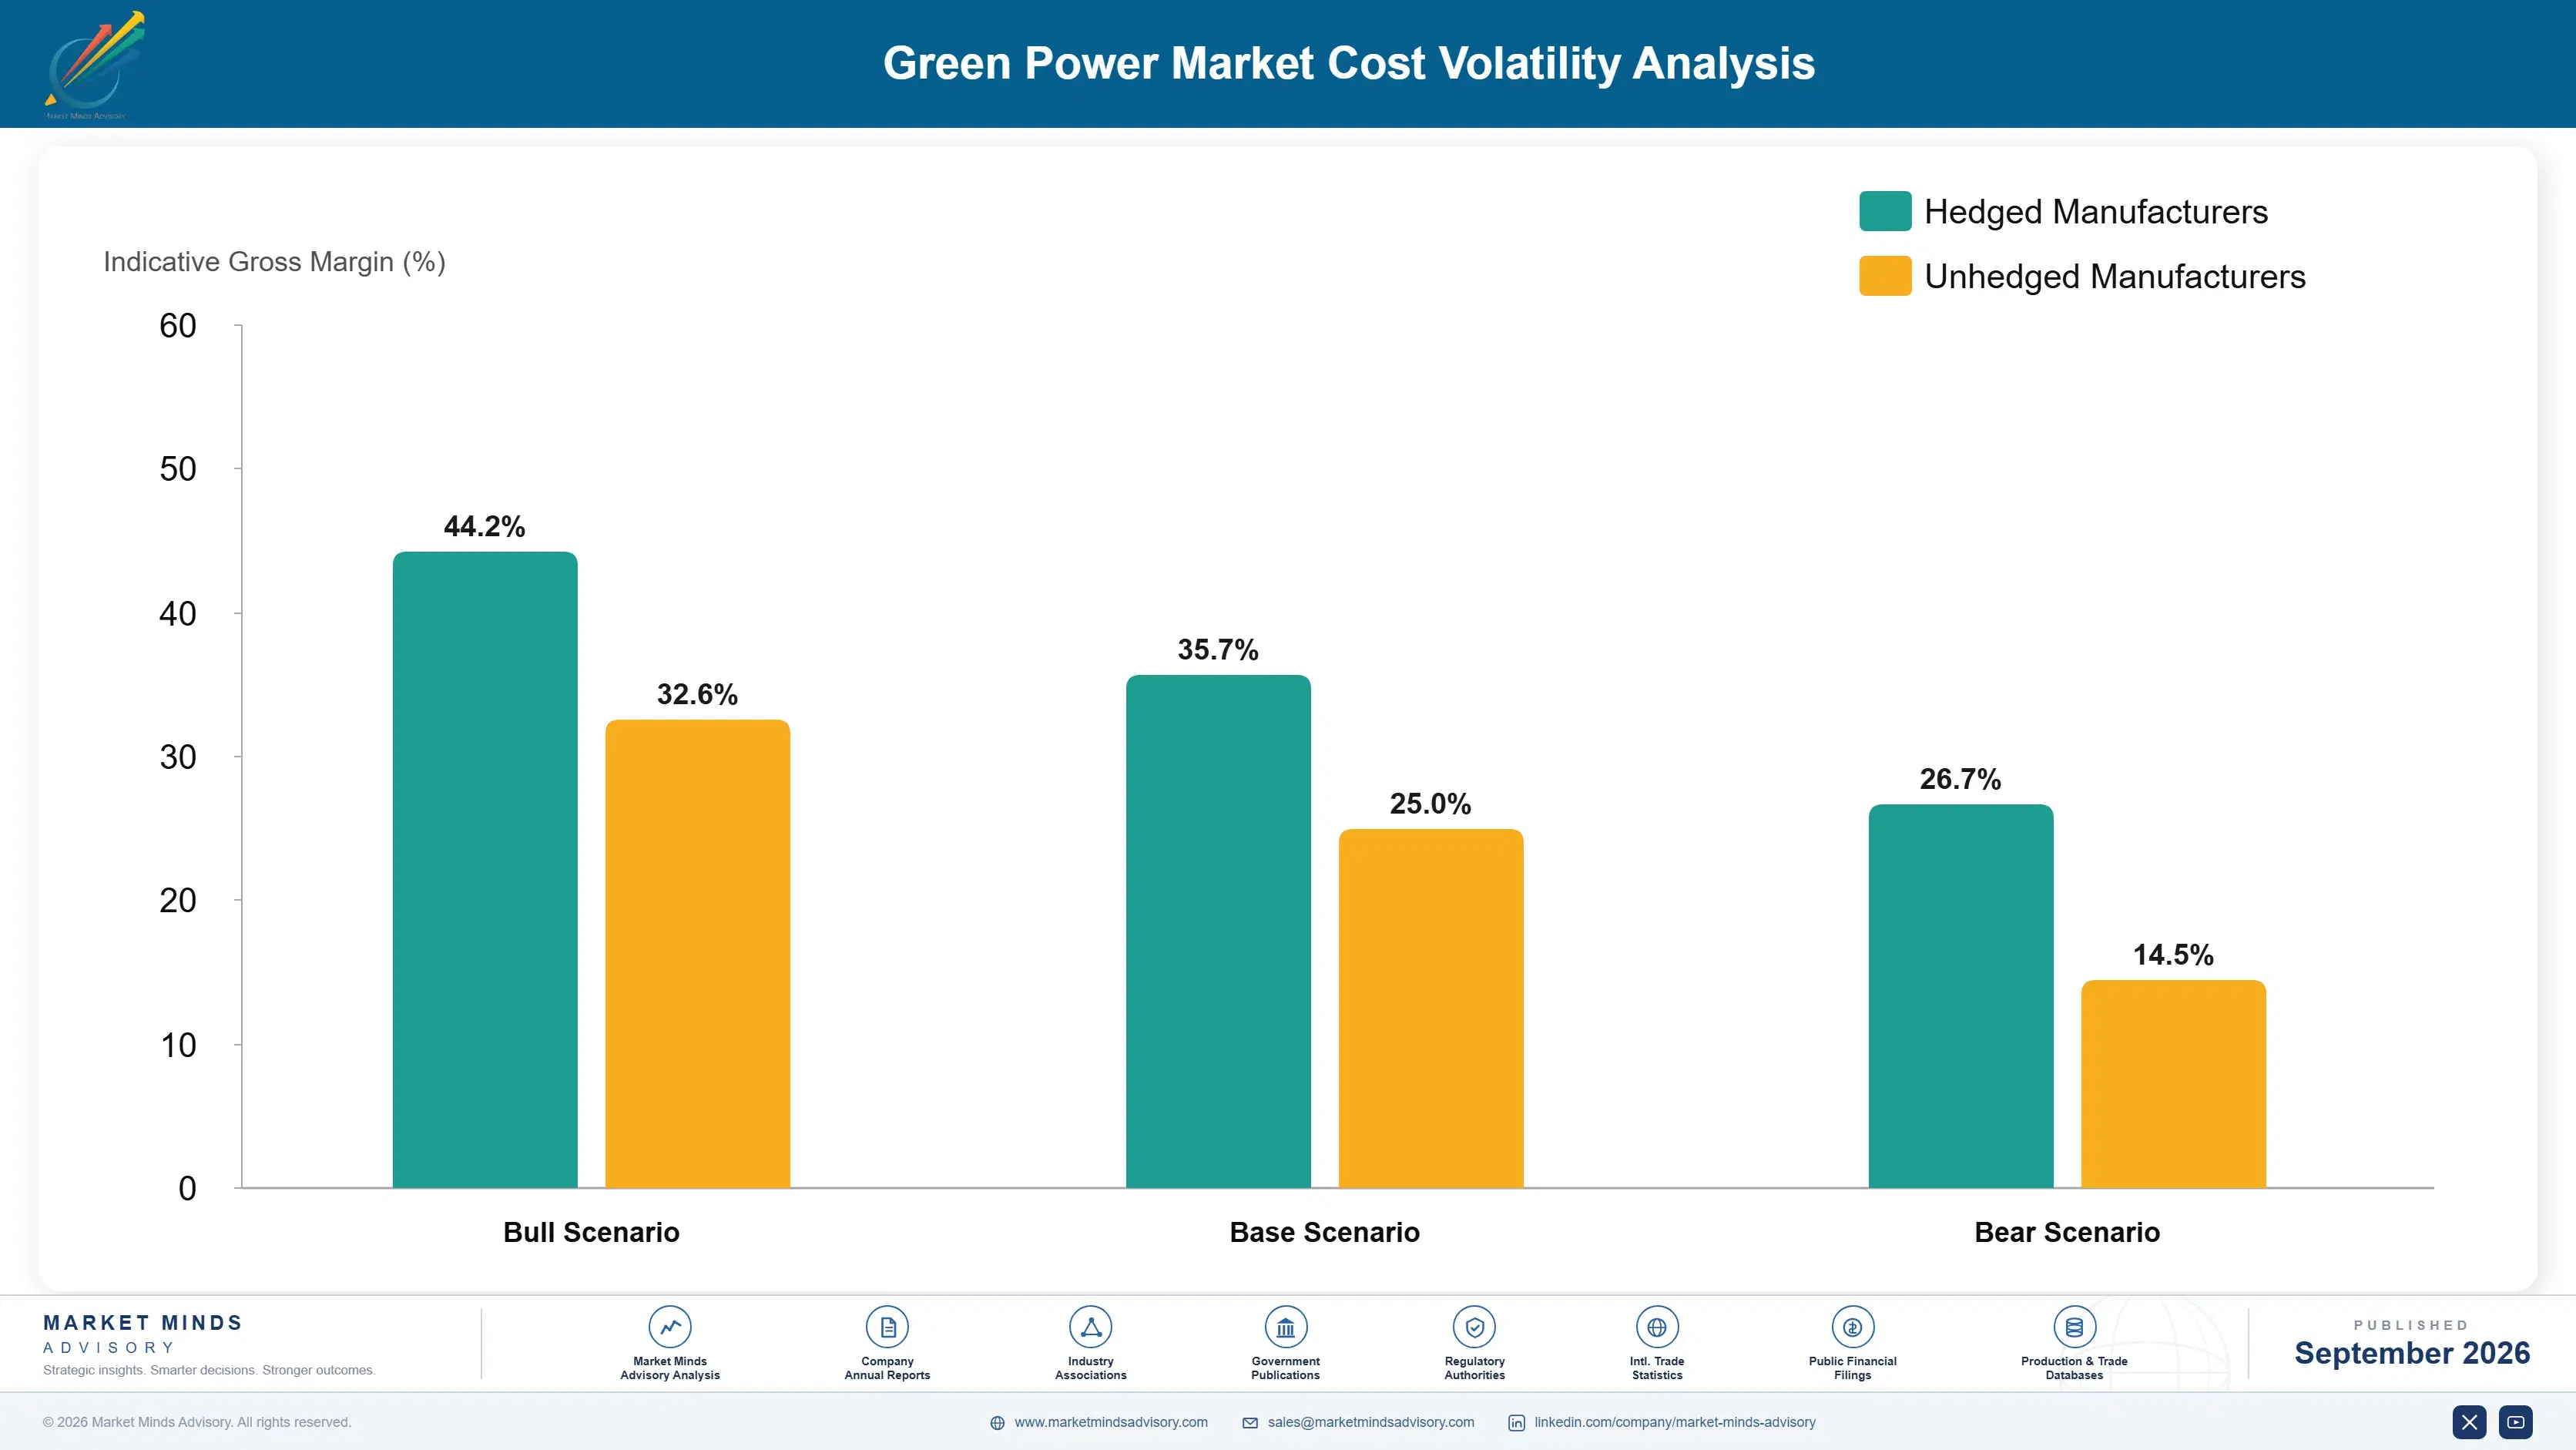
Developer economics split into three tiers by verification sophistication and contract structuring depth across most product categories offered today. Volume-tier standard renewable energy certificates carry gross margins around 26 to 34 percent, while premium verified power purchase agreements reach 42 to 50 percent margins consistently. Community solar and next-generation subscription models command the widest margin range given the recurring revenue barriers protecting early movers from immediate competitive pressure.
Tension between volume and premium tiers centers on capital allocation: developers must decide how much verification and contract structuring investment to commit toward premium large corporate customers versus maintaining broad standard certificate sales serving budget-constrained smaller buyers. Most large developers now prioritize verification and structuring investment, accepting narrower standard certificate margins to secure future long-term contract position across upcoming corporate procurement cycles.

High-value margin pools concentrate overwhelmingly in verified power purchase agreements and community solar subscription platforms, where technical and regulatory barriers protect early movers from immediate price competition across most corporate customer segments and geographic markets. Standard renewable energy certificates increasingly commoditize as more developers, including regional providers, achieve comparable baseline generation capacity, compressing margins toward the lower end of the volume tier band across most established global markets.

Standard renewable energy certificates serving budget-constrained smaller buyers and utility green tariff enrollees, priced primarily on transaction volume and baseline generation capacity rather than verification depth, contract customization, or structuring services.
Gross Margin: 26-34%

Verified power purchase agreements meeting corporate sustainability disclosure requirements, commanding pricing power from additionality certification and contract structuring depth competitors cannot easily replicate quickly across comparable customer segments and jurisdictions.
Gross Margin: 42-50%

Community solar and next-generation subscription models addressing accessible renewable procurement for smaller customers, where technical barriers and subscription infrastructure maturity drive the widest margin variance across developers and deployment types today.
Gross Margin: 30-55%
green-power-market-cost-volatility-analysis-1789980788018

High-value Sub-segments and Strategic Watch-out

Virtual and Physical Power Purchase Agreements

Growing fastest among all six segments as corporate net-zero commitments expand rapidly worldwide, commanding premium pricing and durable additionality barriers that protect early movers from immediate competitive price pressure across most corporate segments, geographic markets, industry categories, buyer types, procurement channels, and regulatory jurisdictions today.

Community Solar Subscription Programs

Accessible renewable procurement demand drives strong secondary growth here, though moderate near-term margin pressure reflects intensifying competition among developers racing to standardize subscription enrollment processes across next-generation program architectures, customer categories, geographic markets, pricing tiers, support structures, billing platforms, vendor networks, and licensing terms worldwide.

Unbundled Renewable Energy Certificates

The largest volume segment by transaction count, providing steady baseline revenue at comparatively thin margins as commoditization intensifies further with growing regional developer competition entering global supply chains, certificate registries, and buyer procurement decisions consistently and predictably over multiple budget years and contract renewal cycles.

Legacy Utility Green Tariff Programs

A strategic watch-out segment facing sustained pricing pressure as direct power purchase agreements steadily displace utility program enrollment, risking margin erosion for developers slow to redirect focus toward higher-value verification and structuring categories instead of legacy certificate sales entirely, permanently, and irreversibly across most regional markets.

Long-Term Contracts Anchor Recurring Developer Revenue

Developer relationships operate on annuity-like economics once a corporate buyer signs a long-term power purchase agreement, since contracted electricity delivery generates predictable revenue across a ten-to-twenty-year term that hardware or one-time transaction sales cannot replicate. A typical corporate contract generates recurring revenue across a multi-decade project lifecycle, with contract renewal and capacity expansion options extending the relationship well beyond initial project commissioning and delivery start.
Adoption stickiness varies meaningfully by end-use vertical: large corporate buyers show the deepest stickiness given long-term contract structures and sustainability reporting commitments tied to specific certified renewable projects, while smaller commercial buyers show comparatively higher churn as generic certificate purchases commoditize faster. Government and institutional buyers show extremely high stickiness tied to procurement certification and multi-year budget cycles that discourage frequent contract renegotiation.

Buyer profiles are shifting generationally as procurement authority moves from traditional facilities management teams toward dedicated sustainability officers who prioritize verified additionality and carbon accounting accuracy over pure cost savings alone across most corporate segments. Younger sustainability leaders increasingly favor developers offering transparent, audit-ready certification documentation over developers competing purely on certificate price and legacy installed generation capacity.
Section default visual

Where Green Power Value Concentrates

These are among the four positions where our research anticipates prominent divergence between winners and laggards over the coming forecast period. Each is grounded in the demand model, the regulatory perimeter, and the announced capacity pipeline.
01 / ADDITIONALITY PREMIUM POSITIONING

Prioritize new-build capacity over legacy certificate resale

Buyers increasingly demand proof that a purchase financed new renewable capacity rather than simply relabeling existing generation already connected to the grid years earlier. Developers and traders who anchor volume in virtual and physical power purchase agreements capture the widening additionality premium before disclosure rules make it a baseline expectation across every major buyer jurisdiction. Firms still leaning heavily on unbundled certificate resale should reposition their commercial strategy well before margin compression erodes their broader relevance across corporate and institutional procurement channels.
02 / REGIONAL CAPACITY ALLOCATION

Weight new project pipelines toward India and East Asia

India's manufacturing electrification drive and East Asia's expanding corporate offtake programs are absorbing new renewable capacity faster than any other region tracked across this analysis, aided by falling technology costs and supportive grid interconnection policy. Developers with flexible project pipelines should shift capital allocation toward these corridors rather than defaulting reflexively toward mature Western markets already approaching saturation on easily permitted sites. Waiting for greater policy certainty elsewhere risks ceding the fastest-growing contracted volume in this report to regional incumbents that are already scaling aggressively and locking in land.
03 / VERIFICATION INFRASTRUCTURE INVESTMENT

Fund tracking and verification systems ahead of mandates

Regulatory scrutiny of double-counting and certificate integrity is rising steadily across every major buyer jurisdiction this report tracks, from Europe's disclosure rules to emerging Asian frameworks now under active legislative development. Companies that invest early in granular tracking, blockchain-based registries, or independent third-party verification will clear compliance thresholds that slower competitors will scramble to meet later at considerably greater expense. This positioning also supports premium pricing, since buyers increasingly pay more for procurement volume they can defend confidently to auditors, regulators, and their own boards.
04 / CONTRACT PORTFOLIO DIVERSIFICATION

Balance utility tariff exposure against direct contracting growth

Legacy utility green tariff programs still generate reliable transaction volume, but direct power purchase agreements are steadily capturing share from corporate buyers seeking cost certainty and additionality credit at once, particularly across technology and manufacturing sectors. Players overweighted in utility-administered programs face gradual margin and volume erosion as sophisticated buyers migrate toward structured bilateral contracts negotiated directly with developers. A deliberate shift toward blended portfolios, anchored by long-term contracts and verified additionality, protects revenue durability as buyer preferences continue moving decisively toward direct engagement.

Engagement Snapshot From the Field

A live engagement with an industry participant carrying material or product regulatory and market exposure ahead of a defining policy shift, showing how our research translates into a defensible multi-year portfolio strategy.
MARKET MINDS ADVISORY · CLIENT ENGAGEMENT SUMMARY
Green Power Producer Strategic Portfolio Review and Transition Roadmap 2026·Investment Scenario on Green Power Exposure Evaluation 2025-26
CLIENT PROFILE
The client is a global technology hardware manufacturer with data center and assembly operations spanning twelve countries, generating annual revenue exceeding 40 billion dollars (client-reported, unverified by MMA). Its sustainability office had committed publicly to matching 100 percent of operational electricity consumption with renewable procurement by 2030, but lacked a coherent framework for balancing certificate cost, additionality credibility, and long-term contract exposure across its fragmented regional footprint.
STRATEGIC CHALLENGE
Existing procurement relied heavily on unbundled certificates purchased opportunistically by regional facility managers, producing inconsistent additionality claims and exposing the company to reputational risk as auditors began questioning certificate provenance. Leadership needed a unified global sourcing strategy that balanced cost discipline against credible, defensible decarbonization claims ahead of upcoming disclosure requirements in Europe and California.
MMA APPROACH
MMA's team conducted a facility-by-facility procurement audit, benchmarked contract structures against 47 expert interviews and primary survey data, and modeled long-term power purchase agreement economics against three regional pricing scenarios. The engagement combined proprietary segmentation data with company-specific consumption profiles to prioritize markets where new capacity additions offered the strongest additionality and cost outcomes.
KEY FINDINGS
  1. Roughly 60 percent of the client's certificate spend (client-reported, unverified by MMA) financed no new generation capacity whatsoever, undermining its public additionality claims.
  2. Facilities in India and Southeast Asia offered materially better long-term contract pricing than comparable European sites, reversing the company's prior regional allocation assumptions.
  3. Fragmented regional purchasing authority created duplicate vendor relationships and prevented the company from securing volume-based pricing discounts available to larger consolidated buyers.
  4. Disclosure-grade tracking systems were absent at nine of twelve facilities, creating material audit exposure ahead of pending European corporate sustainability reporting mandates.
CLIENT PROFILE
The client is a global technology hardware manufacturer with data center and assembly operations spanning twelve countries, generating annual revenue exceeding 40 billion dollars (client-reported, unverified by MMA). Its sustainability office had committed publicly to matching 100 percent of operational electricity consumption with renewable procurement by 2030, but lacked a coherent framework for balancing certificate cost, additionality credibility, and long-term contract exposure across its fragmented regional footprint.
STRATEGIC CHALLENGE
Existing procurement relied heavily on unbundled certificates purchased opportunistically by regional facility managers, producing inconsistent additionality claims and exposing the company to reputational risk as auditors began questioning certificate provenance. Leadership needed a unified global sourcing strategy that balanced cost discipline against credible, defensible decarbonization claims ahead of upcoming disclosure requirements in Europe and California.
MMA APPROACH
MMA's team conducted a facility-by-facility procurement audit, benchmarked contract structures against 47 expert interviews and primary survey data, and modeled long-term power purchase agreement economics against three regional pricing scenarios. The engagement combined proprietary segmentation data with company-specific consumption profiles to prioritize markets where new capacity additions offered the strongest additionality and cost outcomes.
KEY FINDINGS
  1. Roughly 60 percent of the client's certificate spend (client-reported, unverified by MMA) financed no new generation capacity whatsoever, undermining its public additionality claims.
  2. Facilities in India and Southeast Asia offered materially better long-term contract pricing than comparable European sites, reversing the company's prior regional allocation assumptions.
  3. Fragmented regional purchasing authority created duplicate vendor relationships and prevented the company from securing volume-based pricing discounts available to larger consolidated buyers.
  4. Disclosure-grade tracking systems were absent at nine of twelve facilities, creating material audit exposure ahead of pending European corporate sustainability reporting mandates.
RECOMMENDED STRATEGY
Phase 1: Phase one consolidated global procurement authority under a single sustainability office, replacing fragmented regional purchasing with centralized contract negotiation and vendor selection. Phase 2: Phase two shifted roughly 45 percent of certificate volume toward long-term power purchase agreements in India and Southeast Asia over an eighteen-month window. Phase 3: Phase three implemented facility-level tracking and independent third-party verification systems across all twelve sites ahead of pending European disclosure deadlines.
OUTCOME
Within fourteen months, the client reported a 22 percent reduction in blended procurement cost per megawatt-hour alongside a verified increase in additionality-backed volume from 40 to 78 percent of total consumption (client-reported, unverified by MMA). The consolidated framework also positioned the sustainability office to respond confidently to incoming disclosure audits.

Frequently Asked Questions

Foundational context covering the market sizes, CAGR, scope, country, region and competition that inform every finding below. This section is provided to cover basics and most often pre-purchase conversations, answered from the MMA Primary Research Dataset.

What is the current size of the Green Power Market?

The Green Power Market was valued at 45.0 billion dollars in 2025. Demand is driven by corporate net-zero commitments and utility-scale renewable capacity additions across major buyer regions worldwide.

How large will the Green Power Market be by 2036?

MMA projects the market will reach 147.55 billion dollars by 2036, up from 50.13 billion dollars in 2026. That reflects a near threefold expansion driven by long-term contracting and additionality-focused procurement.

What is the CAGR for the Green Power Market 2026 to 2036?

The base case CAGR is 11.4 percent, with a bull case of 12.7 percent and a bear case of 10.1 percent. Historical growth from 2020 to 2025 ran somewhat slower at 10.2 percent.

Which segment is growing fastest?

Virtual and physical power purchase agreements lead at a 15.2 percent CAGR, roughly 1.33 times the overall market rate. Buyers favor this segment for its additionality credibility and long-term price certainty.

Who are the major companies in the Green Power Market?

NextEra Energy, Ørsted, Iberdrola, EDP Renováveis, and ENGIE lead the field. Combined, the top five players hold an estimated 38 percent share on a generation capacity basis.

Which country is growing fastest?

India leads at a projected 14.2 percent CAGR, fueled by manufacturing electrification and expanding corporate renewable procurement mandates. That pace outstrips every other major national market tracked in this report.

Report Segmentation Architecture

The full report scope spans multiple orthogonal segmentation dimensions, with cross-tabulated demand data provided for each dimension pair. Coverage extends further to regional breakdowns, trend trajectories, and the competitive detail needed to support segment-level decision-making.

By Product Type

    By End-Use Industry

      By Commercial Dimension

        By Region

        • North America
        • East Asia
        • Western Europe
        • South Asia and Pacific
        • Latin America
        • Middle East and Africa
        • Eastern Europe

        Scope, Methodology, and Coverage

        Every figure in this report is reproducible from documented input assumptions. The scope below maps the historical period, the forecast horizon, the segmentation dimensions, and the countries covered, alongside the underlying primary and qualitative methodology.
        Historical Period
        2020 to 2025
        Forecast Period
        2026 to 2036
        Base Year
        2025 (USD billions; MMA Primary Research Dataset, September 2026)
        Market Definition
        The Green Power Market covers renewable electricity procurement instruments, including power purchase agreements, unbundled renewable energy certificates, community solar subscriptions, and utility green tariff programs, purchased by corporate, institutional, and residential buyers. It excludes on-site generation equipment sales, grid infrastructure hardware, and carbon offset instruments unrelated to electricity procurement.
        Quantitative Units
        USD Billion
        Segmentation Dimensions
        Product type, end-use industry, commercial dimension, and region
        Regions Covered
        North America, East Asia, Western Europe, South Asia and Pacific, Latin America, Middle East and Africa, Eastern Europe
        Countries Covered
        United States, Germany, United Kingdom, China, Japan, India, Brazil, and 24 additional markets across seven global regions
        Key Companies Profiled
        NextEra Energy Inc, Ørsted A/S, Iberdrola SA, EDP Renováveis SA, ENGIE SA, Enel Green Power SpA, RWE Renewables GmbH, AES Corporation, Invenergy LLC, Pattern Energy Group Inc, Clearway Energy Inc, ACCIONA Energía SA, Vattenfall AB, EDF Renewables, CleanChoice Energy Inc, Arcadia Power Inc, 3Degrees Group Inc, LevelTen Energy Inc, EnergyHub Inc, Renewable Choice Energy LLC
        Quantitative Methodology
        Primary survey, n=3,800 respondents, Q4 2025, six countries; demand-side model with trade association cross-validation
        Qualitative Methodology
        47 expert interviews, Q4 2025; applied to validate demand model assumptions, identify emerging dynamics, and assess competitive positioning
        Report Format
        PDF and XLSX data workbook (Word format preview document)
        Publisher
        Market Minds Advisory
        Report Code
        MMA-2026-ENE-248
        Published
        September 2026
        Contact
        sales@marketmindsadvisory.com | www.marketmindsadvisory.com

        Purchase the full Green Power Market Report (2026 to 2036).

        This report delivers a complete strategic assessment of the Green Power Market from 2026 through 2036, covering procurement instruments spanning power purchase agreements, unbundled certificates, and utility tariff programs. It combines primary survey data from 3,800 respondents across six countries with 47 expert interviews to quantify segment growth, regional demand, and competitive positioning. Analysts examine additionality verification, long-term contract structuring, and input cost exposure across every major corporate and institutional buyer category tracked in this analysis. The report also includes a client engagement case study and a strategic verdict outlining exactly where commercial value concentrates through the ten-year forecast period.
        Ten-year forecast with bull and bear scenarios
        Segment-level growth rates and CAGR multiples
        All seven regional markets sized and profiled
        Competitive benchmarking of twenty named players
        Input cost exposure and mitigation pathway analysis
        Anonymized client case study with strategic recommendations

        Built For The People Who Decide

        From boardroom strategy to bench-side execution, this report is read cover-to-cover by leaders shaping the next decade of their industry, turning demand scenarios, market dynamics and valuation benchmarks into decisions.
        CXOs/ Presidents/ VPs/ Managers
        M&A and Corporate Development
        Strategy Teams and R&D Heads
        Procurement and Product Directors
        Regulatory and Compliance Leaders
        Investor Relations and Equity Analysts